esg factors in corporate valuation - 公益社団法人 ...€¦ · issued its report entitled...
TRANSCRIPT
EESSGG FFaaccttoorrss iinn CCoorrppoorraattee VVaalluuaattiioonn
June 2010
Summary Version
Working Group on ESG Factors in
Corporate Valuation
The Securities Analysts Association of Japan

The Securities Analysts Association of Japan
1 | ©2010 SAAJ
ESG Factors in Corporate Valuation Summary Version
In April 2009, the Securities Analysts Association of Japan (SAAJ) established “Working Group on ESG Factors in Corporate Valuation”, chaired by Mr. Hiroshi Miyai, CMA, Managing Director, Nikko Financial Intelligence, in order to study corporate valuation methodology explicitly incorporating ESG (environmental, social, and governance) factors. The Working Group met nine times for discussions and issued its report entitled “ESG Factors in Corporate Valuation” on 16 June 2010.
This is an English translation of the summary of the report: a brief summary of Chapter 1 and 2; a most part of Chapter 3; and Appendix 2 – the results of a survey on ESG factors to holders of the CMA designation (CMA: Chartered Member of SAAJ).
Table of Contents of the Original Full Version
Preface 1. Introduction 2. ESG Factors and Investment Performance 3. Outline of this Report Chapter 1 Awareness Survey on ESG Factors to Financial Analysts in Japan 1. Background and Outline of the Survey 2. Summary of the Survey Results 3. Eight Key Findings Chapter 2 Analysis of the Relationship between ESG Factors and Corporate Performance 1. Preamble 2. Analysis of CSP and CFP 3. Event Study on Greenhouse Gas Emissions 4. Summary of the Analysis Chapter 3 Consideration and Challenges 1. ESG Issues for Corporations 2. Challenges in Using CSP Information and Methods of Improvement 3. Incorporating ESG Factors to Investment Process 4. Further Analysis of the Relationship between CSP and CFP 5. Providing ESG Information to Financial Analysts Appendix 1:Questionnaire Form for the Awareness Survey on ESG Factors in Corporate Valuation Appendix 2:Results of the ESG Factors Awareness Survey Authors of the Report
The full version issued in June 2010 is available in Japanese on the SAAJ website (http://www.saa.or.jp/account/account/esg.html).

The Securities Analysts Association of Japan
©2010 SAAJ | 2
In Chapter 1 we analyzed the results of the survey on ESG factors to holders of the CMA designation (CMA: Chartered Member of the Securities Analysts Association of Japan). We assessed to what extent financial analysts in Japan understand ESG factors and explored future directions for corporate valuation. In Chapter 2, we conducted an analysis of the relationship between actual ESG scores and corporate performance. Through such study, we examined methodologies to analyze the relationship between corporate performance in the light of ESG factors (such as ESG/CSR rankings), so-called corporate social performance (CSP), and performance from the standpoint of financial ratios and stock prices, so-called corporate financial performance (CFP). Finally, Chapter 3 discusses issues to be considered when using CSP information and methods of improvement, and also challenges and measures for financial analysts to evaluate sustainable corporate value based on the results of Chapter 1 and 2.
Chapter 1 – Awareness Survey on ESG Factors to Financial Analysts in Japan
In late October 2009, we conducted an awareness survey on ESG factors in corporate valuation. Among e-mail address registered 17,086 chartered members who received the survey, 3.5% or 599 members responded. There is a possibility that those who have a higher interest in ESG issues responded to the survey and so the results may reflect such bias. For detailed results of the survey, see Appendix 2.
Overview of the Survey
Method: Online via website Subjects: 17,086 SAAJ’s chartered members (holders of the CMA designation) whose e-mail
addresses have been registered with SAAJ Period: 28 October - 9 November, 2009 Number of responses: 599 (among which 236 or 39.4% are those who are engaged in corporate valuation)
Chapter 2 – Analysis of the Relationship between ESG Factors and Corporate Performance1
The Working Group believes that market efficiency can be enhanced by encouraging financial analysts to pay attention not only to conventional financial factors but also to non-financial factors such as environmental, social, and governance (ESG) criteria and thereby evaluating true corporate value. Thus, we conducted a statistical analysis of the relationship between corporate social performance (CSP) and corporate financial performance (CFP).
As for CFP, we adopted financial ratios such as ROA, labor productivity, and labor share, which were computed for listed companies using financial data in documents such as corporate annual reports, and also other parameters such as equity return and volatility. As for CSP, we used “overall”, “environmental”, “social”, “governance”, and “social and governance” scores2 from “The Japan Research Institute’s ESG Score” (“JRI Score”).
1 Chapter 2 is to report the content of the study and analysis conducted by the Japan Research Institute, Limited (JRI) as a part of their research “Trends in CSR Management at Japanese Businesses” with their permission. JRI chooses “Select Group” as a group of CSR-advanced companies, generally considering the results of JRI’s survey, interviews, and analysis of non survey-responding companies. The target of the analysis in this chapter is a group of companies which responded to the JRI survey and so different from such “Select Group”. 2 Scores are given based on responses to the JRI survey. Survey questionnaire is comprised of two parts, “Environmental” and “Social and Governance.” Chapters of each part are revised as appropriate. For example, the 2009 survey questionnaire was comprised of the following chapters. The “Environmental” part: 1. Environmental Communication; 2. Environmental Management System; 3. Environmental Performance; 4. Environmental Measures from the Standpoint of Supply Chain Management; 5. Biodiversity; and 6. Environmental Measures as Business Opportunities. The “Social and Governance” part: 1. Corporate Governance; 2. Fair Economic Transaction; 3. Integrity in Customer Service; 4. Labor Practices; 5. Work-Life Balance Support; 6. Appropriate Approach to Global Market; 7. Active Involvement in Social Activities; and 8. Business Contributing to Solving Social Issues. Questions are reviewed and revised annually to fully cover current social issues. Survey results are available on the JRI website (http://www.jri.co.jp/column/study/detail/4878/).
The Securities Analysts Association of Japan
3 | ©2010 SAAJ
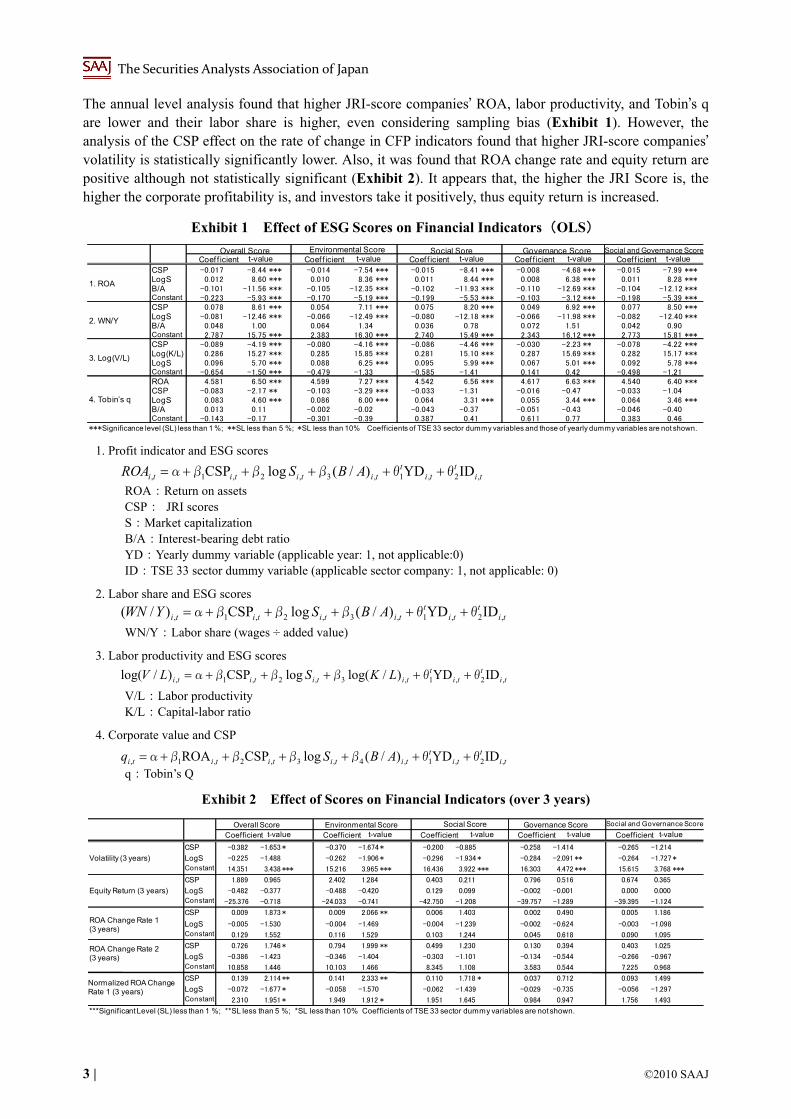
The annual level analysis found that higher JRI-score companies’ ROA, labor productivity, and Tobin’s q are lower and their labor share is higher, even considering sampling bias (Exhibit 1). However, the analysis of the CSP effect on the rate of change in CFP indicators found that higher JRI-score companies’ volatility is statistically significantly lower. Also, it was found that ROA change rate and equity return are positive although not statistically significant (Exhibit 2). It appears that, the higher the JRI Score is, the higher the corporate profitability is, and investors take it positively, thus equity return is increased.
Exhibit 1 Effect of ESG Scores on Financial Indicators(OLS)
Coef f icient t-value Coef f icient t-value Coef f icient t-value Coef f icient t-value Coef f icient t-valueCSP -0.017 -8.44 *** -0.014 -7.54 *** -0.015 -8.41 *** -0.008 -4.68 *** -0.015 -7.99 ***LogS 0.012 8.60 *** 0.010 8.36 *** 0.011 8.44 *** 0.008 6.38 *** 0.011 8.28 ***B/A -0.101 -11.56 *** -0.105 -12.35 *** -0.102 -11.93 *** -0.110 -12.69 *** -0.104 -12.12 ***Constant -0.223 -5.93 *** -0.170 -5.19 *** -0.199 -5.53 *** -0.103 -3.12 *** -0.198 -5.39 ***CSP 0.078 8.61 *** 0.054 7.11 *** 0.075 8.20 *** 0.049 6.92 *** 0.077 8.50 ***LogS -0.081 -12.46 *** -0.066 -12.49 *** -0.080 -12.18 *** -0.066 -11.98 *** -0.082 -12.40 ***B/A 0.048 1.00 0.064 1.34 0.036 0.78 0.072 1.51 0.042 0.90Constant 2.787 15.75 *** 2.383 16.30 *** 2.740 15.49 *** 2.343 16.12 *** 2.773 15.81 ***CSP -0.089 -4.19 *** -0.080 -4.16 *** -0.086 -4.46 *** -0.030 -2.23 ** -0.078 -4.22 ***Log(K/L) 0.286 15.27 *** 0.285 15.85 *** 0.281 15.10 *** 0.287 15.69 *** 0.282 15.17 ***LogS 0.096 5.70 *** 0.088 6.25 *** 0.095 5.99 *** 0.067 5.01 *** 0.092 5.78 ***Constant -0.654 -1.50 *** -0.479 -1.33 -0.585 -1.41 0.141 0.42 -0.498 -1.21ROA 4.581 6.50 *** 4.599 7.27 *** 4.542 6.56 *** 4.617 6.63 *** 4.540 6.40 ***CSP -0.083 -2.17 ** -0.103 -3.29 *** -0.033 -1.31 -0.016 -0.47 -0.033 -1.04LogS 0.083 4.60 *** 0.086 6.00 *** 0.064 3.31 *** 0.055 3.44 *** 0.064 3.46 ***B/A 0.013 0.11 -0.002 -0.02 -0.043 -0.37 -0.051 -0.43 -0.046 -0.40Constant -0.143 -0.17 -0.301 -0.39 0.387 0.41 0.611 0.77 0.383 0.46
***Significance level (SL) less than 1 %; **SL less than 5 %; *SL less than 10% Coefficients of TSE 33 sector dummy variables and those of yearly dummy variables are not shown.
4. Tobin’s q
Social Sore
1. ROA
2. WN/Y
3. Log(V/L)
Overall Score Environmental Score Governance Score Social and Governance Score
1. Profit indicator and ESG scores
ROA:Return on assets CSP: JRI scores S:Market capitalization B/A:Interest-bearing debt ratio YD:Yearly dummy variable (applicable year: 1, not applicable:0) ID:TSE 33 sector dummy variable (applicable sector company: 1, not applicable: 0)
2. Labor share and ESG scores
WN/Y:Labor share (wages ÷ added value)
3. Labor productivity and ESG scores
V/L:Labor productivity K/L:Capital-labor ratio
4. Corporate value and CSP
q:Tobin’s Q
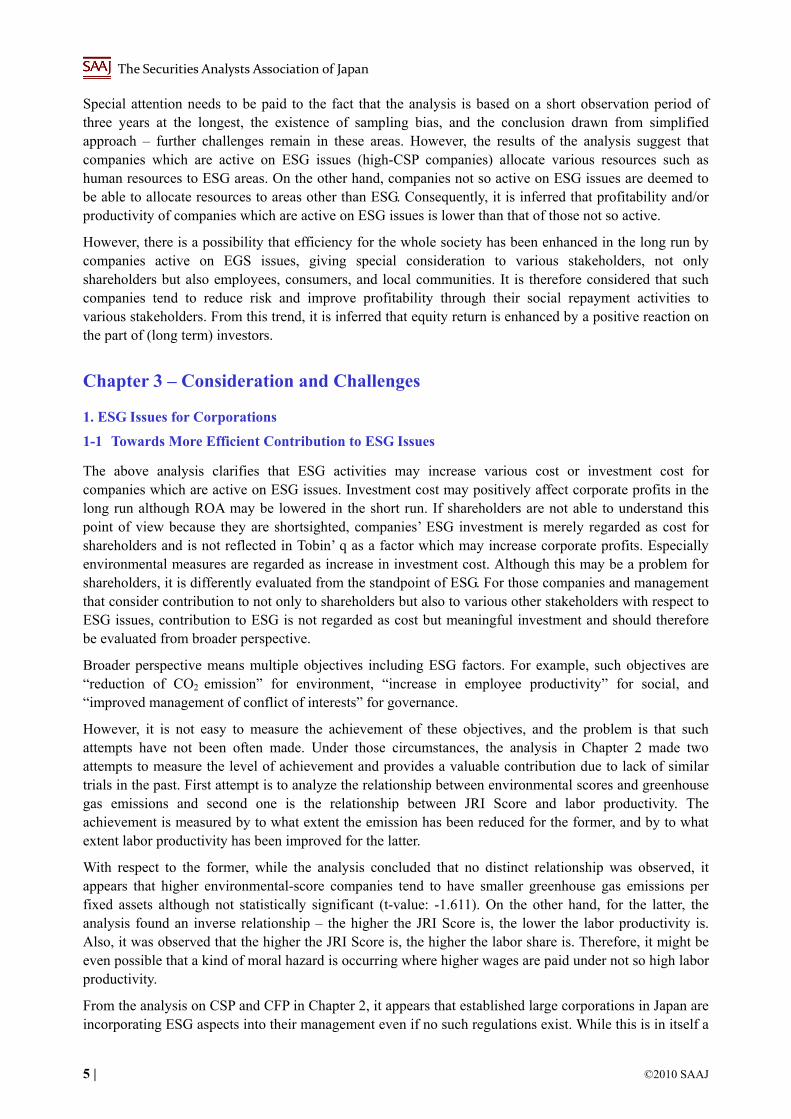
Exhibit 2 Effect of Scores on Financial Indicators (over 3 years)
Coefficient t-value Coefficient t-value Coefficient t-value Coefficient t-value Coefficient t-value
CSP -0.382 -1.653 * -0.370 -1.674 * -0.200 -0.885 -0.258 -1.414 -0.265 -1.214
LogS -0.225 -1.488 -0.262 -1.906 * -0.296 -1.934 * -0.284 -2.091 ** -0.264 -1.727 *
Constant 14.351 3.438 *** 15.216 3.965 *** 16.436 3.922 *** 16.303 4.472 *** 15.615 3.768 ***
CSP 1.889 0.965 2.402 1.284 0.403 0.211 0.796 0.516 0.674 0.365
LogS -0.482 -0.377 -0.488 -0.420 0.129 0.099 -0.002 -0.001 0.000 0.000
Constant -25.376 -0.718 -24.033 -0.741 -42.750 -1.208 -39.757 -1.289 -39.395 -1.124
CSP 0.009 1.873 * 0.009 2.066 ** 0.006 1.403 0.002 0.490 0.005 1.186
LogS -0.005 -1.530 -0.004 -1.469 -0.004 -1.239 -0.002 -0.624 -0.003 -1.098
Constant 0.129 1.552 0.116 1.529 0.103 1.244 0.045 0.618 0.090 1.095
CSP 0.726 1.746 * 0.794 1.999 ** 0.499 1.230 0.130 0.394 0.403 1.025
LogS -0.386 -1.423 -0.346 -1.404 -0.303 -1.101 -0.134 -0.544 -0.266 -0.967
Constant 10.858 1.446 10.103 1.466 8.345 1.108 3.583 0.544 7.225 0.968
CSP 0.139 2.114 ** 0.141 2.333 ** 0.110 1.718 * 0.037 0.712 0.093 1.499
LogS -0.072 -1.677 * -0.058 -1.570 -0.062 -1.439 -0.029 -0.735 -0.056 -1.297
Constant 2.310 1.951 * 1.949 1.912 * 1.951 1.645 0.984 0.947 1.756 1.493
***Significant Level (SL) less than 1 %; **SL less than 5 %; *SL less than 10% Coefficients of TSE 33 sector dummy variables are not shown.
Volatility (3 years)
Equity Return (3 years)
ROA Change Rate 1 (3 years)
ROA Change Rate 2(3 years)
Normalized ROA Change Rate 1 (3 years)
Social and Governance ScoreSocial ScoreOverall Score Environmental Score Governance Score
tit
tit
titititi ABSROA ,2,1,3,2,1, IDYD)/(logCSP θθβββα
tit
tit
titititi ABSYWN ,2,1,3,2,1, IDYD)/(logCSP)/( θθβββα
tit
tit
titititi LKSLV ,2,1,3,2,1, IDYD)/log(logCSP)/log( θθβββα
tit
tit
tititititi ABSq ,2,1,4,3,2,1, IDYD)/(logCSPROA θθββββα

The Securities Analysts Association of Japan
©2010 SAAJ | 4
An event study on greenhouse gas emissions shows that excess cumulative equity return (CER) over TOPIX is statistically significantly lower with respect to higher “environmental” score companies. This suggests that a target of a 25% reduction in Japan’s greenhouse gas emissions, announced by Prime Minister Hatoyama at the United Nations Climate Change Summit Talks on 22 September 2009, may have a negative impact on higher “environmental” score companies (Exhibit 3). It implies investor recognition that higher environmental score companies (which are more active on environmental issues) may have to bear further costs. However, the level of greenhouse gas emissions per fixed assets of higher environmental score companies in this survey sample is not necessarily high. Rather, it was found that their greenhouse gas emissions per fixed assets tend to be small although not statistically significant (Exhibit 4).
Exhibit 3 Regression Analysis of Post Event Day CER by Environmental Score
t, t+1 t-value t, t+2 t-value t, t+3 t-value t, t+1W t-value t, t+1M t-value
0.000 0.322 -0.000 -0.217 0.000 0.292 -0.000 -0.152 -0.001 -0.235B/A -0.014 -1.834* -0.029 -2.965*** -0.053 -4.360*** -0.066 -4.345*** -0.010 -0.400Environmental Score -0.000 -0.768 -0.000 -1.291 -0.000 -2.917*** -0.001 -2.614*** 0.000 0.424Constant -0.013 -0.499 0.031 0.970 0.039 0.926 0.047 0.894 0.028 0.371
The standard errors are computed, adjusted for heteroscedasticity using the White (1980) method. The marks, ***, **, *, mean statistically signif icant at 1%, 5%, and 10% levels respectively. Coef f icients of TSE 33 sector dummy vectors are not shown.
Exhibit 4 Regression Analysis of Greenhouse Gas Emissions per Fixed Assets
MODEL 1 t-value MODEL 2 t-value
Environmental Score -0.021 -1.611
Environmental Score Dummy 0.282 0.583
Constant 1.161 2.752 *** 0.386 2.219 **
GHG/K
MODEL 1:
MODEL 2:
Definition of variables
GHG: Greenhouse gas emission volume (Year 2007, CSR Directory 2009)
K: Fixed assets (average for the year 2007)
CSPeco: Environmental scores(2008 JRI Survey results)
CSPecodummy: Environmental score dummy variable (Env.-score computed company: 1, Not-computed: 0)
ID: TSE 33 sector dummy variable(applicable sector company:1, not applicable:0)
・LogS: Logarithmic market capitalization (Year end 2008) ・B/A: Interest-bearing debt ratio (Year end 2008) ・CSPeco: Environmental scores (2008 JRI Survey results); (N=359) ・ID: TSE 33 sector dummy variable (applicable sector company: 1, not applicable: 0)
Definition of variables
・CER:Excess cumulative equity return over TOPIX, explained variable of regression analysis ・(t, t+T) where T∈(1,2,3,1W,1M*)
2009.9.18
t+T Event Day
2009.9.22 2009.9.24 2009.a.aa
t t+1 ・・・
*1W=5 business days, 1M=20 business days
tit
tititiTtti ABSCER ,1,3,2,1),(, ID)/(logCSPeco θβββα
tititiKHG ,t1,1, IDCSPeco/G θβα
tititiKHG ,t1,1, IDyCSPecodumm/G θβα
LogS
The s tand ard erro rs are c o m p uted , ad jus ted f o r hetero s c ed as t ic ity us ing the W hite (1980) m etho d . The m ark s ,*** , ** , * , m ean s tat is t ic ally s ig nif ic ant at 1% , 5% , and 10% lev els res p ec tiv ely . Co ef f ic ients o f TS E 33
s ec to r d um m y v ec to rs are no t s ho wn.
The Securities Analysts Association of Japan
5 | ©2010 SAAJ
Special attention needs to be paid to the fact that the analysis is based on a short observation period of three years at the longest, the existence of sampling bias, and the conclusion drawn from simplified approach – further challenges remain in these areas. However, the results of the analysis suggest that companies which are active on ESG issues (high-CSP companies) allocate various resources such as human resources to ESG areas. On the other hand, companies not so active on ESG issues are deemed to be able to allocate resources to areas other than ESG. Consequently, it is inferred that profitability and/or productivity of companies which are active on ESG issues is lower than that of those not so active.
However, there is a possibility that efficiency for the whole society has been enhanced in the long run by companies active on EGS issues, giving special consideration to various stakeholders, not only shareholders but also employees, consumers, and local communities. It is therefore considered that such companies tend to reduce risk and improve profitability through their social repayment activities to various stakeholders. From this trend, it is inferred that equity return is enhanced by a positive reaction on the part of (long term) investors.
Chapter 3 – Consideration and Challenges
1. ESG Issues for Corporations
1-1 Towards More Efficient Contribution to ESG Issues
The above analysis clarifies that ESG activities may increase various cost or investment cost for companies which are active on ESG issues. Investment cost may positively affect corporate profits in the long run although ROA may be lowered in the short run. If shareholders are not able to understand this point of view because they are shortsighted, companies’ ESG investment is merely regarded as cost for shareholders and is not reflected in Tobin’ q as a factor which may increase corporate profits. Especially environmental measures are regarded as increase in investment cost. Although this may be a problem for shareholders, it is differently evaluated from the standpoint of ESG. For those companies and management that consider contribution to not only to shareholders but also to various other stakeholders with respect to ESG issues, contribution to ESG is not regarded as cost but meaningful investment and should therefore be evaluated from broader perspective.
Broader perspective means multiple objectives including ESG factors. For example, such objectives are “reduction of CO2 emission” for environment, “increase in employee productivity” for social, and “improved management of conflict of interests” for governance.
However, it is not easy to measure the achievement of these objectives, and the problem is that such attempts have not been often made. Under those circumstances, the analysis in Chapter 2 made two attempts to measure the level of achievement and provides a valuable contribution due to lack of similar trials in the past. First attempt is to analyze the relationship between environmental scores and greenhouse gas emissions and second one is the relationship between JRI Score and labor productivity. The achievement is measured by to what extent the emission has been reduced for the former, and by to what extent labor productivity has been improved for the latter.
With respect to the former, while the analysis concluded that no distinct relationship was observed, it appears that higher environmental-score companies tend to have smaller greenhouse gas emissions per fixed assets although not statistically significant (t-value: -1.611). On the other hand, for the latter, the analysis found an inverse relationship – the higher the JRI Score is, the lower the labor productivity is. Also, it was observed that the higher the JRI Score is, the higher the labor share is. Therefore, it might be even possible that a kind of moral hazard is occurring where higher wages are paid under not so high labor productivity.
From the analysis on CSP and CFP in Chapter 2, it appears that established large corporations in Japan are incorporating ESG aspects into their management even if no such regulations exist. While this is in itself a
The Securities Analysts Association of Japan
©2010 SAAJ | 6
matter to be commended, it seems that no clear results are achieved in spite of their efforts and activities. Since ESG activities are made using valuable corporate resources with some level of sacrifice on the part of shareholders, some positive results are required. However, such resources may not be so efficiently used and therefore the efficiency of ESG contributions is an important challenge that needs to be addressed.
On the other hand, it should be considered that measured achievements may be uncertain depending on the techniques and methods used for measurement even if corporate resources are effectively used for ESG activities. Also, even if there is no problem with measurement method, for example, when greenhouse gas emissions are slightly reduced, it is difficult in general to measure what we truly want to know: i.e. to what extent emissions are reduced compared with the cases where no environmental measures are taken. While we need to separately address such an issue of comparative analysis of cases “with and without” measures, the measurement of the ESG score effect on corporate achievements is an issue that should be further explored.
1-2 Toward Higher Corporate Value from a Long-Term Perspective
It is considered that companies’ investment in ESG activities is originally based on the needs of long-term stakeholders who expect companies to correct external effect of the pursuit of short-term profits (ESG activities are excessively limited because they do not produce short-term profits). Consequently, ESG investment cost is pressure on profits to drop in the short run and bears fruit in the long run.
While true corporate value should reflect both realized effect of ESG investment on current profits and unrealized effect of ESG investment on future profits (or profits volatility), in fact only the former is reflected in corporate value. The gap between the two (miss-pricing) may produce high excess return by investing in ESG activities. If the effect of ESG investment is not reflected in current profits and stock price, it rather implies that ESG investment may be promising. Conversely, if the effect is already reflected in profits and stock price, there is no incentive to invest in ESG activities from the standpoint of excess return. In other words, the analysis of the relationship between ESG scores and financial indicators in Chapter 2 is based on short-term data, and therefore we can say that it is in line with the hypothesis where ESG investment cost is pressure on profits to drop in the short run and bears fruit in the long run.
The “management considering interests of all types of stakeholders” may sound good but it has a problem of obscuring management responsibility or their investment decision-making. In such situation, criteria of companies’ investment decision-making are not clear and the objective indicators for measuring management responsibility are hard to find. As a result, discipline to corporate behavior may be weakened and lead to unnecessary wasting in ESG investment. On the other hand, ESG investment aiming at enhancement of long-term corporate value is made to correct external effect of the pursuit of short-term profits and to create business opportunities in relation to social and environmental issues. ESG investment cost is thus principally evaluated by net present value (NPV) and management responsibility is also measured by distinct indicator of corporate value. In conclusion, the objective of a company’s ESG activities should be long-term corporate value enhancement.
Currently, cost aspects of corporate ESG activities such as environmental management are focused. If we evaluate corporate ESG activities from such a viewpoint, many of highly evaluated companies may be those which may be affected by future cost increase. Corporate investment in ESG activities for existing stakeholders, such as those for employee relations and environmental issues, tends to incur higher initial cost. Those activities to correct external effect may be rewarded in the long run but may negatively affect immediate financial performance. On the other hand, corporate ESG investment focusing social issues as business opportunities, i.e. ESG investment for prospective customers, may positively impact financial performance in a relatively short period of time. A typical example of this category is environmental business by companies with technology to reduce greenhouse gas emissions or raw materials.
The Securities Analysts Association of Japan
7 | ©2010 SAAJ
1-3 Placing Emphasis on Risk Reduction Effect
Corporate ESG investment draws attention as non-financial information which is not incorporated in stock prices (as a source of excess return). Among non-financial information, while variables of corporate strategy and technological competence are volatile over time, ESG related information is generally less volatile over time once ESG activities start. Therefore, once investors evaluate ESG information, it cannot be a new source of return thereafter. Accordingly, if many investors invest in companies which are active on ESG issues seeking high return, such investment may be merely a short-lived phenomenon.
On the other hand, corporate initiatives on ESG issues may reduce future management risk and increase demand for stocks of such companies and, at equilibrium, may have an effect to reduce risk premium required by long-term investors. This effect is unlikely to be a temporary phenomenon. Such an effect of reduction in capital cost can be an incentive for companies to be active on ESG issues. In other words, there is a possibility that investors’ investment in companies active on ESG issues improve society through the change of corporate behavior. In order to promote ESG investment by investors and to contribute to solving social issues, not only the achievement of excess return but also the effect of risk premium reduction should be focused.
2. Challenges in Using CSP Information and Methods of Improvement
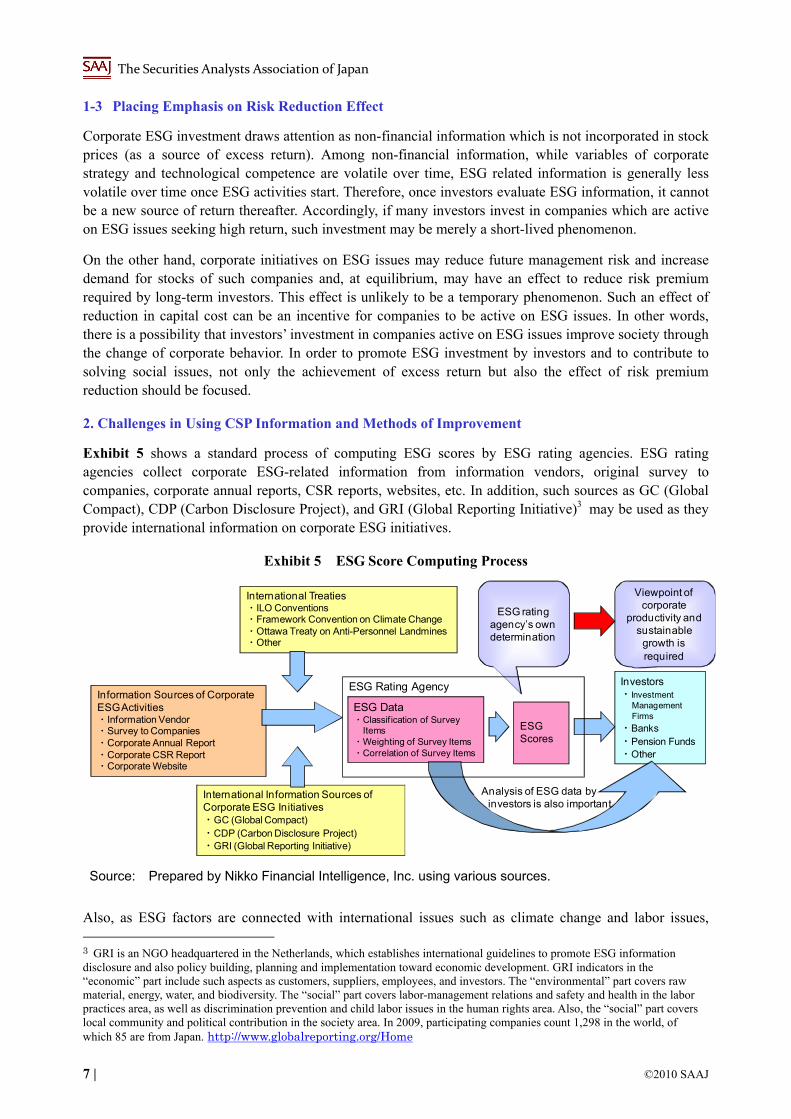
Exhibit 5 shows a standard process of computing ESG scores by ESG rating agencies. ESG rating agencies collect corporate ESG-related information from information vendors, original survey to companies, corporate annual reports, CSR reports, websites, etc. In addition, such sources as GC (Global Compact), CDP (Carbon Disclosure Project), and GRI (Global Reporting Initiative)3 may be used as they provide international information on corporate ESG initiatives.
Exhibit 5 ESG Score Computing Process
Information Sources of Corporate ESG Activities・Information Vendor・Survey to Companies・Corporate Annual Report・Corporate CSR Report・Corporate Website
International Information Sources ofCorporate ESG Initiatives・GC (Global Compact) ・CDP (Carbon Disclosure Project)・GRI (Global Reporting Initiative)
International Treaties・ILO Conventions・Framework Convention on Climate Change・Ottawa Treaty on Anti-Personnel Landmines・Other
ESG Data・Classif ication of Survey
Items・Weighting of Survey Items・Correlation of Survey Items
ESG Scores
Investors・Investment
ManagementFirms
・Banks・Pension Funds・Other
ESG rating agency’s own determination
Viewpoint of corporate
productivity and sustainable
growth is required
Analysis of ESG data by investors is also important
ESG Rating Agency
Source: Prepared by Nikko Financial Intelligence, Inc. using various sources.
Also, as ESG factors are connected with international issues such as climate change and labor issues, 3 GRI is an NGO headquartered in the Netherlands, which establishes international guidelines to promote ESG information disclosure and also policy building, planning and implementation toward economic development. GRI indicators in the “economic” part include such aspects as customers, suppliers, employees, and investors. The “environmental” part covers raw material, energy, water, and biodiversity. The “social” part covers labor-management relations and safety and health in the labor practices area, as well as discrimination prevention and child labor issues in the human rights area. Also, the “social” part covers local community and political contribution in the society area. In 2009, participating companies count 1,298 in the world, of which 85 are from Japan. http://www.globalreporting.org/Home

The Securities Analysts Association of Japan
©2010 SAAJ | 8
pension funds in Europe and the U.S. sometimes make investments in accordance with applicable international treaties. Therefore, it is necessary to have proper knowledge of such international treaties.
ESG scores are calculated based on gathered ESG data after considering ESG agency’s original classification of, weighting of, and correlation of survey items. ESG scores are provided as CSP information to investors such as investment managers and pension funds which have signed the PRI and used in their investment decision-making.
Following issues need to be addressed in this score computing process.
(a) ESG information gathering requires substantial cost. (b) In the absence of information gathering standard, arbitrary selection should be avoided. (c) ESG scores depend on the original knowhow of rating agencies to a large extent. (d) Shortage of ESG specialists on the part of investors using scores.
Among those, cost in (a) is likely to be covered because of the potential increase in portfolio efficiencies by considering ESG factors as discussed in Chapter 2. The issue (b) is deemed to improve because the integrity should be checked along with the expansion of users of information on ESG factors. As for (c), the issue of knowhow to compute scores will be improved if score users disclose raw data before computing scores so that investors themselves are able to compute such scores. The issue (d), which is on the part of score users, the shortage of specialists may be resolved because market mechanism is expected to work if fund managers and investment firms understand that ESG factors are able to contribute to creation of new investment ideas and risk management.
3. Incorporating ESG Factors to Investment Process
Exhibit 6 shows the process for screening stocks from investable stocks and constructing/managing portfolios, taking an example of domestic equity portfolio construction process of an investment firm.
Usually, investment firms select stocks based on their own investment philosophy. At this stage, those investment firms that have signed the PRI would narrow down stocks considering ESG factors. Once screened, a group of such stocks is generally called the investment manager’s own “investment universe” which is different from other managers. The “investment universe” is reviewed by financial analysts and/or fund managers within the firm using financial and other data. In this process, information provided by ESG rating agency is analyzed along with financial data, and individual stock selection as well as sector allocation is determined.
Exhibit 6 ESG Factors in the Equity Portfolio Construction Process
Source: Exhibit 1 of Morimoto/Takahashi (2001) with additional notes by Nikko Financial Intelligence, Inc.
Risk Management
Research
Individual Stock
Selection
Sector Allocation
Domestic Equity Portfolio Construction Process
Investment Philosophy
・Small Cap/Large Cap・Value/Growth・Other
Investment Universe
Investable Stocks
ESG Factors
・Environmental
・Social (Human Resources)
・Governance・Benchmark・ESG Factor Risk・Scores
(a)
(b)
(c)
PortfolioConstruction Trading Portfolio
Management
The Securities Analysts Association of Japan
9 | ©2010 SAAJ
Exhibit 6 shows that ESG factors are incorporated to (a) stock screening, (b) stock research, and (c) risk management in the portfolio construction process. In practice, the level where ESG factors are incorporated varies depending on investment firms. While ESG scores are often used at the screening level of (a), whether ESG score screening precedes or follows financial data screening varies depending on investment firms. It is considered, however, that items (b) and (c) are more important in order to fully integrate ESG factors into the portfolio construction process.
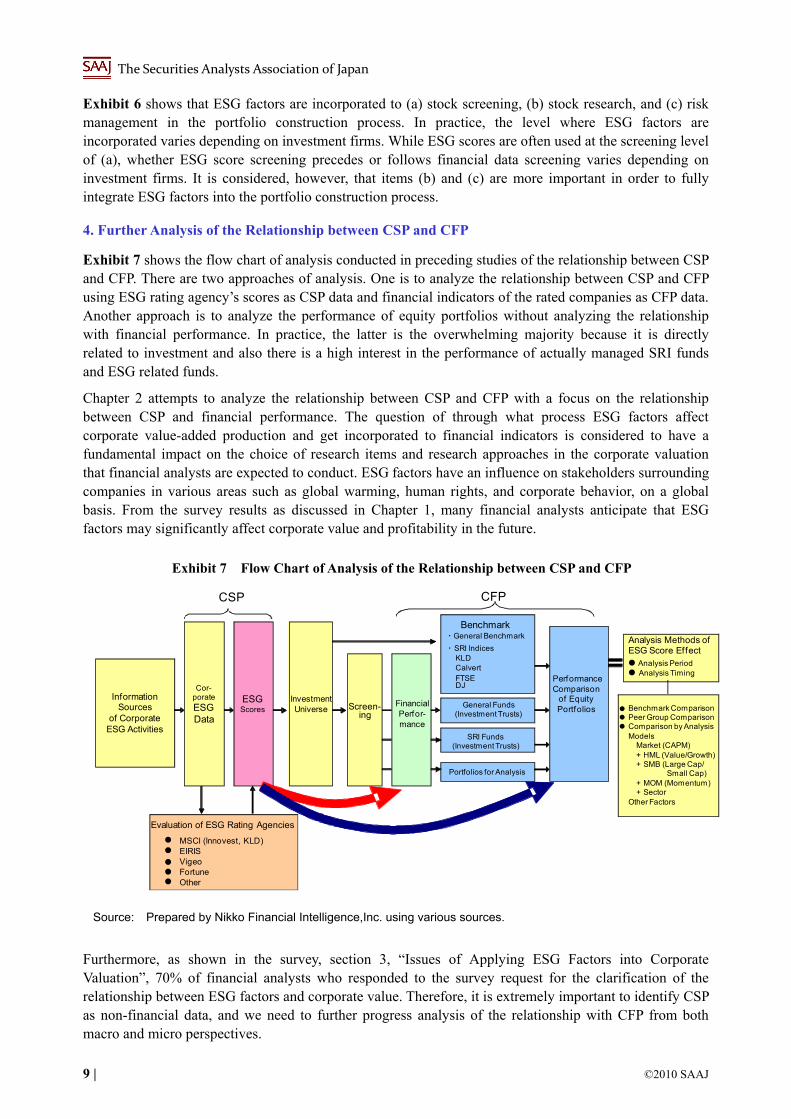
4. Further Analysis of the Relationship between CSP and CFP
Exhibit 7 shows the flow chart of analysis conducted in preceding studies of the relationship between CSP and CFP. There are two approaches of analysis. One is to analyze the relationship between CSP and CFP using ESG rating agency’s scores as CSP data and financial indicators of the rated companies as CFP data. Another approach is to analyze the performance of equity portfolios without analyzing the relationship with financial performance. In practice, the latter is the overwhelming majority because it is directly related to investment and also there is a high interest in the performance of actually managed SRI funds and ESG related funds.
Chapter 2 attempts to analyze the relationship between CSP and CFP with a focus on the relationship between CSP and financial performance. The question of through what process ESG factors affect corporate value-added production and get incorporated to financial indicators is considered to have a fundamental impact on the choice of research items and research approaches in the corporate valuation that financial analysts are expected to conduct. ESG factors have an influence on stakeholders surrounding companies in various areas such as global warming, human rights, and corporate behavior, on a global basis. From the survey results as discussed in Chapter 1, many financial analysts anticipate that ESG factors may significantly affect corporate value and profitability in the future.
Exhibit 7 Flow Chart of Analysis of the Relationship between CSP and CFP
●
●
●
Benchmark ComparisonPeer Group ComparisonComparison by Analysis Models
Market (CAPM)+ HML (Value/Growth)+ SMB (Large Cap/
Small Cap)+ MOM (Momentum)+ Sector
Other Factors
General Funds (Investment Trusts)
of Equity Portfolios
Performance Comparison
Evaluation of ESG Rating Agencies
● MSCI (Innovest, KLD)EIRISVigeoFortuneOther
●
●
●
●
Analysis Methods of ESG Score Effect● Analysis Period● Analysis Timing
Investment Universe
Information Sources
of Corporate ESG Activities
SRI Funds (Investment Trusts)
Portfolios for Analysis
Benchmark・General Benchmark
・SRI IndicesKLDCalvertFTSEDJ
Financial Perfor-mance
Screen-ing
CFP
Cor-porate
ESG Data
ESGScores
CSP
Source: Prepared by Nikko Financial Intelligence,Inc. using various sources.
Furthermore, as shown in the survey, section 3, “Issues of Applying ESG Factors into Corporate Valuation”, 70% of financial analysts who responded to the survey request for the clarification of the relationship between ESG factors and corporate value. Therefore, it is extremely important to identify CSP as non-financial data, and we need to further progress analysis of the relationship with CFP from both macro and micro perspectives.

The Securities Analysts Association of Japan
©2010 SAAJ | 10
[Reference]
“Corporate Social Responsibility and ESG Investment”, Takafumi Sasaki, Securities Analysts Journal, May 2010, the Securities Analysts Association of Japan
“A Perspective on Investment Product Evaluation – Part 2: Domestic Equity Judgmental Active Management,” Tsuyoshi Morimoto and Tomohiro Takahashi, Pension Review, May 2001, Nikko Research Center
“Trends in CSR Management at Japanese Businesses, 2009”, the Japan Research Institute, Limited
The Securities Analysts Association of Japan
11 | ©2010 SAAJ
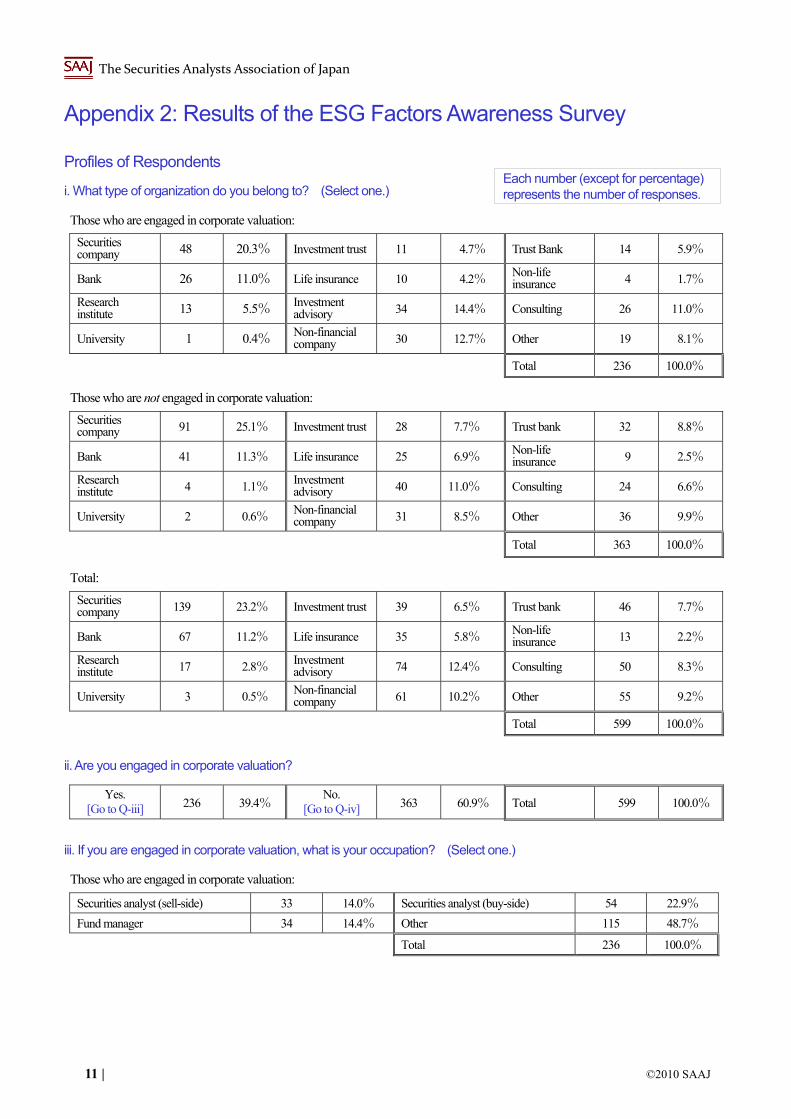
Appendix 2: Results of the ESG Factors Awareness Survey
Profiles of Respondents
i. What type of organization do you belong to? (Select one.)
Those who are engaged in corporate valuation:
Securities company 48 20.3% Investment trust 11 4.7% Trust Bank 14 5.9%
Bank 26 11.0% Life insurance 10 4.2% Non-life insurance 4 1.7%
Research institute 13 5.5% Investment
advisory 34 14.4% Consulting 26 11.0%
University 1 0.4% Non-financial company 30 12.7% Other 19 8.1%
Total 236 100.0%
Those who are not engaged in corporate valuation:
Securities company 91 25.1% Investment trust 28 7.7% Trust bank 32 8.8%
Bank 41 11.3% Life insurance 25 6.9% Non-life insurance 9 2.5%
Research institute 4 1.1% Investment
advisory 40 11.0% Consulting 24 6.6%
University 2 0.6% Non-financial company 31 8.5% Other 36 9.9%
Total 363 100.0%
Total:
Securities company 139 23.2% Investment trust 39 6.5% Trust bank 46 7.7%
Bank 67 11.2% Life insurance 35 5.8% Non-life insurance 13 2.2%
Research institute 17 2.8% Investment
advisory 74 12.4% Consulting 50 8.3%
University 3 0.5% Non-financial company 61 10.2% Other 55 9.2%
Total 599 100.0%
ii. Are you engaged in corporate valuation?
Yes. [Go to Q-iii] 236 39.4%
No. [Go to Q-iv] 363 60.9% Total 599 100.0%
iii. If you are engaged in corporate valuation, what is your occupation? (Select one.)
Those who are engaged in corporate valuation:
Securities analyst (sell-side) 33 14.0% Securities analyst (buy-side) 54 22.9%
Fund manager 34 14.4% Other 115 48.7%
Total 236 100.0%
Each number (except for percentage) represents the number of responses.

The Securities Analysts Association of Japan
©2010 SAAJ | 12
iv. Check items about which you have knowledge to some extent. (Select all that apply.)
Those who are engaged in corporate valuation:
CSR (Corporate Social Responsibility) 235 99.6%
SRI (Social Responsible Investment) 208 88.1%
PRI (UN Principles for Responsible Investment) 49 20.8% COP15 89 37.3%
Millennium Development Goals 34 14.4% Global Compact 39 16.5%
Materiality 37 15.7%
CSP (Corporate Social Performance) 35 14.8%
CDP (Carbon Disclosure Project) 76 32.2%
UNEP-FI (UNEP Finance Initiative) 43 18.2%
Total 236 100.0%
Those who are not engaged in corporate valuation:
CSR (Corporate Social Responsibility) 357 98.3%
SRI (Social Responsible Investment) 320 88.2%
PRI (UN Principles for Responsible Investment) 93 25.6% COP15 112 30.9%
Millennium Development Goals 31 8.5% Global Compact 53 14.6%
Materiality 48 13.2%
CSP (Corporate Social Performance) 40 11.0%
CDP (Carbon Disclosure Project) 67 18.5%
UNEP-FI (UNEP Finance Initiative) 77 21.2%
Total 363 100.0%
Total:
CSR (Corporate Social Responsibility) 529 98.8%
SRI (Social Responsible Investment) 528 88.1%
PRI (UN Principles for Responsible Investment) 142 23.7% COP15 201 33.6%
Millennium Development Goals 65 10.9% Global Compact 92 15.4%
Materiality 85 14.2%
CSP (Corporate Social Performance) 75 12.5%
CDP (Carbon Disclosure Project) 143 23.9%
UNEP-FI (UNEP Finance Initiative) 120 20.0%
Total 599 100.0%
1. Corporate Valuation and ESG
1-1. For what time frame do you usually evaluate companies? (Select one.)
Those who are engaged in corporate valuation:
Short term (less than one year) 30 12.7% Medium term (one to three years) 111 47.0%
Long term (more than three years) 95 40.3% Total 236 100.0%
Those who are not engaged in corporate valuation:
Short term (less than one year) 26 7.2% Medium term (one to three years) 196 54.0%
Long term (more than three years) 141 38.8% Total 363 100.0%
Total:
Short term (less than one year) 56 9.3% Medium term (one to three years) 307 51.3%
Long term (more than three years) 236 39.4% Total 599 100.0%
The Securities Analysts Association of Japan
13 | ©2010 SAAJ
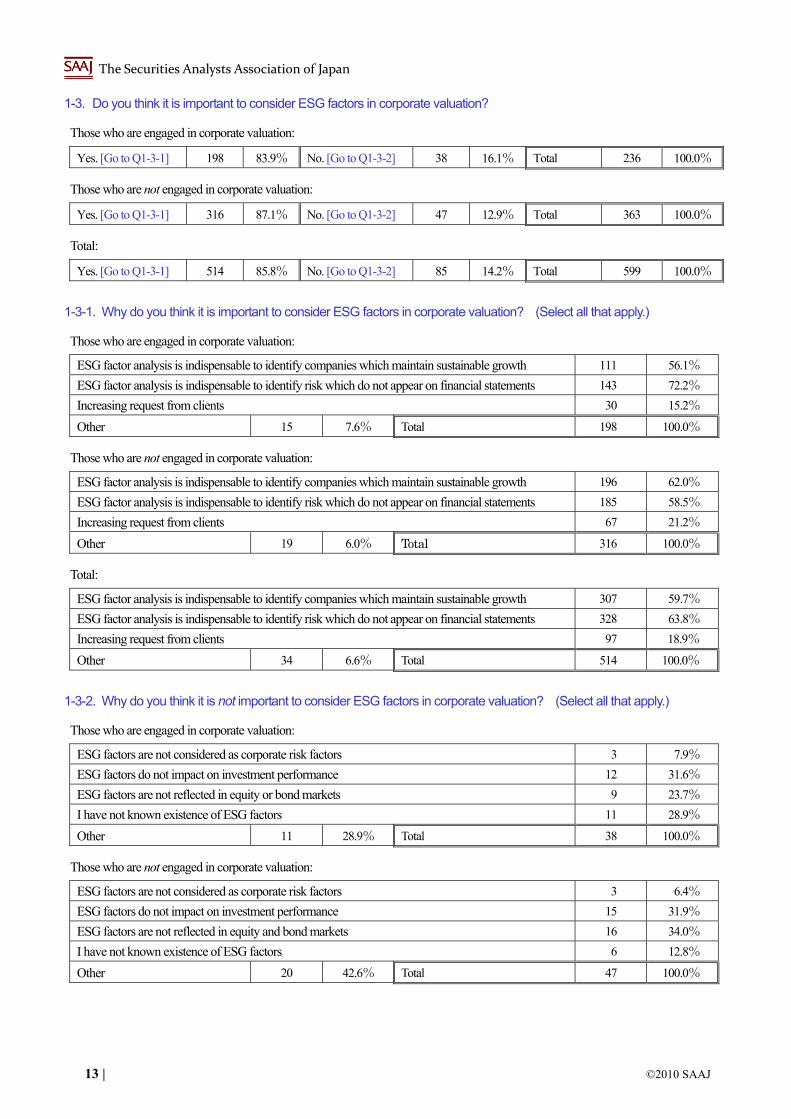
1-3. Do you think it is important to consider ESG factors in corporate valuation?
Those who are engaged in corporate valuation:
Yes. [Go to Q1-3-1] 198 83.9% No. [Go to Q1-3-2] 38 16.1% Total 236 100.0%
Those who are not engaged in corporate valuation:
Yes. [Go to Q1-3-1] 316 87.1% No. [Go to Q1-3-2] 47 12.9% Total 363 100.0%
Total:
Yes. [Go to Q1-3-1] 514 85.8% No. [Go to Q1-3-2] 85 14.2% Total 599 100.0%
1-3-1. Why do you think it is important to consider ESG factors in corporate valuation? (Select all that apply.)
Those who are engaged in corporate valuation:
ESG factor analysis is indispensable to identify companies which maintain sustainable growth 111 56.1%
ESG factor analysis is indispensable to identify risk which do not appear on financial statements 143 72.2%
Increasing request from clients 30 15.2%
Other 15 7.6% Total 198 100.0%
Those who are not engaged in corporate valuation:
ESG factor analysis is indispensable to identify companies which maintain sustainable growth 196 62.0%
ESG factor analysis is indispensable to identify risk which do not appear on financial statements 185 58.5%
Increasing request from clients 67 21.2%
Other 19 6.0% Total 316 100.0%
Total:
ESG factor analysis is indispensable to identify companies which maintain sustainable growth 307 59.7%
ESG factor analysis is indispensable to identify risk which do not appear on financial statements 328 63.8%
Increasing request from clients 97 18.9%
Other 34 6.6% Total 514 100.0%
1-3-2. Why do you think it is not important to consider ESG factors in corporate valuation? (Select all that apply.)
Those who are engaged in corporate valuation:
ESG factors are not considered as corporate risk factors 3 7.9%
ESG factors do not impact on investment performance 12 31.6%
ESG factors are not reflected in equity or bond markets 9 23.7%
I have not known existence of ESG factors 11 28.9%
Other 11 28.9% Total 38 100.0%
Those who are not engaged in corporate valuation:
ESG factors are not considered as corporate risk factors 3 6.4%
ESG factors do not impact on investment performance 15 31.9%
ESG factors are not reflected in equity and bond markets 16 34.0%
I have not known existence of ESG factors 6 12.8%
Other 20 42.6% Total 47 100.0%
The Securities Analysts Association of Japan
©2010 SAAJ | 14
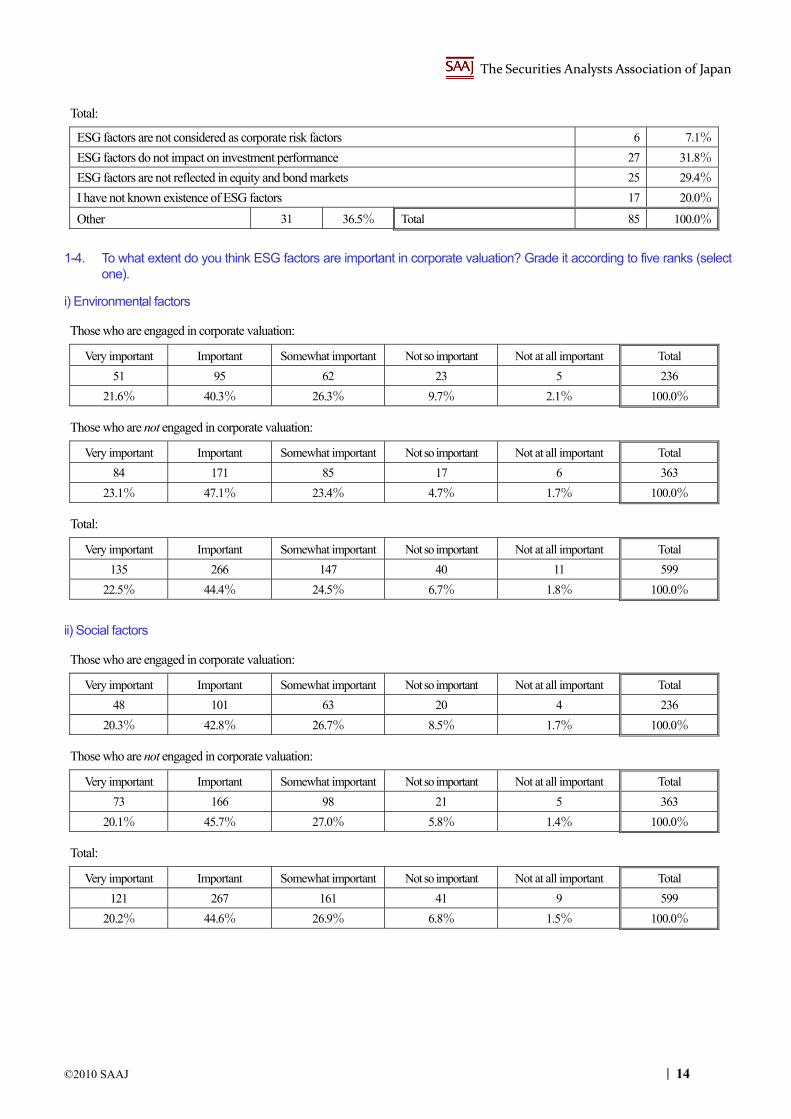
Total:
ESG factors are not considered as corporate risk factors 6 7.1%
ESG factors do not impact on investment performance 27 31.8%
ESG factors are not reflected in equity and bond markets 25 29.4%
I have not known existence of ESG factors 17 20.0%
Other 31 36.5% Total 85 100.0%
1-4. To what extent do you think ESG factors are important in corporate valuation? Grade it according to five ranks (select one).
i) Environmental factors
Those who are engaged in corporate valuation:
Very important Important Somewhat important Not so important Not at all important Total
51 95 62 23 5 236
21.6% 40.3% 26.3% 9.7% 2.1% 100.0%
Those who are not engaged in corporate valuation:
Very important Important Somewhat important Not so important Not at all important Total
84 171 85 17 6 363
23.1% 47.1% 23.4% 4.7% 1.7% 100.0%
Total:
Very important Important Somewhat important Not so important Not at all important Total
135 266 147 40 11 599
22.5% 44.4% 24.5% 6.7% 1.8% 100.0%
ii) Social factors
Those who are engaged in corporate valuation:
Very important Important Somewhat important Not so important Not at all important Total
48 101 63 20 4 236
20.3% 42.8% 26.7% 8.5% 1.7% 100.0%
Those who are not engaged in corporate valuation:
Very important Important Somewhat important Not so important Not at all important Total
73 166 98 21 5 363
20.1% 45.7% 27.0% 5.8% 1.4% 100.0%
Total:
Very important Important Somewhat important Not so important Not at all important Total
121 267 161 41 9 599
20.2% 44.6% 26.9% 6.8% 1.5% 100.0%

The Securities Analysts Association of Japan
15 | ©2010 SAAJ
iii) Governance factors
Those who are engaged in corporate valuation:
Very important Important Somewhat important Not so important Not at all important Total
84 94 41 14 3 236
35.6% 39.8% 17.4% 5.9% 1.3% 100.0%
Those who are not engaged in corporate valuation:
Very important Important Somewhat important Not so important Not at all important Total
120 145 81 14 3 363
33.1% 39.9% 22.3% 3.9% 0.8% 100.0%
Total:
Very important Important Somewhat important Not very important Not at all important Total
204 239 122 28 6 599
34.1% 39.9% 20.4% 4.7% 1.0% 100.0%
2. Identification of ESG Factors Affecting Corporate Value – Their Impact and Time Frame
2-1. Environmental (1): Initiatives on climate change
Those who are engaged in corporate valuation:
Significant effect on earnings
Moderate effect on earnings
Significant effect on risks
Moderate effect on risks
Not much effect Total
57 86 33 40 15 231
24.7% 37.2% 14.3% 17.3% 6.5% 100.0%
Short term (less than one year)
12 5.2% Medium to long term (more than one year)
220 94.8% Total 232 100.0%
Those who are not engaged in corporate valuation:
Significant effect on earnings
Moderate effect on earnings
Significant effect on risks
Moderate effect on risks
Not much effect Total
88 141 45 69 18 361
24.4% 39.1% 12.5% 19.1% 5.0% 100.0%
Short term (less than one year)
9 2.5% Medium to long term (more than one year)
351 97.5% Total 360 100.0%
Total:
Significant effect on earnings
Moderate effect on earnings
Significant effect on risks
Moderate effect on risks
Not much effect Total
145 227 78 109 33 592
24.5% 38.3% 13.2% 18.4% 5.6% 100.0%
Short term (less than one year)
29 3.5% Medium to long term (more than one year)
571 96.5% Total 592 100.0%

The Securities Analysts Association of Japan
©2010 SAAJ | 16
2-2. Environmental (2): Greenhouse gas emissions
Those who are engaged in corporate valuation:
Significant effect on earnings
Moderate effect on earnings
Significant effect on risks
Moderate effect on risks
Not much effect Total
56 92 28 47 8 231
24.2% 39.8% 12.1% 20.3% 3.5% 100.0%
Short term (less than one year)
12 5.2% Medium to long term (more than one year)
220 94.8% Total 232 100.0%
Those who are not engaged in corporate valuation:
Significant effect on earnings
Moderate effect on earnings
Significant effect on risks
Moderate effect on risks
Not much effect Total
91 121 60 68 17 357
25.5% 33.9% 16.8% 19.0% 4.8% 100.0%
Short term (less than one year)
13 3.7% Medium to long term (more than one year)
339 96.3% Total 352 100.0%
Total:
Significant effect on earnings
Moderate effect on earnings
Significant effect on risks
Moderate effect on risks
Not much effect Total
147 213 88 115 25 588
25.0% 36.2% 15.0% 19.6% 4.3% 100.0%
Short term (less than one year)
25 4.3% Medium to long term (more than one year)
559 95.7% Total 584 100.0%
2-3. Environmental (3): Environmental Liabilities
Those who are engaged in corporate valuation:
Significant effect on earnings
Moderate effect on earnings
Significant effect on risks
Moderate effect on risks
Not much effect Total
52 54 59 58 5 228
22.8% 23.7% 25.9% 25.4% 2.2% 100.0%
Short term (less than one year)
34 15.3% Medium to long term (more than one year)
188 84.7% Total 222 100.0%
Those who are not engaged in corporate valuation:
Significant effect on earnings
Moderate effect on earnings
Significant effect on risks
Moderate effect on risks
Not much effect Total
77 78 113 83 7 358
21.5% 21.8% 31.6% 23.2% 2.0% 100.0%
Short term (less than one year)
38 10.6% Medium to long term (more than one year)
319 89.4% Total 357 100.0%
Total:
Significant effect on earnings
Moderate effect on earnings
Significant effect on risks
Moderate effect on risks
Not much effect Total
129 132 172 141 12 586
22.0% 22.5% 29.4% 24.1% 2.0% 100.0%
Short term (less than one year)
72 12.4% Medium to long term (more than one year)
507 87.6% Total 579 100.0%

The Securities Analysts Association of Japan
17 | ©2010 SAAJ
2-4. Environmental (4): Water resources management
Those who are engaged in corporate valuation:
Significant effect on earnings
Moderate effect on earnings
Significant effect on risks
Moderate effect on risks
Not much effect Total
29 63 36 72 28 228
12.7% 27.6% 15.8% 31.6% 12.3% 100.0%
Short term (less than one year)
15 6.6% Medium to long term (more than one year)
212 93.4% Total 227 100.0%
Those who are not engaged in corporate valuation:
Significant effect on earnings
Moderate effect on earnings
Significant effect on risks
Moderate effect on risks
Not much effect Total
50 92 80 97 39 358
14.0% 25.7% 22.3% 27.1% 10.9% 100.0%
Short term (less than one year)
16 4.6% Medium to long term (more than one year)
332 95.4% Total 348 100.0%
Total:
Significant effect on earnings
Moderate effect on earnings
Significant effect on risks
Moderate effect on risks
Not much effect Total
79 155 116 169 67 586
13.5% 26.5% 19.8% 28.8% 11.4% 100.0%
Short term (less than one year)
31 5.4% Medium to long term (more than one year)
544 94.6% Total 575 100.0%
2-5. Environmental (5): Development of environmental conscious products and services
Those who are engaged in corporate valuation:
Significant effect on earnings
Moderate effect on earnings
Significant effect on risks
Moderate effect on risks
Not much effect Total
89 97 10 25 8 229
38.9% 42.4% 4.4% 10.9% 3.5% 100.0%
Short term (less than one year)
21 9.3% Medium to long term (more than one year)
204 90.7% Total 225 100.0%
Those who are not engaged in corporate valuation:
Significant effect on earnings
Moderate effect on earnings
Significant effect on risks
Moderate effect on risks
Not much effect Total
155 165 12 17 7 356
43.5% 46.3% 3.4% 4.8% 2.0% 100.0%
Short term (less than one year)
50 14.1% Medium to long term (more than one year)
305 85.9% Total 355 100.0%
Total:
Significant effect on earnings
Moderate effect on earnings
Significant effect on risks
Moderate effect on risks
Not much effect Total
244 262 22 42 15 585
41.7% 44.8% 3.8% 7.2% 2.6% 100.0%
Short term (less than one year)
71 12.2% Medium to long term (more than one year)
509 87.8% Total 580 100.0%
The Securities Analysts Association of Japan
©2010 SAAJ | 18
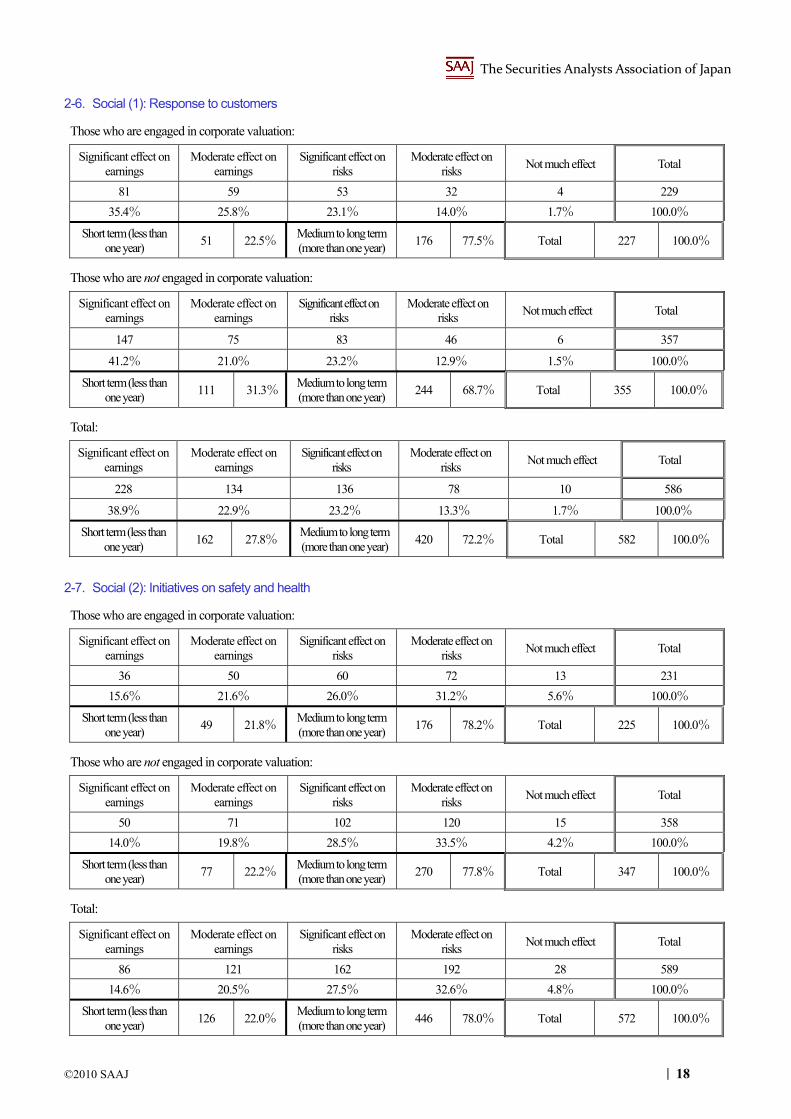
2-6. Social (1): Response to customers
Those who are engaged in corporate valuation:
Significant effect on earnings
Moderate effect on earnings
Significant effect on risks
Moderate effect on risks
Not much effect Total
81 59 53 32 4 229
35.4% 25.8% 23.1% 14.0% 1.7% 100.0%
Short term (less than one year)
51 22.5% Medium to long term (more than one year)
176 77.5% Total 227 100.0%
Those who are not engaged in corporate valuation:
Significant effect on earnings
Moderate effect on earnings
Significant effect on risks
Moderate effect on risks
Not much effect Total
147 75 83 46 6 357
41.2% 21.0% 23.2% 12.9% 1.5% 100.0%
Short term (less than one year)
111 31.3% Medium to long term (more than one year)
244 68.7% Total 355 100.0%
Total:
Significant effect on earnings
Moderate effect on earnings
Significant effect on risks
Moderate effect on risks
Not much effect Total
228 134 136 78 10 586
38.9% 22.9% 23.2% 13.3% 1.7% 100.0%
Short term (less than one year)
162 27.8% Medium to long term (more than one year)
420 72.2% Total 582 100.0%
2-7. Social (2): Initiatives on safety and health
Those who are engaged in corporate valuation:
Significant effect on earnings
Moderate effect on earnings
Significant effect on risks
Moderate effect on risks
Not much effect Total
36 50 60 72 13 231
15.6% 21.6% 26.0% 31.2% 5.6% 100.0%
Short term (less than one year)
49 21.8% Medium to long term (more than one year)
176 78.2% Total 225 100.0%
Those who are not engaged in corporate valuation:
Significant effect on earnings
Moderate effect on earnings
Significant effect on risks
Moderate effect on risks
Not much effect Total
50 71 102 120 15 358
14.0% 19.8% 28.5% 33.5% 4.2% 100.0%
Short term (less than one year)
77 22.2% Medium to long term (more than one year)
270 77.8% Total 347 100.0%
Total:
Significant effect on earnings
Moderate effect on earnings
Significant effect on risks
Moderate effect on risks
Not much effect Total
86 121 162 192 28 589
14.6% 20.5% 27.5% 32.6% 4.8% 100.0%
Short term (less than one year)
126 22.0% Medium to long term (more than one year)
446 78.0% Total 572 100.0%
The Securities Analysts Association of Japan
19 | ©2010 SAAJ
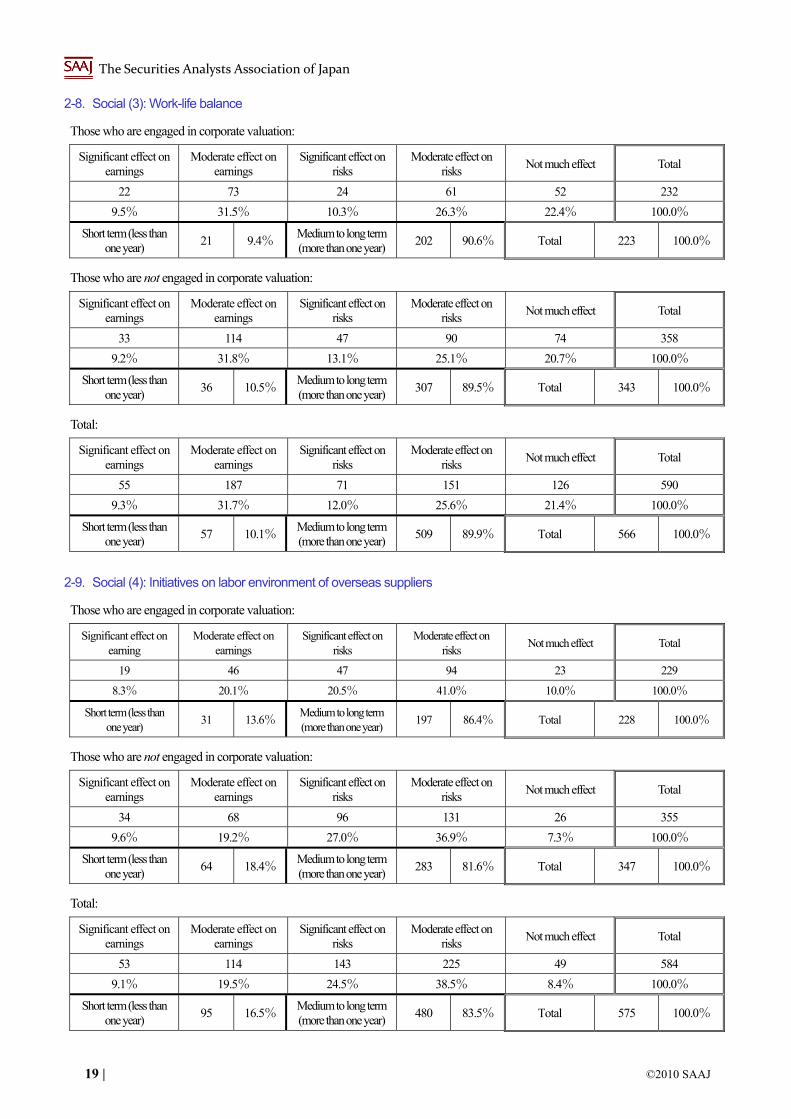
2-8. Social (3): Work-life balance
Those who are engaged in corporate valuation:
Significant effect on earnings
Moderate effect on earnings
Significant effect on risks
Moderate effect on risks
Not much effect Total
22 73 24 61 52 232
9.5% 31.5% 10.3% 26.3% 22.4% 100.0%
Short term (less than one year)
21 9.4% Medium to long term (more than one year)
202 90.6% Total 223 100.0%
Those who are not engaged in corporate valuation:
Significant effect on earnings
Moderate effect on earnings
Significant effect on risks
Moderate effect on risks
Not much effect Total
33 114 47 90 74 358
9.2% 31.8% 13.1% 25.1% 20.7% 100.0%
Short term (less than one year)
36 10.5% Medium to long term (more than one year)
307 89.5% Total 343 100.0%
Total:
Significant effect on earnings
Moderate effect on earnings
Significant effect on risks
Moderate effect on risks
Not much effect Total
55 187 71 151 126 590
9.3% 31.7% 12.0% 25.6% 21.4% 100.0%
Short term (less than one year)
57 10.1% Medium to long term (more than one year)
509 89.9% Total 566 100.0%
2-9. Social (4): Initiatives on labor environment of overseas suppliers
Those who are engaged in corporate valuation:
Significant effect on earning
Moderate effect on earnings
Significant effect on risks
Moderate effect on risks
Not much effect Total
19 46 47 94 23 229
8.3% 20.1% 20.5% 41.0% 10.0% 100.0%
Short term (less than one year)
31 13.6% Medium to long term (more than one year)
197 86.4% Total 228 100.0%
Those who are not engaged in corporate valuation:
Significant effect on earnings
Moderate effect on earnings
Significant effect on risks
Moderate effect on risks
Not much effect Total
34 68 96 131 26 355
9.6% 19.2% 27.0% 36.9% 7.3% 100.0%
Short term (less than one year)
64 18.4% Medium to long term (more than one year)
283 81.6% Total 347 100.0%
Total:
Significant effect on earnings
Moderate effect on earnings
Significant effect on risks
Moderate effect on risks
Not much effect Total
53 114 143 225 49 584
9.1% 19.5% 24.5% 38.5% 8.4% 100.0%
Short term (less than one year)
95 16.5% Medium to long term (more than one year)
480 83.5% Total 575 100.0%
The Securities Analysts Association of Japan
©2010 SAAJ | 20
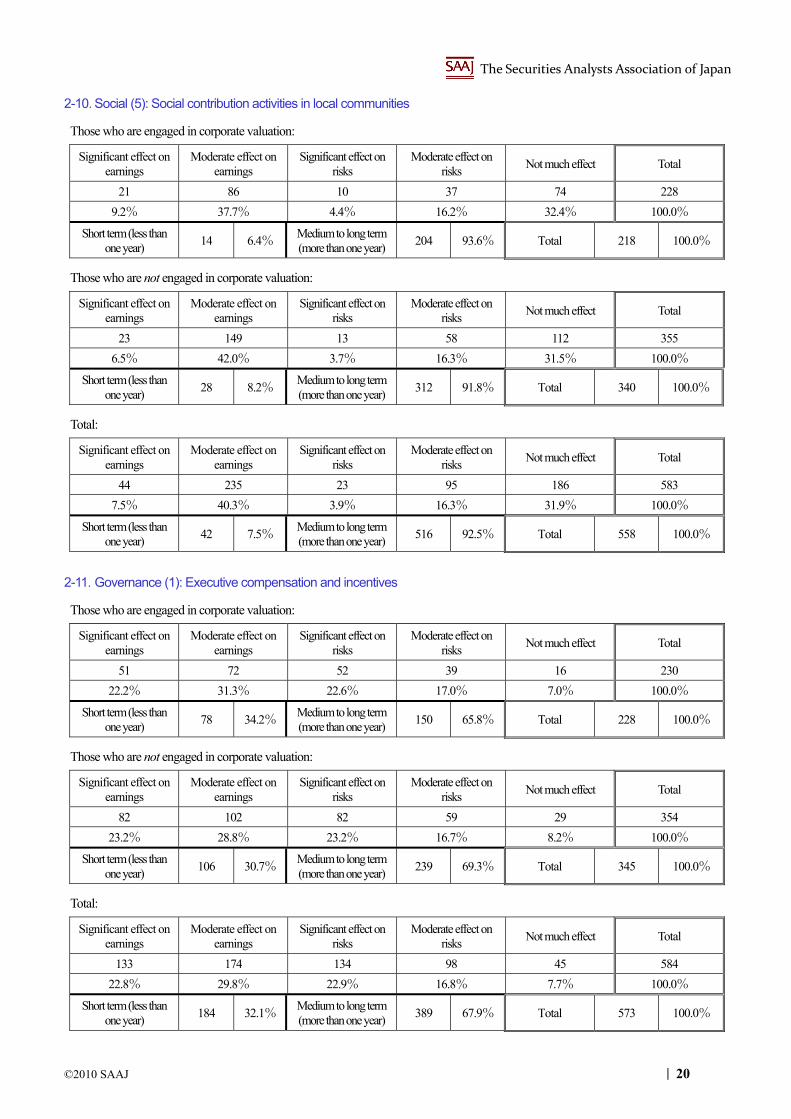
2-10. Social (5): Social contribution activities in local communities
Those who are engaged in corporate valuation:
Significant effect on earnings
Moderate effect on earnings
Significant effect on risks
Moderate effect on risks
Not much effect Total
21 86 10 37 74 228
9.2% 37.7% 4.4% 16.2% 32.4% 100.0%
Short term (less than one year)
14 6.4% Medium to long term (more than one year)
204 93.6% Total 218 100.0%
Those who are not engaged in corporate valuation:
Significant effect on earnings
Moderate effect on earnings
Significant effect on risks
Moderate effect on risks
Not much effect Total
23 149 13 58 112 355
6.5% 42.0% 3.7% 16.3% 31.5% 100.0%
Short term (less than one year)
28 8.2% Medium to long term (more than one year)
312 91.8% Total 340 100.0%
Total:
Significant effect on earnings
Moderate effect on earnings
Significant effect on risks
Moderate effect on risks
Not much effect Total
44 235 23 95 186 583
7.5% 40.3% 3.9% 16.3% 31.9% 100.0%
Short term (less than one year)
42 7.5% Medium to long term (more than one year)
516 92.5% Total 558 100.0%
2-11. Governance (1): Executive compensation and incentives
Those who are engaged in corporate valuation:
Significant effect on earnings
Moderate effect on earnings
Significant effect on risks
Moderate effect on risks
Not much effect Total
51 72 52 39 16 230
22.2% 31.3% 22.6% 17.0% 7.0% 100.0%
Short term (less than one year)
78 34.2% Medium to long term (more than one year)
150 65.8% Total 228 100.0%
Those who are not engaged in corporate valuation:
Significant effect on earnings
Moderate effect on earnings
Significant effect on risks
Moderate effect on risks
Not much effect Total
82 102 82 59 29 354
23.2% 28.8% 23.2% 16.7% 8.2% 100.0%
Short term (less than one year)
106 30.7% Medium to long term (more than one year)
239 69.3% Total 345 100.0%
Total:
Significant effect on earnings
Moderate effect on earnings
Significant effect on risks
Moderate effect on risks
Not much effect Total
133 174 134 98 45 584
22.8% 29.8% 22.9% 16.8% 7.7% 100.0%
Short term (less than one year)
184 32.1% Medium to long term (more than one year)
389 67.9% Total 573 100.0%

The Securities Analysts Association of Japan
21 | ©2010 SAAJ
2-12. Governance (2): Composition of board of directors
Those who are engaged in corporate valuation:
Significant effect on earnings
Moderate effect on earnings
Significant effect on risks
Moderate effect on earnings
Not much effect Total
32 39 58 67 34 230
13.9% 17.0% 25.2% 29.1% 14.8% 100.0%
Short term (less than one year)
37 16.5% Medium to long term (more than one year)
187 83.5% Total 224 100.0%
Those who are not engaged in corporate valuation:
Significant effect on earnings
Moderate effect on earnings
Significant effect on risks
Moderate effect on earnings
Not much effect Total
56 61 81 103 52 353
15.9% 17.3% 22.9% 29.2% 14.7% 100.0%
Short term (less than one year)
57 16.7% Medium to long term (more than one year)
285 83.3% Total 342 100.0%
Total:
Significant effect on earnings
Moderate effect on earnings
Significant effect on risks
Moderate effect on earnings
Not much effect Total
88 100 139 170 86 583
15.1% 17.2% 23.8% 29.2% 14.8% 100.0%
Short term (less than one year)
94 16.6% Medium to long term (more than one year)
472 83.4% Total 566 100.0%
3. Issues of Applying ESG Factors to Corporate Valuation
3-1. What do you think is necessary to increase use of EGS factors in corporate valuation? (Select all that apply.)
Those who are engaged in corporate valuation:
Improved corporate disclosure on ESG issues 146 64.6%
Clarified relationship between ESG factors and corporate performance 155 68.6%
Enhanced ESG research function in the organization [Go to Q3-1-2] 34 15.0%
Increased needs of clients for ESG considerations 58 25.7%
Other 12 5.3% Total 226 100.0%
Those who are not engaged in corporate valuation:
Improved corporate disclosure on ESG issues 225 66.6%
Clarified relationship between ESG factors and corporate performance 218 64.5%
Enhanced ESG research function in the organization [Go to Q3-1-2] 50 14.8%
Increased needs of clients for ESG considerations 114 33.7%
Other 12 3.6% Total 338 100.0%
Total:
Improved corporate disclosure on ESG issues 371 65.8%
Clarified relationship between ESG factors and corporate performance 373 66.1%
Enhanced ESG research function in the organization [Go to Q3-1-2] 84 14.9%
Increased needs of clients for ESG considerations 172 30.6%
Other 24 4.3% Total 564 100.0%
The Securities Analysts Association of Japan
©2010 SAAJ | 22
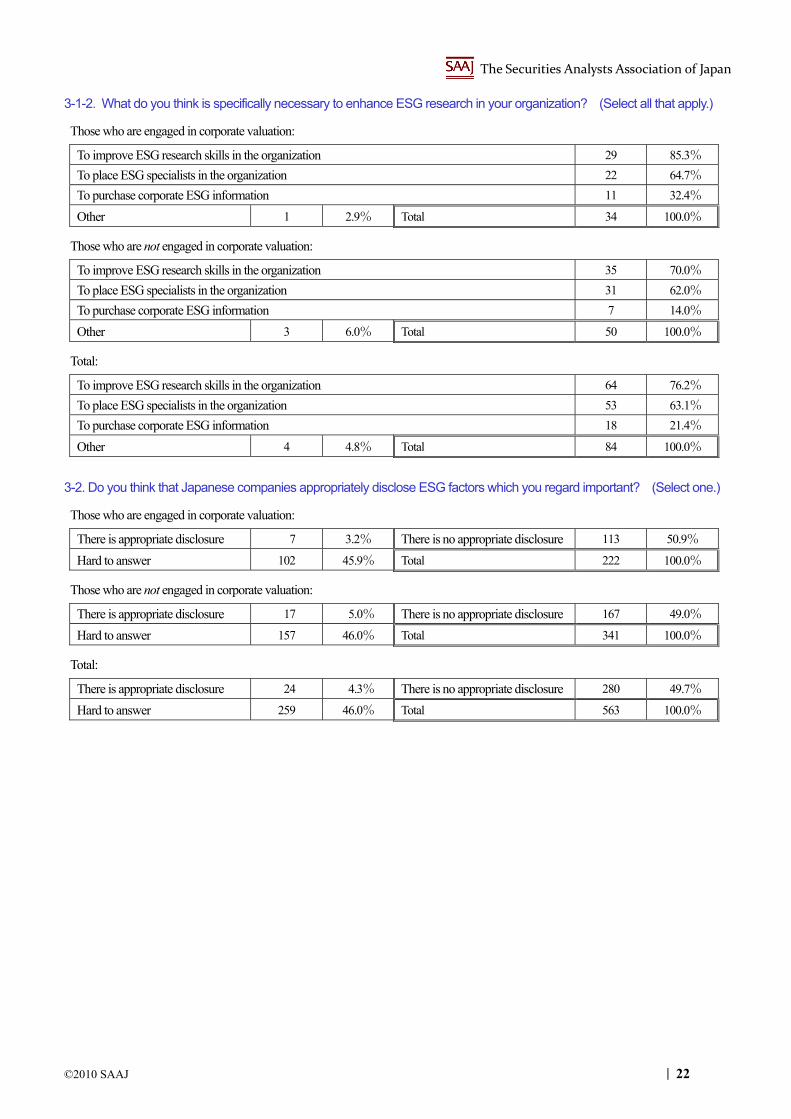
3-1-2. What do you think is specifically necessary to enhance ESG research in your organization? (Select all that apply.)
Those who are engaged in corporate valuation:
To improve ESG research skills in the organization 29 85.3%
To place ESG specialists in the organization 22 64.7%
To purchase corporate ESG information 11 32.4%
Other 1 2.9% Total 34 100.0%
Those who are not engaged in corporate valuation:
To improve ESG research skills in the organization 35 70.0%
To place ESG specialists in the organization 31 62.0%
To purchase corporate ESG information 7 14.0%
Other 3 6.0% Total 50 100.0%
Total:
To improve ESG research skills in the organization 64 76.2%
To place ESG specialists in the organization 53 63.1%
To purchase corporate ESG information 18 21.4%
Other 4 4.8% Total 84 100.0%
3-2. Do you think that Japanese companies appropriately disclose ESG factors which you regard important? (Select one.)
Those who are engaged in corporate valuation:
There is appropriate disclosure 7 3.2% There is no appropriate disclosure 113 50.9%
Hard to answer 102 45.9% Total 222 100.0%
Those who are not engaged in corporate valuation:
There is appropriate disclosure 17 5.0% There is no appropriate disclosure 167 49.0%
Hard to answer 157 46.0% Total 341 100.0%
Total:
There is appropriate disclosure 24 4.3% There is no appropriate disclosure 280 49.7%
Hard to answer 259 46.0% Total 563 100.0%

Authors of the Report
Working Group on ESG Factors in Corporate Valuation
Hiroshi Miyai, CMA, Chair Managing Director
Nikko Financial Intelligence, Inc.
Aiko Kozaki, CMA SRI Analyst, ESG Research Center
Japan Research Institute, Ltd.
Takafumi Sasaki, CMA Associate Professor of Finance
Tokyo University of Science
Megumi Terayama, CMA Senior Consultant
Mercer Japan Ltd.
Yasuhiro Yonezawa Professor
Graduate School of Finance, Accounting and Law
Waseda University
Other Contributor:
Yasuyuki Sugiura, CMA Nikko Financial Intelligence, Inc.
The Securities Analysts Association of Japan 5F, Tokyo Stock Exchange Building 2-1 Nihonbashi-Kabutocho, Chuo-ku, Tokyo 103-0026 Tel: +81-3-3666-1515 Email: [email protected] URL: www.saa.or.jp