behavioral factors in the valuation of employee … factors in the valuation of employee stock...
TRANSCRIPT
Behavioral Factors in the Valuation ofEmployee Stock Options∗
Jennifer N. CarpenterNew York University
Richard StantonU.C. Berkeley
Nancy WallaceU.C. Berkeley
November 16, 2012
∗Financial support from the Fisher Center for Real Estate and Urban Economics and the Societyof Actuaries is gratefully acknowledged. For helpful comments and suggestions, we thank WenxuanHou, Ulrike Malmendier, Kevin Murphy, Terry Odean, Jun Yang, David Yermack, and seminar par-ticipants at Cheung Kong Graduate School of Business, Erasmus University, Lancaster University,New York University, Oxford University, Peking University, Securities and Exchange Commission,Shanghai Advanced Institute of Finance, Temple University, Tilburg University, and Tsinghua Uni-versity. We thank Terrence Adamson at AON Consulting for providing some of the data used in thisstudy. We also thank Xing Huang for valuable research assistance. Please direct correspondenceto [email protected], [email protected], or [email protected].
Behavioral Factors in the Valuation ofEmployee Stock Options
Abstract
Options are a major component of corporate compensation and accounting methods signif-icantly affect allocations, yet valuation remains a challenge. We develop the first empiricalmodel of employee exercise suitable for valuation, and estimate the exercise rate as a functionof stock price and employee characteristics in the first sample of all employee exercises atover 100 firms. These characteristics significantly affect exercise behavior and cost, in waysthat Black-Scholes-based approximations used in practice fail to capture. For example, exer-cises are slower, and option cost greater, at firms with higher market correlation; top-decileoption holders within a firm exercise faster than lower-decile holders; and men exercise fasterthan women, resulting in 2–3% lower cost.
JEL classification: G14.
Employee stock options (ESOs) are a major component of corporate compensation and
a material cost to firms. Frydman and Jenter (2010) find that options represented 25% of
CEO pay in 2008, and the 2010 General Social Survey of the National Opinion Research
Center found that 9.3 million employees hold options. As a fraction of outstanding shares of
common stock, the median number of shares underlying outstanding options at S&P 1500
firms was 4.4% in 2010, with almost 1% of outstanding shares allocated to new option grants
annually, according to Equilar (2011). At the same time, accounting valuation methods for
ESOs significantly affect corporate decisions about compensation structure and allocation,
and thus affect both employee incentives and firm cost. For example, the 2005 change in
accounting valuation precipitated a decline in the granting of options from previous levels
and an increase in the allocation to top managers.1 Valuation methods for employee stock
options are therefore an important issue for investors.
ESO valuation remains a challenge in practice. The value of these long-maturity Ameri-
can options depends crucially on how employees exercise them, but because employees face
hedging constraints, standard option exercise theory does not apply. For example, employees
systematically exercise options on non-dividend-paying stocks well before expiration (see, for
example, Huddart and Lang, 1996; Bettis et al., 2005), and this substantially reduces their
cost to firms. Modifications to Black Scholes used for valuation in practice are inadequate
because they ignore key features of employee exercise patterns. At the same time, exist-
ing empirical descriptions of option exercise behavior based on OLS or hazard rate models,
such as Heath et al. (1999), Armstrong et al. (2007), and Klein and Maug (2011), are not
appropriate as an input for option valuation, as we shall show.
In this paper we develop the first empirical model of employee option exercise suitable for
valuation and apply it in a sample of all employee exercises at over 100 publicly traded firms
from 1981 to 2009 to show empirically how employee exercise patterns affect option cost to
firms. We develop a GMM-based methodology that is robust to both heteroskedasticity and
correlation across option exercises to estimate the rate of voluntary exercise as a function
of the stock price path and of firm, contract, and option-holder characteristics. We show
that these characteristics significantly affect exercise behavior, in a manner consistent with
both portfolio theory and results from the behavioral literature, such as those in Barber
and Odean (2001). We use the estimated exercise function to value options and show that
these characteristics also materially affect option value. For example, men exercise options
significantly faster than women, resulting in 2–3% lower option value, and exercise rates are
1Equilar (2011) reports that the median number of shares underlying outstanding options at S&P 1500firms fell from 6.1% in 2006 and to 4.4% in 2010, while the fraction of options allocated to CEOs and namedexecutives rose from 21% to 26%.
1
significantly lower when a firm’s stock return correlation with the market is higher, resulting
in greater option cost.
Our proprietary dataset is the first in the academic literature to contain all employee
exercises at a large number of firms.2 Since estimation of exercise behavior requires a large
sample of stock price paths, and thus a large number of firms, our paper is the first that can
investigate differential option exercise patterns and option cost across top and lower-ranked
employees. To the extent that options are granted where their performance incentives have
greatest benefit, large option holders within a firm are likely to be the key decision makers.
We find that top-decile option holders exercise faster than lower-decile holders within a given
firm, and consequently their options are typically worth 2–3% less. Similarly, in a subsample
with data on employee titles, senior executives exercise faster than lower-ranked executives.
The propensity of top employees to exercise faster may stem from their greater exposure
to undiversifiable firm risk, which can have a theoretically important effect on the exercise
decision (see, for example, Hall and Murphy, 2002; Ingersoll, 2006; Carpenter et al., 2010).
Wealth differences may also play a role. Option compensation delivers both wealth, which
would reduce the propensity of an employee (with decreasing absolute risk aversion) to
exercise options early, and risk, which would increase the early-exercise rate. We attempt to
disentangle these effects by including in our estimation proxies for both wealth and stock-
based risk. Consistent with portfolio theory, we find that portfolio risk increases the exercise
rate and wealth decreases it. At the same time, the employee rank effect remains even when
we control for the risk of the employee’s option portfolio, perhaps reflecting top employees’
use of preplanned exercise policies under SEC rule 10b5-1, which shields against prosecution
for insider trading. It may also reflect their greater exposure of human capital to firm
risk, interactions of option value with corporate decision making, more volatile corporate
information flow, overconfidence, or other psychological factors.
In our estimation we also find that the rate of voluntary option exercise is positively
related to the level of the stock price and the imminence of a dividend, and negatively
related to stock-return volatility and option time to expiration, consistent with standard
option theory. In addition, the exercise rate is higher when the stock price is in the 90th
percentile of its distribution over the past year or in the two weeks after a vesting date,
consistent with employees’ use of cognitive benchmarks in decision making.
To assess the economic impact of the sensitivity of employee exercise rates to volatility
and dividends, we compare option values calculated using the estimated exercise function
with option values from Black Scholes approximations, which account for volatility and div-
2For example, the samples of Heath et al. (1999) and Armstrong et al. (2007) contain only seven and tenfirms, respectively, while the sample of Klein and Maug (2011) contains only top executives.
2
idend effects in the stock price process, but not in exercise behavior. We consider both
traditional Black Scholes and Black Scholes with option expiration set equal to the average
of the vesting date and stated expiration date, which is an approximation permitted by the
Financial Accounting Standards Board in SAB 110 for firms with limited option exercise
data. The pricing errors are large and vary systematically with firm and option charac-
teristics, highlighting the importance of properly accounting for the dependence of exercise
behavior on these characteristics.
In practice, most firms use the Modified Black Scholes method, permitted by FAS 123R,
in which the option expiration date is set equal to the option’s expected term. This expected
term has to be estimated, which entails significant error since option outcomes depend on a
firm’s stock price path and a given firm has option data based only on its own realized stock
price path. We show, moreover, that even without error in the estimation of the option’s
expected term, this method creates systematic biases. In particular, we calculate the option’s
expected term exactly from the estimated exercise function to get the Modified Black Scholes
value and show that the approximation error still varies widely and systematically with firm,
option, and option-holder characteristics. Firms frequently need to revalue old options in
the event of a corporate or compensation plan restructuring. We find that the Modified
Black Scholes approximation errors are even larger for out-of-the-money options than for
at-the-money options, underscoring the need for a more robust valuation methodology.
Our data are provided by corporate participants in a sponsored research project funded
by the Society of Actuaries in response to regulatory calls for improved ESO valuation meth-
ods. The Financial Accounting Standards Board’s SAB 110, p.6, states a clear expectation
that “more detailed external information about exercise behavior will, over time, become
readily available to companies.” This paper responds to FASB’s call by providing the first
comprehensive analysis of exercise behavior and its implications for valuation.
The paper proceeds as follows. Section 1 reviews the related literature. Section 2 first
describes the theoretical foundation and then develops an empirical model of employee ex-
ercise that is both flexible enough to capture observed exercise behavior and suitable as a
basis for option valuation. Section 3 describes the sample of proprietary data on employee
options. Section 4 contains estimation results for the empirical exercise function. Section 5
presents estimates of option cost and approximation errors of current valuation methods,
and Section 6 concludes.
3
1 Previous Literature
The principles of employee option valuation and the need to study exercise behavior are
well understood. One approach taken in the literature is to model the exercise decision
theoretically. The employee chooses an option exercise policy as part of a greater utility-
maximization problem that includes other decisions, such as portfolio, consumption, and
effort choice, and this typically leads to some early exercise for the purpose of diversification.
Papers that develop utility-maximizing models and then calculate the implied cost of options
to shareholders include Huddart (1994), Detemple and Sundaresan (1999), Ingersoll (2006),
Leung and Sircar (2009), Grasselli and Henderson (2009), and Carpenter et al. (2010).
Combining theory and data, papers such as Carpenter (1998) and Bettis et al. (2005)
calibrate utility-maximizing models to mean exercise times and stock prices in the data,
and then infer option value. However, these papers provide no formal estimation and the
approach relies on the validity of the utility-maximizing models used. Huddart and Lang
(1996), Heath et al. (1999), and Klein and Maug (2011) provide more flexible empirical
descriptions of option exercise patterns, but do not go as far as option valuation. Armstrong
et al. (2007) perform a valuation based on a hazard model of the exercise of option grants, but
this specification is inappropriate for valuation because employees exercise random fractions
of outstanding option grants.
A number of analytic methods for approximating employee option value have also been
proposed. FAS 123R permits using the Black Scholes formula with the expiration date re-
placed by the option’s expected life and SAB 110 permits using Black Scholes with expiration
replaced by the average of the contractual vesting date and expiration date. Jennergren and
Naslund (1993), Carr and Linetsky (2000), and Cvitanic et al. (2008) derive analytic formulas
for option value assuming exogenously specified exercise boundaries and stopping rates. Hull
and White (2004) propose a model in which exercise occurs when the stock price reaches an
exogenously specified multiple of the stock price and forfeiture occurs at an exogenous rate.
However, until the accuracy of these methods can be determined, their usefulness cannot be
assessed.
2 Modeling Exercise Behavior
This section first describes the theoretical foundation for modeling employee-exercise behav-
ior and then develops an empirical model that is both flexible enough to capture observed
exercise behavior and suitable as a basis for option valuation.
4
2.1 Theoretical Foundation
In the standard theory of American-option exercise, the option holder chooses a policy to
maximize option value, and for an ordinary American call on a stock in a Black Scholes
framework, the value-maximizing policy is described by a critical stock price, above which
it is optimal to exercise and below which it is optimal to continue holding the option. The
critical stock price is increasing in the time to expiration, the stock return volatility, and the
interest rate, and decreasing in the dividend rate (see, for example, Kim, 1990). However,
employee stock options are nontransferable and employees face hedging constraints, so in
order to diversify away from excessive stock price exposure, employees may exercise options
early. A number of papers rationalize this behavior in models of employee-option exercise in
which the option holder chooses a policy to maximize expected utility, subject to constraints
on selling the option and the underlying stock. These include Huddart (1994), Detemple
and Sundaresan (1999), Ingersoll (2006), Leung and Sircar (2009), Grasselli and Henderson
(2009), and Carpenter et al. (2010). For example, Carpenter et al. (2010) model a risk-averse
employee who chooses both an exercise policy for his options and a dynamic trading strategy
in the market and riskless asset for his outside wealth to maximize expected utility. They
show in particular that the optimal exercise policy need not be characterized by a single
critical stock-price boundary (though it is for certain utility functions, including constant
relative risk aversion). They also show either analytically or numerically how the critical
stock price (or, more generally, the employee’s continuation region) varies with employee risk
aversion and wealth and with the stock-return volatility, dividend rate, and the correlation
between the stock return and the market return. For example, the continuation region is
smaller if the employee has greater absolute risk aversion and thus is larger with greater
employee wealth if he has decreasing absolute risk aversion. In addition, the continuation
region is smaller the greater the dividend rate. In numerical examples with constant-relative-
risk-averse utility, the critical stock price is increasing in the correlation between the stock
return and the market return (in the region of positive correlation) because the more the
option risk can be hedged in the outside portfolio, the more attractive the option position
becomes. On the other hand, the effect of greater volatility or longer time to expiration is
ambiguous, because of the conflicting effects of employee risk aversion and the convexity of
the option payoff.
2.2 Empirical Model and Estimation Methodology
Although the structural models in the theoretical literature provide guidance, a more flex-
ible, reduced-form model is necessary to capture the complexities of real employee-exercise
5
patterns. It seems natural to use hazard rates to model the exercise of employee stock op-
tions, since they have often been used in the finance literature to model apparently similar
events, such as mortgage prepayment (see Schwartz and Torous, 1989) and corporate-bond
default (see, for example, Duffie and Singleton, 1999). However, whereas it makes sense
to think of the prepayment of one mortgage as independent of the prepayment of another,
conditional on the level of interest rates, ESOs are typically exercised in blocks. As a result,
the exercise of one option in a given grant held by an individual is extremely highly cor-
related with the exercise of another option in the same grant held by the same individual.
It is also quite highly correlated with the exercise of options in other grants held by the
same individual. This high degree of correlation between options makes it difficult to use
standard econometric techniques, which assume independence between events, to estimate
hazard rates at the individual option level.3 Armstrong et al. (2007) use a hazard rate to
model exercise of an entire grant of options above some threshold fraction, but this throws
away important information about the exact fraction of the grant exercised. In practice,
fractional exercise is both prevalent and highly variable (see Huddart and Lang, 1996), so
this approach is unusable for valuation.
A solution to these problems is to abandon the hazard rate approach altogether and
instead to model the fraction of each grant exercised each period. Heath et al. (1999) follow
this approach, regressing the fraction of each grant exercised against various explanatory
variables. However, their regression approach is also problematic. In particular, it may
generate expected exercise fractions that are negative or greater than one, both of which
cause problems for valuation.4 Heath et al. (1999) also aggregate across individuals, thus
discarding potentially important information about the differences in exercise behavior across
individuals, and introducing correlation across exercises of the aggregated grants.
Like Heath et al. (1999), we also model the fraction of each grant exercised by each
holder each period, but we do so in a manner that generates consistent estimates of expected
exercise rates, which are guaranteed to be between zero and one, while explicitly handling the
correlation between option exercises within and between different grants held by the same
individual. Our approach, based on the fractional-logistic approach of Papke and Wooldridge
3This issue also arises in modeling corporate-bond default. One popular solution, when the number offirms involved is small, has been to use “copula functions,” which explicitly model this correlation (see,for example, Li, 2001). However, in our case the number of options (and hence the number of correlationcoefficients) is too high to be feasible.
4Attempting to remedy this by truncating the variables, will lead to biases. Transforming the proportion
exercised, such as by using a logistic transformation log(
y1−y
), which can take on any value between −∞
and +∞ is also problematic. By Jensen’s inequality, the expected proportion exercising is not just the inversetransformation of the expected transformed proportion. More important, this approach cannot handle thenumerous dates on which no options are exercised at all.
6
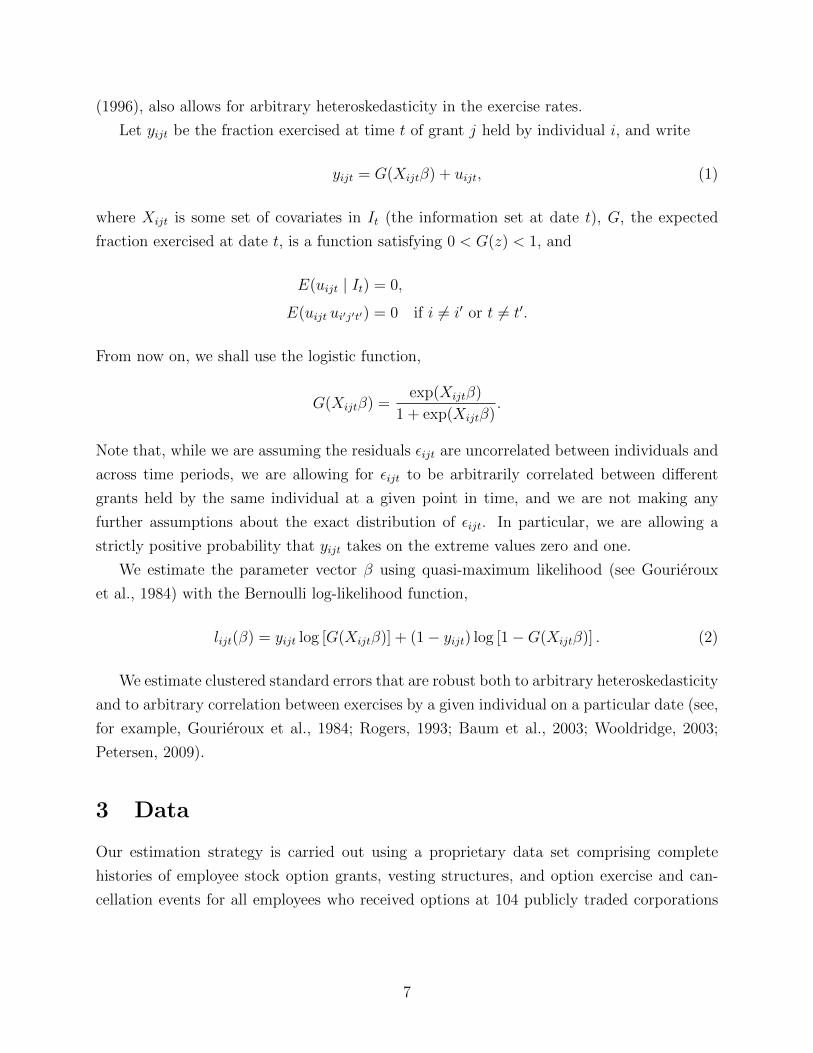
(1996), also allows for arbitrary heteroskedasticity in the exercise rates.
Let yijt be the fraction exercised at time t of grant j held by individual i, and write
yijt = G(Xijtβ) + uijt, (1)
where Xijt is some set of covariates in It (the information set at date t), G, the expected
fraction exercised at date t, is a function satisfying 0 < G(z) < 1, and
E(uijt | It) = 0,
E(uijt ui′j′t′) = 0 if i 6= i′ or t 6= t′.
From now on, we shall use the logistic function,
G(Xijtβ) =exp(Xijtβ)
1 + exp(Xijtβ).
Note that, while we are assuming the residuals εijt are uncorrelated between individuals and
across time periods, we are allowing for εijt to be arbitrarily correlated between different
grants held by the same individual at a given point in time, and we are not making any
further assumptions about the exact distribution of εijt. In particular, we are allowing a
strictly positive probability that yijt takes on the extreme values zero and one.
We estimate the parameter vector β using quasi-maximum likelihood (see Gourieroux
et al., 1984) with the Bernoulli log-likelihood function,
lijt(β) = yijt log [G(Xijtβ)] + (1− yijt) log [1−G(Xijtβ)] . (2)
We estimate clustered standard errors that are robust both to arbitrary heteroskedasticity
and to arbitrary correlation between exercises by a given individual on a particular date (see,
for example, Gourieroux et al., 1984; Rogers, 1993; Baum et al., 2003; Wooldridge, 2003;
Petersen, 2009).
3 Data
Our estimation strategy is carried out using a proprietary data set comprising complete
histories of employee stock option grants, vesting structures, and option exercise and can-
cellation events for all employees who received options at 104 publicly traded corporations
7
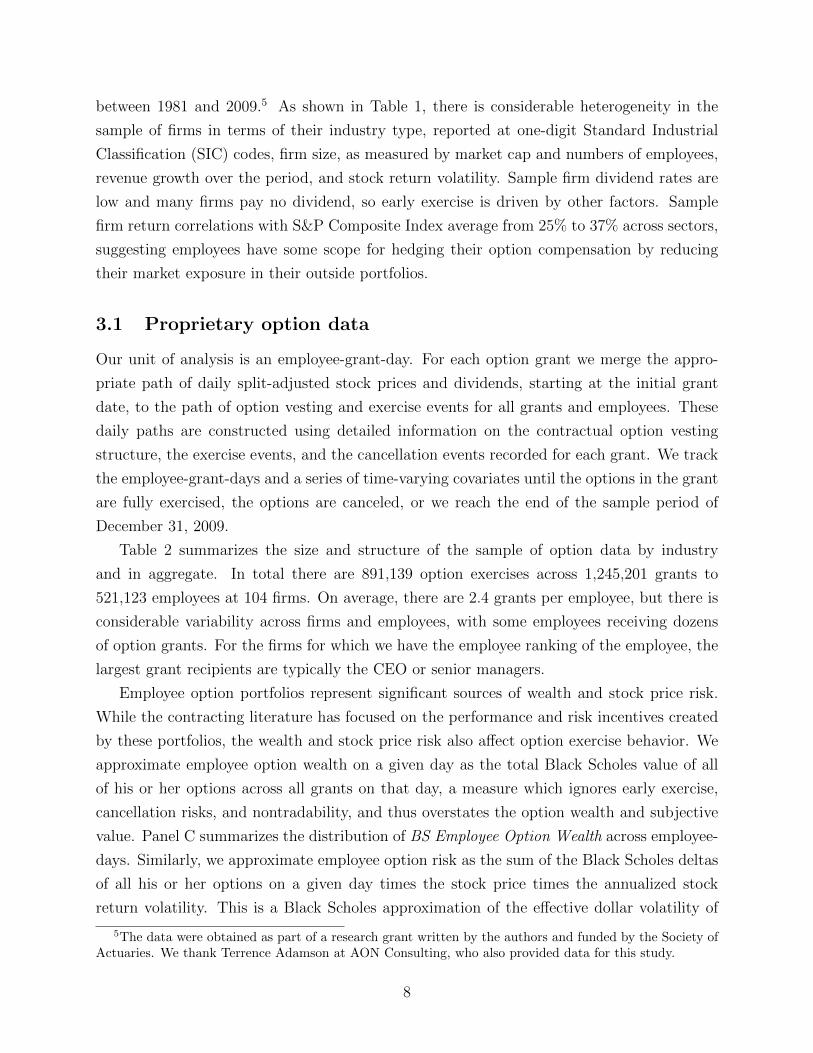
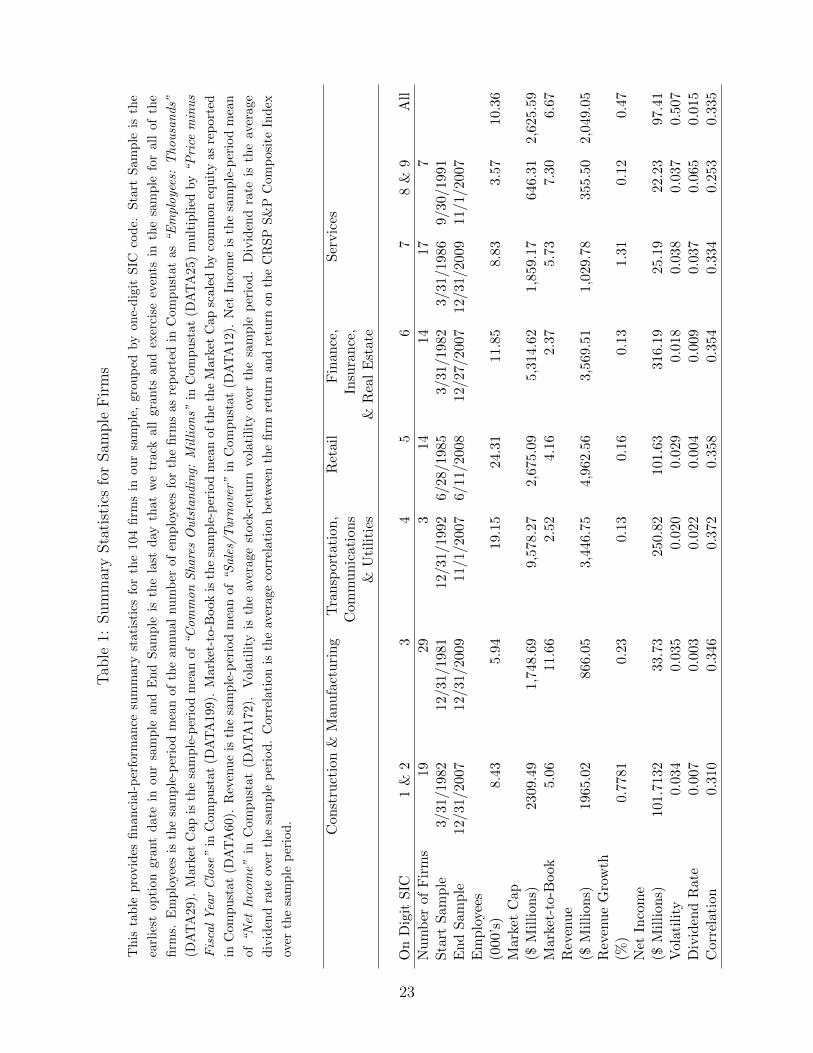
between 1981 and 2009.5 As shown in Table 1, there is considerable heterogeneity in the
sample of firms in terms of their industry type, reported at one-digit Standard Industrial
Classification (SIC) codes, firm size, as measured by market cap and numbers of employees,
revenue growth over the period, and stock return volatility. Sample firm dividend rates are
low and many firms pay no dividend, so early exercise is driven by other factors. Sample
firm return correlations with S&P Composite Index average from 25% to 37% across sectors,
suggesting employees have some scope for hedging their option compensation by reducing
their market exposure in their outside portfolios.
3.1 Proprietary option data
Our unit of analysis is an employee-grant-day. For each option grant we merge the appro-
priate path of daily split-adjusted stock prices and dividends, starting at the initial grant
date, to the path of option vesting and exercise events for all grants and employees. These
daily paths are constructed using detailed information on the contractual option vesting
structure, the exercise events, and the cancellation events recorded for each grant. We track
the employee-grant-days and a series of time-varying covariates until the options in the grant
are fully exercised, the options are canceled, or we reach the end of the sample period of
December 31, 2009.
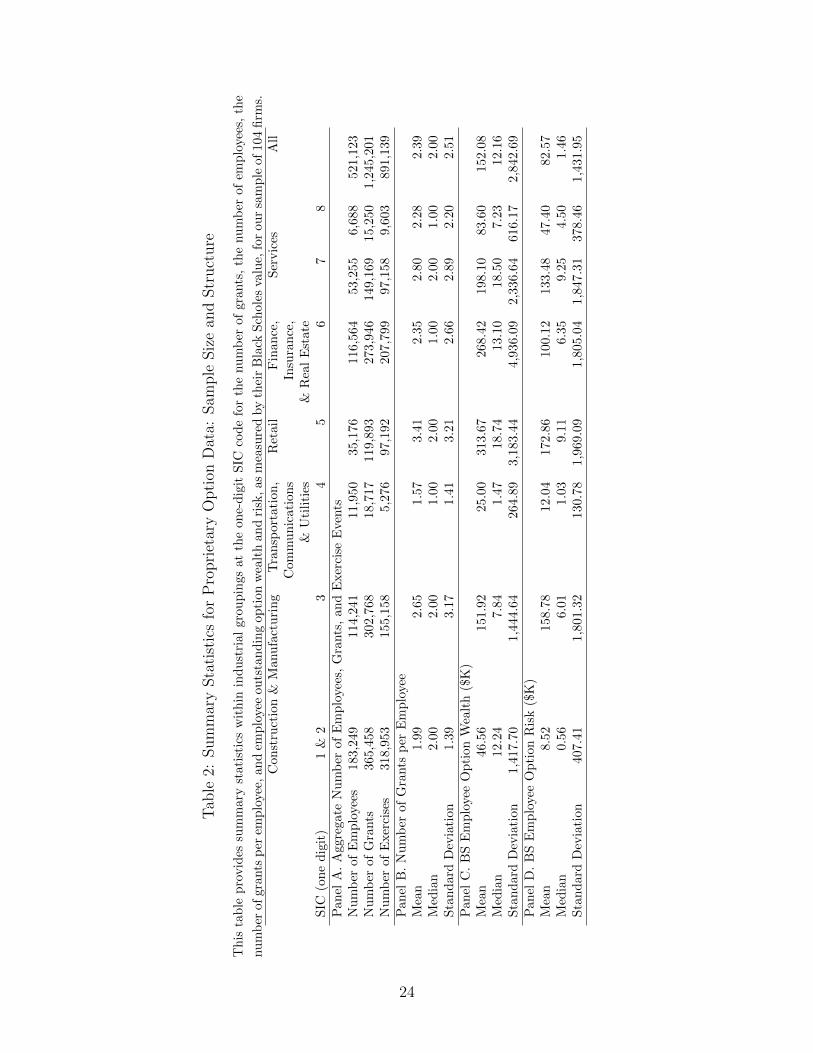
Table 2 summarizes the size and structure of the sample of option data by industry
and in aggregate. In total there are 891,139 option exercises across 1,245,201 grants to
521,123 employees at 104 firms. On average, there are 2.4 grants per employee, but there is
considerable variability across firms and employees, with some employees receiving dozens
of option grants. For the firms for which we have the employee ranking of the employee, the
largest grant recipients are typically the CEO or senior managers.
Employee option portfolios represent significant sources of wealth and stock price risk.
While the contracting literature has focused on the performance and risk incentives created
by these portfolios, the wealth and stock price risk also affect option exercise behavior. We
approximate employee option wealth on a given day as the total Black Scholes value of all
of his or her options across all grants on that day, a measure which ignores early exercise,
cancellation risks, and nontradability, and thus overstates the option wealth and subjective
value. Panel C summarizes the distribution of BS Employee Option Wealth across employee-
days. Similarly, we approximate employee option risk as the sum of the Black Scholes deltas
of all his or her options on a given day times the stock price times the annualized stock
return volatility. This is a Black Scholes approximation of the effective dollar volatility of
5The data were obtained as part of a research grant written by the authors and funded by the Society ofActuaries. We thank Terrence Adamson at AON Consulting, who also provided data for this study.
8
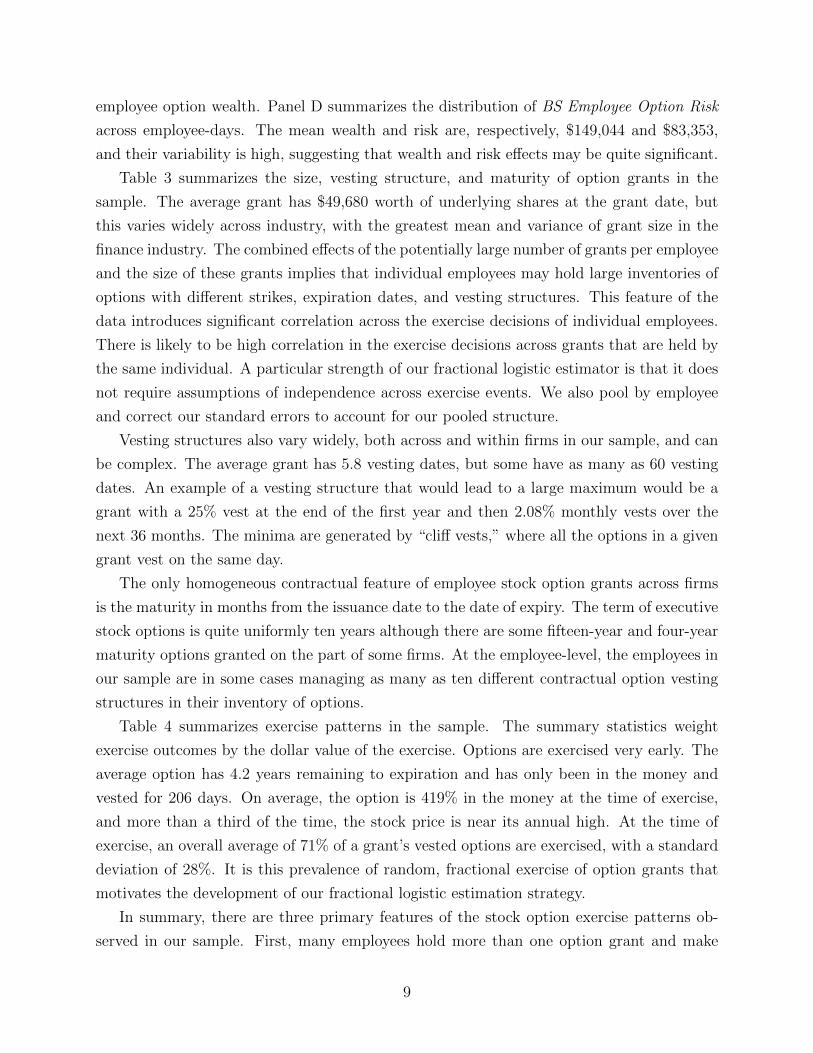
employee option wealth. Panel D summarizes the distribution of BS Employee Option Risk
across employee-days. The mean wealth and risk are, respectively, $149,044 and $83,353,
and their variability is high, suggesting that wealth and risk effects may be quite significant.
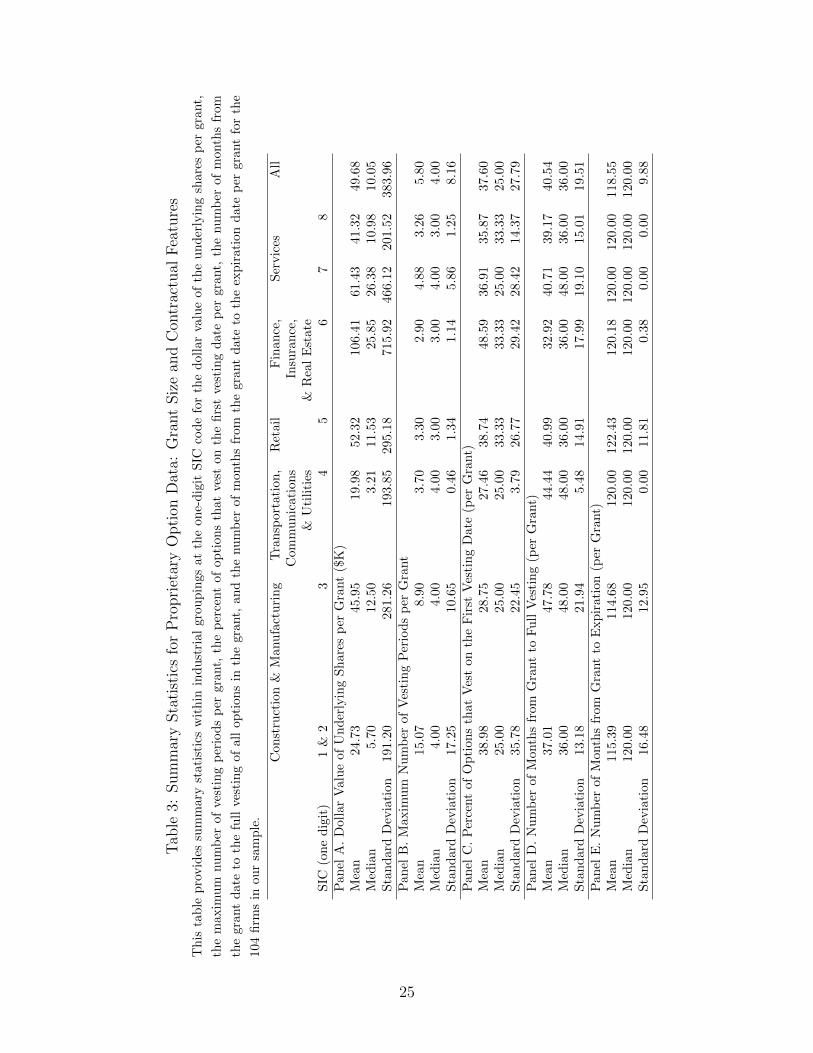
Table 3 summarizes the size, vesting structure, and maturity of option grants in the
sample. The average grant has $49,680 worth of underlying shares at the grant date, but
this varies widely across industry, with the greatest mean and variance of grant size in the
finance industry. The combined effects of the potentially large number of grants per employee
and the size of these grants implies that individual employees may hold large inventories of
options with different strikes, expiration dates, and vesting structures. This feature of the
data introduces significant correlation across the exercise decisions of individual employees.
There is likely to be high correlation in the exercise decisions across grants that are held by
the same individual. A particular strength of our fractional logistic estimator is that it does
not require assumptions of independence across exercise events. We also pool by employee
and correct our standard errors to account for our pooled structure.
Vesting structures also vary widely, both across and within firms in our sample, and can
be complex. The average grant has 5.8 vesting dates, but some have as many as 60 vesting
dates. An example of a vesting structure that would lead to a large maximum would be a
grant with a 25% vest at the end of the first year and then 2.08% monthly vests over the
next 36 months. The minima are generated by “cliff vests,” where all the options in a given
grant vest on the same day.
The only homogeneous contractual feature of employee stock option grants across firms
is the maturity in months from the issuance date to the date of expiry. The term of executive
stock options is quite uniformly ten years although there are some fifteen-year and four-year
maturity options granted on the part of some firms. At the employee-level, the employees in
our sample are in some cases managing as many as ten different contractual option vesting
structures in their inventory of options.
Table 4 summarizes exercise patterns in the sample. The summary statistics weight
exercise outcomes by the dollar value of the exercise. Options are exercised very early. The
average option has 4.2 years remaining to expiration and has only been in the money and
vested for 206 days. On average, the option is 419% in the money at the time of exercise,
and more than a third of the time, the stock price is near its annual high. At the time of
exercise, an overall average of 71% of a grant’s vested options are exercised, with a standard
deviation of 28%. It is this prevalence of random, fractional exercise of option grants that
motivates the development of our fractional logistic estimation strategy.
In summary, there are three primary features of the stock option exercise patterns ob-
served in our sample. First, many employees hold more than one option grant and make
9
exercise decisions over more than one vested option at any given time. For this reason,
estimation strategies must account for the correlated decision structure of employee option
exercise. Second, both the contractual vesting structure and the exogenous price paths
appear to have strong effects on option exercise patterns. Thus careful controls for daily
realizations of both features must be included in a successful estimation strategy. Finally,
many option positions are exercised fractionally, that is, the proportion of the outstanding
options that are exercised at exercise events can be substantially less than one. For this
reason, a successful econometric methodology must account for path-dependent fractional
exercise behavior if it is to avoid yielding significant misspecification bias and inaccurate
forecasts of exercise timing.
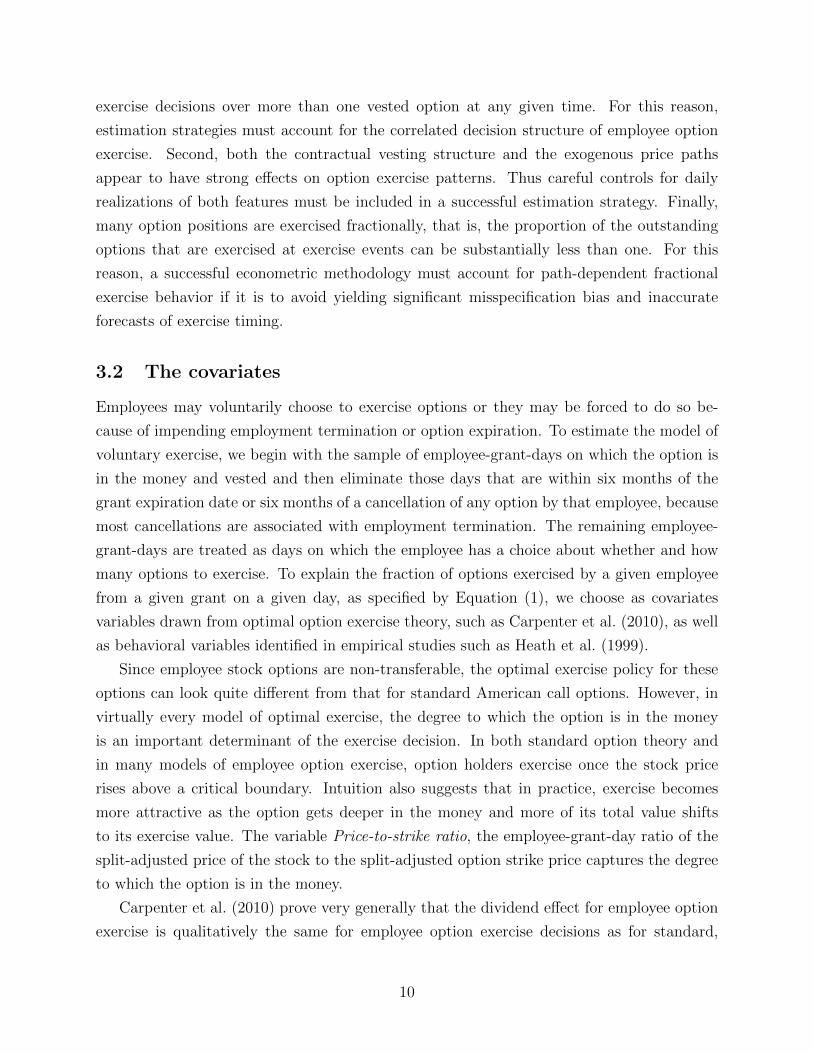
3.2 The covariates
Employees may voluntarily choose to exercise options or they may be forced to do so be-
cause of impending employment termination or option expiration. To estimate the model of
voluntary exercise, we begin with the sample of employee-grant-days on which the option is
in the money and vested and then eliminate those days that are within six months of the
grant expiration date or six months of a cancellation of any option by that employee, because
most cancellations are associated with employment termination. The remaining employee-
grant-days are treated as days on which the employee has a choice about whether and how
many options to exercise. To explain the fraction of options exercised by a given employee
from a given grant on a given day, as specified by Equation (1), we choose as covariates
variables drawn from optimal option exercise theory, such as Carpenter et al. (2010), as well
as behavioral variables identified in empirical studies such as Heath et al. (1999).
Since employee stock options are non-transferable, the optimal exercise policy for these
options can look quite different from that for standard American call options. However, in
virtually every model of optimal exercise, the degree to which the option is in the money
is an important determinant of the exercise decision. In both standard option theory and
in many models of employee option exercise, option holders exercise once the stock price
rises above a critical boundary. Intuition also suggests that in practice, exercise becomes
more attractive as the option gets deeper in the money and more of its total value shifts
to its exercise value. The variable Price-to-strike ratio, the employee-grant-day ratio of the
split-adjusted price of the stock to the split-adjusted option strike price captures the degree
to which the option is in the money.
Carpenter et al. (2010) prove very generally that the dividend effect for employee option
exercise is qualitatively the same for employee option exercise decisions as for standard,
10
transferable options. That is, a higher dividend makes early exercise more attractive, all
else equal. The variable Dividend in next two weeks is the product of an indicator that a
dividend will be paid within the next 14 calendar days and the ratio of the dividend payment
to the current stock price.
The theoretical effect of higher stock return volatility on the exercise decision is more
complicated for employee options than the simple negative effect from standard theory.
Employee risk aversion and the convexity of the option payoff have offsetting effects on
employees’ attitudes toward volatility, and the net effect is an open empirical question. The
variable Volatility is the annualized daily volatility estimated from the stock return over the
66 trading days prior to the given employee-grant-day.
Unlike in standard theory, the degree to which the employee can hedge the option position
in an outside portfolio is an important theoretical determinant of the exercise decision, and
Carpenter et al. (2010) and others have shown that the higher the correlation between the
stock return and the return on a tradable asset, the lower the propensity to exercise early.
The variable Correlation is the correlation between the stock return and the return on the
S&P 500 Composite Index estimated from daily returns over the three months prior to the
given employee-grant-day.
The theoretical effect of more time to expiration on the exercise decision can also be more
complicated for employee options than the simple negative effect from standard theory, and
is thus also an open empirical question. The variable Time to expiration is the number of
calendar days from the given employee-grant-day to the expiration date of the grant, divided
by 365.
Recent empirical studies of employee stock option exercise report links between behavioral
indicators, or “rules of thumb,” that employees appear to rely upon in making their option
exercise decisions. Armstrong et al. (2007) find a statistically significant association between
the timing of vesting events and option exercise. They argue that recent exercise events both
mechanically affect an employees’ ability to exercise their options and may also serve as a
periodic reminder to employees to evaluate the value of their option positions. Heath et al.
(1999) and Armstrong et al. (2007) also find a statistically significant positive association
between option exercise and the occurrence of the current stock price exceeding the 90th
percentile of the past year’s price distribution. They argue that this association is driven by
cognitive benchmarks that employees use in their decision rules. Given the importance of
these variables in prior studies, we also include them as controls in all of our specifications.
To capture the vesting structure of the grant, the variable Vesting event in past two weeks
indicates whether the given employee-grant-day is within 2 weeks since a vesting date for
that grant. Our cognitive benchmark proxy is the variable Price ≥ 90th percentile of prior
11
year distribution, which indicates whether the current stock price is greater than or equal to
90th percentile of the stock price distribution over the prior year of trading.
Barber and Odean (2001) find significant differences in the trading patterns of men and
women, with men the more frequent traders. For 69 firms in our sample, we have information
on the age and gender of the employee. Table 5 shows that the average employee is 42 years
old and 56% of employees are male. The variable Male indicates whether or not the option
holder is male.
Our sample is the first to contain both a large number of firms and all employees at those
firms. To examine differences in exercise patterns across the ranks, we proxy for employee
rank with Top-decile option holder, an indicator of whether the employee is in the top decile
of option holders at the firm, sorted by the total Black Scholes value of their vested option
holdings at the beginning of the quarter. To the extent that options are granted where their
performance incentives will have greatest benefit, top-decile option holders are likely to be
key decision makers at the firm. For 38 firms in our sample, we also have employee titles.
The variable Senior indicates whether the employee is designated as a senior executive.
Employee wealth and undiversifiable portfolio risk can also have a theoretically impor-
tant effect on the exercise decision (see, for example, Hall and Murphy, 2002; Ingersoll, 2006;
Carpenter et al., 2010). The challenge is in disentangling these effects. Stock-based com-
pensation delivers both wealth, which would reduce the propensity of an employee (with
decreasing absolute risk aversion) to exercise options early, and risk, which would increase
the early exercise rate. We attempt to disentangle these effects by including in our estima-
tion both a proxy for employee wealth and a proxy for employee stock-based risk. For the
full sample, we have BS Employee Option Wealth, the Black Scholes value of the employee
option portfolio, and BS Employee Option Risk, the Black Scholes dollar volatility of the
option portfolio. For nine firms in the sample, we have information about employee salary,
which may also proxy for employee wealth. Table 5 shows that the mean salary in this
subsample is $283,785.
4 Estimation Results
We estimate ten alternative specifications of Equation (1). One uses a base set of covariates,
one adds Gender and Age to the base set, one adds Top-decile option holder, one adds
BS Employee Option Wealth and BS Employee Option Risk, and one adds Salary and BS
Employee Option Risk. For each of these five, we show results with and without one-digit
SIC industry fixed effects. Table 6 reports coefficients and standard errors. The estimators
cluster at the level of the individual employee.
12
As Table 6 shows, the results for the base covariates are strikingly similar across all
specifications, and robust to the inclusion of fixed effects. The parameter estimates are
strongly consistent with the predictions of optimal exercise theory, and also support several
of the leading conclusions of the behavioral finance literature. The rate of voluntary option
exercise is strongly positively related to the level of the stock price, as expected. Exercise
rates are also generally significantly higher when a dividend payment is imminent. Also in
line with the theory of employee option exercise, exercise rates are consistently lower when
the stock return is more highly correlated with S&P Composite Index, so that a greater
fraction of the stock risk can be hedged with reductions in exposure to the market portfolio.
As discussed above, Carpenter et al. (2010) show that stock return volatility and time
to expiration do not have clearly signed theoretical effects on an employee’s optimal exercise
policy, so the empirical effects are an open question. The results reported in Table 6 indicate
that increased levels of stock return volatility and more time to expiration are associated
with smaller fractions of options exercised, which is consistent with the theory for ordinary
American options.
Table 6 also shows that employees exercise a significantly larger fraction of outstanding
options when the stock price is greater than or equal to the 90th percentile of its distribution
over the prior calendar year6 and in the two weeks following a vesting date of the grant in
question. These results are consistent with Heath et al. (1999), Armstrong et al. (2007) and
Klein and Maug (2011), and support the idea that employees tie their exercise decisions to
cognitive benchmarks as a means of reducing monitoring costs.
Based on the subsample of firms for which information on age and gender are available,
specifications 3 and 4, the results in Table 6 indicate that male employees have a greater
propensity to exercise their options than female employees, and older employees are less
likely to exercise options early. These results appear to be inconsistent with the notion that
women and older people are more risk averse. However, they add support to the notion that
men are more over-confident (see, for example, Barber and Odean, 2001).
Table 6 also shows that top-decile option holders exercise faster than lower-decile option
holders. This might be because of the greater exposure of their wealth and human capital to
undiversifiable firm risk. Though Male and Top-decile option holder are positively correlated,
we confirm in unreported results that the gender and top-decile effects are distinct, using
specifications that include both dummies and their interaction. Finally, in the subsample of
38 firms for which we have employee titles, we replace Top-decile option holder with Senior
and find very similar results, confirming the validity of Top-decile option holder as a proxy
for high rank.
6This result is robust to the inclusion of the square of Price-to-strike ratio as an explanatory variable.
13
Top-decile holders are obviously likely to have both high wealth and high exposure to
firm risk, and these portfolio characteristics have theoretically important effects. In partic-
ular, holding all else equal, employee wealth decreases the propensity to exercise, assuming
decreasing absolute risk aversion, and undiversifiable exposure to the stock price increases it.
The challenge is in finding empirical proxies for these portfolio characteristics. To disentan-
gle these portfolio effects using our full sample of employees, we proxy for employee wealth
and portfolio risk using BS Employee Wealth, the total Black Scholes value of the employee’s
option portfolio, and BS Employee Risk, the total Black Scholes delta of the employee’s op-
tion portfolio times the dollar volatility of the stock price. For the subsample of nine firms
for which we have salary data, we use Salary to proxy for employee wealth. Specifications
5 through 8 of Table 6 test for these portfolio risk and wealth effects in exercise decisions.
The results are broadly consistent with the hypothesis that employee risk exposure increases
the propensity to exercise early, and employee wealth decreases it. The BS Employee Option
Risk has either a significantly positive coefficient or a zero coefficient. The coefficients on
the proxies for wealth are significantly negative in three out of four cases.
In unreported results, we find that even after controlling for portfolio risk, top-ranked
employees exercise faster than lower-ranked employees. This may be because top employees
use preplanned exercise policies under SEC rule 10b5-1, which shields against prosecution
for insider trading. It may also reflect their greater exposure of human capital to firm
risk, interactions of option value with corporate decision making, more volatile corporate
information flow, overconfidence, or other psychological factors.
Taken together, our estimation results provide strong empirical support for the predic-
tions of both optimal exercise theory and behavioral finance. To evaluate the economic
significance of these exercise patterns, we now analyze their effect on option cost.
5 Option Cost to the Firm
For an individual option, the exercise function describes the expected proportion of each
outstanding option grant to be voluntarily exercised at a given time and state, conditional
on having survived to that point. Similarly, the termination rate describes the expected
fraction of options stopped through termination. Given the estimated voluntary exercise
rate per period, G(Xβ), and termination rate λ, the value of the option is given by its
14
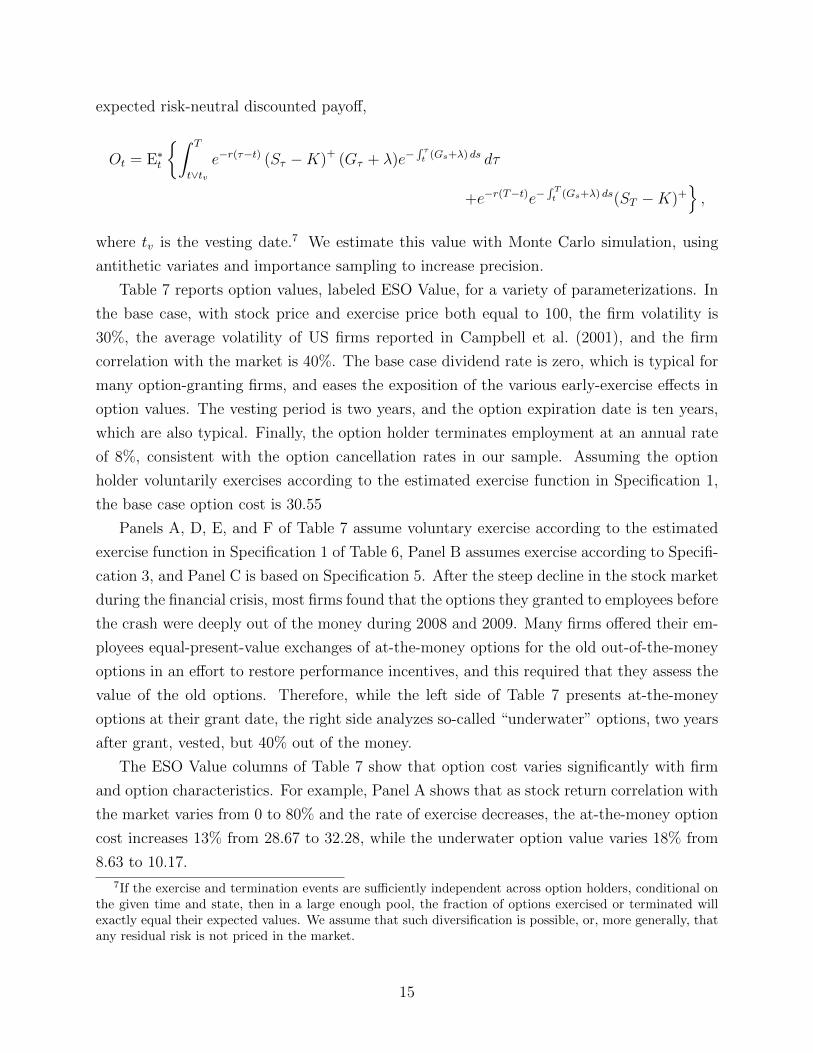
expected risk-neutral discounted payoff,
Ot = E∗t
{∫ T
t∨tve−r(τ−t) (Sτ −K)+ (Gτ + λ)e−
∫ τt (Gs+λ) ds dτ
+e−r(T−t)e−∫ Tt (Gs+λ) ds(ST −K)+
},
where tv is the vesting date.7 We estimate this value with Monte Carlo simulation, using
antithetic variates and importance sampling to increase precision.
Table 7 reports option values, labeled ESO Value, for a variety of parameterizations. In
the base case, with stock price and exercise price both equal to 100, the firm volatility is
30%, the average volatility of US firms reported in Campbell et al. (2001), and the firm
correlation with the market is 40%. The base case dividend rate is zero, which is typical for
many option-granting firms, and eases the exposition of the various early-exercise effects in
option values. The vesting period is two years, and the option expiration date is ten years,
which are also typical. Finally, the option holder terminates employment at an annual rate
of 8%, consistent with the option cancellation rates in our sample. Assuming the option
holder voluntarily exercises according to the estimated exercise function in Specification 1,
the base case option cost is 30.55
Panels A, D, E, and F of Table 7 assume voluntary exercise according to the estimated
exercise function in Specification 1 of Table 6, Panel B assumes exercise according to Specifi-
cation 3, and Panel C is based on Specification 5. After the steep decline in the stock market
during the financial crisis, most firms found that the options they granted to employees before
the crash were deeply out of the money during 2008 and 2009. Many firms offered their em-
ployees equal-present-value exchanges of at-the-money options for the old out-of-the-money
options in an effort to restore performance incentives, and this required that they assess the
value of the old options. Therefore, while the left side of Table 7 presents at-the-money
options at their grant date, the right side analyzes so-called “underwater” options, two years
after grant, vested, but 40% out of the money.
The ESO Value columns of Table 7 show that option cost varies significantly with firm
and option characteristics. For example, Panel A shows that as stock return correlation with
the market varies from 0 to 80% and the rate of exercise decreases, the at-the-money option
cost increases 13% from 28.67 to 32.28, while the underwater option value varies 18% from
8.63 to 10.17.
7If the exercise and termination events are sufficiently independent across option holders, conditional onthe given time and state, then in a large enough pool, the fraction of options exercised or terminated willexactly equal their expected values. We assume that such diversification is possible, or, more generally, thatany residual risk is not priced in the market.
15
Panel B shows that option cost varies materially with employee gender. As Table 6
shows, men exercise options significantly faster than women, perhaps reflecting differences
in confidence, as in Barber and Odean (2001). In the base case, the cost of the at-the-money
option granted to a woman is therefore 2.7% higher than the cost of the same option granted
to a man, while the value of the underwater option is 3.5% higher if held by a woman. Panel
C shows that option cost also varies with employee rank, as proxied by rank of employee
option holdings. In particular, because lower-decile option holders exercise more slowly than
top-decile holders, their options are worth 2.9% more at the grant date, and 4.1% more when
40% underwater. We analyze these gender and top-decile effects effects in greater depth in
Section 5.2.
The volatility and dividend effects in Panels D and E are also quite significant. However,
the changes in ESO Value reflect changes in the stock price process as well as changes in
exercise behavior. To isolate the effect of changing exercise behavior, we compare ESO Value
to traditional Black Scholes value assuming expiration at the contractual expiration date,
and to Black Scholes value assuming expiration at the average of the contractual vesting and
expiration dates, as permitted by SAB 110 for firms with limited option exercise data. These
values are multiplied by the probability that the option vests, given the assumed termination
rate. The approximation errors are quite large and vary widely with the firm characteristics.
For example, the errors from traditional Black Scholes vary from 87% to 32% as volatility
varies from 10% to 50%. The errors from the SAB 110 approximation vary from 26% to 6%
for the at-the-money option and −80% to −4% for the underwater option. Similarly, the
errors from traditional Black Scholes vary from 46% to −12% for the at-the-money option
as the dividend rate varies from 0 to 7%, and the SAB 110 approximation errors vary from
10% to −6%. This underscores the importance of properly accounting for the response of
exercise behavior to changes in the environment.
Panel F shows that option cost need not vary monotonically with the length of the vesting
period. The option value first rises, as the longer vesting period prevents voluntary exercises
early in option life, and then declines, as the risk of forfeiture offsets this effect.
5.1 Modified Black Scholes approximation
Most firms use the Modified Black Scholes (MBS) method permitted by FAS 123R, which
approximates option value as the probability of vesting times the Black Scholes value ad-
justed for dividends, with contractual expiration date replaced by the option’s expected
term, conditional on vesting. Though in principle this method could capture some of the
exercise policy effects through adjustments to the option expected term, it suffers from two
16
serious problems. First, the estimation of option expected term is as difficult as estimat-
ing the option cost itself. This is because the realized option term depends on the stock
price path and any other variables that affect exercise decisions, and no single firm is likely
to have a sufficiently long history of option outcomes to perform this estimation with any
precision. Second, even without estimation error in the option expected term, the Modified
Black Scholes approximation error varies widely and systematically with firm characteristics,
because option expected term does not sufficiently summarize the exercise policy. To make
this second point, we compute the option’s expected term using Monte Carlo simulation,
assuming the option holder follows the estimated exercise function and terminates employ-
ment at a constant rate. This expectation is with respect to the true probability measure,
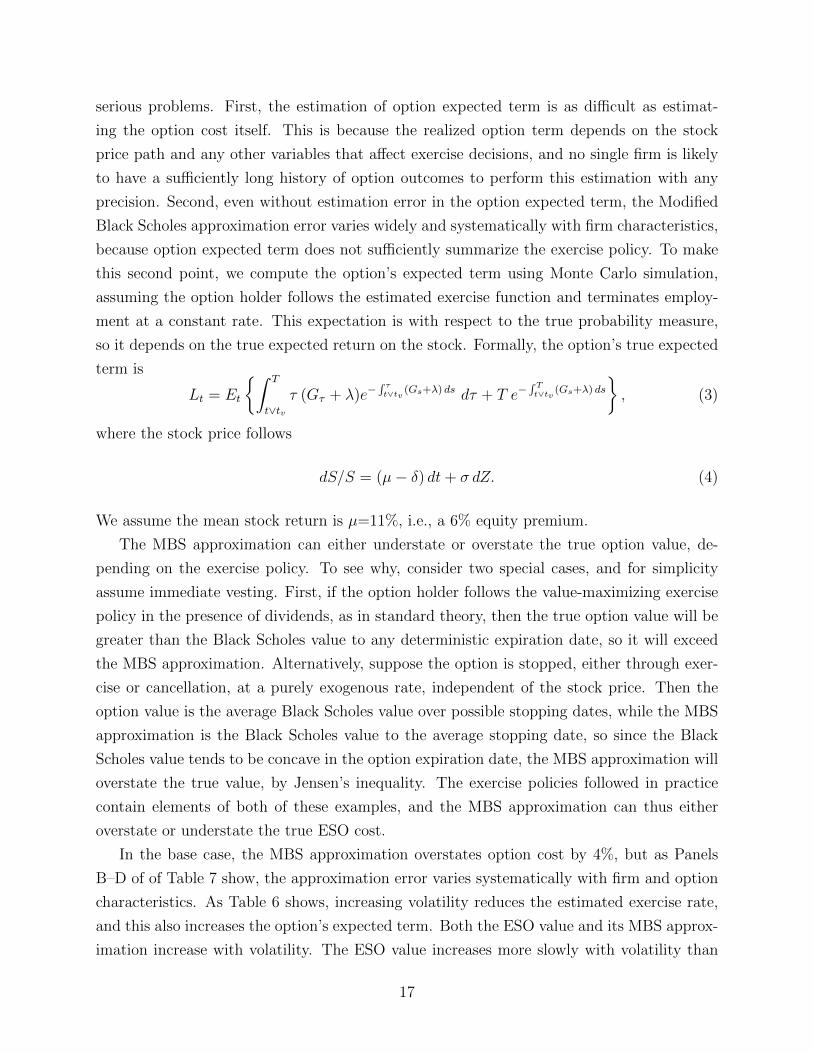
so it depends on the true expected return on the stock. Formally, the option’s true expected
term is
Lt = Et
{∫ T
t∨tvτ (Gτ + λ)e−
∫ τt∨tv (Gs+λ) ds dτ + T e−
∫ Tt∨tv (Gs+λ) ds
}, (3)
where the stock price follows
dS/S = (µ− δ) dt+ σ dZ. (4)
We assume the mean stock return is µ=11%, i.e., a 6% equity premium.
The MBS approximation can either understate or overstate the true option value, de-
pending on the exercise policy. To see why, consider two special cases, and for simplicity
assume immediate vesting. First, if the option holder follows the value-maximizing exercise
policy in the presence of dividends, as in standard theory, then the true option value will be
greater than the Black Scholes value to any deterministic expiration date, so it will exceed
the MBS approximation. Alternatively, suppose the option is stopped, either through exer-
cise or cancellation, at a purely exogenous rate, independent of the stock price. Then the
option value is the average Black Scholes value over possible stopping dates, while the MBS
approximation is the Black Scholes value to the average stopping date, so since the Black
Scholes value tends to be concave in the option expiration date, the MBS approximation will
overstate the true value, by Jensen’s inequality. The exercise policies followed in practice
contain elements of both of these examples, and the MBS approximation can thus either
overstate or understate the true ESO cost.
In the base case, the MBS approximation overstates option cost by 4%, but as Panels
B–D of of Table 7 show, the approximation error varies systematically with firm and option
characteristics. As Table 6 shows, increasing volatility reduces the estimated exercise rate,
and this also increases the option’s expected term. Both the ESO value and its MBS approx-
imation increase with volatility. The ESO value increases more slowly with volatility than
17
the MBS approximation, so the approximation error increases significantly with volatility.
Panel C shows the effect of increasing the dividend rate. This increases the estimated
exercise rate, conditional on the option being vested and in the money, but uniformly reduces
future possible stock prices, and ESO value declines with the dividend rate. The option’s
expected term, conditional on vesting, actually increases slightly, because more stock price
paths stay out of the money longer, but the MBS option value declines even faster than
the true option value, so the error declines in algebraic value. This may be because the
value-maximizing policy calls for some early exercise prior to a dividend payment, and the
estimated empirical exercise policy comes closer to that than the deterministic-time exercise
policy implicit in the MBS approximation.
Panel D illustrates the effect of increasing the vesting period. A longer vesting period in-
creases the risk of pre-vesting forfeiture, which reduces option value. Conditional on vesting,
the option stopping time has less room to vary, so the difference between the option value
and the MBS approximation shrinks.
In the event of a plan modification pursuant to a merger, acquisition, or restructuring of
option plan or terms, firms need to revalue and sometimes replace existing options, and these
valuations affect contracting terms and re-allocations. The right-hand side of Table 7 presents
option values for the out-of-the-money option. The MBS approximation errors are quite
large. Moreover, comparing SAB 110 and MBS errors for the at-the-money and underwater
options shows how sensitive the errors are to the moneyness of the option. This shows that
there is no easy adjustment to Black Scholes to capture employee exercise patterns, and
further highlights the need for a more robust valuation methodology.
5.2 Gender and Rank Effects in Exercise Patterns and Cost
Specifications 3 and 4 of Table 6 summarize the difference in male and female employee
exercise rates with a single dummy variable, showing that men exercise faster than women.
The resulting option cost differential of options held by women over those held by men is
consistently at least 2–3% for almost all of the parameterizations shown in Table 7, except
in the case of a very high dividend rate, where men’s faster exercise increases option value,
or a very long vesting period, where the cost differential is driven to zero as the period of
exercisability shrinks. The cost implications of the positive top-decile effect summarized by
the dummy variable in specifications 5 and 6 of Table 6 are similar.
To further check the robustness of these cost differentials, and investigate the differential
exercise patterns in greater detail, we estimate specifications with a full set of interaction
variables. Table 8 shows how male employee exercise patterns differ from those of female
18
employees. Men are significantly more responsive to Price ≥ 90th percentile of prior year
distribution, but less responsive to Price-to-Strike Ratio, Correlation, Volatility, and vesting
events. Table 9 shows the differential option cost for men and women based on specification 1
in Table 8. For example, the more negative correlation response of female employees makes
the cost differential increase sharply with correlation. For most parameterizations, the cost
differential remains at least 2–3%.
Table 10 shows how top-decile option holder exercise patterns differ from those of lower-
decile holders. Top-decile holders are more responsive to Dividend in next two weeks, Volatil-
ity, and Price ≥ 90th percentile of prior year distribution than lower-decile holders, but are
less responsive to Price-to-Strike Ratio, Correlation, and vesting events. The option cost
differential between top- and lower-decile holders varies with the parameters, but remains
over 2% for most parameterizations.
6 Conclusions
This paper is the first to perform a complete empirical estimation of employee stock option
exercise behavior and option cost to firms. We develop a methodology for estimating option
exercise and cancellation rates as a function of the stock price path, time to expiration,
and firm and option holder characteristics. Our estimation is based on a fractional logistic
approach, and accounts for correlation between exercises by the same executive. Valuation
proceeds by using the estimated exercise function to describe the option’s expected payoff
along each stock price path, and then computing the present value of the payoff. The
estimation of empirical exercise rates also allows us to test the predictions of theoretical
models of option exercise behavior.
We apply our estimation technique to the first both large and broad-based option dataset
analyzed in the literature, consisting of a comprehensive sample of option grant and exercise
data for over 500,000 employees at 104 publicly traded firms from 1981 to 2009. We find that
firm and option holder characteristics affect option exercise patterns and cost in a manner
consistent with both portfolio theory and results from the behavioral finance literature. For
example, exercise rates are lower, and option cost greater, at firms with higher correlation
with the market, and men exercise faster than women, resulting in lower cost. In addition,
top employees exercise faster than lower-ranked employees, again resulting in lower option
cost.
Finally, our results also indicate that Black-Scholes-based approximations used in practice
can lead to significant pricing errors with no simple fixes. Our paper responds to FASB’s call
for more detailed information on employee exercise behavior by providing a comprehensive
19

analysis of employee exercise rates and implications for option cost. The proprietary data
used in this study were provided by corporate participants in a sponsored research project
funded by the Society of Actuaries, who hope that the results of our study will become the
basis for a standard set of exercise assumptions to be used in calculating ESO values on
firms’ income statements.
20
References
Armstrong, C. S., A. D. Jagolinzer, and D. F. Larcker, 2007, Timing of employee stock
option exercises and the cost of stock option grants, Working paper, Stanford University.
Barber, B., and T. Odean, 2001, Boys will be boys: Gender, overconfidence, and common
stock investment, Quarterly Journal of Economics 116, 261–292.
Baum, C. F., M. E. Schaffer, and S. Stillman, 2003, Instrumental variables and GMM:
Estimation and testing, Stata Journal 3, 1–31.
Bettis, J. C., J. M. Bizjak, and M. L. Lemmon, 2005, Exercise behavior, valuation, and the
incentive effects of employee stock options, Journal of Financial Economics 76, 445–470.
Campbell, J. Y., M. Lettau, B. G. Malkiel, and Y. Xu, 2001, Have individual stocks become
more volatile? An empirical exploration of idiosyncratic risk, Journal of Finance 56, 1–43.
Carpenter, J., R. Stanton, and N. Wallace, 2010, Optimal exercise of executive stock options
and implications for firm cost, Journal of Financial Economics 98, 315–337.
Carpenter, J. N., 1998, The exercise and valuation of executive stock options, Journal of
Financial Economics 48, 127–158.
Carr, P., and V. Linetsky, 2000, The valuation of executive stock options in an intensity
based framework, European Financial Review 4, 211–230.
Cvitanic, J., Z. Wiener, and F. Zapatero, 2008, Analytic pricing of executive stock options,
Review of Financial Studies 21, 683–724.
Detemple, J., and S. Sundaresan, 1999, Nontraded asset valuation with portfolio constraints:
A binomial approach, Review of Financial Studies 12, 835–872.
Duffie, D., and K. J. Singleton, 1999, Modeling term structures of defaultable bonds, Review
of Financial Studies 12, 687–720.
Equilar, 2011, 2011 Equity trends report: Update, Technical report, Equilar, Inc.
Frydman, C., and D. Jenter, 2010, CEO compensation, Working paper, NBER Working
Paper 16585.
Gourieroux, C., A. Monfort, and A. Trognon, 1984, Pseudo-maximum likelihood methods:
Theory, Econometrica 52, 681–700.
Grasselli, M. R., and V. Henderson, 2009, Risk aversion and block exercise of executive stock
options, Journal of Economic Dynamics and Control 33, 109–127.
Hall, B., and K. Murphy, 2002, Stock options for undiversified executives, Journal of Ac-
counting and Economics 33, 3–42.
Heath, C., S. Huddart, and M. Lang, 1999, Psychological factors and stock option exercise,
Quarterly Journal of Economics 114, 601–627.
21
Huddart, S., 1994, Employee stock options, Journal of Accounting and Economics 18, 207–
231.
Huddart, S., and M. Lang, 1996, Employee stock option exercises: An empirical analysis,
Journal of Accounting and Economics 21, 5–43.
Hull, J., and A. White, 2004, How to value employee stock options, Financial Analysts
Journal 60, 114–119.
Ingersoll, J., 2006, The subjective and objective evaluation of incentive stock options, Journal
of Business 79, 453–487.
Jennergren, L. P., and B. Naslund, 1993, A comment on “Valuation of executive stock options
and the FASB proposal”, Accounting Review 68, 179–183.
Kim, I. J., 1990, The analytic valuation of American options, Review of Financial Studies
3, 547–572.
Klein, D., and E. Maug, 2011, How do executives exercise stock options?, Working paper,
Mannheim Finance Working Paper 2209-01.
Leung, T., and R. Sircar, 2009, Accounting for risk aversion, vesting, job termination risk
and multiple exercises in valuation of employee stock options, Mathematical Finance 19,
99–128.
Li, D. X., 2001, On default correlation: A copula function approach, Working paper, Risk-
Metrics Group.
Papke, L. E., and J. M. Wooldridge, 1996, Econometric methods for fractional response
variables with an application to 401(k) plan participation rates, Journal of Applied Econo-
metrics 11, 619–632.
Petersen, M. A., 2009, Estimating standard errors in finance panel data sets: Comparing
approaches, Review of Financial Studies 22, 435–480.
Rogers, W., 1993, Regression standard errors in clustered samples, Stata Technical Bulletin
13, pp. 19–23.
Schwartz, E. S., and W. N. Torous, 1989, Prepayment and the valuation of mortgage-backed
securities, Journal of Finance 44, 375–392.
Wooldridge, J. M., 2003, Cluster-sample methods in applied econometrics, American Eco-
nomic Review 93, 133–138.
22
Tab
le1:
Sum
mar
ySta
tist
ics
for
Sam
ple
Fir
ms
Th
ista
ble
pro
vid
esfi
nan
cial
-per
form
ance
sum
mary
stati
stic
sfo
rth
e104
firm
sin
ou
rsa
mp
le,
gro
up
edby
on
e-dig
itS
ICco
de.
Sta
rtS
am
ple
isth
e
earl
iest
opti
ongr
ant
dat
ein
our
sam
ple
and
En
dS
am
ple
isth
ela
std
ayth
at
we
track
all
gra
nts
an
dex
erci
seev
ents
inth
esa
mp
lefo
rall
of
the
firm
s.E
mp
loyee
sis
the
sam
ple
-per
iod
mea
nof
the
an
nu
al
nu
mb
erof
emp
loyee
sfo
rth
efi
rms
as
rep
ort
edin
Com
pu
stat
as“Employees:Thousands”
(DA
TA
29).
Mar
ket
Cap
isth
esa
mp
le-p
erio
dm
ean
of“CommonSharesOutstanding:
Millions”
inC
om
pu
stat
(DA
TA
25)
mu
ltip
lied
by“Price
minus
FiscalYearClose”
inC
omp
ust
at(D
AT
A19
9).
Mark
et-t
o-B
ook
isth
esa
mp
le-p
erio
dm
ean
of
the
the
Mark
etC
ap
scale
dby
com
mon
equ
ity
as
rep
ort
ed
inC
omp
ust
at(D
AT
A60
).R
even
ue
isth
esa
mp
le-p
erio
dm
ean
of“Sales/Turnover”
inC
om
pust
at
(DA
TA
12).
Net
Inco
me
isth
esa
mp
le-p
erio
dm
ean
of“Net
Income”
inC
omp
ust
at(D
AT
A17
2).
Vola
tili
tyis
the
aver
age
stock
-ret
urn
vola
tili
tyov
erth
esa
mp
lep
erio
d.
Div
iden
dra
teis
the
aver
age
div
iden
dra
teov
erth
esa
mp
lep
erio
d.
Cor
rela
tion
isth
eav
erage
corr
elati
on
bet
wee
nth
efi
rmre
turn
an
dre
turn
on
the
CR
SP
S&
PC
om
posi
teIn
dex
over
the
sam
ple
per
iod
.
Con
stru
ctio
n&
Manu
fact
uri
ng
Tra
nsp
orta
tion
,R
etai
lF
inan
ce,
Ser
vic
esC
omm
un
icat
ion
sIn
sura
nce
,&
Uti
liti
es&
Rea
lE
stat
e
On
Dig
itSIC
1&
23
45
67
8&
9A
ll
Nu
mb
erof
Fir
ms
19
293
1414
177
Sta
rtS
amp
le3/31
/198
212/
31/
1981
12/3
1/19
926/
28/1
985
3/31
/198
23/
31/1
986
9/30
/199
1E
nd
Sam
ple
12/31/
2007
12/3
1/20
0911
/1/2
007
6/11
/200
812
/27/
2007
12/3
1/20
0911
/1/2
007
Em
plo
yees
(000’
s)8.4
35.
9419
.15
24.3
111
.85
8.83
3.57
10.3
6M
ark
etC
ap
($M
illi
on
s)2309
.49
1,74
8.69
9,57
8.27
2,67
5.09
5,31
4.62
1,85
9.17
646.
312,
625.
59M
ark
et-t
o-B
ook
5.06
11.6
62.
524.
162.
375.
737.
306.
67R
even
ue
($M
illi
on
s)1965
.02
866.
053,
446.
754,
962.
563,
569.
511,
029.
7835
5.50
2,04
9.05
Rev
enu
eG
row
th(%
)0.
7781
0.23
0.13
0.16
0.13
1.31
0.12
0.47
Net
Inco
me
($M
illi
on
s)10
1.7
132
33.7
325
0.82
101.
6331
6.19
25.1
922
.23
97.4
1V
ola
tili
ty0.
034
0.03
50.
020
0.02
90.
018
0.03
80.
037
0.50
7D
ivid
end
Rate
0.0
07
0.00
30.
022
0.00
40.
009
0.03
70.
065
0.01
5C
orr
elat
ion
0.31
00.
346
0.37
20.
358
0.35
40.
334
0.25
30.
335
23
Tab
le2:
Sum
mar
ySta
tist
ics
for
Pro
pri
etar
yO
pti
onD
ata:
Sam
ple
Siz
ean
dStr
uct
ure
Th
ista
ble
pro
vid
essu
mm
ary
stat
isti
csw
ith
inin
du
stri
al
gro
up
ings
at
the
on
e-d
igit
SIC
cod
efo
rth
enu
mb
erof
gra
nts
,th
enu
mb
erof
emplo
yees
,th
e
nu
mb
erof
gran
tsp
erem
plo
yee,
and
emp
loye
eou
tsta
nd
ing
op
tion
wea
lth
an
dri
sk,as
mea
sure
dby
thei
rB
lack
Sch
ole
sva
lue,
for
ou
rsa
mp
leof
104
firm
s.C
onst
ruct
ion
&M
anu
fact
uri
ng
Tra
nsp
ort
ati
on
,R
etail
Fin
an
ce,
Ser
vic
esA
llC
om
mu
nic
ati
on
sIn
sura
nce
,&
Uti
liti
es&
Rea
lE
state
SIC
(on
ed
igit
)1
&2
34
56
78
Pan
elA
.A
ggre
gate
Nu
mb
erof
Em
plo
yees
,G
rants
,an
dE
xer
cise
Eve
nts
Nu
mb
erof
Em
plo
yees
183,
249
114,2
41
11,9
50
35,1
76
116,5
64
53,2
55
6,6
88
521,1
23
Nu
mb
erof
Gra
nts
365,
458
302,7
68
18,7
17
119,8
93
273,9
46
149,1
69
15,2
50
1,2
45,2
01
Nu
mb
erof
Exer
cise
s31
8,95
3155,1
58
5,2
76
97,1
92
207,7
99
97,1
58
9,6
03
891,1
39
Pan
elB
.N
um
ber
ofG
rants
per
Em
plo
yee
Mea
n1.
992.6
51.5
73.4
12.3
52.8
02.2
82.3
9M
edia
n2.
002.0
01.0
02.0
01.0
02.0
01.0
02.0
0S
tan
dar
dD
evia
tion
1.39
3.1
71.4
13.2
12.6
62.8
92.2
02.5
1P
anel
C.
BS
Em
plo
yee
Op
tion
Wea
lth
($K
)M
ean
46.5
6151.9
225.0
0313.6
7268.4
2198.1
083.6
0152.0
8M
edia
n12
.24
7.8
41.4
718.7
413.1
018.5
07.2
312.1
6S
tan
dar
dD
evia
tion
1,41
7.70
1,4
44.6
4264.8
93,1
83.4
44,9
36.0
92,3
36.6
4616.1
72,8
42.6
9P
anel
D.
BS
Em
plo
yee
Op
tion
Ris
k($
K)
Mea
n8.
52158.7
812.0
4172.8
6100.1
2133.4
847.4
082.5
7M
edia
n0.
566.0
11.0
39.1
16.3
59.2
54.5
01.4
6S
tan
dar
dD
evia
tion
407.
411,8
01.3
2130.7
81,9
69.0
91,8
05.0
41,8
47.3
1378.4
61,4
31.9
5
24
Tab
le3:
Sum
mar
ySta
tist
ics
for
Pro
pri
etar
yO
pti
onD
ata:
Gra
nt
Siz
ean
dC
ontr
actu
alF
eatu
res
Th
ista
ble
pro
vid
essu
mm
ary
stat
isti
csw
ith
inin
du
stri
al
gro
up
ings
at
the
on
e-d
igit
SIC
cod
efo
rth
ed
oll
ar
valu
eof
the
un
der
lyin
gsh
are
sp
ergra
nt,
the
max
imu
mnu
mb
erof
vest
ing
per
iod
sp
ergr
ant,
the
per
cent
of
op
tion
sth
at
vest
on
the
firs
tve
stin
gd
ate
per
gra
nt,
the
nu
mb
erof
month
sfr
om
the
gran
td
ate
toth
efu
llves
tin
gof
all
opti
ons
inth
egra
nt,
an
dth
enu
mb
erof
month
sfr
om
the
gra
nt
date
toth
eex
pir
ati
on
date
per
gra
nt
for
the
104
firm
sin
our
sam
ple
.
Con
stru
ctio
n&
Manu
fact
uri
ng
Tra
nsp
ort
ati
on
,R
etail
Fin
an
ce,
Ser
vic
esA
llC
om
mu
nic
ati
on
sIn
sura
nce
,&
Uti
liti
es&
Rea
lE
state
SIC
(on
ed
igit
)1
&2
34
56
78
Pan
elA
.D
olla
rV
alu
eof
Un
der
lyin
gSh
are
sp
erG
rant
($K
)M
ean
24.7
345.9
519.9
852.3
2106.4
161.4
341.3
249.6
8M
edia
n5.
7012.5
03.2
111.5
325.8
526.3
810.9
810.0
5S
tan
dar
dD
evia
tion
191.
20281.2
6193.8
5295.1
8715.9
2466.1
2201.5
2383.9
6P
anel
B.
Max
imu
mN
um
ber
ofV
esti
ng
Per
iod
sp
erG
rant
Mea
n15
.07
8.9
03.7
03.3
02.9
04.8
83.2
65.8
0M
edia
n4.
004.0
04.0
03.0
03.0
04.0
03.0
04.0
0S
tan
dar
dD
evia
tion
17.2
510.6
50.4
61.3
41.1
45.8
61.2
58.1
6P
anel
C.
Per
cent
ofO
pti
ons
that
Ves
ton
the
Fir
stV
esti
ng
Date
(per
Gra
nt)
Mea
n38
.98
28.7
527.4
638.7
448.5
936.9
135.8
737.6
0M
edia
n25
.00
25.0
025.0
033.3
333.3
325.0
033.3
325.0
0S
tan
dar
dD
evia
tion
35.7
822.4
53.7
926.7
729.4
228.4
214.3
727.7
9P
anel
D.
Nu
mb
erof
Mon
ths
from
Gra
nt
toF
ull
Ves
tin
g(p
erG
rant)
Mea
n37
.01
47.7
844.4
440.9
932.9
240.7
139.1
740.5
4M
edia
n36
.00
48.0
048.0
036.0
036.0
048.0
036.0
036.0
0S
tan
dar
dD
evia
tion
13.1
821.9
45.4
814.9
117.9
919.1
015.0
119.5
1P
anel
E.
Nu
mb
erof
Mon
ths
from
Gra
nt
toE
xp
irati
on
(per
Gra
nt)
Mea
n11
5.39
114.6
8120.0
0122.4
3120.1
8120.0
0120.0
0118.5
5M
edia
n12
0.00
120.0
0120.0
0120.0
0120.0
0120.0
0120.0
0120.0
0S
tan
dar
dD
evia
tion
16.4
812.9
50.0
011.8
10.3
80.0
00.0
09.8
8
25
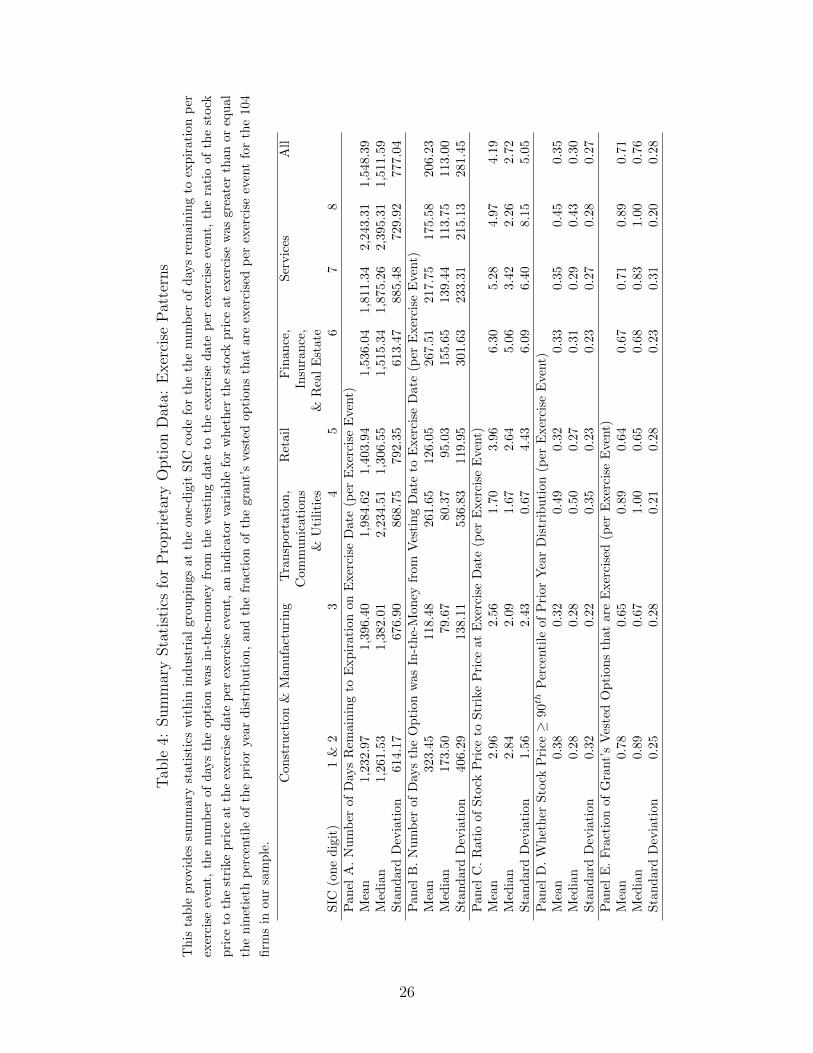
Tab
le4:
Sum
mar
ySta
tist
ics
for
Pro
pri
etar
yO
pti
onD
ata:
Exer
cise
Pat
tern
s
Th
ista
ble
pro
vid
essu
mm
ary
stat
isti
csw
ith
inin
du
stri
al
gro
up
ings
at
the
on
e-d
igit
SIC
cod
efo
rth
eth
enu
mb
erof
day
sre
main
ing
toex
pir
ati
on
per
exer
cise
even
t,th
enu
mb
erof
day
sth
eop
tion
was
in-t
he-
mon
eyfr
om
the
vest
ing
date
toth
eex
erci
sed
ate
per
exer
cise
even
t,th
era
tio
of
the
stock
pri
ceto
the
stri
ke
pri
ceat
the
exer
cise
dat
ep
erex
erci
seev
ent,
an
ind
icato
rva
riab
lefo
rw
het
her
the
stock
pri
ceat
exer
cise
was
gre
ate
rth
an
or
equ
al
the
nin
etie
thp
erce
nti
leof
the
pri
orye
ard
istr
ibu
tion,
an
dth
efr
act
ion
of
the
gra
nt’
sve
sted
op
tion
sth
at
are
exer
cise
dp
erex
erci
seev
ent
for
the
104
firm
sin
our
sam
ple
.
Con
stru
ctio
n&
Manu
fact
uri
ng
Tra
nsp
ort
ati
on
,R
etail
Fin
an
ce,
Ser
vic
esA
llC
om
mu
nic
ati
on
sIn
sura
nce
,&
Uti
liti
es&
Rea
lE
state
SIC
(on
ed
igit
)1
&2
34
56
78
Pan
elA
.N
um
ber
ofD
ays
Rem
ain
ing
toE
xp
irati
on
on
Exer
cise
Date
(per
Exer
cise
Even
t)M
ean
1,23
2.97
1,3
96.4
01,9
84.6
21,4
03.9
41,5
36.0
41,8
11.3
42,2
43.3
11,5
48.3
9M
edia
n1,
261.
531,3
82.0
12,2
34.5
11,3
06.5
51,5
15.3
41,8
75.2
62,3
95.3
11,5
11.5
9S
tan
dar
dD
evia
tion
614.
17676.9
0868.7
5792.3
5613.4
7885.4
8729.9
2777.0
4P
anel
B.
Nu
mb
erof
Day
sth
eO
pti
onw
as
In-t
he-
Mon
eyfr
om
Ves
tin
gD
ate
toE
xer
cise
Date
(per
Exer
cise
Eve
nt)
Mea
n32
3.45
118.4
8261.6
5126.0
5267.5
1217.7
5175.5
8206.2
3M
edia
n17
3.50
79.6
780.3
795.0
3155.6
5139.4
4113.7
5113.0
0S
tan
dar
dD
evia
tion
406.
29138.1
1536.8
3119.9
5301.6
3233.3
1215.1
3281.4
5P
anel
C.
Rat
ioof
Sto
ckP
rice
toS
trik
eP
rice
at
Exer
cise
Date
(per
Exer
cise
Eve
nt)
Mea
n2.
962.5
61.7
03.9
66.3
05.2
84.9
74.1
9M
edia
n2.
842.0
91.6
72.6
45.0
63.4
22.2
62.7
2S
tan
dar
dD
evia
tion
1.56
2.4
30.6
74.4
36.0
96.4
08.1
55.0
5P
anel
D.
Wh
eth
erS
tock
Pri
ce≥
90th
Per
centi
leof
Pri
or
Yea
rD
istr
ibu
tion
(per
Exer
cise
Eve
nt)
Mea
n0.
380.3
20.4
90.3
20.3
30.3
50.4
50.3
5M
edia
n0.
280.2
80.5
00.2
70.3
10.2
90.4
30.3
0S
tan
dar
dD
evia
tion
0.32
0.2
20.3
50.2
30.2
30.2
70.2
80.2
7P
anel
E.
Fra
ctio
nof
Gra
nt’
sV
este
dO
pti
on
sth
at
are
Exer
cise
d(p
erE
xer
cise
Even
t)M
ean
0.78
0.6
50.8
90.6
40.6
70.7
10.8
90.7
1M
edia
n0.
890.6
71.0
00.6
50.6
80.8
31.0
00.7
6S
tan
dar
dD
evia
tion
0.25
0.2
80.2
10.2
80.2
30.3
10.2
00.2
8
26
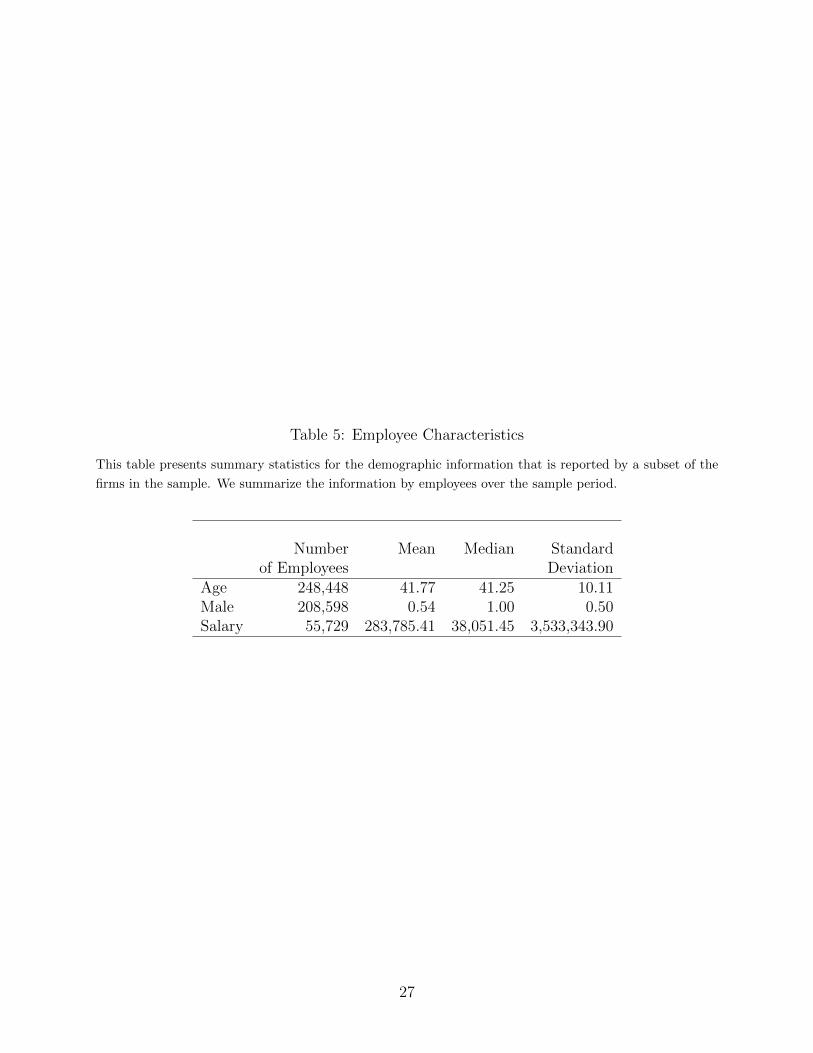
Table 5: Employee Characteristics
This table presents summary statistics for the demographic information that is reported by a subset of the
firms in the sample. We summarize the information by employees over the sample period.
Number Mean Median Standardof Employees Deviation
Age 248,448 41.77 41.25 10.11Male 208,598 0.54 1.00 0.50Salary 55,729 283,785.41 38,051.45 3,533,343.90
27
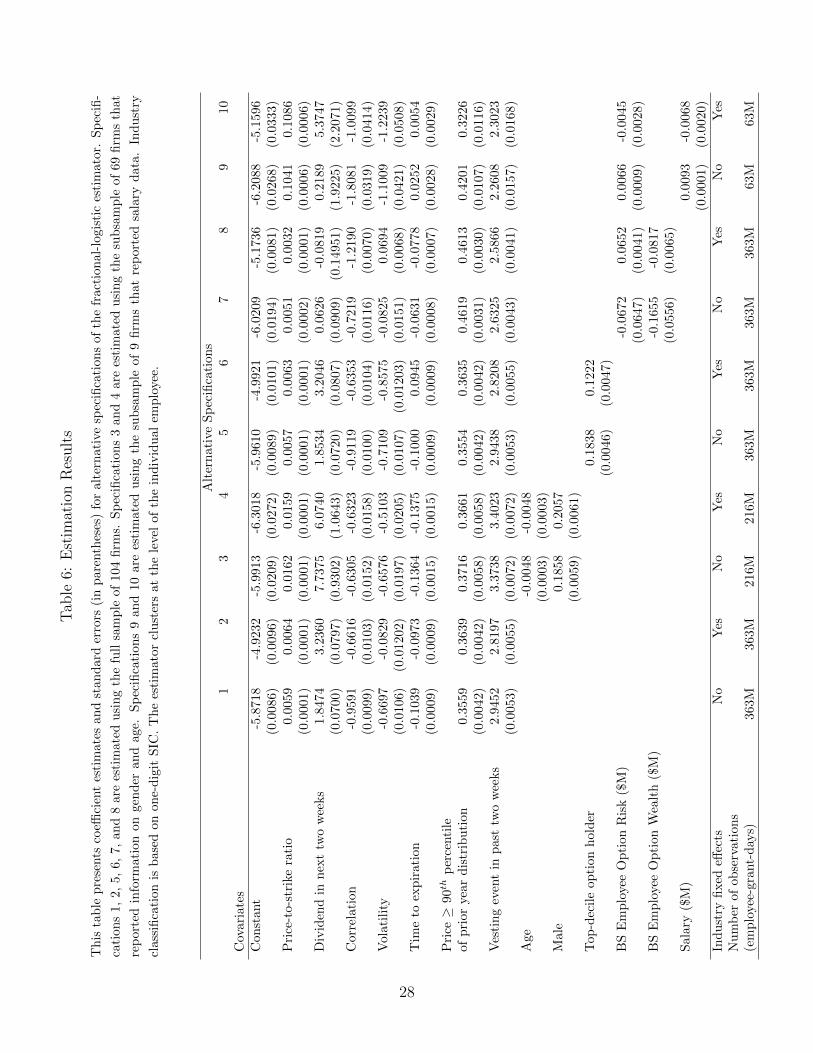
Tab
le6:
Est
imat
ion
Res
ult
s
Th
ista
ble
pre
sents
coeffi
cien
tes
tim
ates
and
stan
dard
erro
rs(i
npare
nth
eses
)fo
ralt
ern
ati
vesp
ecifi
cati
on
sof
the
fract
ion
al-
logis
tic
esti
mato
r.S
pec
ifi-
cati
ons
1,2,
5,6,
7,an
d8
are
esti
mat
edu
sin
gth
efu
llsa
mp
leof
104
firm
s.S
pec
ifica
tion
s3
an
d4
are
esti
mate
du
sin
gth
esu
bsa
mp
leof
69
firm
sth
at
rep
orte
din
form
atio
non
gen
der
and
age.
Sp
ecifi
cati
on
s9
an
d10
are
esti
mate
du
sin
gth
esu
bsa
mp
leof
9firm
sth
at
rep
ort
edsa
lary
data
.In
du
stry
clas
sifi
cati
onis
bas
edon
one-
dig
itS
IC.
Th
ees
tim
ato
rcl
ust
ers
at
the
leve
lof
the
ind
ivid
ual
emp
loyee
.
Alt
ern
ati
veS
pec
ifica
tion
s1
23
45
67
89
10
Cov
aria
tes
Con
stan
t-5
.871
8-4
.9232
-5.9
913
-6.3
018
-5.9
610
-4.9
921
-6.0
209
-5.1
736
-6.2
088
-5.1
596
(0.0
086)
(0.0
096)
(0.0
209)
(0.0
272)
(0.0
089)
(0.0
101)
(0.0
194)
(0.0
081)
(0.0
268)
(0.0
333)
Pri
ce-t
o-st
rike
rati
o0.
0059
0.0
064
0.0
162
0.0
159
0.0
057
0.0
063
0.0
051
0.0
032
0.1
041
0.1
086
(0.0
001)
(0.0
001)
(0.0
001)
(0.0
001)
(0.0
001)
(0.0
001)
(0.0
002)
(0.0
001)
(0.0
006)
(0.0
006)
Div
iden
din
nex
ttw
ow
eeks
1.84
743.2
360
7.7
375
6.0
740
1.8
534
3.2
046
0.0
626
-0.0
819
0.2
189
5.3
747
(0.0
700)
(0.0
797)
(0.9
302)
(1.0
643)
(0.0
720)
(0.0
807)
(0.0
909)
(0.1
4951)
(1.9
225)
(2.2
071)
Cor
rela
tion
-0.9
591
-0.6
616
-0.6
305
-0.6
323
-0.9
119
-0.6
353
-0.7
219
-1.2
190
-1.8
081
-1.0
099
(0.0
099)
(0.0
103)
(0.0
152)
(0.0
158)
(0.0
100)
(0.0
104)
(0.0
116)
(0.0
070)
(0.0
319)
(0.0
414)
Vol
atil
ity
-0.6
697
-0.0
829
-0.6
576
-0.5
103
-0.7
109
-0.8
575
-0.0
825
0.0
694
-1.1
009
-1.2
239
(0.0
106)
(0.0
1202)
(0.0
197)
(0.0
205)
(0.0
107)
(0.0
1203)
(0.0
151)
(0.0
068)
(0.0
421)
(0.0
508)
Tim
eto
exp
irat
ion
-0.1
039
-0.0
973
-0.1
364
-0.1
375
-0.1
000
0.0
945
-0.0
631
-0.0
778
0.0
252
0.0
054
(0.0
009)
(0.0
009)
(0.0
015)
(0.0
015)
(0.0
009)
(0.0
009)
(0.0
008)
(0.0
007)
(0.0
028)
(0.0
029)
Pri
ce≥
90th
per
centi
leof
pri
oryea
rd
istr
ibu
tion
0.35
590.3
639
0.3
716
0.3
661
0.3
554
0.3
635
0.4
619
0.4
613
0.4
201
0.3
226
(0.0
042)
(0.0
042)
(0.0
058)
(0.0
058)
(0.0
042)
(0.0
042)
(0.0
031)
(0.0
030)
(0.0
107)
(0.0
116)
Ves
tin
gev
ent
inp
ast
two
wee
ks
2.94
522.8
197
3.3
738
3.4
023
2.9
438
2.8
208
2.6
325
2.5
866
2.2
608
2.3
023
(0.0
053)
(0.0
055)
(0.0
072)
(0.0
072)
(0.0
053)
(0.0
055)
(0.0
043)
(0.0
041)
(0.0
157)
(0.0
168)
Age
-0.0
048
-0.0
048
(0.0
003)
(0.0
003)
Mal
e0.1
858
0.2
057
(0.0
059)
(0.0
061)
Top
-dec
ile
opti
onh
old
er0.1
838
0.1
222
(0.0
046)
(0.0
047)
BS
Em
plo
yee
Op
tion
Ris
k($
M)
-0.0
672
0.0
652
0.0
066
-0.0
045
(0.0
647)
(0.0
041)
(0.0
009)
(0.0
028)
BS
Em
plo
yee
Op
tion
Wea
lth
($M
)-0
.1655
-0.0
817
(0.0
556)
(0.0
065)
Sal
ary
($M
)0.0
093
-0.0
068
(0.0
001)
(0.0
020)
Ind
ust
ryfi
xed
effec
tsN
oY
esN
oY
esN
oY
esN
oY
esN
oY
esN
um
ber
ofob
serv
atio
ns
(em
plo
yee-
gran
t-d
ays)
363M
363M
216M
216M
363M
363M
363M
363M
63M
63M
28
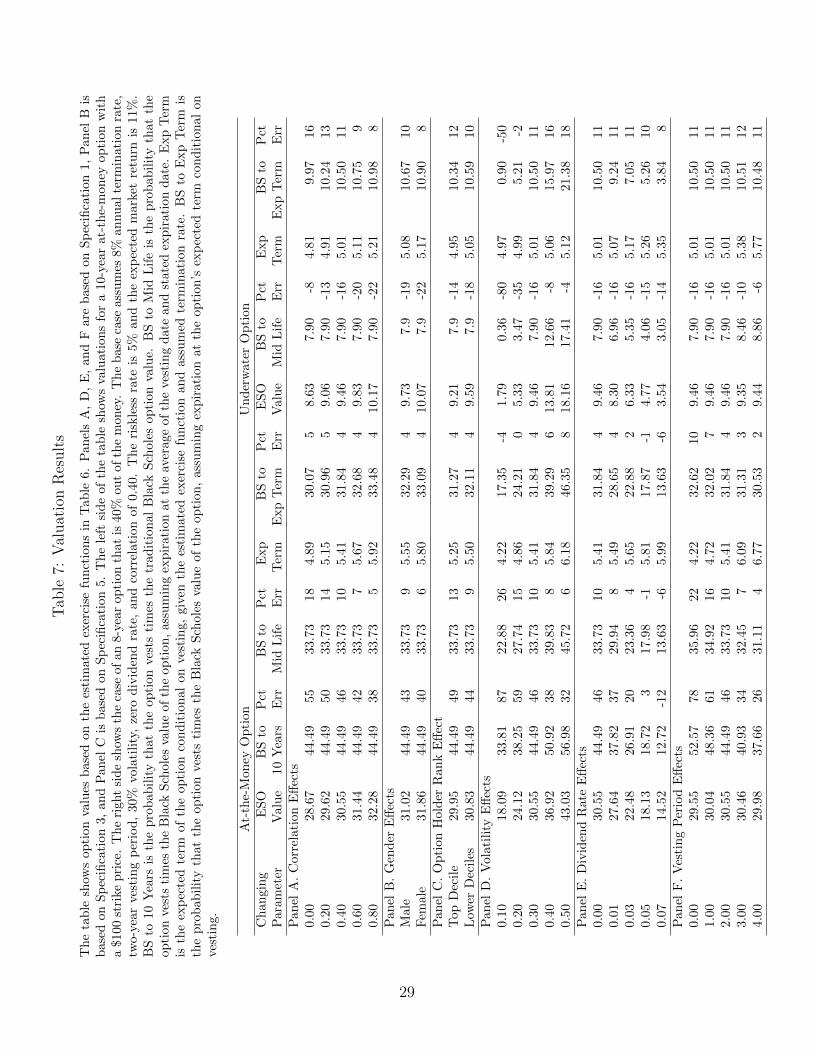
Tab
le7:
Val
uat
ion
Res
ult
s
Th
eta
ble
show
sop
tion
valu
esb
ased
onth
ees
tim
ate
dex
erci
sefu
nct
ion
sin
Table
6.
Pan
els
A,
D,
E,
an
dF
are
base
don
Sp
ecifi
cati
on
1,
Pan
elB
isb
ased
onS
pec
ifica
tion
3,an
dP
anel
Cis
bas
edon
Sp
ecifi
cati
on
5.
Th
ele
ftsi
de
of
the
tab
lesh
ows
valu
ati
on
sfo
ra
10-y
ear
at-
the-
mon
eyop
tion
wit
ha
$100
stri
ke
pri
ce.
Th
eri
ght
sid
esh
ows
the
case
of
an
8-y
ear
op
tion
that
is40%
ou
tof
the
mon
ey.
Th
eb
ase
case
ass
um
es8%
an
nu
alte
rmin
ati
on
rate
,tw
o-yea
rve
stin
gp
erio
d,
30%
vola
tili
ty,
zero
div
iden
dra
te,
an
dco
rrel
ati
on
of
0.4
0.
Th
eri
skle
ssra
teis
5%
an
dth
eex
pec
ted
mark
etre
turn
is11%
.B
Sto
10Y
ears
isth
ep
rob
abil
ity
that
the
opti
on
vest
sti
mes
the
trad
itio
nal
Bla
ckS
chole
sop
tion
valu
e.B
Sto
Mid
Lif
eis
the
pro
bab
ilit
yth
at
the
opti
onve
sts
tim
esth
eB
lack
Sch
oles
valu
eof
the
op
tion
,ass
um
ing
exp
irati
on
at
the
aver
age
of
the
vest
ing
date
an
dst
ate
dex
pir
ati
on
date
.E
xp
Ter
mis
the
exp
ecte
dte
rmof
the
opti
on
con
dit
ion
alon
vest
ing,
giv
enth
ees
tim
ate
dex
erci
sefu
nct
ion
an
dass
um
edte
rmin
ati
on
rate
.B
Sto
Exp
Ter
mis
the
pro
bab
ilit
yth
atth
eop
tion
ves
tsti
mes
the
Bla
ckS
chole
sva
lue
of
the
op
tion,
ass
um
ing
exp
irati
on
at
the
op
tion’s
exp
ecte
dte
rmco
nd
itio
nal
on
vest
ing.
At-
the-
Mon
eyO
pti
onU
nd
erw
ate
rO
pti
on
Ch
angi
ng
ES
OB
Sto
Pct
BS
toP
ctE
xp
BS
toP
ctE
SO
BS
toP
ctE
xp
BS
toP
ctP
aram
eter
Val
ue
10Y
ears
Err
Mid
Lif
eE
rrT
erm
Exp
Ter
mE
rrV
alu
eM
idL
ife
Err
Ter
mE
xp
Ter
mE
rrP
anel
A.
Cor
rela
tion
Eff
ects
0.00
28.6
744
.49
5533.7
318
4.8
930.0
75
8.6
37.9
0-8
4.8
19.9
716
0.20
29.6
244
.49
5033.7
314
5.1
530.9
65
9.0
67.9
0-1
34.9
110.2
413
0.40
30.5
544
.49
4633.7
310
5.4
131.8
44
9.4
67.9
0-1
65.0
110.5
011
0.60
31.4
444
.49
4233.7
37
5.6
732.6
84
9.8
37.9
0-2
05.1
110.7
59
0.80
32.2
844
.49
3833.7
35
5.9
233.4
84
10.1
77.9
0-2
25.2
110.9
88
Pan
elB
.G
end
erE
ffec
tsM
ale
31.0
244
.49
4333.7
39
5.5
532.2
94
9.7
37.9
-19
5.0
810.6
710
Fem
ale
31.8
644
.49
4033.7
36
5.8
033.0
94
10.0
77.9
-22
5.1
710.9
08
Pan
elC
.O
pti
onH
old
erR
ank
Eff
ect
Top
Dec
ile
29.9
544
.49
4933.7
313
5.2
531.2
74
9.2
17.9
-14
4.9
510.3
412
Low
erD
ecil
es30
.83
44.4
944
33.7
39
5.5
032.1
14
9.5
97.9
-18
5.0
510.5
910
Pan
elD
.V
olat
ilit
yE
ffec
ts0.
1018
.09
33.8
187
22.8
826
4.2
217.3
5-4
1.7
90.3
6-8
04.9
70.9
0-5
00.
2024
.12
38.2
559
27.7
415
4.8
624.2
10
5.3
33.4
7-3
54.9
95.2
1-2
0.30
30.5
544
.49
4633.7
310
5.4
131.8
44
9.4
67.9
0-1
65.0
110.5
011
0.40
36.9
250
.92
3839.8
38
5.8
439.2
96
13.8
112.6
6-8
5.0
615.9
716
0.50
43.0
356
.98
3245.7
26
6.1
846.3
58
18.1
617.4
1-4
5.1
221.3
818
Pan
elE
.D
ivid
end
Rat
eE
ffec
ts0.
0030
.55
44.4
946
33.7
310
5.4
131.8
44
9.4
67.9
0-1
65.0
110.5
011
0.01
27.6
437
.82
3729.9
48
5.4
928.6
54
8.3
06.9
6-1
65.0
79.2
411
0.03
22.4
826
.91
2023.3
64
5.6
522.8
82
6.3
35.3
5-1
65.1
77.0
511
0.05
18.1
318
.72
317.9
8-1
5.8
117.8
7-1
4.7
74.0
6-1
55.2
65.2
610
0.07
14.5
212
.72
-12
13.6
3-6
5.9
913.6
3-6
3.5
43.0
5-1
45.3
53.8
48
Pan
elF
.V
esti
ng
Per
iod
Eff
ects
0.00
29.5
552
.57
7835.9
622
4.2
232.6
210
9.4
67.9
0-1
65.0
110.5
011
1.00
30.0
448
.36
6134.9
216
4.7
232.0
27
9.4
67.9
0-1
65.0
110.5
011
2.00
30.5
544
.49
4633.7
310
5.4
131.8
44
9.4
67.9
0-1
65.0
110.5
011
3.00
30.4
640
.93
3432.4
57
6.0
931.3
13
9.3
58.4
6-1
05.3
810.5
112
4.00
29.9
837
.66
2631.1
14
6.7
730.5
32
9.4
48.8
6-6
5.7
710.4
811
29
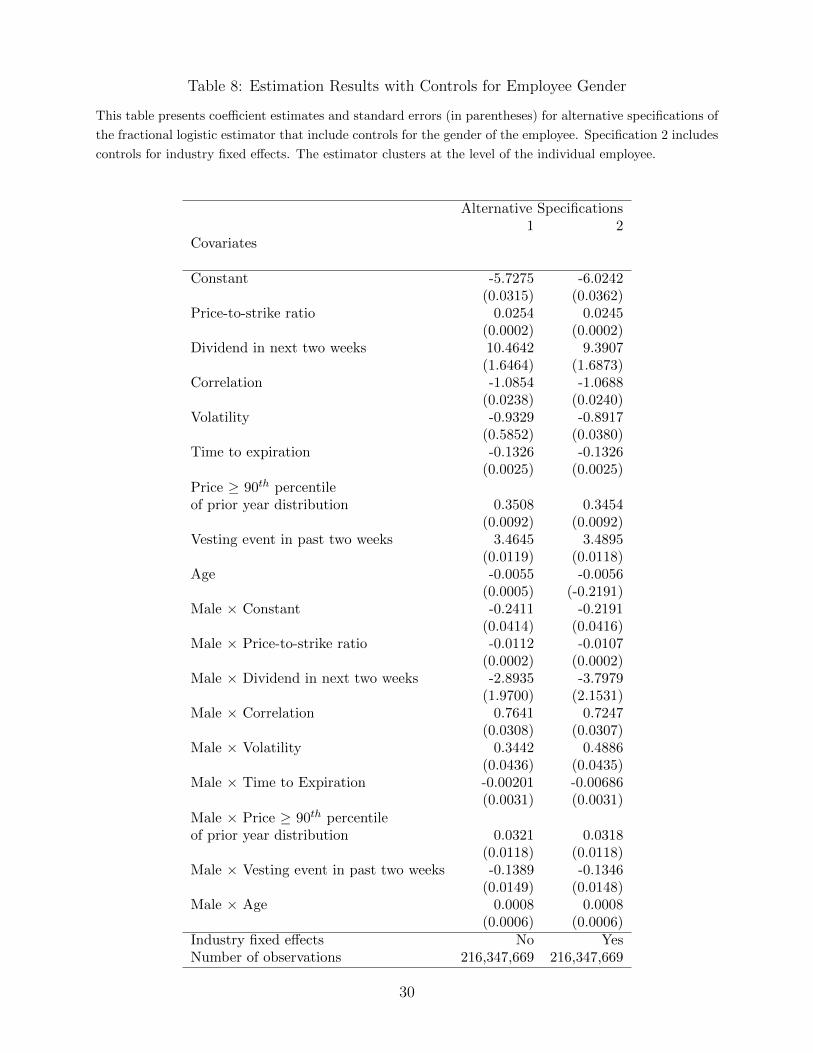
Table 8: Estimation Results with Controls for Employee Gender
This table presents coefficient estimates and standard errors (in parentheses) for alternative specifications of
the fractional logistic estimator that include controls for the gender of the employee. Specification 2 includes
controls for industry fixed effects. The estimator clusters at the level of the individual employee.
Alternative Specifications1 2
Covariates
Constant -5.7275 -6.0242(0.0315) (0.0362)
Price-to-strike ratio 0.0254 0.0245(0.0002) (0.0002)
Dividend in next two weeks 10.4642 9.3907(1.6464) (1.6873)
Correlation -1.0854 -1.0688(0.0238) (0.0240)
Volatility -0.9329 -0.8917(0.5852) (0.0380)
Time to expiration -0.1326 -0.1326(0.0025) (0.0025)
Price ≥ 90th percentileof prior year distribution 0.3508 0.3454
(0.0092) (0.0092)Vesting event in past two weeks 3.4645 3.4895
(0.0119) (0.0118)Age -0.0055 -0.0056
(0.0005) (-0.2191)Male × Constant -0.2411 -0.2191
(0.0414) (0.0416)Male × Price-to-strike ratio -0.0112 -0.0107
(0.0002) (0.0002)Male × Dividend in next two weeks -2.8935 -3.7979
(1.9700) (2.1531)Male × Correlation 0.7641 0.7247
(0.0308) (0.0307)Male × Volatility 0.3442 0.4886
(0.0436) (0.0435)Male × Time to Expiration -0.00201 -0.00686
(0.0031) (0.0031)Male × Price ≥ 90th percentileof prior year distribution 0.0321 0.0318
(0.0118) (0.0118)Male × Vesting event in past two weeks -0.1389 -0.1346
(0.0149) (0.0148)Male × Age 0.0008 0.0008
(0.0006) (0.0006)Industry fixed effects No YesNumber of observations 216,347,669 216,347,669
30
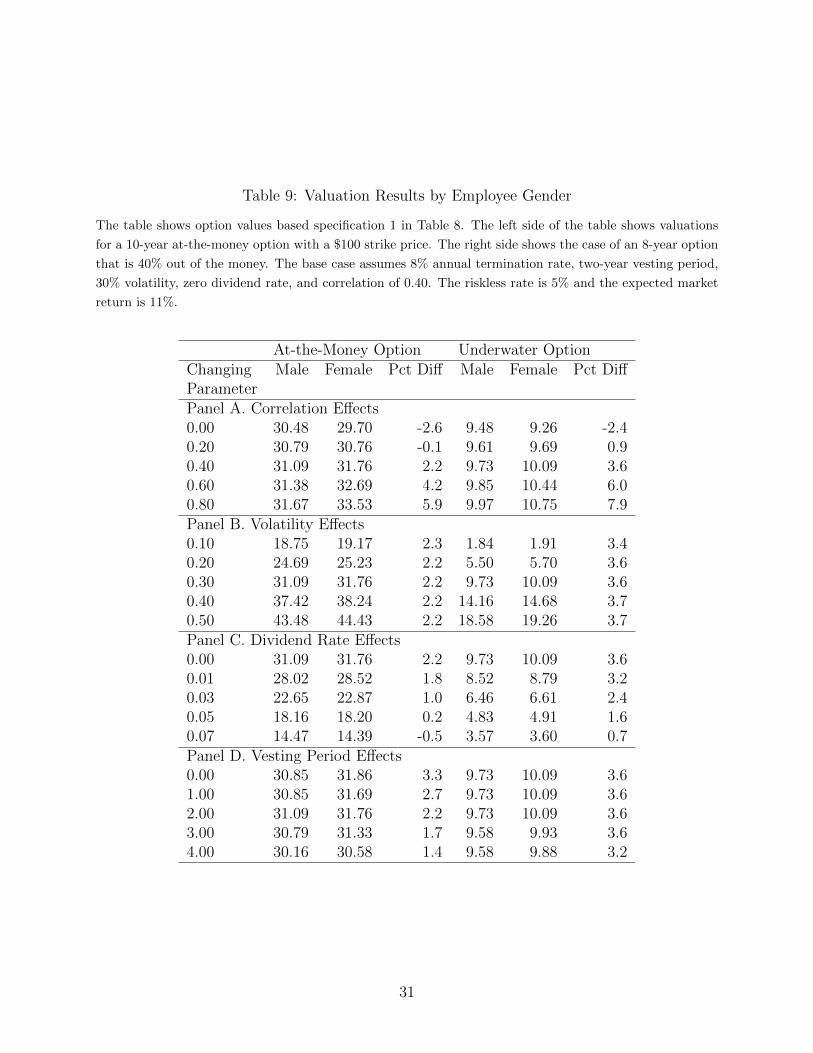
Table 9: Valuation Results by Employee Gender
The table shows option values based specification 1 in Table 8. The left side of the table shows valuations
for a 10-year at-the-money option with a $100 strike price. The right side shows the case of an 8-year option
that is 40% out of the money. The base case assumes 8% annual termination rate, two-year vesting period,
30% volatility, zero dividend rate, and correlation of 0.40. The riskless rate is 5% and the expected market
return is 11%.
At-the-Money Option Underwater OptionChanging Male Female Pct Diff Male Female Pct DiffParameterPanel A. Correlation Effects0.00 30.48 29.70 -2.6 9.48 9.26 -2.40.20 30.79 30.76 -0.1 9.61 9.69 0.90.40 31.09 31.76 2.2 9.73 10.09 3.60.60 31.38 32.69 4.2 9.85 10.44 6.00.80 31.67 33.53 5.9 9.97 10.75 7.9Panel B. Volatility Effects0.10 18.75 19.17 2.3 1.84 1.91 3.40.20 24.69 25.23 2.2 5.50 5.70 3.60.30 31.09 31.76 2.2 9.73 10.09 3.60.40 37.42 38.24 2.2 14.16 14.68 3.70.50 43.48 44.43 2.2 18.58 19.26 3.7Panel C. Dividend Rate Effects0.00 31.09 31.76 2.2 9.73 10.09 3.60.01 28.02 28.52 1.8 8.52 8.79 3.20.03 22.65 22.87 1.0 6.46 6.61 2.40.05 18.16 18.20 0.2 4.83 4.91 1.60.07 14.47 14.39 -0.5 3.57 3.60 0.7Panel D. Vesting Period Effects0.00 30.85 31.86 3.3 9.73 10.09 3.61.00 30.85 31.69 2.7 9.73 10.09 3.62.00 31.09 31.76 2.2 9.73 10.09 3.63.00 30.79 31.33 1.7 9.58 9.93 3.64.00 30.16 30.58 1.4 9.58 9.88 3.2
31
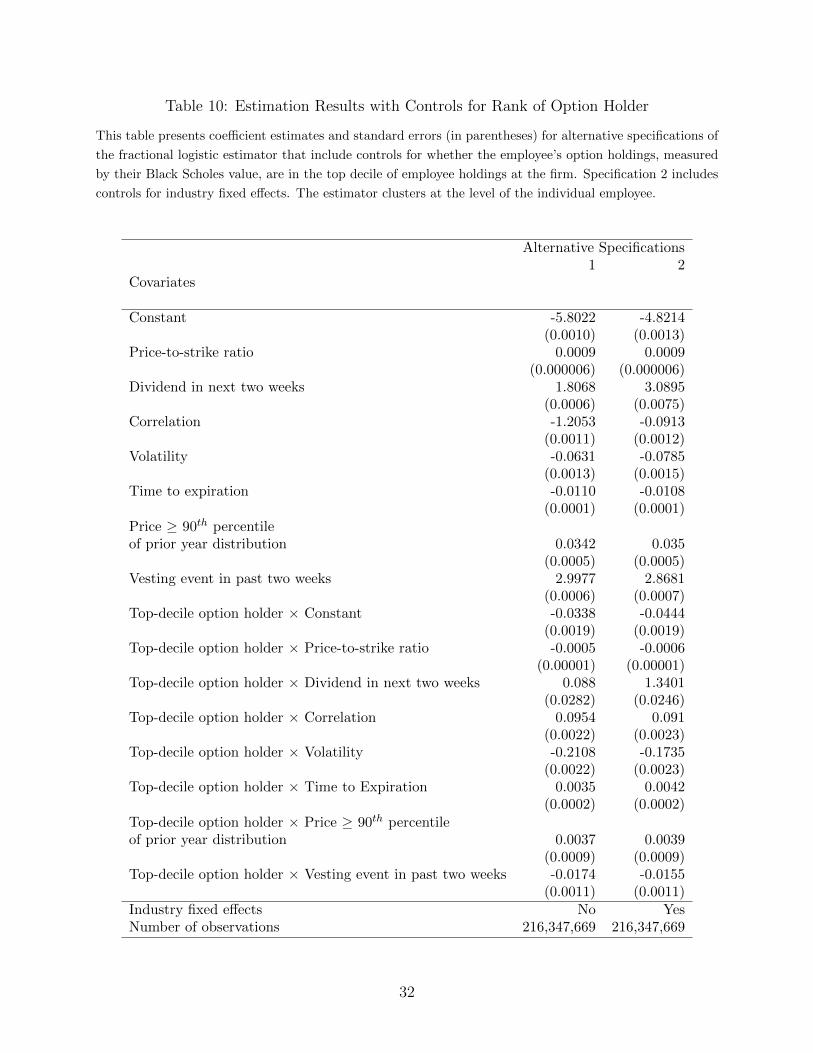
Table 10: Estimation Results with Controls for Rank of Option Holder
This table presents coefficient estimates and standard errors (in parentheses) for alternative specifications of
the fractional logistic estimator that include controls for whether the employee’s option holdings, measured
by their Black Scholes value, are in the top decile of employee holdings at the firm. Specification 2 includes
controls for industry fixed effects. The estimator clusters at the level of the individual employee.
Alternative Specifications1 2
Covariates
Constant -5.8022 -4.8214(0.0010) (0.0013)
Price-to-strike ratio 0.0009 0.0009(0.000006) (0.000006)
Dividend in next two weeks 1.8068 3.0895(0.0006) (0.0075)
Correlation -1.2053 -0.0913(0.0011) (0.0012)
Volatility -0.0631 -0.0785(0.0013) (0.0015)
Time to expiration -0.0110 -0.0108(0.0001) (0.0001)
Price ≥ 90th percentileof prior year distribution 0.0342 0.035
(0.0005) (0.0005)Vesting event in past two weeks 2.9977 2.8681
(0.0006) (0.0007)Top-decile option holder × Constant -0.0338 -0.0444
(0.0019) (0.0019)Top-decile option holder × Price-to-strike ratio -0.0005 -0.0006
(0.00001) (0.00001)Top-decile option holder × Dividend in next two weeks 0.088 1.3401
(0.0282) (0.0246)Top-decile option holder × Correlation 0.0954 0.091
(0.0022) (0.0023)Top-decile option holder × Volatility -0.2108 -0.1735
(0.0022) (0.0023)Top-decile option holder × Time to Expiration 0.0035 0.0042
(0.0002) (0.0002)Top-decile option holder × Price ≥ 90th percentileof prior year distribution 0.0037 0.0039
(0.0009) (0.0009)Top-decile option holder × Vesting event in past two weeks -0.0174 -0.0155
(0.0011) (0.0011)Industry fixed effects No YesNumber of observations 216,347,669 216,347,669
32
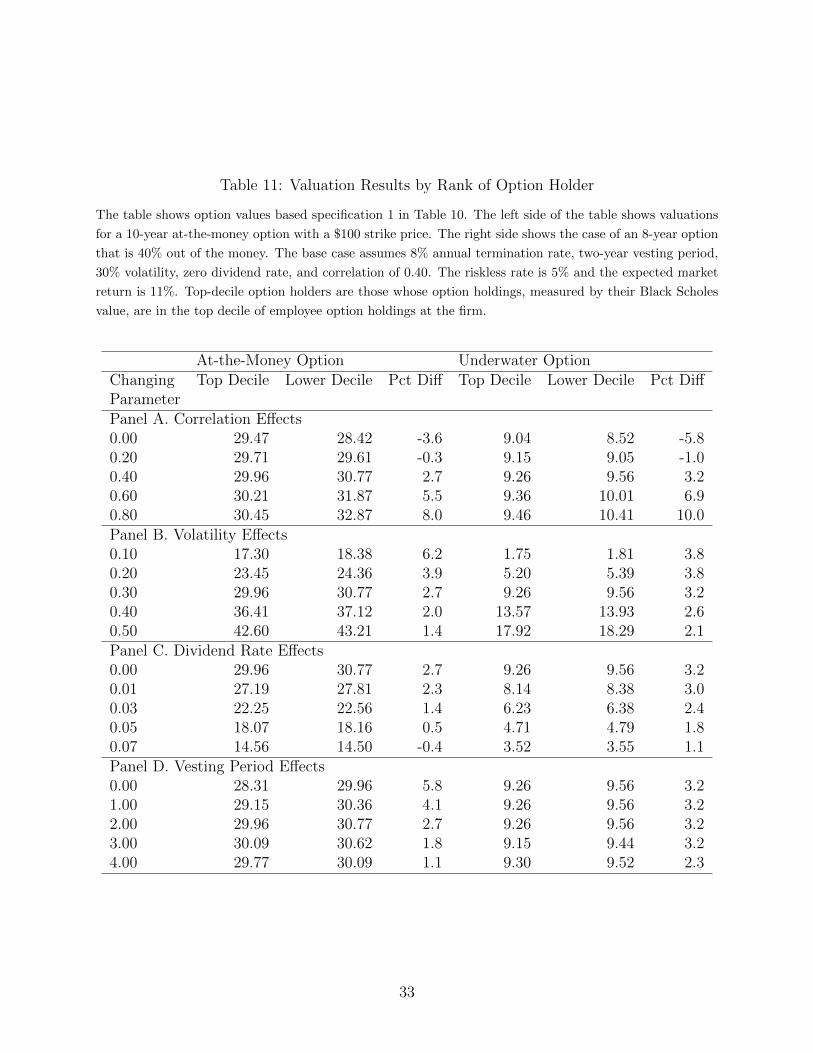
Table 11: Valuation Results by Rank of Option Holder
The table shows option values based specification 1 in Table 10. The left side of the table shows valuations
for a 10-year at-the-money option with a $100 strike price. The right side shows the case of an 8-year option
that is 40% out of the money. The base case assumes 8% annual termination rate, two-year vesting period,
30% volatility, zero dividend rate, and correlation of 0.40. The riskless rate is 5% and the expected market
return is 11%. Top-decile option holders are those whose option holdings, measured by their Black Scholes
value, are in the top decile of employee option holdings at the firm.
At-the-Money Option Underwater OptionChanging Top Decile Lower Decile Pct Diff Top Decile Lower Decile Pct DiffParameterPanel A. Correlation Effects0.00 29.47 28.42 -3.6 9.04 8.52 -5.80.20 29.71 29.61 -0.3 9.15 9.05 -1.00.40 29.96 30.77 2.7 9.26 9.56 3.20.60 30.21 31.87 5.5 9.36 10.01 6.90.80 30.45 32.87 8.0 9.46 10.41 10.0Panel B. Volatility Effects0.10 17.30 18.38 6.2 1.75 1.81 3.80.20 23.45 24.36 3.9 5.20 5.39 3.80.30 29.96 30.77 2.7 9.26 9.56 3.20.40 36.41 37.12 2.0 13.57 13.93 2.60.50 42.60 43.21 1.4 17.92 18.29 2.1Panel C. Dividend Rate Effects0.00 29.96 30.77 2.7 9.26 9.56 3.20.01 27.19 27.81 2.3 8.14 8.38 3.00.03 22.25 22.56 1.4 6.23 6.38 2.40.05 18.07 18.16 0.5 4.71 4.79 1.80.07 14.56 14.50 -0.4 3.52 3.55 1.1Panel D. Vesting Period Effects0.00 28.31 29.96 5.8 9.26 9.56 3.21.00 29.15 30.36 4.1 9.26 9.56 3.22.00 29.96 30.77 2.7 9.26 9.56 3.23.00 30.09 30.62 1.8 9.15 9.44 3.24.00 29.77 30.09 1.1 9.30 9.52 2.3
33