erpminer data mining solution for school … month wise distribution of latecomers list in current...
TRANSCRIPT

ERPMINER
DATA MINING SOLUTION FOR SCHOOL ERP SYSTEM
BY:
HIMANSHU JAIN

INTRODUCTION
• Every school has its own ERP system - A School software that is used to manage day to
day activities like Attendance, Timetable, Exams, Finance, Salary, etc.
• An ERP system is used to INPUT data only. Custom Reporting generates some Tabular
Reports, which are used to get the idea about various things like Expenses, Performance
etc.
• ERPMiner is a Data-Mining tool, which works on top of the existing School ERP Systems. It
helps the management to draw various strategic decisions by displaying various facts and
figures through graphs.
like:-
1. Which teacher needs to improve his/her performance.
2. Which student needs to improve and in which subject.
3. Which department has major expenses.
4. Which class has most number of defaulters.
VIEWS IN ERP MINER
• Principal View
• Teacher View
• Student / Parent View

PRINCIPAL VIEW
• Principal View is the most powerful view and can view almost all the aspects
of the system.
• Principal can also view Teacher's View & Student's View.

PRINCIPAL VIEW CAN BE DIVIDED INTO 7 BROAD SUB-CATEGORIES:-
• Snapshot - Day to Day activities.
• Academic - Academic scores related information.
• Operational - School Strength, Enrollment, Attrition related information.
• Financial - Financial & Expenses related information.
• Student - Students related information.
• Admission - Admissions related information.
• PREDICTION - Result Prediction & Student DropOff Predictions on the basis of
around 30 parameters.

PRINCIPAL VIEW - SNAPSHOT
• It contains different Drill-Down Charts like:-
• Student Absence Chart
• Teacher Absence Chart
• Defaulters Chart
• Discipline Chart

STUDENT ABSENCE CHART
• It contains class-wise Absent count of
students.
• On drill-down, It will show the Name
of the students of each class, who
are coming late.

TEACHER ABSENCE CHART
• It contains Teacherwise Absent
Count.
• On drill-down, it will show the dates
on which the teacher was coming
late.

DEFAULTERS
• It contains Yearly Defaulters Count
• 1st Drill-Down - the report to see class
wise distribution of defaulters in a
particular Year.
• 2nd Drill-Down - the report of all
defaulter students of a particular class.
• 3rd Drill-Down - the report of all
months, in which that particular student
didn't pay the fees.

DISCIPLINE
Month wise distribution of Latecomers list
in current session.
• 1st Drill-Down - the latecomers count of
Students, Teachers, Transport(Bus) in a
particular month.
• 2nd Drill-Down, when click on :-
• Student: Class-wise distribution of
students, who are coming late.
• Teacher: List of all Teachers, who are
coming late in school.
• Transport: List of all Buses, who are
coming late in school.

PRINCIPAL VIEW - ACADEMIC
Academic related information like:-
• Student Score distribution.
• Yearly Academic Results.
• Top Class Teacher's Statistics.

SCHOOL STRENGTH
The current strength of Students, Teachers, Non-Teaching Staff along with the
comparison of previous year count.

STUDENT SCORE DISTRIBUTION
Range wise distribution of all students of all standards
Ex - In Standard 7th
Below 30 lies 10 students
Between 30-45 lies 25 students
Between 46-60 lies 45 students
Between 61-75 lies 35 students
Between 76-90 lies 25 students
Above 90 lies 10 students

YEARLY ACADEMIC RESULTS
Yearly comparison of results of all standards.
Ex - Standard 7th
In year 2016 - 75% result
In year 2015 - 70% result
In year 2014 - 60% result
In year 2013 - 80% result
In year 2012 - 60% result

TOP CLASS TEACHER'S STATISTICS
Ranking of Teachers on the basis of various parameters:-
- Student results
- Lecture Attendance
- Assignment Created
- Other Participations
- Teacher Qualifications
- Sentimental Analysis

PRINCIPAL VIEW - OPERATIONAL
• It contains School Strength, Enrollment, Attrition related information:-
• School Strength
• Schoolwide Enrollment Statistics
• Parents Occupation
• Yearly Attrition Reporting
• Grade wise Student Attrition Report

SCHOOL STRENGTH
Comparison of Boys/Girls & Teachers within the school.

SCHOOLWIDE ENROLLMENT STATISTICS
Enrollments Comparison of Expected/Actual Enrollments & Student Attritions
- Expected Enrollments
- Actual Enrollments
- Student Attrition

PARENTS OCCUPATION
Comparison of Parents on the basis of their occupations in
- Private Sector
- Public Sector
- Self Employed

YEARLY ATTRITION REPORTING
Comparison of Student Attrition Reasons on the basis of following Reasons:-
- Academic
- Mobility
- Boredom
- Personal

GRADE WISE STUDENT ATTRITION REPORT
Standard wise comparison of Student Attritions Reasons.
PRINCIPAL VIEW - FINANCIAL
• It contains Financial & Expenses related information:-
• Various Financial Statistics with monthly comparison
• Month wise Cash Flow Statistics
• Expenses

VARIOUS FINANCIAL STATISTICS WITH MONTHLY COMPARISON
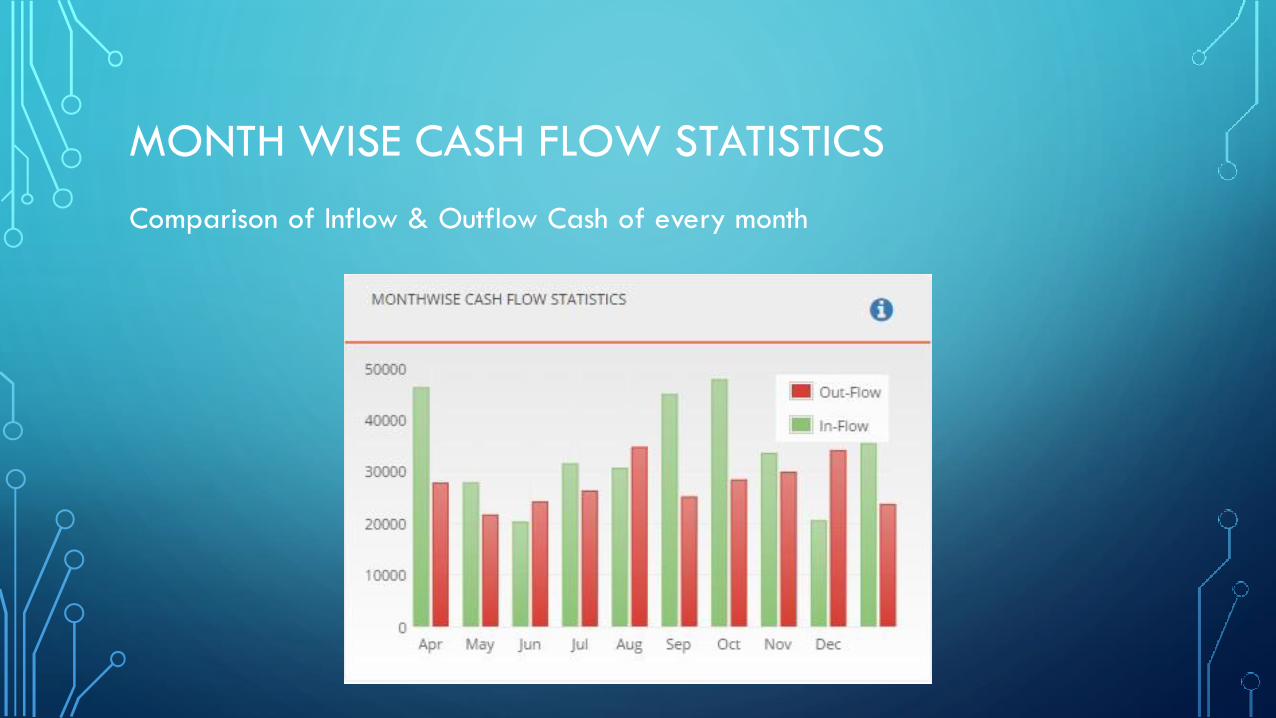
MONTH WISE CASH FLOW STATISTICS
Comparison of Inflow & Outflow Cash of every month

EXPENSES
Categorization of Expenses in various category and their respective monthly comparison
TEACHER VIEW
• A teacher can see his/her performance on the basis of their children
performance and their own performance.
• Teacher can view his own View & their Student's View.

TEACHER VIEW CAN BE DIVIDED INTO 4 BROAD SUB-CATEGORIES:-
• Overview - Statistics shown for his class.
• Class Students Report – Students related details
• Events - Timeline View.
• Contact - Contact Details.

TEACHER VIEW - OVERVIEW
• It contains Statistics shown as a class teacher and as a subject teacher.
• Classroom Snapshot
• Subject Snapshot
• Toppers & Failure Student in his/her CLASS.
• Toppers & Failure Student in his/her SUBJECT.

CLASSROOM SNAPSHOT
Range-wise distribution of students of the class. Ex:
1. In range 71-80, lies 30 students.
2. In range 80-90, lies 17 students
3. etc

SUBJECT SNAPSHOT
Results of all classes in which the teacher taught his subject.

TOPPERS & FAILURES IN TEACHER CLASS.

TOPPERS & FAILURES IN TEACHER SUBJECT.

CLASS STUDENTS REPORT
Colorful representation of all students of class-teacher, indicating the +ve & -ve points of each particular
student.
1. Red boxes represent the students on Risk.
2. Yellow boxes represent the students on Average.
3. Green boxes represent Excellent Students.

TEACHER VIEW - EVENTS
Timeline view of all events done by teacher with his/her own class or in
subject class. Like:-
• Prop used to give lecture to students.
• Assignment created for students.
• Parents teacher meeting.
• Arranged a picnic for students.

TEACHER VIEW - CONTACT DETAILS
• Contact details along with google Map, showing the address of teacher on
Google Map.

STUDENT / PARENT VIEW
• This view gives the complete analysis of student on the basis of batches given
by teachers, scores obtain in assessments etc
• Student can view his own View only.

STUDENT VIEW CAN BE DIVIDED INTO 5 BROAD SUB-CATEGORIES:-
• Overview - Statistics of the student.
• Progress & Prediction
• Association
• Contact Details
• Events

STUDENT VIEW - OVERVIEW
• List of all Positive and Negative Batches obtained by student.

STUDENT VIEW - MONTHLY ASSESSMENT SCORES
• Comparison of Monthly Assessment scores of a student on
various subjects/statistics like
- Math
- Reading
- Writing
- etc
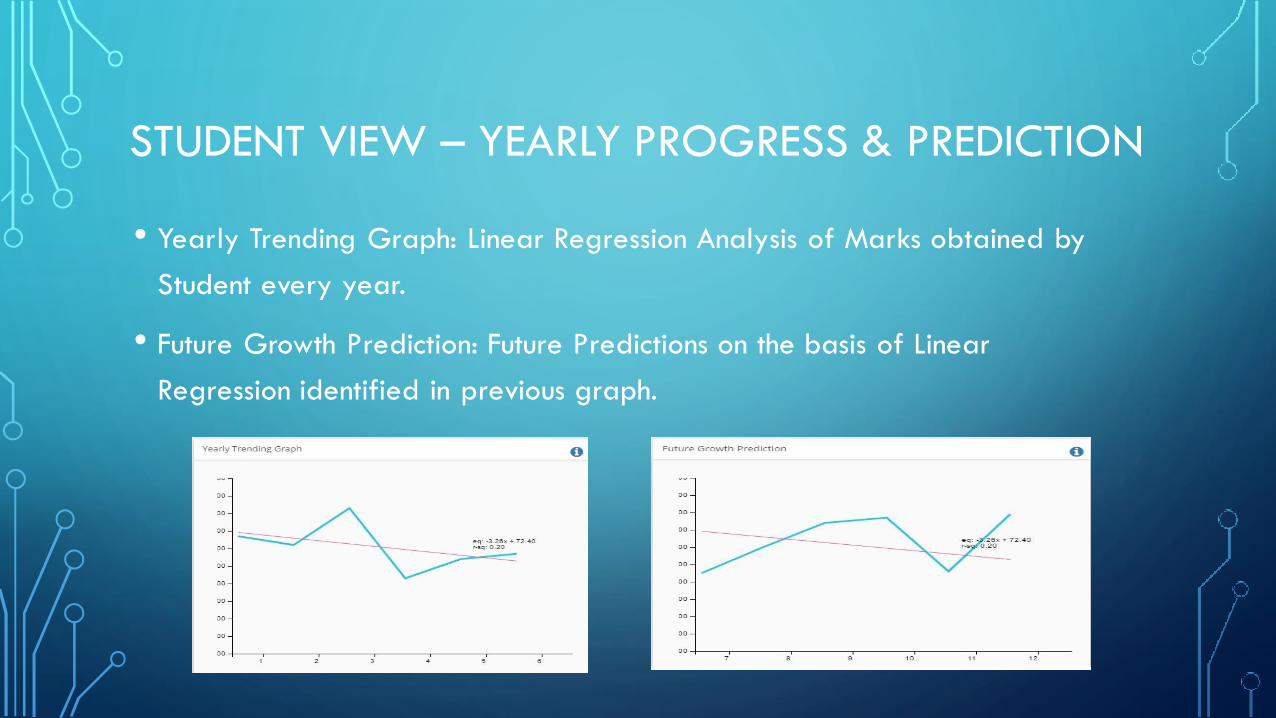
STUDENT VIEW – YEARLY PROGRESS & PREDICTION
• Yearly Trending Graph: Linear Regression Analysis of Marks obtained by
Student every year.
• Future Growth Prediction: Future Predictions on the basis of Linear
Regression identified in previous graph.

STUDENT VIEW – MONTHLY PROGRESS & PREDICTION
• Monthly Trending Graph: Linear Regression Analysis of Marks obtained by
Student every month.
• Monthly Growth Predictions: Future Predictions on the basis of Linear
Regression identified in previous graph.

STUDENT ASSOCIATION – PERFORMANCE MATRIX (SUBJECT WISE)
• Subject wise score of student and comparison with Minimum/Maximum Marks obtained within
the same subject throughout the class.
• Drill-Down report of marks obtained by a student in each CHAPTER of a particular subject.

STUDENT ASSOCIATION – PERFORMANCE MATRIX (CLASS LEVEL)
• Radar Chart to understand the overall performance of a student on the basis
of multiple factors like:-
- Academics
- Attendance
- Sports
- Participations
- Extracurricular Activities

STUDENT ASSOCIATION – PERFORMANCE MATRIX (STUDENT GOALS)
• A goal is explained as a specific task/activity/homework, which a teacher can
give to student to improve in a particular subject.
• Goal wise
performance of a
student and
comparison with
minimum & maximum
Range of score for
that particular Goal.

STUDENT VIEW - EVENTS
Timeline view of all events related
to the student. Like:-
• Student didn’t attend a lecture.
• Assignment completed by student.
• Parents teacher meeting.
• Attend an extracurricular activity.

STUDENT VIEW - CONTACT DETAILS
• Guardian Contact Details
• Student Contact Details on
Google Map.