erosion, sediment, and turbidity control and monitoring
TRANSCRIPT

Erosion, Sediment, and Turbidity Control and Monitoring Research to Meet Water Quality Goals
North Carolina Department of Transportation
PROJECT AUTHORIZATION NO. HWY- 2014-20
Principal Investigators
Richard A. McLaughlin, Ph.D. Professor
Department of Crop and Soil Sciences And
W. Gregory Cope, Ph.D. William Neal Reynolds Professor Department of Applied Ecology
North Carolina State University
Raleigh, North Carolina

I
Technical Report Documentation Page
1. Report No.
FHWA/NC/2014-20
2. Government Accession No. …leave blank…
3. Recipient’s Catalog No. …leave blank…
4. Title and Subtitle
Erosion, Sediment, and Turbidity Control and Monitoring
Research to Meet Water Quality Goals
5. Report Date
6. Performing Organization Code …leave blank…
7. Author(s) Richard A. McLaughlin and W. Gregory Cope
8. Performing Organization Report No. …leave blank…
9. Performing Organization Name and Address Departments of Crop & Soil Sciences and Applied Toxicology North Carolina State University Campus Box 7620 Raleigh, NC 27695
10. Work Unit No. (TRAIS) …leave blank…
11. Contract or Grant No. …leave blank…
12. Sponsoring Agency Name and Address North Carolina Department of Transportation Research and Analysis Group
13. Type of Report and Period Covered
Final Report
1 South Wilmington Street Raleigh, North Carolina 27601
08/16/2013 – 06/30/2017
14. Sponsoring Agency Code 2014-20
Supplementary Notes: …leave blank…

II
16. Abstract Construction sites usually create large areas of exposed soil which can produce runoff containing high
sediment concentrations and turbidity. While standard practices can improve water quality, the use of surface outlets and chemical treatment can further reduce the discharged water turbidity by an order of magnitude or more. This project explored a variety of approaches to both measuring water quality and improving it, as well as the potential impacts to freshwater mussels from of construction site runoff. Four different surface skimmer outlet devices were tested under controlled, full-scale conditions to determine discharge rates as affected by orifice size and water depth. Water quality determination by up to three different sampling methods and two recording meters were also compared for turbidity values. A portable rainfall simulator capable of producing 2-3” hr-1 rainfall over a large (10’ x 20’) area was constructed for erosion testing. Two different dissolved flocculant dosers were constructed to have dosing controlled by either rainfall or runoff flow rates, and these were tested on three construction projects. Finally, a range of polyacrylamides (PAM) with different properties were tested for toxicity to three freshwater mussel species. Further testing of the toxicity of settled sediment, PAM-flocculated sediment, and suspended sediment was performed over two time periods for juvenile mussels. Three of the four skimmers had relatively linear discharges as water levels dropped from 5’ to 1’ in the test basin, with a fourth having steadily declining discharge rates. The discharge rates determined in this study were often different than those provided by the manufacturer, but test conditions were not necessarily the same. Turbidity determination by sampling or by recording probe often produced different values but usually similar trends, and the two recording probes provided similar values. The rainfall simulator produced droplets similar to those reported for other simulators and the rainfall distribution was highly influenced by wind speed, since no shielding was used. However, 2-3” h-1 occurred in most of the plot area. The two different dissolved flocculant dosers had success in reducing turbidity primarily during moderate events, but during high-flow and –sediment events there was turbidity reduction but turbidity remained high. These would have to be scaled up to treat those events. The mussels appeared to tolerate the PAM at concentrations >10X the targeted treatment level, and suspended sediment stressed the juvenile mussels more than settled or PAM-flocculated sediment. This suggests reducing turbidity with PAM would also reduce impacts on mussels in receiving waters.
17. Key Words Turbidity, polyacrylamide, freshwater mussels, toxicity, rainfall simulator
18. Distribution Statement …leave blank…
19. Security Classif. (of this report)
Unclassified
20. Security Classif. (of this page) Unclassified
21. No. of Pages
22. Price …leave blank…
Form DOT F 1700.7 (8-72) Reproduction of completed page authorized

III
Disclaimer The contents of this report reflect the views of the author(s) and not necessarily the
views of the University. The author(s) are responsible for the facts and the accuracy
of the data presented herein. The contents do not necessarily reflect the official
views or policies of either the North Carolina Department of Transportation or the
Federal Highway Administration at the time of publication. This report does not
constitute a standard, specification, or regulation.
Acknowledgments
Tasks 1-4 were primarily the responsibility of technicians Jamie Luther and
Chris Niewoehner in the Department of Crop and Soil Sciences. Task 5 was
conducted by MS student Sean Buczek. In both cases, a number of undergraduate
students provided assistance. We are always grateful for the assistance of the NC
DOT Roadside Environmental Unit staff for finding potential sites for us that meet
our requirements. We also greatly appreciated the assistance of project staff and
contractors to get our devices deployed in a timely manner. It is only through this
type of cooperation that we can conduct research on “live” construction sites, which
is one reason why North Carolina is considered a leader in erosion, sediment, and
turbidity control.
Executive Summary
Since surface outlets have been required by the United States Environmental
Protection Agency, a number of devices have come on the market to “skim” the
water from near the surface of sediment basins. Four of these were tested for
discharge rate in a full-scale test basin, with three having a fairly constant discharge
but a fourth having steadily declining discharge as the water depth decreased. The
measured discharge rate was often different than the manufacturer stated, but
testing conditions may have a large influence on discharge rates. Measurements of
turbidity were compared between various types of sampling and continuous
recording sensors (sondes) and were found to be different at times and similar at
others. Sondes have the advantages of collecting more time points and eliminating
the need to analyze a sample after collection, but there is also no way to explain
data which might appear to be in error (e.g. outliers). A portable rainfall simulator
was devised which can be used in the field for evaluating erosion control on large

IV
areas (10’ x 20’). The droplet size distribution is similar to published values for
simulators and it can produce 2” – 3” hr-1.
Polyacrylamide (PAM) has become an effective tool for reducing construction related
suspended sediment and turbidity, which are considered to have significant adverse
impacts on aquatic ecosystems and are a leading cause of the degradation of North
American streams and rivers. The most common approach to using PAM to reduce
turbidity is to place the dry, granular form on check dams and in water conveyances
upstream of an area for settling the resulting flocs. An alternative using dissolved
PAM dispensed proportional to rainfall or flow, using only gravity, was demonstrated
to work well within a certain range of conditions. High flows and turbidity can
overwhelm this system, however. Prior to this research, no information existed on
the toxicity of PAM compounds to native freshwater mussels (Family Unionidae),
one of the most imperiled faunal groups globally. Following standard test guidelines,
we exposed juveniles mussels (test duration 96-h) and glochidia larvae (test duration
24-h) to 5 different anionic PAM compounds and 1 non-ionic compound. Species
tested included the Yellow Lampmussel (Lampsilis cariosa), an Atlantic Slope
species that is listed as endangered in North Carolina, the Appalachian Elktoe
(Alasmidonta raveneliana), a federally endangered Interior Basin species, and the
Washboard (Megalonaias nervosa), a common Interior Basin species. We found
that median lethal concentrations (LC50) of PAM ranged from 411.7 to > 1000 mg/L
for glochidia and from 128.7 to > 1000 mg/L for juveniles. All LC50s were orders of
magnitude greater (2–3) than concentrations typically recommended for turbidity
control (1–5 mg/L), regardless of their molecular weight or charge density. Our
results demonstrate that the PAM compounds tested were not acutely toxic to the
mussel species and life stages tested, indicating minimal risk of short-term exposure
from PAM applications in the environment. We also conducted acute (96 h) and
chronic (20 d) laboratory tests with juvenile fatmucket (Lampsilis siliquoidea) and
three exposure conditions (non-flocculated settled sediment, suspended sediment,
and PAM-flocculated settled sediment), over a range of environmentally relevant
turbidity treatments (50, 250, 1,250, and 3,500 nephelometric turbidity units; NTU).
We found no effect of turbidity treatment or exposure condition on mussel survival in
either the acute or chronic tests, suggesting a high level of tolerance for L.
siliquoidea in short-term exposures. In contrast, we found significant reductions in
protein concentration, ATP production, and oxidized proteins in mussels acutely
exposed to suspended sediment, indicating physiological protective responses that
limit energy production and reactive oxygen species accumulation under unfavorable

V
environmental conditions. Our results suggest that anionic PAM applied to reduce
suspended sediment may be effective at minimizing the adverse effects of short-
term turbidity exposure on juvenile freshwater mussels without eliciting additional
lethal or sub-lethal toxicity. Altogether, our findings should facilitate improved
management and regulatory decision making for turbidity control best management
practices in waters where freshwater mussels reside.

VI
Contents Technical Report Documentation Page ................................................................................. I
Disclaimer ............................................................................................................................III
Acknowledgments ................................................................................................................III
Executive Summary .............................................................................................................III
List of Figures ................................................................................................................. VII
List of Tables ....................................................................................................................... XI
Introduction and Literature Review ....................................................................................... 1
IMPROVING WATER QUALITY FOR CONSTRUCTION SITE DISCHARGES ................ 2
Task 1. Identifying cost-effective monitoring procedures and equipment to characterize
turbidity levels in basin discharges and receiving waters. ................................................. 2
Task 2. Evaluating methods to achieve surface dewatering requirements. ...................... 4
Task 3. Developing a portable rainfall simulator capability and evaluate ground covers for
erosion and vegetation establishment on construction sites. ............................................. 7
Task 4. Testing new products and approaches for reducing turbidity on active
construction sites. ............................................................................................................12
RESULTS AND DISCUSSION ............................................................................................15
Task 1. Cost-Effective Monitoring of Turbidity ..................................................................15
Task 2. Surface Dewatering Device Comparison ............................................................19
Task 3. Develop a Portable Rainfall Simulator. ...............................................................23
Task 4. Test New Products and Approaches for Reducing Turbidity. ..............................26
Task 5: ASSESSMENT OF POLYACRYLAMIDE FLOCCULANTS, TURBIDITY, AND
SEDIMENT ON NATIVE FRESHWATER MUSSELS ......................................................37
INTRODUCTION .............................................................................................................37
MATERIALS AND METHODS .........................................................................................38
Test chemicals .............................................................................................................38
Test organisms.............................................................................................................38
RESULTS ........................................................................................................................39
SUMMARY ......................................................................................................................40
CONCLUSIONS ..............................................................................................................40

VII
Recommendations ...........................................................................................................45
Implementation and Technology Transfer Plan ................................................................46
APPENDICES .....................................................................................................................47
APPENDIX 1: Acute Toxicity of Polyacrylamide Flocculants to Early Life Stages of
Freshwater Mussels ............................................................................................................47
APPENDIX 1 .......................................................................................................................48
Acute Toxicity of Polyacrylamide Flocculants to Early Life Stages of Freshwater Mussels
(Accepted by Environmental Toxicology and Chemistry) .....................................................48
Abstract ...........................................................................................................................48
INTRODUCTION .............................................................................................................49
MATERIALS AND METHODS .........................................................................................51
Test chemicals .............................................................................................................51
Test organisms.............................................................................................................51
Glochidia test assessment ...........................................................................................52
Juvenile test assessment .............................................................................................52
Water chemistry ...........................................................................................................52
Statistical analysis ........................................................................................................53
RESULTS ........................................................................................................................53
DISCUSSION ..................................................................................................................53
CONCLUSION .................................................................................................................56
REFERENCES ................................................................................................................57
TABLES ...........................................................................................................................62
APPENDIX 2 .......................................................................................................................65
Sublethal effects of turbidity, sediment, and polyacrylamide on native freshwater mussels
(Accepted by Journal of American Water Resources Association) ......................................65
ABSTRACT .....................................................................................................................65
(KEY TERMS: turbidity, invertebrates, toxicology, erosion, best management practices
[BMP’s], environmental impacts) ......................................................................................65
INTRODUCTION .............................................................................................................65
MATERIALS AND METHODS .........................................................................................68
Experimental design and conditions .............................................................................68

VIII
Test sediment ..............................................................................................................68
Suspended sediment exposure ....................................................................................69
Settled sediment exposure ...........................................................................................70
Flocculated sediment exposure ....................................................................................70
Test chemicals .............................................................................................................70
Test organisms.............................................................................................................70
Mussel assessment ......................................................................................................71
Water chemistry ...........................................................................................................71
Protein concentration/ATP ...........................................................................................71
Oxidative stress-protein oxidation.................................................................................72
Statistical analysis ........................................................................................................72
RESULTS ........................................................................................................................72
Acute exposures ..............................................................................................................72
Chronic exposures ...........................................................................................................74
DISCUSSION ..................................................................................................................75
LITERATURE CITED .......................................................................................................79

VII
List of Figures
Figure 1. The two sondes tested during this project: Eureka Manta 2 (top) and Hach
Hydrolab MS 5 (bottom). ............................................................................................ 4
Figure 2. Faircloth skimmer at the beginning of a test. ............................................. 5
Figure 3. Erosion Supply skimmer. ............................................................................ 6
Figure 4. ProDrain-70 skimmer. ................................................................................ 6
Figure 5. Marlee Model 1 skimmer. ........................................................................... 7
Figure 6. Constructed rainfall simulator in operation at SECREF. ............................ 8
Figure 7. Closeup view of droplet distribution from one nozzle. ................................ 9
Figure 8. View of the cutoff valve and pressure gauge for one of the nozzles. ....... 10
Figure 9. Support pipes inserted flush with the ground so when the simulator nozzle
system is removed the grass can be mowed. Metal pipe serves as addition support
for the PVC pipe....................................................................................................... 11
Figure 10. View of the rainfall distribution for the simulator. Pump and reservoir
tank are shown beyond the simulator. ..................................................................... 12
Figure 11. Picture of the New Zealand doser (top) and diagram of the dosing
system (bottom). ...................................................................................................... 13
Figure 12. Modified New Zealand dosing system deployed in the field. The system
is dosing a slope drain prior to a small sediment basin. ........................................... 14
Figure 13. Float valve system for dispensing PAM solutions. Float is in PVC stilling
well on left, valve on right with green hose coming from the source tank. PAM is
released into clear hose on fence post in the middle of the channel below the weir.15

VIII
Figure 14. Turbidity measurements in a basin at SECREF using four different
methods of obtaining data. ....................................................................................... 17
Figure 15. Turbidity in a skimmer basin at SECREF during a test run as measured
by two sondes and a sampler. ................................................................................. 17
Figure 16. Turbidity measurement testing site in Durham showing the two sondes,
stage samplers, and automatic sampler intake tubing. ............................................ 18
Figure 17. Turbidity measured by two sondes in a skimmer basin on the Durham
Connector project. .................................................................................................... 19
Figure 18. Temperature and turbidity in a skimmer basin after a storm event. ....... 19
Figure 19. Discharge curves for the 2” Faircloth Skimmer with four different orifices.
................................................................................................................................. 20
Figure 20. Discharge curves for the 4” Faircloth Skimmer with three different
orifices. .................................................................................................................... 21
Figure 21. Discharge curves for the 3” Erosion Supply skimmer with three orifices.
................................................................................................................................. 21
Figure 22. Discharge curves for the Marlee Model 1 Float Skimmer with three
different orifices........................................................................................................ 22
Figure 23. Discharge curves for the Prodrain 70 Skimmer at three different settings
for slot openings....................................................................................................... 22
Figure 24. Raindrop size distribution for the rainfall simulator using the flour method.
................................................................................................................................. 24
Figure 25. Wind effects on rainfall distribution. No wind on left, 6 -14 mph center, 3
– 10 mph on right, numbers represent rainfall rate (in h-1), arrow shows wind
direction. .................................................................................................................. 25
Figure 26. NZ Doser installed at the Rolesville 401 Bypass site. Slope drain brings
water from the road bed to a small skimmer basin. .................................................. 29
Figure 27. Float valve doser calibration curve as tested at SECREF. ..................... 30

IX
Figure 28. Calculated concentration of PAM in flow at different water depths behind
weir. ......................................................................................................................... 30
Figure 29. Cumulative rain and basin exit flow at the Rolesville NZ doser
installation. ............................................................................................................... 31
Figure 30. Turbidity in storm water flows into slope drain, out of slope drain, and out
of skimmer basin at the Rolesville NZ Doser installation, April 7, 2014. .................. 31
Figure 31. Rainfall driven liquid PAM dosing device (NZ Doser) installation in the
foreground with skimmer basin (background right) and float valve doser (background
left) at the Greensboro test site. ............................................................................... 32
Figure 32. Closeup of the float valve dissolved PAM dosing device installation in
Greensboro. ............................................................................................................. 33
Figure 33. Rainfall driven doser (NZ Doser) flow and turbidity for a storm on
12/24/2014 ............................................................................................................... 33
Figure 34. Float valve doser flow and turbidity for a storm on 1/12/2015 ................ 34
Figure 35. Turbidity samples by date at each of the three monitoring locations ..... 34
Figure 36. Durham Connector site installation. NZ doser installed at upper basin
inlet, float valve doser installed in one of the upper basin outlet pipes (source tank on
dam). ........................................................................................................................ 35
Figure 37. Turbidity at the inlet and outlet of the Durham Connector basin for the
April 27, 2017 runoff event. Only the NZ doser was working during this storm.
Values over 40,000 NTU were plotted as 40,000 NTU. ........................................... 36
Figure 38. Turbidity reduction in the Durham Connector skimmer basin over 9 storm
events with different rainfall totals. ........................................................................... 36
Figure 39. Mean (+SE) juvenile mussel survival at 20 d post exposure to sediment
test conditions. No significant differences were found between any of test conditions
(settled sediment, suspended sediment, PAM-flocculated sediment) or turbidity
treatment levels (α = 0.05). ...................................................................................... 42

X

XI
List of Tables
Table 1. Sampling equipment tested for comparison of water quality values. .......... 3
Table 2. Skimmers tested in our model sediment basin. ........................................... 5
Table 3. Discharge rates from our testing compared to the manufacturer data. ..... 23
Table 4. Effect of wind on the rainfall rate and variation in the rainfall simulator. .... 25
Table 5. Average turbidity before the dosers and at the basin exit for the
Greensboro installation. Values represent 2 events each for the “No PAM” averages
and 9 events for the “With PAM Solution” averages. ............................................... 35
Table 6. Properties of selected anionic and non-ionic polyacrylamide (PAM)
compounds used in acute toxicity tests with larval (glochidia) and juvenile freshwater
mussels. Information derived via SNF online product brochure at
http://www.snfgroup.com/images/pdf/Brochures_in_English/Catalogue%20Poudres.
pdf. ........................................................................................................................... 43
Table 7. Median lethal concentrations (LC50s) for acute toxicity of anionic
polyacrylamide (PAM) to native freshwater mussels (95% CI). Acute exposures to
the following PAM compounds resulted in insufficient mortality to calculate an
LC50s: APS 705, FLOPAM™ FA 920, FLOPAM™ AN 923 VHM, and FLOPAM™
AN 913 VHM. ........................................................................................................... 44

1
Introduction and Literature Review
A proposed regulation issued by USEPA (2009), entitled the Effluent Limit
Guidelines (ELG), mandated that the turbidity of water released from construction
sites not to exceed 280 nephelometric turbidity units (NTU). This proposal was
challenged in court and was rescinded, but it suggested that regulatory agencies
were considering the impact of construction site stormwater on receiving waters.
The current standard for North Carolina ranges from 10 – 50 NTU, depending on the
receiving water, but this is generally ignored and instead evidence of increasing
turbidity in receiving waters is the enforcement trigger. Sediment deposited beyond
construction site boundaries are also considered a violation.
Our recent research has shown that improved sediment control methods can provide
an economically viable strategy to reduce sediment discharges by increasing the
retention capacity of the sediment traps to over 90% (McCaleb and McLaughlin,
2008; Thaxton et al., 2004; Thaxton and McLaughlin, 2005). This can be greatly
improved through the addition of polyacrylamide to flocculate small particles, greatly
reducing the settling time required for the deposition of the silt to clay size fraction of
soils (McLaughlin and Bartholomew, 2007; Bhardwaj and McLaughlin, 2008;
Bhardwaj et al., 2008; McLaughlin et al., 2009a,b). In addition, PAM can reduce soil
erosion when applied with straw to levels similar to more expensive erosion control
blankets (Babcock and McLaughlin, 2011). The great potential for PAM to reduce
erosion at a relatively low cost suggests that it will be part of an integrated approach
to meet the ELG.
Freshwater mussels (family Unionidae) are suspension- and deposit-feeding,
aquatic organisms that live burrowed in sediments of streams and rivers.
Unfortunately, they are one of the most rapidly declining faunal groups in the North
America. About 70% of the nearly 300 freshwater mussel species found in the North
America are considered vulnerable to extinction or already extinct (Bogan 1993;
Williams et al. 1993). The decline of mussel populations in North America has
occurred steadily since the mid 1800s and has been attributed to an array of factors
associated with pollution and water quality degradation and habitat destruction and
alteration (Strayer et al. 2004; Cope et al. 2008).
Native freshwater mussels have a unique life history and reproductive strategy
(McMahon and Bogan 2001) that makes them susceptible to physical and chemical
stressors in the water column and in aquatic sediments. Specifically, male mussels

2
release sperm directly into the water that is then taken up through the siphoning
action of the females. The eggs are fertilized inside the female and the embryos
develop into larvae called glochidia in specialized pouches (marsupia) of the gills.
Once fully developed, the female expels the glochidia into the water where they
must attach to the fins or gills of an appropriate fish species to complete their
metamorphosis into juvenile mussels. The glochidia develop on the fish for about 14
to 40 days and then fall to the bottom sediment where they burrow and reside as
adults.
Recent research conducted in our laboratory and in several other laboratories from
around the United States has led to the development and publication of a standard
guideline for conducting toxicity tests with early life stages of freshwater mussels
(ASTM 2006). This guideline has provided the foundation for the generation of
consistent and robust toxicity information for early life stages of freshwater mussels
that is now being used by the U.S. Environmental Protection Agency in the
development or revision of National Water Quality Criteria. Specifically, our
research with the method has contributed to much needed information on the acute
and chronic toxicity of pesticides, metals, ions, ammonia, and temperature (Pandolfo
et al. 2012, 2010a,b; Mosher et al. 2012; Bringolf et al. 2007a,b,c; Augspurger et al.
2003); however, data gaps for other important environmental stressors such as
turbidty, suspended sediment, and the chemical compounds used to flocculate and
remove sediment during erosion control practices such as polyacrylamide (PAM)
remain unaddressed. This research will seek to fill those data gaps and aid in
improved management and regulatory decision making.
IMPROVING WATER QUALITY FOR CONSTRUCTION SITE DISCHARGES
Task 1. Identifying cost-effective monitoring procedures and equipment
to characterize turbidity levels in basin discharges and receiving waters.
The traditional method of monitoring storm water is to install an automatic sampler at
an outlet of interest. This is typically programmed to obtain samples periodically
based on flow (flow-paced or –weighted sampling), with the samples collected after
each storm and analyzed in a laboratory. Another approach to sampling is to use

3
stage samplers, which obtain a single sample once the water in the stream or pond
has risen to a certain level. These are often called “bottles on a stick” because the
sampling bottles are placed at different levels on a post in the water body to obtain
samples on the rising limb of an event. An alternative is to use a sensor placed on a
recording probe, often called a sonde when multiple parameters are measured, to
directly measure the parameters in the water body. One of the problems with this for
turbidity in sediment-rich waters is that the sensor can become clogged and either
provide erroneous data or stop working altogether. This would not be known until
the data is downloaded, so no data would be available for that event. In addition,
there are no sensor for suspended sediment, so a relationship between turbidity and
suspended sediment has to be established. It should be noted that automatic
samplers often malfunction and do not obtain samples, as well. The water sampling
equipment tested in this project are listed in Table 1 and the two sondes are shown
in Figure 1.
Table 1. Sampling equipment tested for comparison of water quality values.
Sampler Type Brand Parameters Approximate
Cost
Automatic
sampler
Isco Flow-paced
sampling
$5,000
Stage Sampler Rising stage
single samples
$50
Sonde Manta 2
(Eureka)
Turbidity,
temperature,
level
$5,000
Sonde Hydrolab MS5
Water Quality
Multiprobe
(Hach
Environmental)
Turbidity,
temperature,
level
$5,000

4
Figure 1. The two sondes tested during this project: Eureka Manta 2 (top) and Hach
Hydrolab MS 5 (bottom).
Task 2. Evaluating methods to achieve surface dewatering
requirements.
Sediment basins are required to dewater from the surface and there are a number of
commercial devices which are available to achieve this goal while also dewatering
the basin after flow to it has stopped. These are listed in Table 2 and are shown at
various stages of testing in Figures 2-5.

5
Table 2. Skimmers tested in our model sediment basin.
Skimmer Outlet Type Cost
Faircloth (Figure 1.2) Screened opening
suspended 10-12 cm
below surface
2”: $545 4”: $1,290
Erosion Supply (Figure
1.3)
4 screened openings
suspended below surface
3”: $625
Prodrain 70 (Figure 1.4) Slots along pipe with an
adjustable cover
Marlee Model 1 (Figure
1.5)
Weighted ring with water
entering from below
1 – 2.5”: $695
Figure 2. Faircloth skimmer at the beginning of a test.

6
Figure 3. Erosion Supply skimmer.
Figure 4. ProDrain-70 skimmer.

7
Figure 5. Marlee Model 1 skimmer.
Task 3. Developing a portable rainfall simulator capability and evaluate
ground covers for erosion and vegetation establishment on
construction sites.
Natural rainfall distribution has been shown to be the key element in establishing
vegetation and the success or failure of erosion control products. We demonstrated
that in several previous projects, where the success in establishing vegetation and
preventing erosion was highly correlated with the timing, amount, and intensity of
rainfall events. When evaluating erosion control products in the field, depending on
natural events therefore introduces uncertainty about how they perform under heavy
rainfall, since that may not occur during the evaluation period. Therefore, we wanted
to develop a portable rainfall simulator with which we can test erosion control
products in the field under a known rainfall amount and intensity.
There are a number of rainfall simulator designs and an ASTM standard design. In
order to make a portable simulator which could test a relatively large area, we
modified the ASTM design to include single nozzles mounted on 4 m PVC pipe and
directed upward (Figures 6-7). In order to maintain the appropriate pressure for the

8
desired droplet size distribution, pressure gauges were included at the bottom of
each riser (Figure 8) and adjusted for the height of the water in the riser pipe. Each
riser was supported by a steel pipe installed adjacent to the PVC pipe (Figure 9). To
make the system portable, a 250 gallon tank was the reservoir and the water was
delivered by a 2” gasoline pump (Figure 10). The reservoir capacity could be
increased using larger tanks or water trucks using the same pump.
Figure 6. Constructed rainfall simulator in operation at SECREF.

9
Figure 7. Closeup view of droplet distribution from one nozzle.

10
Figure 8. View of the cutoff valve and pressure gauge for one of the nozzles.

11
Figure 9. Support pipes inserted flush with the ground so when the simulator nozzle
system is removed the grass can be mowed. Metal pipe serves as addition support
for the PVC pipe.

12
Figure 10. View of the rainfall distribution for the simulator. Pump and reservoir
tank are shown beyond the simulator.
Task 4. Testing new products and approaches for reducing turbidity on
active construction sites.
The main focus of this task was to try different systems for introducing PAM into
stormwater flows on construction sites. Our system was based on the rain-driven,
liquid-doser developed in New Zealand (Figure 11). We reduced the volume of the
flocculant tank to approximately 110 L (30 gal) and used steel tubing for the roof
support system to make it more portable (Figure 12). Two people can carry an
assembled unit, or it can be broken down so that one person can install it. A second
dosing system was devised using a simple float valve system behind a square-notch
weir (Figure 13). This allows for the solution to be dispensed fairly proportionately to
flow.

13
Figure 11. Picture of the New Zealand doser (top) and diagram of the dosing
system (bottom).

14
Figure 12. Modified New Zealand dosing system deployed in the field. The system
is dosing a slope drain prior to a small sediment basin.

15
Figure 13. Float valve system for dispensing PAM solutions. Float is in PVC stilling
well on left, valve on right with green hose coming from the source tank. PAM is
released into clear hose on fence post in the middle of the channel below the weir.
RESULTS AND DISCUSSION
Task 1. Cost-Effective Monitoring of Turbidity
There were three water sampling methods tested including the automatic sampler
(ISCO), which samples based on time or flow, the stage sampler, which simply takes
Valve
Solution Hose
Solution
Outlet
Float in Stilling Well Flow

16
a sample as the water level rises, and the grab sample. In all three cases the
samples need to be analyzed for turbidity either in the field or in the laboratory. We
also tested two water quality sondes, the Eureka Manta 2 and the Hach Hydrolab 5.
These have the capability of logging turbidity, along with many other variables, in the
water based on time intervals set by the user.
Data collected under controlled conditions indicated that the Eureka sonde produced
somewhat lower turbidity levels compared to the three sampling methods (Figure
14). Testing at much lower turbidity levels, however, with the Eureka sonde and lab
analysis of sampled water mostly similar, and the Hach sonde consistently lower
(Figure 15). Recent testing in an actual skimmer basin (Figure 16) also had the
Eureka readings mostly higher than the Hach unit (Figure 17). Both units had some
anomalies during that testing. The Hach sonde responded to a rain event with
higher turbidity, as expected, but the Eureka did not. Both units had some data
points above the curve even when no rain event occurred, which could have been
instrument error or something like a tadpole kicking up some sediment. This
suggests that data would need to be scrutinized for anomalies and those points
removed in order to get a true assessment of turbidity.
The change in turbidity with a rising water level in a skimmer basin at the Durham
Connector site is demonstrated in Figure 18. The watershed draining to this basin is
relatively undisturbed and vegetated, and the diversion ditches are lined to prevent
erosion, so the turbidity levels are very low compared to others at this site (see
below). The highest temperature recorded was 41oC, or 105oF, which is likely higher
than mosquitoes can tolerate (Marinho et al., 2016) and this may partially explain
why they are not a problem around sediment basins.
Marinho, R. A., E. B. Beserra, M. A. Bezerra-Gusmão, V. de S. Porto, R. A. Olinda,
and C. A. C. dos Santos. 2016. Effects of temperature on the life cycle, expansion,
and dispersion of Aedes aegypti (Diptera: Culicidae) in three cities in Paraiba, Brazil.
J. Vector Ecology 41(1): 1-10.

17
Figure 14. Turbidity measurements in a basin at SECREF using four different
methods of obtaining data.
Figure 15. Turbidity in a skimmer basin at SECREF during a test run as measured
by two sondes and a sampler.

18
Figure 16. Turbidity measurement testing site in Durham showing the two sondes,
stage samplers, and automatic sampler intake tubing.

19
Figure 17. Turbidity measured by two sondes in a skimmer basin on the Durham
Connector project.
Figure 18. Temperature and turbidity in a skimmer basin after a storm event.
Task 2. Surface Dewatering Device Comparison
Four surface dewatering devices were tested for flow characteristics at different
depths of water. Each one had tests conducted with at least three orifices or
settings. The Faircloth, Erosion Supply, and Marlee skimmers had relatively steady
discharges from depths of 5’ down to around 1’, with discharge rates dropping
sharply after that (Figures 19-22). The Prodrain 70 skimmer had a steady decline in
discharge rates as the water level dropped, but had the highest flow rate at fully
open among the skimmers tested (Figure 23).
The average flow rate was calculated from the data and compared to the flow
information from the manufacturers in Table 3. Deviations from the stated flows
ranged from -60% for Marlee skimmer to +32% for the 2” Faircloth skimmer. The
method of calculation can affect the flow estimate. We measured discharge rate
continuously in a V-notch weir, but if you divide the total volume discharged by the
time the discharge rate can vary from that substantially. This is particularly true for
the skimmers with substantially different discharge rates at different water levels.
The Marlee skimmer discharge rate was about half of what is listed by the

20
manufacturer, possible due to testing conditions. We used a 10’ length of cellular
foam core (DWV) pipe to attach the skimmer to the outlet pipe, which might be
longer than their test system. Because the Marlee attaches to the outlet pipe with a
relatively stiff rubber hose, a longer pipe would result in a lower angle on the hose
and so less downward pressure from it. The pipe is also lighter than schedule 40 or
other pipe which might have been used in the manufaturer’s tests. Both of these
conditions would allow the Marlee skimmer to float higher in the water column and
reduce flow. We also tested from about five feet of water, likely a greater depth than
the manufacturer testing.
Figure 19. Discharge curves for the 2” Faircloth Skimmer with four different orifices.

21
Figure 20. Discharge curves for the 4” Faircloth Skimmer with three different
orifices.
Figure 21. Discharge curves for the 3” Erosion Supply skimmer with three orifices.

22
Figure 22. Discharge curves for the Marlee Model 1 Float Skimmer with three
different orifices.
Figure 23. Discharge curves for the Prodrain 70 Skimmer at three different settings
for slot openings.

23
Table 3. Discharge rates from our testing compared to the manufacturer data.
Skimmer 24-h Flow Rate (cubic feet)
Manufacturer Average This
Study (flow
rate 5’ – 1’
depth)
Average
This Study
(volume/time
5’ – 1’
depth)
Difference (%)
By flow/by
volume
Faircloth 2” no
plug
3,283 4,275 4,343 +30/+32
Faircloth 4” no
plug
20,108 19,574 19,793 -3/-2
Erosion
Supply 3” no
plug
6,738-10,511
(1’-4’ depths)
6,636 9,117 -2 to -37/+35
to -13
Marlee Model
1 2” orifice
5,652 2,362 2,281 -58/-60
ProDrain-70
12” (fully
exposed slots)
17,952 20,940 24,600 +16/+37
Task 3. Develop a Portable Rainfall Simulator.
The portable rainfall simulator (PRS) was constructed as described in Methods using
readily available materials. The key element in the system is the inclusion of
pressure gauges for each riser pipe to the nozzles. The pressure needs to be within
a small range in order to maintain droplet sizes which are somewhat similar to
natural rainfall. Most of the droplets (92%) generated at the operating pressure (12
pounds per square inch (PSI) at the base of the riser pipe) fell within a range of 1-4
mm (Figure 24), similar to other rainfall simulators (Abudi et al., 2012). Because the

24
simulator is run in an open environment, the effect of wind was also determine.
There were two heavy rain areas when there was no wind, with around 5 in h-1 in
those areas (Figure 25). Most of the area had 2-3 in h-1 with one corner receiving
less than 1 in h-1. At a high wind of 6-14 miles per hour (mph), most of the area
received 1-2 in h-1 with heavier amount on the leeward side. With a more moderate
wind of 3-10 mph, the distribution was actually the best over the entire area. This is
reflected in the fact that the average rainfall rate was similar with the moderate wind
compared to no wind but with somewhat less variation (Table 4).
Abudi, I., G. Carmi, and P. Berliner. 2012. Rainfall simulator for field runoff studies.
J. Hydrology 454-455: 76-81. http://dx.doi.org/10.1016/j.jhydrol.2012.05.056.
Figure 24. Raindrop size distribution for the rainfall simulator using the flour method.

25
Figure 25. Wind effects on rainfall distribution. No wind on left, 6 -14 mph center, 3
– 10 mph on right, numbers represent rainfall rate (in h-1), arrow shows wind
direction.
Table 4. Effect of wind on the rainfall rate and variation in the rainfall simulator.
Test #
Average Rainfall Rate (inches/hr)
Standard Deviation (inches/hr)
Wind Speed (Avg. to Gust)
Wind Direction
1 2.21 0.78 6 to 11 NW
2 1.94 0.92 10 to 16 NE
3 2.94 0.79 3 to 7 S
4 2.20 0.81 6 to 14 NW
5 2.80 0.99 4 to 9 SE
6 2.65 0.76 3 to 9 SW
7 2.92 1.07 0 N/A

26
Task 4. Test New Products and Approaches for Reducing Turbidity.
The “standard” approach to reducing turbidity is to apply granular PAM to check
dams upstream of a skimmer basin, with the flowing water dissolving the PAM as it
passes through/over the dam. This requires two steps in attaining flocculation: first
dissolving the PAM into the water and second, the PAM molecules unfolding
(activating) in order to bind the suspended particles. A faster approach would be to
dispense the PAM already dissolved in water, so the reaction can occur more
quickly. However, this requires a system to dispense the dissolved PAM into the
flowing water relatively proportional to the flow.
We constructed two systems for dispensing dissolved PAM. The first, referred to as
the New Zealand dispenser, was adapted from the design introduced in New
Zealand. This is essentially a displacement system, in which rainwater is collected
into a container floating on the PAM solution. As the rainwater accumulates, the
container sinks into the PAM solution and displaces it into a hose and out into the
stormwater flow. In this way, the displacement is proportional to the rainfall amount
and rate, which in turn should be relatively proportional to ditch flow. An example of
an installation is shown in Figure 26, which was our first installation at the Rolesville
bypass project.
The second was a simple float valve attached to a reservoir of dissolved PAM. This
was installed on a square-notch weir, which allowed the valve to open in a linear
proportion to flow as the water level rose behind the weir. This was demonstrated in
testing at SECREF as shown in Figure 13. The solution release rate was found to
be fairly linear in proportion to the water level in the weir (Figure 27). The calculated
concentration of PAM in the runoff varies, but is mostly in the 0.5-1 mg L-1 range
(Figure 28), usually enough to reduce turbidity depending on turbidity levels. In both
types of dosers, the PAM concentration dictates the dosing concentration, but
concentrations much above 1 g L-1 may become too viscous to flow easily in the
tubing. The solution is also prone to freezing in cold weather unless the source
tanks are buried.
An example of a successful treatment using the NZ system occurred on April 7,
2014 during an approximately 2.5 cm (1”) rain event. The rainfall and flow dynamics
are shown in Figure 28, with peak flow occurring around the middle of the event.
This is reflected in turbidity entering the 30 cm (12”) slope drain, with a peak of 1400

27
NTU about in the middle of the sample set, then tapering off (Figure 29). There
were too few samples from the pipe inlet to note much of trend, but the discharge
water leaving the basin was maintained at about 100 NTU throughout the event. We
tested the PAM concentration in the basin exit and it was not detectable (< 5 mg L-1)
It is unlikely this low of a turbidity level could have been achieved by the skimmer
alone.
In late 2014, the NZ Doser (Figure 31)and float valve doser (Figure 32) were also
installed on the the I-840 Urban Loop extension project around Greensboro, NC,
between US 70 and US 29 (STIP # U-2525B). The dosers were installed on two
different ditches that contributed to a large two-tier sediment basin. Weirs were
installed within each ditch to monitor flow and to take upstream water quality
samples, using automated samplers, before dosing of PAM occurred. A third
automated sampler was located at the exit of the upper tier of the basin to assess
water quality as runoff exited the basin.
The turbidity reductions were not always substantial for various reasons. With
higher flow, higher turbidity levels can be expected (Figure 33) and there might not
be sufficient PAM dosing to achieve treatment. In other cases, the flow was so low
that there was little change in turbidity (Figure 34). Figure 35 again shows the
collected turbidity samples and that turbidity exiting the basin was lower than
samples collected before PAM dosing occurred. Over a number of events, however,
the turbidity in the basin discharge was reduced to 100-200 NTU, which is much
lower than expected in skimmer basin discharges. This was demonstrated when we
stopped dosing for several storms, with the resulting turbidity and TSS rising by 2X
or more (Table 5).
The dosers were also installed on a tiered skimmer basin on the Durham Connector
project. Both dosers we deployed at the basin, with the NZ doser dispensing inside
the inlet pipe and the float valve doser dispensing inside one of the two outlet pipes
from the upper basin (Figure 36). The area draining into the basin consisted of the
roadbed, a parking and staging area, and several unvegetated slopes. As a result,
sediment loads were very heavy and turbidities very high – sometimes >40,000 NTU
(the upper limit of our meter). An example of the reduction in turbidity is shown in
Figure 37, but in spite of substantial reduction the outlet turbidities were often in the
5,000 – 10,000 NTU. In most of the storms the float valve doser did not dispense
PAM due to a mechanical problem. Laboratory tests suggested that the dosing level
would need to be at least 10 mg L-1 to achieve substantial turbidity reduction, which

28
is a much higher concentration than normally required. One example of the potential
treatment occurred on May 10, when both dosers were functioning. The inlet
turbidity was 9,000 – 15,000 NTU but grab samples of the outlet turbidity were 19-37
NTU. This also illustrates how mechanical systems, even when quite simple, can be
unreliable unless carefully managed and protected from heavy sediment loads.

29
Figure 26. NZ Doser installed at the Rolesville 401 Bypass site. Slope drain brings
water from the road bed to a small skimmer basin.

30
Figure 27. Float valve doser calibration curve as tested at SECREF.
Figure 28. Calculated concentration of PAM in flow at different water depths behind
weir.

31
Figure 29. Cumulative rain and basin exit flow at the Rolesville NZ doser
installation.
Figure 30. Turbidity in storm water flows into slope drain, out of slope drain, and out
of skimmer basin at the Rolesville NZ Doser installation, April 7, 2014.

32
Figure 31. Rainfall driven liquid PAM dosing device (NZ Doser) installation in the
foreground with skimmer basin (background right) and float valve doser (background
left) at the Greensboro test site.

33
Figure 32. Closeup of the float valve dissolved PAM dosing device installation in
Greensboro.
Figure 33. Rainfall driven doser (NZ Doser) flow and turbidity for a storm on
12/24/2014
0
1000
2000
3000
4000
5000
6000
7000
8000
0
0.05
0.1
0.15
0.2
0.25
0.3
0.35
0.4
12/2
4/2
01
4 2
:24
12/2
4/2
01
4 3
:36
12/2
4/2
01
4 4
:48
12/2
4/2
01
4 6
:00
12/2
4/2
01
4 7
:12
12/2
4/2
01
4 8
:24
12/2
4/2
01
4 9
:36
12/2
4/2
01
4 1
0:4
8
12/2
4/2
01
4 1
2:0
0
12/2
4/2
01
4 1
3:1
2
12/2
4/2
01
4 1
4:2
4
12/2
4/2
01
4 1
5:3
6
Tu
rbid
ity
(N
TU
)
Flo
w (
cfs)
NZ Doser Flow
Basin Exit Flow
Pre-NZ Doser Turbidity
Basin Exit Turbidity

34
Figure 34. Float valve doser flow and turbidity for a storm on 1/12/2015
Figure 35. Turbidity samples by date at each of the three monitoring locations
0
200
400
600
800
1000
1200
1400
0
0.01
0.02
0.03
0.04
0.05
0.06
0.07
0.081
/12/2
015
0:0
0
1/1
2/2
015
4:4
8
1/1
2/2
015
9:3
6
1/1
2/2
015
14:2
4
1/1
2/2
015
19:1
2
1/1
3/2
015
0:0
0
1/1
3/2
015
4:4
8
1/1
3/2
015
9:3
6
1/1
3/2
015
14:2
4
1/1
3/2
015
19:1
2
1/1
4/2
015
0:0
0
1/1
4/2
015
4:4
8
Tu
rbid
ity
(N
TU
)
Flo
w (
cfs)
Float Valve Flow
Basin Exit Flow
Pre-Float Valve Turbidity
Basin Exit Turbidity
0
1000
2000
3000
4000
5000
6000
7000
8000
12/1
7/1
4 0
:00
12/2
7/1
4 0
:00
1/6
/15
0:0
0
1/1
6/1
5 0
:00
1/2
6/1
5 0
:00
2/5
/15
0:0
0
2/1
5/1
5 0
:00
Tu
rbid
ity
(N
TU
)
Basin Exit Turbidity
Pre-NZ Doser Turbidity
Pre-Float Valve Doser

35
Table 5. Average turbidity before the dosers and at the basin exit for the
Greensboro installation. Values represent 2 events each for the “No PAM” averages
and 9 events for the “With PAM Solution” averages.
Sample Locations With PAM Solution No PAM
Average Turbidity
Average TSS
Average Turbidity
Average TSS
(NTU) (mg/L) (NTU) (mg/L)
Before New Zealand Doser 2969 1596 3243 2206
Before Float-Valve Doser 725 615 1324 1262
Basin Exit 163 57 372 286
Figure 36. Durham Connector site installation. NZ doser installed at upper basin
inlet, float valve doser installed in one of the upper basin outlet pipes (source tank on
dam).

36
Figure 37. Turbidity at the inlet and outlet of the Durham Connector basin for the
April 27, 2017 runoff event. Only the NZ doser was working during this storm.
Values over 40,000 NTU were plotted as 40,000 NTU.
Figure 38. Turbidity reduction in the Durham Connector skimmer basin over 9 storm
events with different rainfall totals.
0
10000
20000
30000
40000
50000
7.1 2.6 0.58 0.33 2.2 3 0.63 3.33 0.74
Turb
idit
y (N
TU)
Storm Rainfall Total (in)
Durham Connector Basin Turbidity
In Out

37
Task 5: ASSESSMENT OF POLYACRYLAMIDE FLOCCULANTS,
TURBIDITY, AND SEDIMENT ON NATIVE FRESHWATER MUSSELS
INTRODUCTION
The negative effects of soil erosion and suspended sediment on aquatic habitat and freshwater fauna are well-documented. Deleterious effects on aquatic ecosystems are often the result of the physical and chemical alterations that include sedimentation, light attenuation, and associated adsorbed contaminants. Urbanization, mining, road construction, and intensive agricultural practices can all lead to increased soil erosion and influxes of sediment to surface waters. These activities can result in landscape alterations permuting the natural hydrology, increasing runoff velocity, and sediment loading. The United States Environmental Protection Agency has concluded that nearly half of the waterways in the U.S. are significantly impaired by sediment and has designated sediment the primary pollutant of aquatic environments.
Increased turbidity from the suspended sediment fraction of inorganic sediments, which is the prevailing component contributing to turbidity during episodes of excessive runoff from disturbed soils, has been associated with adverse abiotic factors, such as decreased dissolved oxygen, light penetration, and increased water temperature. These changes have resulted in reduced diversity and biomass of primary producers (macrophytes, periphyton, and phytoplankton) in aquatic systems causing a cascade of deleterious effects on freshwater communities. Research has also identified a multitude of negative impacts and responses in fish as a result of suspended sediment exposure including avoidance, reduced hatching success, altered predator-prey interactions, damaged gill tissue, and direct mortality. However, the effects of turbidity on native freshwater mussels (family Unionidae), the most imperiled faunal group in North America have yet to be fully investigated, especially during early life stages.
Efforts to reduce suspended sediment released from construction sites to meet regulatory requirements have advanced through the implementation of a variety of Best Management Practices (BMPs). Many of these techniques are designed to reduce erosion by decreasing the velocity of runoff, thereby reducing the energy potential required to erode and suspend sediment. However, to remove the smallest fraction of suspended sediment < 20 μm from runoff effluent, chemical flocculants such as polyacrylamide (PAM) are used. PAM is a commercially available water-soluble polymer used in many different industries as a flocculating agent. PAM has been shown to reduce the turbidity of runoff by as much as 91% before reaching receiving waters, especially when used in conjunction with other

38
BMPs. Given the relatively high efficacy and putative low toxicity to aquatic organisms, chemical flocculants such as anionic PAM are quickly becoming an essential chemical tool to mitigate the well-studied impacts of increased suspended sediment on aquatic biota. However, more information is needed about the possible chemical and physical interactions of PAM within the environment to understand its risks and to determine its efficacy for mitigating the effects of suspended sediment on other organisms, such as native freshwater mussels, in a safe manner.
The overall goal of this research was to assess the practice of applying PAM to aquatic ecosystems in relation to potential impacts on freshwater mussels. The specific objectives were to develop toxicological information on 5 representative anionic PAM compounds and 1 non-ionic compound commonly used for the reduction of turbidity in stormwater runoff on the early life stages of 3 species of native freshwater mussels and to determine the relative sensitivity of freshwater mussels to a range of sediment and PAM-treated sediment conditions.
MATERIALS AND METHODS
Test chemicals
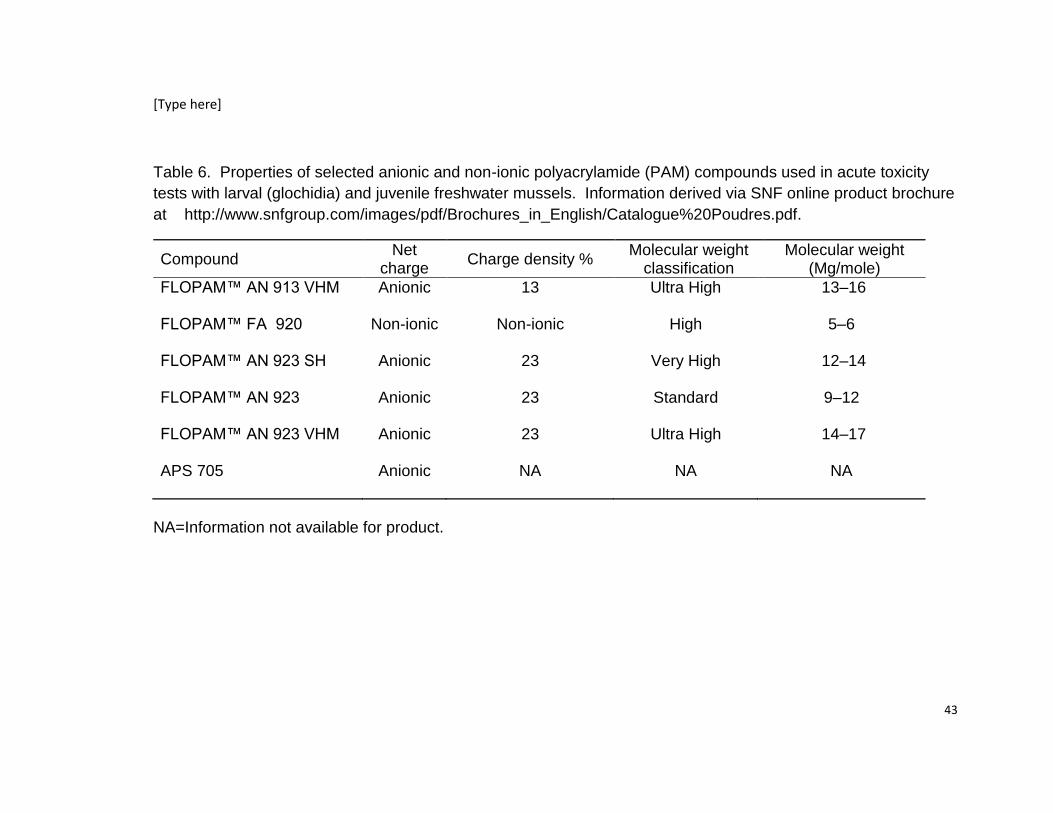
Six compounds of PAM were selected for toxicity testing in this study to provide a range of charge density, molecular weight, and net charge (Table 1), all characteristics that may influence potential toxicity. All PAM compounds were obtained in granular form, and homogeneous stock solutions of PAM (1 g/L) were prepared by slowly adding (approximately 1 g/min) granular PAM to reconstituted hard water and mixing on a stir plate for 24 h at room temperature. The stock solution was used in tests directly following mixing. The following polyacrylamide compounds were obtained from SNF Holding Company (Riceboro, Georgia, USA) FLOPAM: FA 920, AN 923, AN 923 SH, AN 923 VHM, and AN 913 VHM. APS 705 was purchased from Applied Polymer Systems (Woodstock, Georgia, USA). The chemical property and compound information for SNF compounds tested were provided by the manufacturer (Table 1), but APS 705 is a proprietary mixture of anionic PAMs, and it was included in testing because it is commonly used in environmental applications. In an effort to encompass both the typical effective range for turbidity reduction and to reach concentrations great enough to develop a median lethal concentration (LC50), each PAM compound had six treatment concentrations ranging from 5 to 1000 mg/L. Test exposure concentrations were verified and the using published methods and the measured concentrations of PAM in our tests ranged from 84 to 109% of the calculated nominal concentrations.
Test organisms
We tested four species of native freshwater mussels, chosen based on geographical distribution, phylogenetic tribe, and conservation status: Lampsilis

39
cariosa, Lampsilis siliquoidea (tribe-Lampsilini), Alasmidonta raveneliana (tribe-Anodontini), and Megalonaias nervosa (tribe-Quadrulini). L. cariosa is an Atlantic Slope species in various classifications of conservation status across its range from stable to critically imperiled (state endangered, North Carolina). A. raveneliana, an Interior Basin species, endemic to the headwaters of the Tennessee River in western North Carolina and eastern Tennessee, is state (North Carolina and Tennessee) and federally endangered. M. nervosa, a common Interior Basin species, is widely-distributed and stable in the Mississippi and Gulf of Mexico drainages. L. siliquoidea is a common Interior Basin species widely-distributed and considered stable in the Mississippi and Gulf drainages of the U.S. and has been used extensively in toxicological testing.
L. cariosa and A. raveneliana were provided by the Aquatic Epidemiology and Conservation Laboratory, North Carolina State University, College of Veterinary Medicine (Raleigh, North Carolina, USA), and L. siliquoidea and M. nervosa were supplied by the mussel culture laboratory at Missouri State University (Springfield, Missouri, USA). With all species, glochidia were harvested from multiple (>3) gravid females <24 h before the initiation of each acute toxicity test. Juveniles were propagated by infecting host-fish with glochidia using standard propagation and culture methods. At the time of juvenile test initiation, L. cariosa ranged in age from 1 to 21 d, with an average (+SD) shell length of 587 µm (+ 125), A. raveneliana ranged in age from 1 to 21 d, with an average shell length of 501 µm (+ 50), and M. nervosa ranged in age from 1 to 3 d, with an average shell length of 370 µm (+ 23). Juvenile L. siliquoidea used for the turbidity and sediment experiments were approximately 17 months old, with an average (+ SD) shell length of 5.34 + 0.80 mm.
RESULTS After exposing both glochidia (mussel larvae) and juvenile mussels to each of
the 6 PAM compounds at concentrations up to 1,000 mg/L only the AN 923 compound elicited mortality sufficient to calculate an LC50 for L. cariosa glochidia at the 24 or 48 h time points (Table 6). The 24 h LC50 was 833 mg/L (95% CI, 770–902 mg/L) and decreased to 412 mg/L (373–454 mg/L) at 48 h. For juvenile L. cariosa, AN 923 and AN 923 SH had 96 h LC50s of 130 mg/L (100–161 mg/L) and 563 mg/L (414–766 mg/L), respectively (Table 7). All other compounds showed no evidence of acute toxicity to either life stage at the highest concentration tested (no observed effect concentration [NOEC] = 1000 mg/L). The only test resulting in the calculation of an LC50 for A. raveneliana, the federally endangered species, was the 96 h juvenile exposure to AN 923 (330 mg/L: 95% CI 289–376 mg/L). Similarly, the only test that resulted in the calculation of an LC50 for M. nervosa was the 96 h juvenile exposure to AN 923 (706 mg/L: 95% CI 576–865 mg/L; Table 6).

40
When juvenile L. siliquoidea was exposed to three sediment test conditions (non-flocculated settled sediment, suspended sediment, and PAM-flocculated settled sediment) for a duration of 96 h, there was 100% survival in all treatments. Likewise, mussel survival at the 20-d chronic assessment was not significantly different among conditions or turbidity level (p>0.05). Mean percent survival (range in parenthesis) in the settled sediment, suspended sediment, and PAM-flocculated sediment conditions was: 89% (80 – 98%), 84% (81 – 87%), and 89% (87 – 93%), respectively (Figure 38).
SUMMARY We found that the acute toxicity of the 6 PAM compounds tested varied with
mussel life stage (juveniles more sensitive than glochidia), species (Lampsilis cariosa most sensitive), and chemical properties of the compound (molecular weight, charge density, and net charge), but exhibited relatively low toxicity overall, compared to the concentrations commonly applied for aquatic turbidity control. Of the 36 tests conducted with the early life stages of freshwater mussels and the 6 PAM compounds, 7 yielded calculable LC50 concentrations. For even the most toxic PAM tested (AN 923), there was still a 24- to 126-fold margin of safety from common treatment concentrations. The relative lack of acute toxicity in our tests with anionic PAM and early life stages of native freshwater mussels compares similarly to previous acute toxicological studies of anionic PAM with other aquatic organisms. Given the relatively low toxicity of PAM to freshwater mussels observed during this study, the benefits of PAM use for turbidity control may supersede the risk of toxic effects because PAM may effectively reduce the amount of sediment entering receiving waters and will decrease the stress of excess sediment on this ecologically important group of imperiled organisms.
CONCLUSIONS
Our findings indicate that anionic PAM poses a minimal risk to freshwater mussels at optimal turbidity control concentrations of 1 mg/L to 5 mg/L (a 24- to 126-fold margin of safety), as 127 mg/L was the lowest 96 h LC50 calculated (juvenile L. cariosa). Likewise, when we evaluated the effects of PAM-flocculated sediment on freshwater mussels by applying a 5 mg/ml concentration of anionic PAM (AN 923) to a range of turbidity treatments, the mussel results showed a protective quality of PAM-flocculated sediment during acute exposures; however, the chronic results were not as clear (refer to Appendix 1 and Appendix 2 for additional details). Anionic PAM appears to effectively mitigate the negative effects of acute turbidity exposure without creating additional risks due to flocculated sediment. Our overall findings advance the current knowledge of PAM toxicity to aquatic organisms and

41
can be used to inform management decisions regarding turbidity control in the presence of common or imperiled freshwater mussels.

42
Figure 39. Mean (+SE) juvenile mussel survival at 20 d post exposure to sediment
test conditions. No significant differences were found between any of test conditions
(settled sediment, suspended sediment, PAM-flocculated sediment) or turbidity
treatment levels (α = 0.05).
40
60
80
100
C 50 250 1250 3500
Su
rviv
al
(%)
Turbidity (NTU)
Sediment Flocculated Suspended
[Type here]
43
Table 6. Properties of selected anionic and non-ionic polyacrylamide (PAM) compounds used in acute toxicity
tests with larval (glochidia) and juvenile freshwater mussels. Information derived via SNF online product brochure
at http://www.snfgroup.com/images/pdf/Brochures_in_English/Catalogue%20Poudres.pdf.
Compound Net
charge Charge density %
Molecular weight classification
Molecular weight (Mg/mole)
FLOPAM™ AN 913 VHM
Anionic 13 Ultra High 13–16
FLOPAM™ FA 920 Non-ionic Non-ionic High 5–6
FLOPAM™ AN 923 SH
Anionic 23 Very High 12–14
FLOPAM™ AN 923 Anionic 23 Standard 9–12
FLOPAM™ AN 923 VHM
Anionic 23 Ultra High 14–17
APS 705 Anionic NA NA NA
NA=Information not available for product.

[Type here]
44
Table 7. Median lethal concentrations (LC50s) for acute toxicity of anionic polyacrylamide (PAM) to native
freshwater mussels (95% CI). Acute exposures to the following PAM compounds resulted in insufficient mortality
to calculate an LC50s: APS 705, FLOPAM™ FA 920, FLOPAM™ AN 923 VHM, and FLOPAM™ AN 913 VHM.
Species
Life stage
Time point (h)
FLOPAM™ AN 923 LC50 (mg/L)
FLOPAM™ AN 923SH LC50 (mg/L)
Alasmidonta raveneliana Glochidia 24 >1000 >1000
48 >1000 >1000
Juvenile 48 >1000 >1000
96 330 (289–376) >1000
Lampsilis cariosa Glochidia 24 833 (770–902) >1000
48 412 (373–454) >1000
Juvenile 48 183 (140–240) >1000
96 127 (100–161) 563 (414–766)
Megalonaias nervosa Glochidia 24 >1000 >1000
48 >1000 >1000
Juvenile
48 >1000 >1000
96 705 (576–865) >1000

45
Recommendations
Programmable samplers and water quality sondes usually provided similar
turbidity readings. Samplers have the advantage of being able to run
samples a second time to check the results, but they also require someone to
retrieve and then analyze samples. Sondes can provide more continuous
data, but the data needs to be scrutinized for unexplained readings. Overall,
monitoring turbidity with sondes may be more cost-effective when other water
quality parameters (e.g. Total Suspended Solids, nutrients, heavy metals) are
not needed.
The skimmers all performed reasonably well but some of the discharge rates
provided by the manufacturers were considerably different from our test
results. These differences would likely be less important than the installation
and maintenance of the skimmers in the field.
The plot-scale rainfall simulator produced rain droplet distributions similar to
those reported for other simulators. The rainfall distribution was highly
dependent on wind speed and direction, but generally ranged between 2” – 3”
hr-1, which is sufficient for testing erosion control products. It can be deployed
to field sites on construction projects for “real conditions” testing of products.
Alternative systems for controlling turbidity using dissolved PAM, deployed on
three different projects, had highly variable impacts depending on site
conditions. With moderate flows and turbidities, substantial reductions in
turbidity could be achieved. The effects were less evident when flows and
turbidities were high, such as >40,000 NTU. This is likely a function of the
scale of the dosers relative to the volumes of runoff, as these dosers were
only designed to handle <3,000 cubic feet of runoff at approximately 1 mg L-1.
Increasing the number or storage volume of the dosers would provide
additional capacity. Close monitoring and maintenance of these systems is
imperative.
There was no evidence of PAM toxicity to freshwater mussels at both life
stages at concentrations expected for turbidity treatment. In fact, there was a
>10X safety margin even for the most sensitive species and life stage. This
suggests the use of PAM for turbidity control should not have adverse effects
on mussels in receiving waters.

46
Implementation and Technology Transfer Plan
1. Stormwater discharge quality on NCDOT construction sites can be
maintained and improved using the skimmers currently on the market and
dissolved PAM dosing systems in critical areas. There is little cause for
concern about using PAM in areas where mussels are found. Monitoring of
water quality using sondes may be cost effective when this data is needed.
2. The Roadside Environmental Unit can use this information in areas where
turbidity concerns suggest additional measures should be used. The two
dosing systems we developed represent two conceptual approaches to
dispensing the solutions, but many others could be developed where no
power is needed. Sondes could be deployed in sensitive areas where the
turbidity needed to be closely monitored, such as borrow pits.
3. The low toxicity of PAM to freshwater mussels is information that should be
widely disseminated to local, state, and federal agencies involved in water
quality regulation. This, combined with information on PAM safety for a wide
variety of aquatic organisms available from manufacturers and published
studies, should ease concerns about its use for turbidity control.
If NCDOT plans to implement turbidity monitoring using sondes or to deploy
dissolved PAM dosing systems, additional training can be developed at
NCSU. This could be incorporated into current certification training, at least
as general information, or as part of an in-depth turbidity control workshop.

47
APPENDICES
APPENDIX 1: ACUTE TOXICITY OF POLYACRYLAMIDE FLOCCULANTS TO EARLY LIFE STAGES OF FRESHWATER MUSSELS
APPENDIX 2: SUBLETHAL EFFECTS OF TURBIDITY, SEDIMENT, AND POLYACRYLAMIDE ON NATIVE FRESHWATER MUSSELS
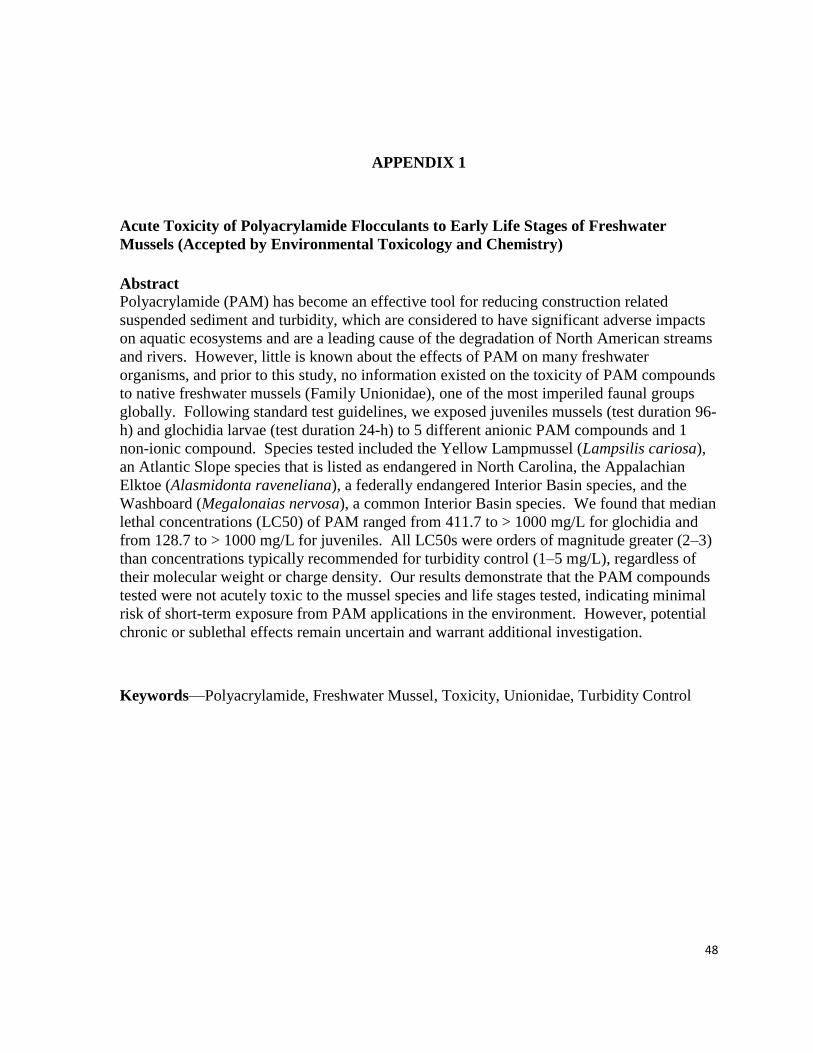
48
APPENDIX 1
Acute Toxicity of Polyacrylamide Flocculants to Early Life Stages of Freshwater
Mussels (Accepted by Environmental Toxicology and Chemistry)
Abstract
Polyacrylamide (PAM) has become an effective tool for reducing construction related
suspended sediment and turbidity, which are considered to have significant adverse impacts
on aquatic ecosystems and are a leading cause of the degradation of North American streams
and rivers. However, little is known about the effects of PAM on many freshwater
organisms, and prior to this study, no information existed on the toxicity of PAM compounds
to native freshwater mussels (Family Unionidae), one of the most imperiled faunal groups
globally. Following standard test guidelines, we exposed juveniles mussels (test duration 96-
h) and glochidia larvae (test duration 24-h) to 5 different anionic PAM compounds and 1
non-ionic compound. Species tested included the Yellow Lampmussel (Lampsilis cariosa),
an Atlantic Slope species that is listed as endangered in North Carolina, the Appalachian
Elktoe (Alasmidonta raveneliana), a federally endangered Interior Basin species, and the
Washboard (Megalonaias nervosa), a common Interior Basin species. We found that median
lethal concentrations (LC50) of PAM ranged from 411.7 to > 1000 mg/L for glochidia and
from 128.7 to > 1000 mg/L for juveniles. All LC50s were orders of magnitude greater (2–3)
than concentrations typically recommended for turbidity control (1–5 mg/L), regardless of
their molecular weight or charge density. Our results demonstrate that the PAM compounds
tested were not acutely toxic to the mussel species and life stages tested, indicating minimal
risk of short-term exposure from PAM applications in the environment. However, potential
chronic or sublethal effects remain uncertain and warrant additional investigation.
Keywords—Polyacrylamide, Freshwater Mussel, Toxicity, Unionidae, Turbidity Control

49
INTRODUCTION
Human activities influence ecosystem structure and function, as well as the organisms
that occupy the ecosystems. Anthropogenic effects continue to accelerate extinction rates of
many of the world’s species [1]. Stress on the environment has intensified as global human
populations have increased and shifted toward urban growth centers, which radically alter
land-cover and lead to habitat destruction and alteration [2,3]. The change to urban and
suburban land use alters local environments, leading to increased stormwater runoff, soil
erosion, and reduced biodiversity, thereby creating regional disturbances that inherently alter
lotic aquatic systems [4–8]. Increased turbidity and sediment load can alter the physical
environment, reduce light penetration [9], decrease dissolved oxygen concentrations [7], and
reduce habitat complexity [10]. These factors, among others, can result in deleterious effects
on freshwater organisms, such as reduced food availability, increased water temperatures,
altered feeding behavior, reduced respiration rate [11], decreased reproduction, decreased
feeding rates [12], and direct mortality [6,7,13–15]. As suspended sediments settle from the
water column, the complexity of the benthic substrate is reduced and the structure is altered.
Interstitial spaces within the substrate become inundated with fine particulate matter thereby
reducing the structural heterogeneity, availability of habitat, and oxygen for benthic dwelling
organisms [16].
The United States Environmental Protection Agency (USEPA) determined sediment
to be the greatest pollutant of rivers in the United States, and estimates of sediment release to
U.S. surface waters due to anthropogenic erosion are as high as 75 billion tons annually
[17,18]. Construction site runoff has been implicated as a major contributor of sediment and
impairment of water quality [19]. Erosion rates of disturbed soil on construction sites are 7
to 500 times that of natural areas, and these areas are responsible for more than 90% of soil
erosion in urban environments [19,20]. Efforts to reduce sediment release from construction
sites have advanced through the implementation of a variety of Best Management Practices
(BMPs) such as silt fences, check dams, erosion blankets, and sediment basins. However, to
effectively remove suspended sediment particles < 20 μm requires the use of a chemical
flocculant such as polyacrylamide (PAM) [21].
PAM is a water-soluble polymer commercially produced through the polymerization
of acrylamide and available in various compounds of differing charge density and molecular
weight. Both cationic and anionic polyacrylamide can be produced during the commercial
manufacturing process through the addition of co-monomers such as trimethyl ammonium or
sodium acrylate [22, 23], but it is the anionic form of PAM that is used in turbidity control
because of toxicity concerns from the cationic form [24]. The amount of these substituents
determines the degree of charge density, typically ranging from 7 to 50% (N. Bartholomew,
2003, Master’s thesis, North Carolina State University, Raleigh, North Carolina, USA). The
molecular weight is dependent on the length of the linear chains ranging from 12 to 17
Mg/mol [25]. When used for the reduction of turbidity, PAM is typically applied at a rate of
1–5 mg/L of water. However, the turbidity concentration, soil composition, and other
physical parameters dictate the most effective compound for a given application [26,27].

50
PAM has been shown to effectively reduce the turbidity of runoff as much as 91% before
reaching receiving waters [28]. When used in conjunction with other BMPs, PAM is
especially effective at controlling turbidity [29–31]. Given their demonstrated efficacy,
chemical flocculants like anionic PAM are quickly becoming an essential BMP on
construction sites, as the industry strives to meet regulatory demands designed to mitigate the
well-studied impacts of increased suspended sediment on aquatic biota [6,31–33].
Although acute toxicity studies of PAM have been conducted with standard aquatic
test organisms (Table 1), toxicity data representing the highly imperiled native freshwater
mussel fauna (Family Unionidae) have not been generated. Unionid mussels are
experiencing significant declines across North America and throughout the world [34]. In
fact, unionids are the most imperiled faunal group in North America with greater than 70% of
the nearly 300 species considered endangered, threatened, of special concern, or already
extinct [35]. Freshwater mussels are disproportionally sensitive to certain environmental
contaminants and to other anthropogenic activities that impact aquatic habitat, facilitating the
precipitous decline [5,35–39]. Previous toxicological research with freshwater mussels and
environmental contaminants, such as chloride, ammonia and copper, have found freshwater
mussels to be among the most sensitive aquatic organisms tested, especially when exposed
during early life stages (glochidia and juveniles) [38,40–42]. Thus, utilizing exposure-
response data from freshwater mussel tests to derive water quality criteria or environmentally
acceptable levels may also be protective of other aquatic organisms.
The primary concerns for the toxicity of anionic PAM to aquatic organisms center
around the monomer, acrylamide, which is recognized as a neurotoxin and probable
carcinogen [43] and the physical effects of flocculation on larval life stages of invertebrates
and the algal populations used as biological food sources [24]. The environmental risk for
acrylamide exposure includes the possibility of incomplete polymerization during the
manufacturing process, resulting in residual unbound acrylamide, as well as the possibility of
acrylamide release during physical, chemical, biological, or photochemical degradation.
Laboratory studies have shown minimal release of acrylamide from PAM by intense UV
irradiation and high thermal stress (95⁰C for 10 d) [44,45]. Moreover, field tests have shown
no appreciable acrylamide release through environmental degradation, and any detected
acrylamide is the result of free acrylamide from incomplete polymerization [46]. To date,
there is no evidence of environmental concentrations of acrylamide above allowable levels
(0.05%) during field applications when being applied to reduce turbidity [46,47]. Therefore,
the main unresolved toxicity concerns of anionic PAM are related to its physical and
chemical attributes.
The objective of this study was to develop toxicological information on 5
representative anionic PAM compounds and 1 non-ionic compound commonly used for the
reduction of turbidity in stormwater runoff on the early life stages of 3 species of native
freshwater mussels. Determining the LC50 for each of the 6 PAM compounds provides
important data for identifying potential environmental impacts of their use in water quality

51
and erosion control, while also, presenting possible implications for other environmental
PAM applications that require greater concentrations (e.g., erosion control, canal lining,
algae control).
MATERIALS AND METHODS
Test chemicals
Six compounds of PAM were selected for toxicity testing in this study to provide a
range of charge density, molecular weight, and net charge (Table 2), all characteristics that
may influence potential toxicity. All PAM compounds were obtained in granular form, and
homogeneous stock solutions of PAM (1 g/L) were prepared by slowly adding
(approximately 1 g/min) granular PAM to reconstituted hard water [48] and mixing on a stir
plate for 24 h at room temperature. The stock solution was used in tests directly following
mixing. The following polyacrylamide compounds were obtained from SNF Holding
Company (Riceboro, Georgia, USA) FLOPAM: FA 920, AN 923, AN 923 SH, AN 923
VHM, and AN 913 VHM. APS 705 was purchased from Applied Polymer Systems
(Woodstock, Georgia, USA). The chemical property and compound information for SNF
compounds tested were provided by the manufacturer (Table 1), but APS 705 is a proprietary
mixture of anionic PAMs, and it was included in testing because it is commonly used in
environmental applications. In an effort to encompass both the typical effective range for
turbidity reduction and to reach concentrations great enough to develop a median lethal
concentration (LC50), each PAM compound had six treatment concentrations ranging from 5
to 1000 mg/L. Test exposure concentrations were verified using the turbidimetric reagent,
benzethonium chloride (Hyamine 1622, Acros Organics, Geel, Antwerp, Belgium) and
methods described by Kang et al. [49]. Measured concentrations of PAM in our tests ranged
from 84 to 109% of the calculated nominal concentrations.
Test organisms
We tested three species of native freshwater mussels, chosen based on geographical
distribution, phylogenetic tribe, and conservation status: Lampsilis cariosa (tribe-
Lampsilini), Alasmidonta raveneliana (tribe-Anodontini), and Megalonaias nervosa (tribe-
Quadrulini). L. cariosa is an Atlantic Slope species in various classifications of conservation
status across its range from stable to critically imperiled (state endangered, North Carolina)
[50]. A. raveneliana, an Interior Basin species, endemic to the headwaters of the Tennessee
River in western North Carolina and eastern Tennessee, is state ( North Carolina and
Tennessee) and federally endangered [50,51]. M. nervosa, a common Interior Basin species,
is widely-distributed and stable in the Mississippi and Gulf of Mexico drainages [52].
L. cariosa and A. raveneliana were provided by the Aquatic Epidemiology and
Conservation Laboratory, North Carolina State University, College of Veterinary Medicine
(Raleigh, North Carolina, USA), and M. nervosa was supplied by the mussel culture
laboratory at Missouri State University (Springfield, Missouri, USA). With all species,
glochidia were harvested from multiple (>3) gravid females <24 h before the initiation of
each acute toxicity test. Juveniles were propagated by infecting host-fish with glochidia
using standard propagation and culture methods [53]. At the time of juvenile test initiation,

52
L. cariosa ranged in age from 1 to 21 d, with an average (+SD) shell length of 587.1 µm (+
125.2), A. raveneliana ranged in age from 1 to 21 d, with an average shell length of 501.1 µm
(+ 50.1), and M. nervosa ranged in age from 1 to 3 d, with an average shell length of 370.2
µm (+ 22.6).
Glochidia test assessment
All toxicity tests (glochidia and juveniles) were conducted according to the standard
guide for conducting toxicity tests with the early life stages of freshwater mussels [54].
Mean temperature (range in parentheses) of glochidia in culture water upon arrival to the
laboratory was 17.4 ⁰C (13-22 ⁰C). Glochidia were acclimated to the reconstituted hard
water [48] and the test temperature of 20 ⁰C by being placed into a 1:1 mixture of culture and
reconstituted water for 2 h, allowing for a 2 ⁰C/h maximum rate of change. Glochidia were
used in tests when initial viability was assessed at >90% using an Olympus SZ61 microscope
(Olympus America, Center Valley, Pennsylvania, USA) and QCapture Pro 5.1 digital
photographic software (Quantitative Imaging, Surrey, British Columbia, Canada). Viability
(survival) was assessed by exposing glochidia to a saturated sodium chloride solution and
individuals exhibiting a shell-closure response were considered viable. Static, water-only
acute toxicity tests were conducted for 48 h, with viability assessed at 24 h and 48 h on
subsamples of approximately 50 of the 150 glochidia in each of three replicates for a given
treatment. Test acceptability is specified to be >90% viability in the control treatment at 48 h
[54]; control viability in our tests averaged 93% at 48 h. All tests were conducted in light
and temperature controlled incubators (Precision Model 818 Thermo Fisher, Marietta, Ohio,
USA) held at 20 ⁰C and a light:dark cycle of 16:8 h.
Juvenile test assessment
Mean temperature (range in parentheses) of juvenile mussels in culture water upon
arrival to the laboratory was 19.8 ⁰C (17–23 ⁰C). Juveniles were acclimated to the
reconstituted hard water [48] and the test temperature of 20 ⁰C by being placed into a 1:1
mixture of culture and reconstituted water for 2 h, allowing for a 2 ⁰C/h maximum rate of
change, followed by a 1:3 ratio for an additional 2 h and then 100% reconstituted water for
72 h prior to test initiation. Static, water-only renewal tests were conducted for 96 h with a
>90% water and chemical renewal at 48 h [54]. Survival was assessed at 48 and 96 h
exposure time points by observing for foot movement outside or inside the shell or a
heartbeat within a 5-min period. For each test, control replicates (x3) contained 10 juveniles
each, whereas all other treatment replicates (x3) contained 7 individuals. Test acceptability
is specified to be >80% survival in the control treatment at 96 h [54]; control survival in our
tests averaged 99% at 96 h. All juvenile acute toxicity tests were conducted under the same
temperature and light cycle conditions as for glochidia tests.
Water chemistry
Water chemistry analyses were performed at the 48 h time point for both glochidia
and juvenile toxicity tests. Mean (range in parentheses) water quality conditions during the
experiments were as follows: 134.5 mg CaCO3 /L alkalinity (116–166 mg/L), 160.7 mg
CaCO3/L hardness (150–186 mg/L), 579.4 µS/cm conductivity (527–750 µS/cm), 8.4 pH
(7.32–8.64), and 8.8 mg/L dissolved oxygen (6.66–9.47 mg/L) ; n=36 determinations for

53
alkalinity and hardness, n=144 determinations for all other variables). Alkalinity and
hardness were measured by titration following standard methods [55] and all other water
quality parameters were conducted using a calibrated multi-probe system (YSI model 556
MPS, Yellow Springs Instruments, Yellow Springs, Ohio, USA).
Statistical analysis
The effect of each of the 6 PAM compounds on the survival of glochidia and juvenile
mussels was used to determine the median lethal concentration (LC50) analyzed via the
Trimmed Spearman-Karber method (Comprehensive Environmental Toxicity Information
Software [CETIS], V1.8.0.12, Tidepool Scientific, LLC, McKinleyville, California, USA).
The LC50 is the measure of toxicity and defined as the toxicant concentration resulting in the
mortality of 50% of individuals exposed in the specified time period. Mortality was
determined for glochidia by failure to respond via shell-closure to NaCl. Juvenile mortality
was determined by observing no foot movement or heartbeat for individual mussels during
the 5-min assessment period. In tests where sufficient mortality occurred to allow calculation
of LC50s, values were considered significantly different when 95% confidence intervals did
not overlap [56]. Water chemistry variables from all tests were analyzed by one-way
analysis of variance (ANOVA) in SAS (SAS Institute, Cary, North Carolina, USA) to assess
any attributable mortality due to variation in water chemistry during PAM exposures. All
measured variables (alkalinity, hardness, pH, dissolved oxygen, conductivity and
temperature) were not significantly different among tests, indicating no appreciable change in
chemistry resulting from PAM compound.
RESULTS
After exposing both glochidia and juvenile mussels to each of the 6 PAM compounds
at concentrations up to 1,000 mg/L only the AN 923 compound elicited mortality sufficient
to calculate an LC50 for L. cariosa glochidia at the 24 or 48 h time points (Table 3). The 24
h LC50 was 833.4 mg/L (95% CI, 769.7–902.4 mg/L) and decreased to 411.7 mg/L (373.4–
454.0 mg/L) at 48 h. For juvenile L. cariosa, AN 923 and AN 923 SH had 96 h LC50s of
126.8 mg/L (99.9–161.0 mg/L) and 563.2 mg/L (414.2–765.8 mg/L), respectively (Table 3).
All other compounds showed no evidence of acute toxicity to either life stage at the highest
concentration tested (no observed effect concentration [NOEC] = 1000 mg/L). The only test
resulting in the calculation of an LC50 for A. raveneliana, the federally endangered species,
was the 96 h juvenile exposure to AN 923 (329.8 mg/L: 95% CI 289.2–376.1 mg/L).
Similarly, the only test that resulted in the calculation of an LC50 for M. nervosa was the 96
h juvenile exposure to AN 923 (705.5 mg/L: 95% CI 575.5–864.8 mg/L; Table 3).
DISCUSSION
We found that the acute toxicity of the 6 PAM compounds tested varied with mussel
life stage (juveniles more sensitive than glochidia), species (Lampsilis cariosa most
sensitive), and chemical properties of the compound (molecular weight, charge density, and
net charge), but exhibited relatively low toxicity overall, compared to the concentrations
commonly applied for aquatic turbidity control. Of the 36 tests conducted with the early life
stages of freshwater mussels and the 6 PAM compounds, 7 yielded calculable LC50

54
concentrations. Much of the previous toxicological research conducted on PAM and aquatic
organisms had not generated median lethal concentrations, instead, provided a NOEC (LC50
was greater than the highest concentration tested; Table 3). Even with testing a maximum
PAM concentration of 1000 mg/L, many trials resulted in a NOEC at that highest
concentration and demonstrates that the risk of environmental PAM exposure to freshwater
mussels seems minimal, especially at the 1 to 5 mg/L concentrations where it is most
effective for turbidity control [29,31]. For even the most toxic PAM tested (AN 923), there
was a 24- to 126-fold margin of safety from common treatment concentrations.
The relative lack of acute toxicity in our tests with anionic PAM and early life stages
of native freshwater mussels compare similarly to previous acute toxicological studies of
anionic PAM with other aquatic organisms (Table 3). For example, Weston et al. [24] found
no significant mortality for the green alga Selenastrum capricornutum, aquatic invertebrates
Hyalella azteca, Chironomus dilutus, and Ceriodaphnia dubia and the fish Pimephales
promelas, during exposures at the greatest concentration tested, 100 mg/L. However, Beim
and Beim [57] reported a 96 h LC50 for Daphnia magna of 14.1 mg/L and Biesinger et al.
[58] reported a 96 h LC50 for the same species of 17.0 mg/L, indicating a greater degree of
toxicity and sensitivity than what we found for freshwater mussels. Toxicity appeared to be
dependent upon the chemical properties (molecular weight, charge density and net charge) of
each PAM compound. According to Bolto [23], anionic PAM toxicity is positively
correlated with molecular weight. However, our results indicate that it may actually be the
inverse for freshwater mussels, as we saw increasing toxicity with decreasing molecular
weight when accompanied by an increase in charge density. In fact, juvenile mussels
exposed to the highest molecular weight PAMs (AN 913 VHM and AN 923 VHM) at 1000
mg/L experienced greater than 90% survival among all species with the exception of L.
cariosa (AN 913 VHM 52%), and juvenile survival was the least when exposed to the lowest
molecular weight anionic PAM, AN 923 (< 9.5% survival). The aforementioned toxicity
indicates a possible trend that appears to be the result of increased exposure to the co-
monomer present in the compound. In this study, we tested three PAMs with a charge
density of 23% and varying molecular weights: AN 923, AN 923 SH, and AN 923 VHM.
AN 923 elicited the greatest level of toxicity and is distinguished from this group by the
lowest molecular weight (9 to 12 Mg/mole). Further evidence of the trend was the resulting
serial toxicity of AN 923 SH (12 to 14 Mg/mole) to the most sensitive mussel species, L.
cariosa. Thus, toxicity may be a result of reduced molecular weight allowing for greater
accessibility of PAM to freshwater mussels. Shorter PAM chains may more readily access
the internal organs of mussels via the incurrent siphon disrupting the biological processes.
Beim and Beim [57] attributed mortality in aquatic invertebrates to the sorption of PAM on
surface membranes resulting in decreased efficiency in biological functions, such as
respiration, feeding, and reproduction. Further toxicity research with anionic PAMs at
greater charge densities may provide more clarity as to which components are eliciting
toxicity and aid in identifying trends in compound toxicity.

55
Previous environmental contaminant research on the sensitivity of freshwater mussel
early life stages has found glochidia to typically be more sensitive than juveniles [38].
However, because PAM may elicit mortality via membrane sorption and inhibition of
essential biological functions, it was not surprising that we detected a higher degree of
sensitivity in the more anatomically advanced juveniles. Glochidia lack many of the
structures that are found in more advanced life stages, including gills, which are responsible
for gas exchange and a likely site of sorption resulting in mortality [59]. In fact, of the seven
tests that resulted in the calculation of an LC50, six were for juveniles and just one for
glochidia.
We found varied responses among freshwater mussel species to the exposure of
PAM. L. cariosa was the most sensitive to PAM exposures, which resulted in the lowest
LC50 (126.8 mg/L). L. cariosa was the only species to have sufficient mortality to calculate
an LC50 (833.4 mg/L) for glochidia, and the only species with a calculated LC50 for a
compound other than AN 923 (AN 923 SH). A. raveneliana was not as sensitive, with just
one test eliciting sufficient toxicity to estimate an LC50 (229.8 mg/L). The most tolerant of
the species tested was M. nervosa, also with just one test resulting in an LC50 estimate
(705.5 mg/L).
Given the relatively low toxicity of PAM to freshwater mussels observed during this
study, the benefits of PAM use for turbidity control may supersede the risk of toxic effects.
Freshwater mussels can be greatly affected by suspended sediments and the contaminants
associated with them [60,61]. PAM also has the potential to decrease certain chemical
toxicants and reduce nutrient loading [62,63]. Aldridge et al. [14], experimentally exposed
three unionid species, the Pimpleback (Quadrula pustulosa), Gulf Pigtoe (Fusconaia cerina),
and Mississippi Pigtoe (Pleurobema beadleanum) to frequent high levels of suspended
sediment (600 mg/L every 0.5 h) and observed a reduction in filtering clearance rate. Such a
reduction could lead to growth retardation, reproduction failure, or ultimately mortality due
to starvation. The use of PAM may effectively reduce the amount of sediment entering
receiving waters to decrease the stress of excess sediment on this ecologically important
group of imperiled organisms [28,64].
Strayer [65] found that freshwater mussel declines caused by anthropogenic activity
could lead to measurable changes in ecosystem structure and function. Other studies have
described bivalves as keystone species due to their functional role in primary production,
nutrient cycling, and other biological and chemical activities [66–68]. Freshwater mussels
perform essential ecological processes including filtration, nutrient cycling, biodeposition
and bioturbation [69,37,68,70]. Unfortunately, the decline and extinction of many species in
this group has occurred almost unnoticed, and identifying a single cause for the decline has
been difficult due to the multiple stressors impacting water quality and habitat [37,71].
The aim of this study was to determine the acute toxicity of anionic PAM to native
freshwater mussels, as it is used for the reduction of turbidity in construction effluents.
However, anionic PAM is also used in many different industries such as water and

56
wastewater treatment, paper processing, mining, and others. Recent research has shown the
efficacy of PAM used for other aquatic applications that apply directly to water systems such
as infiltration barriers in water delivery systems and as an algal flocculant to remove
unwanted algae [46, (K.J Iwinski, 2013, Master’s thesis, Northern Michigan University,
Marquette, Michigan)]. These applications potentially require the addition of a PAM
concentration or an environmental PAM concentration (698 and 386 mg/L, respectively)
greater than several of the LC50 values calculated during this study, to be effective for their
desired use.
CONCLUSION
In an effort to understand the environmental safety of some of the chemical tools
being applied for turbidity control in aquatic systems, this research focused on assessing the
toxicity of selected anionic PAM compounds to early life stages of native freshwater
mussels. Our findings indicate that that anionic PAM poses a minimal risk to freshwater
mussels at optimal turbidity control concentrations of 1 mg/L to 5 mg/L (a 24- to 126-fold
margin of safety), as 126.8 mg/L was the lowest 96 h LC50 calculated (juvenile L. cariosa).
Furthermore, the hazard is reduced by the minimal likelihood of exposure due to the
irreversible binding of PAM and sediment during environmental applications [23]. It is,
however, not possible to ascribe a level of toxicity to a class of compounds as large and
varying in chemical properties as anionic PAMs without additional toxicity testing or
identification of the mode(s) of action. In fact, our results highlight the differences in mussel
species sensitivity and the toxicity of anionic PAM compounds, with generated LC50s
ranging from 126.8 to greater than 1000 mg/L. Our findings advance current knowledge of
PAM toxicity to aquatic organisms and can be used to inform management decisions
regarding turbidity control in the presence of common or imperiled freshwater mussels.
Acknowledgments –— We thank C. Eads, C. Barnhart, and E. Glidewell for freshwater
mussel propagation. We also recognize J. Archambault, B. Cope, J. Kang, J. Luther, J.
McIver, A. Popp, M. Silliman, T. Sowers, and M. Walter for technical assistance in the
laboratory. This research was supported by a grant (RP-2014-20) from the North Carolina
Department of Transportation (NC DOT). The North Carolina Cooperative Fish and
Wildlife Research Unit is jointly supported by North Carolina State University, North
Carolina Wildlife Resources Commission, U.S. Geological Survey, U.S. Fish and Wildlife
Service, and Wildlife Management Institute. Any use or trade, firm, or product names is for
descriptive purposes only and does not imply endorsement by the U.S. Government.

57
REFERENCES
1. Lande R. 1998. Anthropogenic, ecological and genetic factors in extinction and
conservation. Res Popul Ecol 40:259-269.
2. Meyer WB, Turner BL. 1992. Human population growth and global land-use/cover
change. Annu Rev Ecol Syst 23:39-61.
3. Allan JD. 2004. Landscapes and riverscapes: the influence of land use on stream
ecosystems. Annu Rev Ecol Evol Syst 35:257-284.
4. Wolman MG, Schick AP. 1967. Effects of construction on fluvial sediment, urban
and suburban areas of Maryland. Water Resour Res 3:451-464.
5. Richter BD, Braun DP, Mendelson MA, Master LL. 1997. Threats to imperiled
freshwater fauna. Conserv Biol 11:1081-1093.
6. Wood PJ, Armitage PD, 1997. Biological effects of fine sediment in the lotic
environment. Environ Manage 21:203–217.
7. Henley WF, Patterson MA, Neves RJ, Lemly AD. 2000. Effects of sedimentation and
turbidity on lotic food webs: a concise review for natural resource managers. Rev Fish
Sci 8:125-139.
8. Bhaduri B, Minner M, Tatalovich S, Harbor J. 2001. Long-term hydrologic impact of
urbanization: a tale of two models. J Water Resour Plann Manage 127:13-19.
9. Chandler DC. 1942. Limnological studies of western Lake Erie: II. Light penetration
and its relation to turbidity. Ecology 23:41-52.
10. Lenat DR, Penrose DL, Eagleson KW. 1981. Variable effects of sediment addition on
stream benthos. Hydrobiologia 79:187-194.
11. Alexander Jr JE, Thorp JH, Fell RD. 1994. Turbidity and temperature effects on
oxygen consumption in the zebra mussel (Dreissena polymorpha). Can J Fish Aquat
Sci 51:179-184.
12. Box JB, Mossa J. 1999. Sediment, land use, and freshwater mussels: prospects and
problems. J N Am Benthol Soc 18:99-117.
13. Bruton MN. 1985. The effects of suspensoids on fish. Hydrobiologia 125:221-241.
14. Aldridge DW, Payne BS, Miller AC. 1987. The effects of intermittent exposure to
suspended solids and turbulence on three species of freshwater mussels. Environ
Pollut 45:17-28.
15. Payne BS, Miller AC, Shaffer LR. 1999. Physiological resilience of freshwater
mussels to turbulence and suspended solids. J Freshw Ecol 14:265-276.
16. Beschta RL, Jackson WL 1979. The intrusion of fine sediments into a stable gravel
bed. J Fish Res Board Can 36:204-210.
17. U.S. Environmental Protection Agency. 1990. The quality of our nation's water: a
summary of the 1988 National Water Quality Inventory. EPA 440/4-90-005.
Technical Report. US Environmental Protection Agency, Washington, DC.
18. Wilkinson BH, McElroy BJ. 2007. The impact of humans on continental erosion and
sedimentation. Geol Soc Am Bull 119:140-156.

58
19. U.S. Environmental Protection Agency. 2005. National management measures to
control nonpoint source pollution from urban areas. EPA-841-B-05-004. Technical
Report. US Environmental Protection Agency, Washington, DC.
20. Canning DJ. 1988. Construction erosion control: Shorelands and Coastal Zone
Management Program. Technical Advisory Paper No. 3. Washington Department of
Ecology, Olympia, WA.
21. Ward AD, Haan CT, Barfield BJ. 1980. The design of sedimentation basins. Trans
ASAE 22:351-356.
22. Mortimer DA. 1991. Synthetic polyelectrolytes—a review. Polym Int 25:29-41.
23. Bolto B, Gregory J. 2007. Organic polyelectrolytes in water treatment. Water Res
41:2301-2324.
24. Weston DP, Lentz RD, Cahn MD, Ogle RS, Rothert AK, Lydy MJ. 2009. Toxicity of
anionic polyacrylamide compounds when used for erosion control in agriculture. J
Environ Qual 38:238-247.
25. Orts WJ, Sojka RE, Glenn GM, Gross RA. 1999. Preventing soil erosion with
polymer additives. Polym News 24:406-413.
26. Seybold CA. 1994. Polyacrylamide review: Soil conditioning and environmental fate.
Commun Soil Sci Plant Anal 25:2171-2185.
27. Auckland Regional Council. 2004. Overview of the Effects of Residual Flocculants
on Aquatic Receiving Environments. TP226. Technical Publication. Auckland
Council, Auckland, New Zealand.
28. Soupir ML, Mostaghimi S, Masters A, Flahive KA, Vaughan DH, Mendez A,
McClellan PW. 2004. Effectiveness of polyacrylamide (PAM) in improving runoff
water quality from construction sites. J Am Water Resour Assoc 40:53-66.
29. McLaughlin RA, Bartholomew N. 2007. Soil factors influencing suspended sediment
flocculation by polyacrylamide. Soil Sci Am J 71:537-544.
30. McLaughlin RA, McCaleb MM. 2010. Passive treatment to meet the EPA turbidity
limit. Proceedings, American Society of Agricultural and Biological Engineering,
Baltimore, MD, USA, (November, 14-17, 2010), pp 1.
31. Kang J, McCaleb MM, McLaughlin RA. 2013. Check dam and polyacrylamide
performance under simulated stormwater runoff. J Environ Manage 129:593-598.
32. Matson PA, Parton WJ, Power AG, Swift MJ. 1997. Agricultural intensification and
ecosystem properties. Science 277:504-509.
33. Sojka RE, Bjorneberg DL, Entry JA, Lentz RD, Orts WJ, 2007. Polyacrylamide in
agriculture and environmental land management. Adv Agron 92:75-162.
34. Graf DL, Cummings KS. 2007. Review of the systematics and global diversity of
freshwater mussel species (Bivalvia: Unionoida). J Mollus Stud 73:291-314.
35. Williams JD, Warren ML, Cummings KS, Harris JL, Neves RJ. 1993. Conservation
status of freshwater mussels of the United States and Canada. Fisheries 18:6–22.
36. Williams JD, Neves RJ. 1995. Freshwater mussels: a neglected and declining aquatic
resource. In LaRoe ET, Farris GS, Puckett CE, Doran PD, Mac MJ, eds, Our living
resources: a report to the nation on the distribution, abundance, and health of U.S.

59
plants, animals, and ecosystems. US Department of the Interior, National Biological
Service. Washington, DC, pp 177-179.
37. Strayer DL, Downing JA, Haag WR, King TL, Layzer JB, Newton TJ, Nichols JS.
2004. Changing perspectives on pearly mussels, North America's most imperiled
animals. BioScience, 54:429-439.
38. Cope WG, Bringolf RB, Buchwalter DB, Newton TJ, Ingersoll CG, Wang N,
Hammer E. 2008. Differential exposure, duration, and sensitivity of unionoidean
bivalve life stages to environmental contaminants. J N Am Benthol Soc 27:451-462.
39. Archambault JM, Cope WG, Kwak TJ. 2014. Survival and behaviour of juvenile
unionid mussels exposed to thermal stress and dewatering in the presence of a
sediment temperature gradient. Freshwater Biol 59:601-613.
40. Keller AE, Zam SG. 1991. The acute toxicity of selected metals to the freshwater
mussel, Anodonta imbecilis. Environ Toxicol Chem 10:539-546.
41. Augspurger T, Keller AE, Black MC, Cope WG, Dwyer FJ. 2003. Water quality
guidance for protection of freshwater mussels (Unionidae) from ammonia exposure.
Environ Toxicol Chem 22:2569-2575.
42. Mummert AK, Neves RJ, Newcomb TJ, Cherry DS. 2003. Sensitivity of juvenile
freshwater mussels (Lampsilis fasciola, Villosa iris) to total and un‐ionized ammonia.
Environ Toxicol Chem 22:2545-2553.
43. International Agency for Research on Cancer. 1994. Acrylamide. Monographs on the
Evaluation of the Carcinogenic Risk of Chemicals to Humans, Vol 60. IARC, Lyon,
France, pp 389-433.
44. Caulfield MJ, Hao X, Qiao GG, Solomon DH. 2003. Degradation on
polyacrylamides. Part I. Linear polyacrylamide. Polymer 44:1331-1337.
45. Wan ZY, Xi TF, Zhao P, Fan CX, Sun Y, Feng ZG. 2005. In vitro degradation of
medical polyacrylamide hydrogel I. Oxidation. Key Eng Mater 288-289:397-400.
46. Young MH, Tappen JJ, Miller GC, Carroll S, Susfalk RB. 2007. Initial risk
characterization: using linear anionic polyacrylamide (LA-PAM) to reduce water
seepage from unlined water delivery canal systems. DHS Publication No. 41226.
Technical Report. Desert Research Institute, Las Vegas, NV.
47. Barvenik FW, Sojka RE, Lentz RD, Andrawes FF, Messner LS. 1996. Fate of
acrylamide monomer following application of polyacrylamide to cropland. Sojka RE,
Lentz RD, eds, Proceedings of the Managing Irrigation‐Induced Erosion and
Infiltration with Polyacrylamide, Misc. Pub. 101‐96. University of Idaho, Moscow,
ID, USA, pp 103-110.
48. American Society for Testing and Materials. 2006. Standard guide for conducting
laboratory toxicity tests with freshwater mussels. E2455-06. ASTM International,
West Conshohocken, Pennsylvania.
49. Kang J, Sowers TD, Duckworth OW, Amoozegar A, Heitman JL, McLaughlin RA.
2013. Turbidimetric determination of anionic polyacrylamide in low carbon soil
extracts. J Environ Qual 42:1902-1907.

60
50. North Carolina Wildlife Resources Commission. 2014. North Carolina freshwater
mussels Raleigh, North Carolina: NCWRC. [cited 2014 July 12]. Available from:
http://www.ncwildlife.org/Learning/Species/Mollusks.aspx
51. U.S. Fish and Wildlife Service. 1996. Recovery plan for the Appalachian elktoe
(Alasmidonta raveneliana). Final Report. US Fish and Wildlife Service, Atlanta, GA.
52. NatureServe. 2015. NatureServe Explorer: An online encyclopedia of life. Arlington,
Virginia: NatureServe. [cited 2015 March 22]. Available from:
http://www.natureserve.org/explorer.
53. Barnhart MC. 2006. Buckets of muckets: a compact system for rearing juvenile
freshwater mussels. Aquaculture 254:227-233.
54. American Society of Testing and Materials. 2006. Standard guide for conducting
acute toxicity tests with fishes, macroinvertebrates, and amphibians. E729-88a.
ASTM International, West Conshohocken, Pennsylvania.
55. American Public Health Association. 1999. Standard Methods for the Examination of
Water and Wastewater, 20th ed, American Public Health Association, American
Waterworks Association, and Water Pollution Control Federation, Washington, DC
56. Hamilton MA, Russo RC, Thurston RV. 1977. Trimmed Spearman-Karber method
for estimating median lethal concentrations in toxicity bioassays. Environ Sci Technol
11:714-719.
57. Beim AA, Beim AM. 1994. Comparative ecological-toxicological data on
determination of maximum permissible concentrations (MPC) for several flocculants.
Environ Technol 15:195-198.
58. Biesinger KE, Lemke AE, Smith WE, Tyo RM. 1976. Comparative toxicity of
polyelectrolytes to selected aquatic animals. J Water Pollut Control Fed 48:183-187.
59. Wachtler K, Dreher-Mansur MC, Richter T. 2001. Larval types and early postlarval
biology in naiads (Unionoida). In Bauer G, Wachtler K, eds, Ecology and Evolution
of the Freshwater Mussels Unionoida. Springer Verlag, Berlin, Germany, pp 93-125.
60. Besser JM, Brumbaugh WG, Hardesty DK, Hughes JP, Ingersoll CG. 2009.
Assessment of metal-contaminated sediments from the Southeast Missouri (SEMO)
mining district using sediment toxicity tests with amphipods and freshwater mussels.
Final Report 08-NRDAR-2. United States Geological Survey, Columbia, MO.
61. Wang N, Ingersoll CG, Kunz JL, Brumbaugh WG, Kane CM, Evans RB, Bakaletz S.
2013. Toxicity of sediments potentially contaminated by coal mining and natural gas
extraction to unionid mussels and commonly tested benthic invertebrates. Environ
Toxicol Chem 32:207-221.
62. Krauth DM, Bouldin JL, Green VS, Wren PS, Baker WH. 2008. Evaluation of a
polyacrylamide soil additive to reduce agricultural-associated contamination. B
Environ Contam Tox 81:116-123.
63. Goodson CC, Schwartz G, Amrhein C. 2006. Controlling tailwater sediment and
phosphorus concentrations with polyacrylamide in the Imperial Valley, California. J
Environ Qual 35:1072-1077.

61
64. McLaughlin RA, King SE, Jennings GD. 2009. Improving construction site runoff
quality with fiber check dams and polyacrylamide. J Soil Water Conserv 64:144-154.
65. Strayer DL, Caraco NF, Cole JJ, Findlay S, Pace ML. 1999. Transformation of
freshwater ecosystems by bivalves. BioScience 49:19-27.
66. Dame RF. 1993. The role of bivalve filter feeder material fluxes in estuarine
ecosystems. In Dame RF, ed, Bivalve Filter Feeders, 1st ed, Vol 33. Springer Verlag,
Berlin, Germany, pp 245–269.
67. Dame RF, Allen DM. 1996. Between estuaries and the sea. J Exp Mar Biol Ecol
200:169-185.
68. Vaughn CC, Hakenkamp CC. 2001. The functional role of burrowing bivalves in
freshwater ecosystems. Freshwater Biol 46:1431-1446.
69. Bogan AE, Roe KJ. 2008 Freshwater bivalve (Unioniformes) diversity, systematics,
and evolution: status and future directions. J N Am Benthol Soc 27:349–369.
70. Mermillod-Blondin F. 2011. The functional significance of bioturbation and
biodeposition on biogeochemical processes at the water–sediment interface in
freshwater and marine ecosystems. J N Am Benthol Soc 30:770-778.
71. Layzer JB, Gordon ME, Anderson RM. (1993). Mussels: the forgotten fauna of
regulated rivers. A case study of the Caney Fork River. Regul River 8:63-71.
72. de Rosemond SJ, Liber K. 2004. Wastewater treatment polymers identified as the
toxic component of a diamond mine effluent. Environ Toxicol Chem 23:2234-2242.
73. Acharya K, Schulman C, Young M. 2010. Physiological response of Daphnia magna
to linear anionic polyacrylamide: Ecological implications for receiving Waters. Water
Air Soil Poll 212:309-317.

62
TABLES
Table 1. Comparative acute toxicity of anionic polyacrylamide (PAM) to aquatic organisms.
Species Common name Duration LC50 (mg/L) Source
Raphidocelis subcapitata Green algae 96 h >100 [24]
Chironomus dilutes Midge 96 h >100 [24]
Pimephales promelas Minnow 7 days >100 [24]
Phoxinus phoxinus Minnow 96 h >1000 [57]
Hyalella azteca Amphipod 96 h >100 [24]
Eulimnogammarus verrucosus Amphipod 96 h 2100 [57]
Baicalobia guttata Flatworm 96 h >100 [57]
Ceriodaphnia dubia Water flea 6-8 days 28.7 [24]
Daphnia magna Water flea 96 h 14.1 [57]
Daphnia magna Water flea 48 h 345 [58]
Daphnia magna Water flea 96 h 17 [58]
Daphnia magna Water flea 48 h 218.1 [72]

63
Table 2. Properties of selected anionic and non-ionic polyacrylamide (PAM) compounds used in acute toxicity tests with
larval (glochidia) and juvenile freshwater mussels. Information derived via SNF online product brochure at
http://www.snf-group.com/images/pdf/Brochures_in_English/Catalogue%20Poudres.pdf.
Compound Net
charge Charge density %
Molecular weight
classification
Molecular weight
(Mg/mole)
FLOPAM™ AN 913 VHM
Anionic 13 Ultra High 13–16
FLOPAM™ FA 920 Non-ionic Non-ionic High 5–6
FLOPAM™ AN 923 SH
Anionic 23 Very High 12–14
FLOPAM™ AN 923 Anionic 23 Standard 9–12
FLOPAM™ AN 923 VHM
Anionic 23 Ultra High 14–17
APS 705 Anionic NA NA NA
NA=Information not available for product.

[Type here]
64
Table 3. Median lethal concentrations (LC50s) for acute toxicity of anionic polyacrylamide (PAM) to native
freshwater mussels (95% CI). Acute exposures to the following PAM compounds resulted in insufficient
mortality to calculate an LC50s: APS 705, FLOPAM™ FA 920, FLOPAM™ AN 923 VHM, and FLOPAM™
AN 913 VHM.
Species
Life stage
Time point (h)
FLOPAM™ AN 923
LC50 (mg/L)
FLOPAM™ AN
923SH
LC50 (mg/L)
Alasmidonta raveneliana Glochidia 24 >1000 >1000
48 >1000 >1000
Juvenile 48 >1000 >1000
96 329.8 (289.2–376.1) >1000
Lampsilis cariosa Glochidia 24 833.4 (769.7–902.4) >1000
48 411.7 (373.4–454.0) >1000
Juvenile 48 183.2 (139.8–240.2) >1000
96 126.8 (99.9–161.0) 563.2 (414.2–765.8)
Megalonaias nervosa Glochidia 24 >1000 >1000
48 >1000 >1000
Juvenile
48 >1000 >1000
96 705.5 (575.5–864.8) >1000

[Type here]
65
APPENDIX 2
Sublethal effects of turbidity, sediment, and polyacrylamide on native freshwater
mussels (Accepted by Journal of American Water Resources Association)
ABSTRACT
Turbidity generated from sediment erosional processes is a ubiquitous pollutant
adversely affecting water quality and aquatic life in waterways across the United States and
elsewhere. Anionic polyacrylamide (PAM) is widely used as a chemical flocculent and has
become an effective tool for reducing the impacts of suspended sediment and turbidity on
aquatic ecosystems. However, no information exists on the toxicity of PAM-flocculated
sediments to the imperiled, but ecologically important freshwater mussels of the family
Unionidae. We conducted acute (96 h) and chronic (24 d) laboratory tests with juvenile
fatmucket (Lampsilis siliquoidea) and three exposure conditions (non-flocculated settled
sediment, suspended sediment, and PAM-flocculated settled sediment), over a range of
environmentally relevant turbidity treatments (50, 250, 1,250, and 3,500 nephelometric
turbidity units; NTU). We found no effect of turbidity treatment or exposure condition on
mussel survival in either the acute or chronic tests, suggesting a high level of tolerance for L.
siliquoidea in short-term exposures. In contrast, we found significant reductions in protein
concentration, ATP production, and oxidized proteins in mussels acutely exposed to
suspended sediment, indicating physiological protective responses that limit energy
production and reactive oxygen species accumulation under unfavorable environmental
conditions. Our results suggest that anionic PAM applied to reduce suspended sediment may
be effective at minimizing the adverse effects of short-term turbidity exposure on juvenile
freshwater mussels without eliciting additional lethal or sub-lethal toxicity. These findings
will facilitate improved management and regulatory decision making for turbidity control
best management practices in waters where freshwater mussels reside.
(KEY TERMS: turbidity, invertebrates, toxicology, erosion, best management practices
[BMP’s], environmental impacts)
INTRODUCTION
The negative effects of erosion and suspended sediment on aquatic habitat and
freshwater fauna have been well described (Ellis, 1936; Cordone and Kelley, 1961; Berkman
and Rabeni, 1987; Newcombe and MacDonald, 1991; Wood and Armitage, 1997; Henley et
al., 2000; Gray et al., 2014). Deleterious effects on aquatic ecosystems are often the result of
the physical and chemical alterations that include sedimentation, light attenuation, and
associated adsorbed contaminants (Thoms and Thiel, 1995; Henley et al., 2000; Davies-
Colley and Smith, 2001; Bilotta and Brazier, 2008). Urbanization, mining, road construction,

66
and intensive agricultural practices can all lead to increased erosion and influxes of sediment
to surface waters (Wolman and Schick, 1967; Lenat and Crawford, 1994; Henley et al., 2000;
Wilkinson and McElroy, 2007). These activities can result in landscape alterations
permuting the natural hydrology, increasing runoff velocity, and sediment loading (Henley et
al., 2000). In fact, Wilkinson and McElroy (2007) estimated the global anthropogenic
erosion rate to be 75 Gigatons annually, which far surpasses the estimated 21 Gigatons per
year from natural erosional processes. The United States Environmental Protection Agency
has concluded that nearly half of the waterways in the U.S. are significantly impaired by
sediment and has designated sediment the primary pollutant of aquatic environments (U.S.
Environmental Protection Agency, 1990).
The term turbidity is often used to describe the visual clarity of water when assessing
the ecological relevance of suspended sediment, but it also encompasses dissolved organic
matter, exogenous pollutants, plankton, and microorganisms (Kirk, 1985; Davies-Colley and
Smith, 2001). Turbidity can be quantified with a variety of methods, one of which measures
the refraction of light through water using a turbidimeter (Kirk, 1985; Lloyd, 1987). This
method generates a standard metric of nephelometric turbidity units (NTUs) that is used by
many regulatory agencies to monitor suspended particles (O’Dell, 1993; Standard Methods,
1995; Davies-Cooley and Smith, 2001). In this laboratory study, turbidity refers only to the
suspended sediment fraction of inorganic sediments, which is the prevailing component
contributing to turbidity during episodes of excessive runoff from disturbed soils (Lloyd,
1987; U.S. Environmental Protection Agency, 2005). Understanding and monitoring this
standard measure for suspended sediment is critical for the conservation and restoration
efforts of both aquatic habitat and dependent biota.
Increased turbidity has been associated with adverse abiotic factors, such as decreased
dissolved oxygen, light penetration, and increased water temperature. These changes have
resulted in reduced diversity and biomass of primary producers (macrophytes, periphyton,
and phytoplankton) in aquatic systems causing a cascade of deleterious effects on freshwater
communities (Ellis, 1936; Chandler, 1942; Kirk, 1985; Van Nieuwenhuyse and LaPerriere,
1986; Lloyd et al., 1987; Davies-Colley et al., 1992; Wood and Armitage, 1997; Bilotta and
Brazier, 2008). The adverse effects of turbidity on fish have also been well studied, from
highly sensitive salmonid species to more tolerant warmwater species (Muncy 1979; Lloyd et
al. 1987; Sigler et al. 1984). Research has identified a multitude of negative impacts and
responses in fish as a result of suspended sediment exposure including avoidance, reduced
hatching success, altered predator-prey interactions, damaged gill tissue, and direct mortality
(Bisson and Bilby, 1982; Lake and Hinch, 1999; Sweka and Hartman, 2003; Sutherland and
Meyer, 2007; Gray et al., 2012). However, the effects of turbidity on native freshwater
mussels (family Unionidae), the most imperiled faunal group in North America (Williams et
al., 1993) have yet to be fully investigated, especially during early life stages.
Efforts to reduce suspended sediment released from construction sites to meet
regulatory requirements have advanced through the implementation of a variety of Best
Management Practices (BMPs). Many of these techniques are designed to reduce erosion by

67
decreasing the velocity of runoff, thereby reducing the energy potential required to erode and
suspend sediment. However, to remove the smallest fraction of suspended sediment < 20 μm
from runoff effluent, chemical flocculants such as polyacrylamide (PAM) are used (Ward et
al., 1980). PAM is a commercially available water-soluble polymer used in many different
industries as a flocculating agent (Sojka et al., 2007). PAM has been shown to reduce the
turbidity of runoff by as much as 91% before reaching receiving waters (Soupir et al., 2004),
especially when used in conjunction with other BMPs (McLaughlin and Bartholomew, 2007;
McLaughlin and McCaleb, 2010; Kang et al., 2013a). Given the relatively high efficacy and
putative low toxicity to aquatic organisms, chemical flocculants such as anionic PAM are
quickly becoming an essential chemical tool to mitigate the well-studied impacts of increased
suspended sediment on aquatic biota (Matson et al., 1997; Wood and Armitage, 1997; Sojka
et al., 2007; Weston et al., 2009; Kang et al., 2013a; Buczek, in press). However, more
information is needed about the possible chemical and physical interactions of PAM within
the environment to understand its risks and to determine its efficacy for mitigating the effects
of suspended sediment on freshwater organisms in a safe manner.
Although previous studies have been conducted on the effects of suspended sediment
and PAM toxicity to a variety of freshwater organisms (Bisson and Bilby, 1982; Sigler et al.,
1984; Beim and Beim, 1993; Lake and Hinch, 1999; Capper, 2006; Sutherland and Meyer,
2007; Weston et al., 2009; Acharya et al., 2010; Robinson et al., 2010; Gray et al., 2012),
none has attempted to elucidate the potential toxicity of the compounds when flocculated,
especially to benthic dwelling freshwater mussels. The early life stages (glochidia and
juveniles) of freshwater mussels are disproportionally sensitive to certain environmental
contaminants and to other anthropogenic stressors that impact aquatic habitat, facilitating
precipitous declines in their diversity and abundance (Keller and Zam, 1991; Williams et al.,
1993, Williams and Neves, 1995; Richter et al., 1997; Augspurger et al., 2003; Mummert et
al., 2003; Strayer et. al., 2004; Cope et al., 2008; Archambault et al., 2014). Thus, utilizing
the sensitivity and exposure-response data from freshwater mussel toxicity tests to derive
water quality criteria or environmentally acceptable levels may also be protective of other
aquatic organisms. For these reasons, freshwater mussels have been used extensively over
the past two decades as bioindicators of water quality (Gagné, 2002; Gundacker, 2000;
Labieniec and Gabryelak, 2007), and there is growing interest in physiological, chemical, and
molecular biomarkers to quantify sublethal responses of mussels to environmental toxicants
(Gillis et al., 2014; Machado et al., 2014; Ridgway et al., 2014).
Oxidative stress is one such biomarker, widely used in aquatic organisms for
detection of the molecular response to environmental pollutants (Valavanidis et al., 2006;
Lushchak, 2011). Oxidative stress is the result of an imbalance of the steady-state reactive
oxygen species (ROS) concentration and an organism’s antioxidant defense system. When
ROS generation exceeds steady-state, oxidative damage can occur to macromolecules such as
DNA, proteins, and lipids (Lushchak, 2011). This damage can manifest as tissue damage,
inflammation, disease, and aging (Goto et al., 1999; Sohal, 2002). Indicators of general

68
health and metabolism, such as adenosine triphosphate (ATP) and protein concentrations are
also useful in the identification of induced biochemical processes and stress.
The specific objective of this study was to determine the relative sensitivity of
juvenile freshwater mussels to a range of sediment and PAM-treated sediment conditions
using survival and the sublethal endpoints of protein oxidation, ATP production, and protein
concentration as measures of toxicity. The overall goal of this research was to assess the
practice of applying PAM to aquatic ecosystems in relation to potential impacts on
freshwater mussels.
MATERIALS AND METHODS
Experimental design and conditions
Two separate tests were conducted to evaluate the acute (96 h) and chronic (24 d)
responses to three different sediment exposure conditions: suspended sediment, PAM-
flocculated settled sediment, and non-flocculated settled sediment. Identical design and
protocols were followed during both the acute and chronic tests. Target treatment
concentrations of turbidity during the experiment were 0, 50, 250, 1,250, and 3,500 NTU.
There were three replicates per treatment with 15 juvenile mussels in each replicate,
including the control. Water chemistry analysis was performed at every 96-h time point, and
the sediment was retained for particle size and total suspended solids analysis at the
conclusion of each test. These three test conditions represented the three main possible
scenarios of sediment exposure for freshwater mussels in the environment. Following total
suspended solids determination protocols outlined by Clesceri et al., (1998), each treatment
replicate was vacuum filtered to a pre-weighed 1.5 μm Whatman glass fiber filter, baked at
120⁰C until completely dry, and weighed [Figure A1]. Surviving juvenile mussels at the end
of the tests were placed into 1.5 ml microcentrifuge tubes and submerged in midRIPA lysis
buffer (25 mM Tris [pH 7.4], 1% NP-40, 0.5% sodium deoxycholate, 15 mM NaCl) then
stored in an ultracold (-80 °C) freezer. For comparison, three representative baseline samples
of L. siliquoidea were stored in an identical fashion and placed in an ultracold (-80 °C)
freezer directly upon arrival for later biomarker analysis.
Test sediment
Sediment was obtained from the Sediment and Erosion Control Research and
Education Facility (SECREF) at North Carolina State University (Raleigh, North Carolina,
USA). The sediment originated from a nearby road construction site and had been
previously characterized and used in several research projects; the sediment characteristics
were as follows: 42.5% sand, 17.2% silt, 40.3% clay and USDA classification of clay. A
working stock sediment was prepared by first passing the dried soil through a No. 10
standard testing sieve (VWR Scientific, Radnor, Pennsylvania, USA), and the resulting soil ≤
2 mm was baked at 120ºC for > 24 h in a Fisher Scientific 600 series Isotemp standard oven
to eliminate any indigenous organisms. To ensure the stock sediment sample would remain
suspended under minimal agitation during laboratory exposures, dry sediment was eluted in

69
ASTM hard water (ASTM 2006a) and processed through a sequential series of mixing,
settling, and decanting steps. The final supernatant particle size distribution was 12.2 μm
(standard deviation: 11.8 μm) as determined by a Beckman Coulter LS particle size analyzer
(Pasadena, California, USA) by the Department of Marine, Earth, and Atmospheric Sciences
(MEAS) at North Carolina State University (Raleigh, North Carolina, USA) according to
their standard methods.
To ensure that the test sediment was relatively uncontaminated and that any observed
effects were not attributable to the presence of any potential toxicants, samples of sediment
were analyzed for a suite of 22 metal and 146 organic compounds, including polycyclic
aromatic hydrocarbons, polychlorinated biphenyls, legacy organochlorine pesticides and
current use pesticides. The metal analysis was performed at RTI International (Research
Triangle Park, North Carolina, USA) using a Thermo iCAP6500 ICP-OES (inductively
coupled plasma optical emission spectrometer) following U.S. Environmental Protection
Agency Method 200.7 and U.S. Environmental Protection Agency Method 3050B and their
approved protocols. Triplicate readings of each sample were taken, the average of the three
readings was reported as the final concentration. A rigorous quality assurance protocol was
followed for the metals analyses that included reagent blanks, reagent blank spikes,
duplicates, matrix spikes, and surrogate internal standards. Average recovery in surrogate
standards was 95% (range 76 – 113%), relative percent difference of duplicates averaged
10% (range 0 – 20%), recovery of matrix spikes averaged 81% (range 29 – 105%), and
reagent blanks were uncontaminated. None of the measured metals was of toxicological
concern to mussels or other aquatic life (U.S. Environmental Protection Agency, 2009).
Organic contaminants in test sediment were analyzed in the Analytical Toxicology
Laboratory at North Carolina State University, Raleigh, North Carolina, USA, with gas
chromatography-mass spectrometry following standard approved procedures. A rigorous
quality assurance protocol was followed for organics analyses and included procedural
blanks, and surrogate internal standards. Quality assurance controls were all within
acceptable levels and the surrogate recoveries for organic analysis were all between 67 and
97%. None of the measured organics were present at levels of toxicological concern to
mussels or other aquatic life (U.S. Environmental Protection Agency, 2009).
Suspended sediment exposure
In an effort to maintain a constant exposure turbidity, the processed and highly
concentrated sediment stock was added to each test beaker to achieve the target turbidity
level. Turbidity was measured daily using a turbidimeter (Analite NEP260, Observator
Instruments, formerly, McVan Instruments, Scoresby, Australia) and concentrated stock was
added as needed to maintain the treatment turbidity at the desired treatment target.
Suspended sediment treatments were maintained through the use of a Lab Companion®
Multiposition magnetic stirrer (Billerica, Massachusetts, USA) and a 3.8 cm stir bar rotated
at 70 rpm to provide the minimal agitation needed to maintain a suspension. Mussels were

70
held in open top cylindrical cages constructed of 1 mm Nitex® mesh (dimensions: H: 11.5
mm, D: 39.0 mm) bound together with 0.4 mm stainless steel wire. All cages were
suspended ~3 cm from the bottom of the 400 ml glass test beaker using 3 stainless steel wire
support arms affixed over the lip of the beaker. The mean (range in parenthesis) measured
turbidity during the 96-h assessment time points for each treatment was 56 NTU (7–113),
236 NTU (125–398), 1120 NTU (850–1488), and 3562 NTU (3325–3850).
Settled sediment exposure
Similar to the suspended sediment exposure, stock sediment was added to reach the
equivalent target treatment turbidity of 50, 250, 1,250, and 3,500 NTU using a multiposition
magnetic stirrer and a 3.8 cm stir bar rotated at 70 rpm to provide the minimal agitation
needed to maintain a suspension and quantified using a turbidimeter (Analite NEP260).
However, mussels exposed under this condition were added directly to the 400 ml beaker (no
cages) after the stir bar was removed and sediment was allowed to settle.
Flocculated sediment exposure
Stock sediment was added as described for the previous exposures to reach the
equivalent target treatment turbidity of 50, 250, 1,250, and 3,500 NTU. However, after the
stir bar was removed anionic polyacrylamide FLOPAM AN 923 was added to all replicates
and briefly stirred manually for a final PAM concentration of 5 mg/L. Mussels were then
added directly to the 400 ml beaker, and flocculated sediment was allowed to settle. Directly
prior to the 96-h assessment, a 10 ml sample of water was removed from each replicate and
analyzed using the turbidimetric reagent, benzethonium chloride (Hyamine 1622, Acros
Organics, Geel, Antwerp, Belgium) and methods described by Kang et al., (2013b) to detect
unbound or residual PAM concentrations. A standard curve was developed for the reactivity
of PAM and benzethonium chloride using a stock solution of 1000 mg/L and turbidity
readings for a serial dilution of PAM (0, 0.5, 1, 5, 10, 25, 50 mg/L). The flocculated
sediment treatment concentrations were then compared to the standard curve values to
determine the residual exposure concentration.
Test chemicals
FLOPAM AN 923 is a granular anionic polyacrylamide compound obtained from
SNF Holding Company (Riceboro, Georgia, USA) and chosen for this experiment due to the
relatively high degree of toxicity to freshwater mussels relative to other previously tested
PAM compounds (Buczek, in press). A homogeneous stock solution of PAM (1000 mg/L)
was prepared by slowly adding (approximately 1000 mg/min) PAM granules to ASTM hard
water and mixing on a stir plate for 24 h at room temperature. The stock solution was used
immediately following mixing and never stored for later use.
Test organisms
All sediment toxicity tests were performed with juvenile fatmucket (Lampsilis
siliquoidea) provided by the mussel culture laboratory at Missouri State University
(Springfield, Missouri, USA). L. siliquoidea juveniles were propagated by infecting host-
fish (Largemouth bass; Micropterus salmoides) with glochidia using standard propagation

71
and culture methods (Barnhart, 2006). L. siliquoidea is a common Interior Basin species
widely-distributed and considered stable in the Mississippi and Gulf drainages of the U.S.
(NatureServe, 2015) and have been used extensively in toxicological testing. Juvenile L.
siliquoidea used for these experiments were approximately 17 months old, with an average
(+ SD) shell length of 5.34 + 0.80 mm.
Mussel assessment
Upon arrival at the laboratory, juvenile mussels were acclimated to the reconstituted
hard water (ASTM, 2006a) and the test temperature of 20 ⁰C by placement into a 50:50
mixture of culture and reconstituted water for 2 h, allowing for a 2 ⁰C/h maximum rate of
change, followed by a 25:75 mixture for an additional 2 h, and then 100% reconstituted water
for 72 h prior to test initiation. Survival was assessed at 96 h by observing the occurrence of
foot movement outside or inside the shell or a heartbeat within a 5-min period. Test
acceptability in the acute (96 h) test was specified at > 90% control survival and the chronic
(24 d) test acceptability was specified to be > 80% survival in the control treatment (ASTM,
2006b). All tests were conducted in light and temperature controlled incubators (Precision
Model 818 Thermo Fisher, Marietta, Ohio, USA) and held at 20 ⁰C and light:dark cycle of
16:8.
Water chemistry
Water chemistry analysis was performed at each 96-h time point for all toxicity tests.
Mean (range in parentheses) water quality conditions during the experiments were as
follows: 111 mg CaCO3/L alkalinity (106–118 ), 163 mg CaCO3/L hardness (150–170 ), 547
µS/cm conductivity (524–562), 8.21 pH (7.82–8.47), and 8.3 mg/L dissolved oxygen (7.5–
8.8); n=6 for alkalinity and hardness, n=150 for all other variables. Alkalinity and hardness
were measured by titration following standard methods (APHA, 1995) and all other water
quality parameters were measured using a calibrated multi-probe system (YSI model 556
MPS, Yellow Springs Instruments, Yellow Springs, Ohio, USA).
Protein concentration/ATP
Whole mussels were homogenized in midRIPA lysis buffer (25 mM Tris (pH 7.4),
1% NP-40, 0.5% sodium deoxycholate, 15 mM NaCl) using a pestle inside of a 1.5 ml
microcentrifuge tube. The samples centrifuged for 10 min at 16,000 rpm and the supernatant
was saved for further analysis. We measured protein concentration, which has been
previously used by Gillis et al. (2014) as an indicator of general health, to determine if
subcellular stress corresponded to greater tissue level effects. Protein concentration was
measured on a Bio-Rad SmartSpec3000 spectrophotometer following the manufacturer
protocol for a protein assay kit (Bio-Rad, Life Science Research, Hercules, California, USA).
Sample dilutions were made to uniform protein concentrations before analyzing for ATP
concentrations by ATP dependent luciferin oxidation reactions. ATP production was
quantified by the Enliten ATP assay system for bioluminescence detection kit and GLOMAX
20/20 Luminometer (Promega Corporation, Madison, Wisconsin, USA).

72
Oxidative stress-protein oxidation
Protein carbonyls can be used to determine protein oxidation and oxidative stress.
Formed as a result of oxidative damage, protein carbonyls can be quantified by a series of
derivatizing reactions following manufacturer Enzyme-Linked Immunosorbent Assay
(ELISA) protocols (ENZO life sciences, Farmingdale, New York, USA). The sample was
first reacted with dinitrophenylhydrazine (DNP) causing proteins to adsorb to the assay plate.
The adhered proteins were then reacted with anti-DNP-biotin-antibody, streptavidin-linked
horseradish peroxidase and chromatin. After the addition of an acid to stop the reactions, the
absorbance was read at 450 nm using a plate reader (Multiscan FC, Thermo Scientific,
Waltham, Massachusetts, USA). Each replicate sample was analyzed in duplicate, and
samples were quantified by comparison with oxidized standards.
Statistical analysis
Comparisons of turbidity treatment concentrations (50, 250, 1,250, 3,500 NTU) and
test conditions (non-flocculated settled sediment, suspended sediment, and PAM-flocculated
settled sediment) were analyzed for normality (Shapiro-Wilk) followed by an analysis of
variance (ANOVA) using SAS (SAS Institute, Cary, North Carolina, USA). To elucidate
significance and rank between and within test conditions, results were further analyzed by
Tukey’s HSD post-hoc analysis (α = 0.05).
RESULTS
Acute exposures
Juvenile L. siliquoidea exposed to the three sediment test conditions (non-flocculated
settled sediment, suspended sediment, and PAM-flocculated settled sediment) for a duration
of 96 h had 100% survival in all treatments. However, control survival during the chronic
test dropped below the required 80% (ASTM, 2006b) in all test conditions at the 24-d
assessment time point. Therefore, survival results presented are for the last acceptable
assessment time point (20 d). Mussel survival at the 20-d assessment was not significantly
different among conditions or turbidity level (p>0.05). Mean percent survival (range in
parenthesis) in the settled sediment, suspended sediment, and PAM-flocculated sediment
conditions was: 89% (80 – 98%), 84% (81 – 87%), and 89% (87 – 93%), respectively [Figure
1].
For the sublethal endpoints, analysis of protein concentration indicated no significant
difference for mussels exposed to the range of treatment turbidity in the acute 96 h exposure
[ANOVA: settled sediment (p=0.167), PAM-flocculated (p=0.796), suspended (p=0.788)].
However, there were significant differences with the effect of treatment condition on
mussels. Using Tukey’s HSD to test pairwise differences, we found that at lower turbidity
concentrations [ANOVA: control (p=0.018), 50 NTU (p=0.0004), and 250 NTU (p=0.006)],
mussels in the settled sediment and PAM-flocculated sediment conditions had higher protein
concentrations than those in the suspended sediment conditions [Figure 2A]. When turbidity

73
reached 1,250 NTU (ANOVA p=0.007) and 3,500 NTU (ANOVA p=0.018), mussels in the
settled sediment had greater mean protein concentration than those exposed to the suspended
sediment, with those in the flocculated sediment falling in between, and not different than
either.
The acute (96 h) effect of turbidity on the production of ATP was different among the
conditions [ANOVA: settled sediment (p=0.003), PAM-flocculated (p=0.021), suspended
(p=0.191)]. ATP concentrations for mussels exposed to the settled sediment and PAM-
flocculated sediment conditions generally declined with an increase in turbidity. Mussels in
the lowest turbidity levels (control and 50 NTU) exposed to settled sediment had
significantly greater concentrations of ATP than the two highest turbidity levels (1250 NTU
and 3500 NTU), with the ATP concentration at 250 NTU falling in between [Figure 2B].
Similarly, ATP concentrations from mussels exposed to the PAM-flocculated sediment
condition reached a significant low at the 1250 NTU level when compared to the control. We
also found no effect of turbidity on ATP concentration for juvenile mussels exposed to the
suspended sediment condition. When we analyzed for the effect of condition using Tukey’s
HSD, the suspended sediment condition had statistically lower ATP concentrations for all
turbidity treatments but 1,250 NTU [control (p=0.001), 50 NTU (p=0.002), 250 NTU
(p=0.01), 3,500 NTU (p=0.001)], where there was no significant difference between test
conditions (p=0.219), [Figure 2B]. When we compared ATP concentrations from the acutely
exposed mussels to the baseline mussel sample, those mussels stored in midRIPA lysis buffer
and held in an ultracold (-80 ⁰C) freezer upon arrival, we found that the baseline results were
greater than 1.5 times those of the exposed mussels.
The analysis of protein carbonyl concentrations to detect protein oxidation during the
acute exposure showed no effects of turbidity within the settled sediment (ANOVA p=0.104)
and PAM-flocculated sediment (ANOVA p=0.542) conditions [Figure 2C]. However, within
the suspended sediment condition, the concentration was lower at the 250 NTU level than the
control or 3,500 NTU level (ANOVA p=0.001). This suggests no clear pattern of protein
oxidation as a result of turbidity. The suspended condition had lower carbonyl
concentrations than the settled or flocculated conditions for the 50, 250, and 3,500 NTU
turbidities, again not showing a clear concentration-response pattern. The baseline mussels
contained less than half the carbonyl than the exposed mussels, suggesting that there was
increased protein oxidation under all test conditions.

74
Chronic exposures
Chronic exposure results for protein concentration revealed a similar trend. We found
no significant differences based on treatment turbidity [ANOVA: settled sediment (p=0.49),
PAM-flocculated (p=0.945), suspended (p=0.057)] and mussels exposed to the settled
sediment condition had significantly greater protein concentration when compared to mussels
exposed to the suspended sediment condition across all turbidity levels [control (p=0.03), 50
NTU (p=0.003), 250 NTU (p=0.0007), 1,250 NTU (p=0.001, and 3,500 NTU (p=0.04)]. In
addition, mussels in the settled sediment condition also had significantly greater protein
concentrations than those in the PAM-flocculated condition at turbidity levels 250 NTU and
above [Figure 3A]. However, in all but one turbidity level (1,250 NTU), protein
concentration was not significantly different between mussels in the PAM-flocculated
condition and the suspended sediment condition.
When we analyzed the effect of turbidity on the production of ATP for chronically
exposed (24 d) mussels, we found the inverse of our above acute (96 h) results in both the
settled and PAM-flocculated sediment exposure conditions [ANOVA settled (p=0.001),
PAM-flocculated (p=0.031)]. The greatest tissue concentrations of ATP found in the settled
sediment condition occurred in the 1,250 NTU and 3,500 NTU turbidity levels, while the
lowest concentration of ATP was found in the 50 NTU turbidity level [Figure 3B]. However,
the only significant difference in ATP concentration found in the PAM-flocculated sediment
condition was between the 50 NTU and 1250 NTU levels. Again, we found no effect of
turbidity on ATP concentration for mussels exposed to the suspended sediment (ANOVA
p=0.33). When we analyzed for the effect of condition using Tukey’s HSD, we again found
the chronic results to be the inverse of the acute, with mussels in the suspended sediment
condition having statistically greater ATP concentrations for all turbidity levels except 1,250
NTU [control (p=0.014), 50 NTU (p=0.0003), 250 NTU (p=0.011), 3,500 NTU (p=0.025)],
where there was no significant difference between test conditions (p=0.656), [Figure 3B].
The baseline ATP levels were 4 times greater than those of the chronically exposed mussels.
Chronic exposure results for protein oxidation revealed no significant differences
across turbidity levels regardless of sediment conditions [ANOVA: settled sediment
(p=0.711), PAM-flocculated (p=0.231), suspended (p=0.472)] and the same was true for
condition effects, with the exception of the 50 NTU treatment level (ANOVA p=0.0001),
[Figure 3C]. As in the acute tests, the baseline carbonyl concentrations were roughly 50% of
the levels in the test mussels, regardless of treatment.

75
DISCUSSION
The results of this study illustrate the well-adapted behavior and physiology of
juvenile L. siliquoidea to influxes in sediment (settled, suspended, and PAM-flocculated)
during acute (96 h) and chronic (24 d) exposures. Notably, no mortality occurred during the
acute exposures, even at the highest turbidity (3500 NTU) and there were no differences in
mortality among the conditions and turbidity levels in the chronic test. The maximum
turbidity level used was similar to, or higher than that reported in construction site runoff
(Przepiora et al., 1998; Line and White, 2001; McCaleb and McLaughlin, 2008; McLaughlin
et al., 2009), although spikes over 30,000 NTU can occur (McCaleb and McLaughlin, 2008;
McLaughlin et al., 2009). There was little evidence for turbidity concentration related
biochemical effects, but rather we observed a much greater difference when comparing the
three experimental conditions.
The sublethal effects that we observed during the acute (96 h) and to a slightly lesser
degree chronic (24 d) exposures, revealed that the suspended sediment exposures to juvenile
L. siliquoidea resulted in significant decreases in protein concentration when compared to the
settled sediment and PAM-flocculated sediment test conditions. This difference was
maintained even when comparing control treatments, indicating strong condition related
differences. One possible explanation for the observed decrease in protein concentration
may be due to the condition design, as mussels in the suspended sediment treatments were
subjected to a circular flow pattern generated to maintain a homogenous suspension of
sediment. This increased flow may have initially elicited an energetically expensive
elevation in clearance rate (Ackerman, 1999; Riisgård and Larsen, 2000) of nutrient poor
inorganic sediment, contributing to possible injury and a greater energy deficit inducing shell
closure and anaerobic metabolism (Ortmann and Grieshaber, 2003), which has been shown to
further reduce the conversion of glucose to proteins (De Zwaan and Wijsman, 1976).
Similarly, results from a study of environmental contaminant exposure to freshwater mussels
found that protein concentration of exposed Lasmigona costata was significantly reduced
with proximity to contamination (Gillis et al., 2014). Gillis et al. (2014) proposed that this
reduction could be the result of altered resource partitioning as a strategy for survival. The
primary mechanism for mussels to reduce subcellular energy demands is to convert to
anaerobic metabolism, which could also explain the lack of significance along the turbidity
gradient by excluding outside influence (De Zwaan and Wijsman, 1976).
During our acute test, we found an overall decreasing trend in ATP concentrations
with increasing turbidity for both the settled sediment and PAM-flocculated sediment
conditions, indicating cellular exposure related effects. However, no significant treatment
differences in ATP were found in mussels exposed to suspended sediment, again possibly
indicating shell closure avoidance behavior and physiochemical alterations to compensate for
internal oxygen availability (McMahon, 1988). ATP is a coenzyme generated by organisms
during aerobic respiration and used as energy currency within cells to perform essential
biological functions. According to Conners (2004), the shift from aerobic to anaerobic
metabolism reduces energy production by nearly 90%, explaining the significantly reduced

76
ATP concentrations in the suspended sediment condition. A reduction in ATP may also
result in an inability of an organism to support regular cell processes, including ion
regulation (O'Donnell et al., 1996). Interestingly, chronic ATP results revealed an inverse
condition rank with extended exposure, suggesting that early metabolic conversion may be
an advantageous shift limiting further impairment. While anaerobic metabolism may reduce
total energy production, it also greatly reduces energy demand as mussels perform fewer
biological functions (De Zwaan and Wijsman, 1976).
Oxidative stress has become widely recognized as a mechanism of many disease
processes, and protein oxidation is an important biomarker indicating oxidative damage by
reactive oxygen species (Dalle-Donne et al., 2003). In fact, Gillis et al. (2014) found that
elevated levels of oxidative stress resulted in tissue damage that affected gill function in
mussels. To quantify protein oxidation, we identified the production of protein carbonyls in
homogenized whole body tissue samples of juvenile L. siliquoidea. Acute exposure results
of this analysis revealed no significant treatment difference for the settled sediment and
PAM-flocculated sediment conditions and a decreasing trend in protein oxidation for mussels
exposed to the suspended sediment condition to a low of 0.422 nmol/mg at the 250 NTU
treatment level before again increasing with increased turbidity. Interestingly, mussels in the
suspended sediment condition that had previously demonstrated negative impacts to both
protein concentration and ATP production appeared to show significantly less oxidative
stress compared to their counterparts in the settled sediment and PAM-flocculated sediment
conditions. These results lend more evidence to the conjecture that poor nutrition and
increased flow elicited a protective shell closure avoidance response of the mussels that
minimized damage and energy demand by sequestering them from unfavorable external
conditions. However, anaerobic respiration is not feasible for prolonged periods, as it too
leads to the accumulation of deleterious end products (De Zwaan and Wijsman, 1976;
McMahon, 1988). Analysis of protein carbonyl concentration from our chronic exposure
revealed a homogeneity among all treatments and conditions, with the exception of the 250
NTU treatment level, where the suspended sediment condition showed significantly higher
protein carbonyl concentration. These results suggest a balance achieved over time through
behavioral, physiological, and molecular alterations.
Bilotta et al. (2012) highlighted the ecological importance of understanding the
natural suspended sediment regime and not only the amount of suspended sediment entering
the system. Measuring the rate of erosion, as well as the influx and duration of sediment is
essential to understanding the impacts to the system. These findings are in alignment with
the literature review by Strayer et al. (2004), who found that erosion due to habitat alteration
is among the most cited causes for mussel declines. Turbidity has been implicated in
deleterious effects on all life stages of freshwater mussels, from reduced glochidia
attachment to host fish and transformation success into juveniles (Beussink, 2007), juvenile
recruitment failure (Osterling et al., 2010), to reductions in adult filtration clearance rate,
with consequences of growth retardation and mortality due to starvation (Aldridge et al.,

77
1987). Given these findings and the ubiquitous nature of turbidity and its stochastic temporal
pattern, practices to limit its influx to aquatic systems are critical.
According to Weston et al. (2009), anionic PAM is recognized as safe for
applications that may discharge to aquatic systems, and PAM has been shown to effectively
reduce the turbidity of runoff before reaching receiving waters (Soupir et al., 2004;
McLaughlin and Bartholomew, 2007; McLaughlin and McCaleb, 2010; Kang et al., 2013a).
However, the toxicity of anionic PAM in the presence of suspended sediment was heretofore
completely unknown. Furthermore, little was known about the influence of sediment when
bound by PAM. Cheung and Shin (2005) previously illustrated the negative physical effects
of suspended sediments to the gill tissues of mussels, however, when PAM binds with
suspended sediment through electrostatic forces (Young et al., 2007) the particle size and
geometry are altered, forming flocs. These alterations may have increased potential to cause
damage to the gill tissues of mussels. One of the primary objectives of this research was to
evaluate the effects of PAM-flocculated sediment to freshwater mussels by applying a 5
mg/ml concentration of anionic PAM (AN 923) to a range of turbidity treatments.
Comparing the biomarker endpoints of our three experimental conditions indicated a
protective quality of PAM-flocculated sediment during acute exposures; however, the
chronic results were not as clear.
These findings provide valuable information with direct implications for management
practices and the conservation of freshwater mussels. Combined with our previous research
on the toxicity of anionic PAM that found a median lethal concentration (LC50) with a 24- to
126-fold margin of safety to freshwater mussels (Buczek, in press), anionic PAM appears to
effectively mitigate the negative effects of acute turbidity exposure without creating
additional risks due to flocculated sediment. This research provides natural resource
managers and decision makers with much needed information for future application of PAM
for turbidity control. However, testing with additional mussel species and life stages may
more clearly elucidate any adverse concentration-response impacts along a turbidity gradient,
as turbidity tolerance appears to be species specific (Aldridge et al., 1987).

78
APPENDIX
FIGURE A1. Linear relationship between total suspended solids (TSS) and target turbidity
concentrations (NTU) for the three experimental conditions.
R² = 0.8498
R² = 0.8554
R² = 0.9147
0
200
400
600
800
1000
1200
1400
50 250 1250 3500
TS
S (
mg
/L)
Turbidity (NTU)
Sediment Flocculated Suspended

79
ACKNOWLEDGMENTS
We thank C. Barnhart and E. Glidewell at Missouri State University for freshwater
mussel propagation. We also recognize J. Archambault, B. Cope, J. Kang, J. Luther, J.
McIver, A. Popp, M. Silliman, T. Sowers, and M. Walter for technical assistance in the
laboratory. This research was supported by a grant (RP-2014-20) from the North Carolina
Department of Transportation (NC DOT). The North Carolina Cooperative Fish and
Wildlife Research Unit is jointly supported by North Carolina State University, North
Carolina Wildlife Resources Commission, U.S. Geological Survey, U.S. Fish and Wildlife
Service, and Wildlife Management Institute. Any use or trade, firm, or product names is for
descriptive purposes only and does not imply endorsement by the U.S. Government.
LITERATURE CITED
Acharya, K., C. Schulman, and M. Young, 2010. Physiological response of Daphnia magna
to linear anionic polyacrylamide: ecological implications for receiving waters. Water
Air Soil Pollution 212: 309-317.
Ackerman, J.D. 1999. Effect of velocity on the filter feeding of dreissenid mussels
(Dreissena polymorpha and Dreissena bugensis): implications for trophic dynamics.
Canadian Journal of Fisheries and Aquatic Sciences 56(9): 1551-1561.
Aldridge, D.W., B.S. Payne, and A.C. Miller, 1987. The effects of intermittent exposure to
suspended solids and turbulence on three species of freshwater mussels.
Environmental Pollution 45(1): 17-28.
APHA (American Public Health Association), 1995. Standard methods for the examination
of water and wastewater, 19th ed. American Public Health Association, American
Waterworks Association, and Water Pollution Control Federation, Washington, D.C.
Archambault, J.M., W.G. Cope, and T.J. Kwak, 2014. Survival and behaviour of juvenile
unionid mussels exposed to thermal stress and dewatering in the presence of a
sediment temperature gradient. Freshwater Biology 59(3): 601-613.
ASTM (American Society of Testing and Materials International), 2006a. Standard guide for
conducting acute toxicity tests with fishes, macroinvertebrates, and amphibians.
E729-88a. ASTM International, West Conshohocken, Pennsylvania.
ASTM (American Society for Testing and Materials International), 2006b. Standard guide
for conducting laboratory toxicity tests with freshwater mussels. E2455-06. ASTM
International, West Conshohocken, Pennsylvania.
Augspurger, T., A.E. Keller, M.C. Black, W.G. Cope, and F.J. Dwyer, 2003. Water quality
guidance for protection of freshwater mussels (Unionidae) from ammonia exposure.
Environmental Toxicology and Chemistry 22(11): 2569-2575.

80
Barnhart, M.C., 2006. Buckets of muckets: a compact system for rearing juvenile freshwater
mussels. Aquaculture 254(1): 227-233.
Beim, A.A., and A.M. Beim, 1994. Comparative ecological-toxicological data on
determination of maximum permissible concentrations (MPC) for several flocculants.
Environmental Technology 15(2): 195-198.
Berkman, H.E., and C.F. Rabeni, 1987. Effect of siltation on stream fish communities.
Environmental Biology of Fishes 18(4): 285-294.
Beussink, Z.S., 2007. The effects of suspended sediment on the attachment and
metamorphosis success of freshwater mussel parasitic life stages. Ph.D. Dissertation,
Missouri State University, Springfield, Missouri.
Bilotta, G.S., and R.E. Brazier, 2008. Understanding the influence of suspended solids on
water quality and aquatic biota. Water Research 42(12): 2849-2861.
Bilotta, G.S., N.G. Burnside, L. Cheek, M.J. Dunbar, M.K. Grove, C. Harrison, J.C. Peacock,
and J. Davy-Bowker, 2012. Developing environment-specific water quality
guidelines for suspended particulate matter. Water Research 46(7): 2324-2332.
Bisson, P.A., and R.E. Bilby, 1982. Avoidance of suspended sediment by juvenile coho
salmon. North American Journal of Fisheries Management 2(4): 371-374.
Buczek, S.B., W.G. Cope, R.A. McLaughlin, and T.J. Kwak, in press. Acute toxicity of
polyacrylamide flocculants to early life stages of freshwater mussels. Environmental
Toxicology and Chemistry DOI:10.1002/etc.3821.
Capper, N., 2006. The Effects of suspended sediment on the aquatic organisms Daphnia
magna and Pimephales promelas. M.S. Thesis, Clemson University, Clemson, South
Carolina.
Chandler, D.C., 1942. Limnological studies of Western Lake Erie: II. Light penetration and
its relation to turbidity. Ecology 23(1): 41-52.
Cheung, S.G., and P.K.S. Shin, 2005. Size effects of suspended particles on gill damage in
green-lipped mussel Perna viridis. Marine pollution bulletin 51(8): 801-810.
Clesceri, L.S., A.E. Greenberg, and A.D. Eaton, 1998. American Public Health Association
(APHA). Standard methods for the examination of water and wastewater, 20th
edition, APHA, Washington, D.C.
Conners, D.E., 2004. Biomarkers of oxidative stress in freshwater clams (Corbicula
fluminea), as mechanistic tools to evaluate the impairment of stream ecosystem health
by lawn care pesticides. Ph.D. Dissertation, University of Georgia, Athens, Georgia.
Cope, W.G., R.B. Bringolf, D.B. Buchwalter, T.J. Newton, C.G. Ingersoll, N. Wang, and E.
Hammer, 2008. Differential exposure, duration, and sensitivity of unionoidean

81
bivalve life stages to environmental contaminants. Journal of the North American
Benthological Society 27(2): 451-462.
Cordone, A.J., and D.W. Kelley, 1961. The influences of inorganic sediment on the aquatic
life of streams. California Department of Fish and Game 47: 189-228.
Dalle-Donne, I., R. Rossi, D. Giustarini, A. Milzani, and R. Colombo, 2003. Protein carbonyl
groups as biomarkers of oxidative stress. Clinica Chimica Acta 329(1): 23-38.
Davies-Colley, R.J., C.W. Hickey, J.M. Quinn, and P.A. Ryan, 1992. Effects of clay
discharges on streams. Hydrobiologia 248(3): 215-234.
Davies‐Colley, R.J., and D.G. Smith, 2001. Turbidity suspended sediment, and water clarity:
a review. Journal of the American Water Resources Association 37(5): 1085-1101.
De Zwaan, A., and T.C.M. Wijsman, 1976. Anaerobic metabolism in Bivalvia (Mollusca)
characteristics of anaerobic metabolism. Comparative Biochemistry and Physiology
Part B: Comparative Biochemistry 54(3): 313-323.
Ellis, M.M., and D.B. Calvin, 1936. Glycogen content of freshwater mussels during
prolonged starvation. Experimental Biology and Medicine 34(2): 222-225.
Gagné, F., C. Blaise, I. Aoyama, R. Luo, C. Gagnon, Y. Couillard, and M. Salazar, 2002.
Biomarker study of a municipal effluent dispersion plume in two species of
freshwater mussels. Environmental Toxicology 17(3): 149-159.
Gillis, P.L., S.K. Higgins, and M.B. Jorge, 2014. Evidence of oxidative stress in wild
freshwater mussels (Lasmigona costata) exposed to urban-derived contaminants.
Ecotoxicology and Environmental Safety 102: 62-69.
Goto, S., A. Nakamura, Z. Radak, H. Nakamoto, R. Takahashi, K. Yasuda, and N. Ishii,
1999. Carbonylated proteins in aging and exercise: immunoblot approaches.
Mechanisms of Ageing and Development 107(3): 245-253.
Gray, S.M., L.J. Chapman, and N.E. Mandrak, 2012. Turbidity reduces hatching success in
threatened spotted gar (Lepisosteus oculatus). Environmental Biology of Fishes
94(4): 689-694.
Gundacker, C. 2000. Comparison of heavy metal bioaccumulation in freshwater molluscs of
urban river habitats in Vienna. Environmental Pollution 110(1): 61-71.
Henley, W.F., M.A. Patterson, R.J. Neves, and and A.D. Lemly, 2000. Effects of
sedimentation and turbidity on lotic food webs: a concise review for natural resource
managers. Reviews in Fisheries Science 8(2): 125-139.
Kang, J., M.M. McCaleb, and R.A. McLaughlin, 2013a. Check dam and polyacrylamide
performance under simulated stormwater runoff. Journal of Environmental
Management 129: 593-598.

82
Kang, J., T.D. Sowers, O.W. Duckworth, A. Amoozegar, J.L. Heitman, and R.A.
McLaughlin, 2013b. Turbidimetric determination of anionic polyacrylamide in low
carbon soil extracts. Journal of Environmental Quality 42(6): 1902-1907.
Keller, A.E., and S.G. Zam, 1991. The acute toxicity of selected metals to the freshwater
mussel, Anodonta imbecilis. Environmental Toxicology and Chemistry 10(4): 539-
546.
Kirk, J.T., 1985. Effects of suspensoids (turbidity) on penetration of solar radiation in aquatic
ecosystems. Hydrobiologia 125(28): 195-208.
Labieniec, M., and T. Gabryelak, 2007. Antioxidative and oxidative changes in the digestive
gland cells of freshwater mussels Unio tumidus caused by selected phenolic
compounds in the presence of H2O2 or Cu2+ ions. Toxicology in Vitro 21(1): 146-156.
Lake, R.G., and S.G. Hinch, 1999. Acute effects of suspended sediment angularity on
juvenile coho salmon (Oncorhynchus kisutch). Canadian Journal of Fisheries and
Aquatic Sciences 56(5): 862-867.
Layzer, J.B., M.E. Gordon, and R.M. Anderson, 1993. Mussels: the forgotten fauna of
regulated rivers. A case study of the Caney Fork River. Regulated Rivers: Research
and Management 8(1‐2): 63-71.
Lenat, D.R., and J.K. Crawford, 1994. Effects of land use on water quality and aquatic biota
of three North Carolina Piedmont streams. Hydrobiologia 294(3): 185-199.
Line, D.E., and N.M. White, 2001. Efficiencies of temporary sediment traps on two North
Carolina construction sites. Transactions of the ASAE 44(5): 1207‐1215.
Lloyd, D.S., 1987. Turbidity as a water quality standard for salmonid habitats in Alaska.
North American Journal of Fisheries Management 7(1): 34-45.
Lloyd, D.S., J.P. Koenings, and J.D. LaPerriere, 1987. Effects of turbidity in fresh waters of
Alaska. North American Journal of Fisheries Management 7(1): 18-33.
Lushchak, V.I., 2011. Environmentally induced oxidative stress in aquatic animals. Aquatic
Toxicology 101(1): 13-30.
Machado, A.A., D.S. Wood, C.M. Bianchini, and P.L. Gillis, 2014. Responses of biomarkers
in wild freshwater mussels chronically exposed to complex contaminant mixtures.
Ecotoxicology 23(7): 1345-1358.
Matson P.A., W.J. Parton, A.G. Power, and M.J. Swift, 1997. Agricultural intensification and
ecosystem properties. Science 277(5325): 504-509.
McCaleb, M.S., and R.A. McLaughlin, 2008. Sediment trapping by five different devices on
construction sites. Transactions of the ASABE 51(5): 1613‐1621.

83
McLaughlin, R.A., and N. Bartholomew, 2007. Soil factors influencing suspended sediment
flocculation by polyacrylamide. Soil Science Society of America Journal 71(2): 537-
544.
McLaughlin, R.A., Hayes, S.A., Clinton, D.L., McCaleb, M.M., Jennings, G.D., 2009.
Water quality improvements using modified sediment control systems on construction
sites. Transactions of the ASABE 52(6): 1859-1867.
McLaughlin, R.A., and M.M. McCaleb, 2010. Passive treatment to meet the EPA turbidity
limit. American Society of Agricultural and Biological Engineering Presentation
Paper, (711P0710cd).
McMahon, R.F., 1988. Respiratory response to periodic emergence in intertidal molluscs.
American Zoologist 28(1): 97-114.
Meyer, W.B., and B.L. Turner, 1992. Human population growth and global land-use/cover
change. Annual Review of Ecology and Systematics 23: 39-61.
Mummert, A.K., R.J. Neves, T.J. Newcomb, and D.S. Cherry, 2003. Sensitivity of juvenile
freshwater mussels (Lampsilis fasciola, Villosa iris) to total and un‐ionized ammonia.
Environmental Toxicology and Chemistry 22(11): 2545-2553.
Muncy, R.J., 1979. Effects of suspended solids and sediment of reproduction and early life of
warmwater fishes: a review. Environmental Protection Agency, Office of Research
and Development, [Office of Air, Land and Water Use], Corvallis Environmental
Research Laboratory.
NatureServe. (2015). NatureServe Explorer: An online encyclopedia of life [web
application]. Version 7.1. NatureServe, Arlington, Virginia.
http://www.natureserve.org/ explorer, accessed March 2015.
Newcombe, C.P., and D.D. MacDonald, 1991. Effects of suspended sediments on aquatic
ecosystems. North American Journal of Fisheries Management 11(1): 72-82.
O’Dell, J.W., 1993. U.S. Environmental Protection Agency Method 180.1, “Turbidity
(Nephelometric),” Methods for the determination of inorganic substances in
Environmental samples, EPA/600/R-93/100.
O'Donnell, J.M., M.E. Durand, P.M.L. Robitaille, S.W. Fisher, and P.C. Stromberg, 1996.
31P‐NMR analysis of lethal and sublethal lesions produced by KCl‐intoxication in
the zebra mussel, Dreissena polymorpha. Journal of Experimental Zoology, 276(1):
53-62.
Ortmann, C., and M.K. Grieshaber, 2003. Energy metabolism and valve closure behaviour in
the Asian clam Corbicula fluminea. Journal of Experimental Biology 206(22): 4167-
4178.

84
Osterling, E.M., B. L Arvidsson, and L.A. Greenberg, 2010. Habitat degradation and the
decline of the threatened mussel Magaritifera margaritifera. Biological Conservation
141(4): 1365-1370.
Przepiora, A., D. Hesterberg, J.E. Parsons, J.W. Gilliam, D.K. Cassel, and W.Faircloth, 1998.
Field evaluation of calcium sulfate as a chemical flocculant for sedimentation basins.
Journal of Environmental Quality 27(3): 669–678.
Ricciardi, A., and J.B. Rasmussen, 1999. Extinction rates of North American freshwater
fauna. Conservation Biology 13(5): 1220-1222.
Richter, B.D., D.P. Braun, M.A. Mendelson, and L.L. Master, 1997. Threats to imperiled
freshwater fauna. Conservation Biology 11(5): 1081-1093.
Ridgway, I., T.J. Bowden, A. Roman-Gonzalez, and C.A. Richardson, 2014. Resistance to
oxidative stress is not associated with the exceptional longevity of the freshwater
pearl mussel, Margaritifera margaritifera nor three unionid species. Aquatic Sciences
76(2): 259-267.
Riisgård, H.U., and P.S. Larsen, 2000. Comparative ecophysiology of active zoobenthic filter
feeding, essence of current knowledge. Journal of Sea Research 44(3): 169-193.
Robinson, S.E., N.A. Capper, N. and S.J. Klaine, 2010. The effects of continuous and pulsed
exposures of suspended clay on the survival, growth, and reproduction of Daphnia
magna. Environmental Toxicology and Chemistry 29(1): 168-175.
Sigler, J.W., T.C. Bjornn, and F.H. Everest, 1984. Effects of chronic turbidity on density and
growth of steelheads and coho salmon. Transactions of the American Fisheries
Society 113(2): 142-150.
Sohal, R.S., 2002. Role of oxidative stress and protein oxidation in the aging process. Free
Radical Biology and Medicine 33(1): 37-44.
Sojka, R.E., D.L Bjorneberg, J.A. Entry, R.D. Lentz, and W.J. Orts, 2007. Polyacrylamide in
agriculture and environmental land management. Advances in Agronomy 92: 75-162.
Soupir, M.L., S. Mostaghimi, A. Masters, K.A. Flahive, D.H. Vaughan, A. Mendez, and
P.W. McClellan, 2004. Effectiveness of polyacrylamide (PAM) in improving runoff
water quality from construction sites. Journal of the American Water Resources
Association 40(1): 53-66.
Standard Methods, 1995. Standard Methods for the Examination of Water and Wastewater.
Nineteenth Edition. Franson, M.H., Eaton, A.D., Clesceri, L.S., and Greenberg, A.E.,
(editors). American Public Health Association, AWWA, and Water Environment
Federation. Port City Press, Baltimore, Maryland.

85
Strayer, D.L., N.F.Caraco, J.J. Cole, S. Findlay, and M.L. Pace, 1999. Transformation of
freshwater ecosystems by bivalves. BioScience 49(1): 19-27.
Strayer, D.L., J.A. Downing, W.R. Haag, T.L. King, J.B. Layzer, T.J. Newton, and J.S.
Nichols, 2004. Changing perspectives on pearly mussels, North America’s most
imperiled animals. BioScience 54(5): 429-439.
Sutherland, A.B., and J.L Meyer, 2007. Effects of increased suspended sediment on growth
rate and gill condition of two southern Appalachian minnows. Environmental Biology
of Fishes 80(4): 389-403.
Sweka, J.A., and K.J. Hartman, 2003. Reduction of reactive distance and foraging success in
smallmouth bass, Micropterus dolomieu, exposed to elevated turbidity levels.
Environmental Biology of Fishes 67(4): 341-347.
Thoms, M., and P. Thiel, 1995. The impact of urbanization on the bed sediments of South
Creek, New South Wales. Australian Geographical Studies 33(1): 31-43.
U.S. Environmental Protection Agency, 1990. The quality of our nation's water: a summary
of the 1988 National Water Quality Inventory. Environmental Protection Agency,
Washington, D.C., EPA 440/4-90-005.
U.S. Environmental Protection Agency, 2005. National management measures to control
nonpoint source pollution from urban areas. EPA-841-B-05-004. http://www.epa.
gov.owow/nps/urbanmm/index.html, accessed July 2015.
U.S. Environmental Protection Agency, 2009. National Recommended Water Quality
Criteria - Aquatic Life Criteria. http://www2.epa.gov/wqc/national-recommended-
water-quality-criteria, accessed September 2015.
Valavanidis, A., T. Vlahogianni, M. Dassenakis, and M. Scoullos, 2006. Molecular
biomarkers of oxidative stress in aquatic organisms in relation to toxic environmental
pollutants. Ecotoxicology and Environmental Safety 64(2): 178-189.
Van Nieuwenhuyse, E.E., and J.D. LaPerriere, 1986. Effects of placer gold mining on
primary production in subarctic streams of Alaska. Water Resources Bulletin 22(1):
91-99.
Ward, A.D., C.T. Haan, and B.J Barfield, 1980. The design of sedimentation basins.
Transactions of the American Society of Agricultural Engineers 22(2): 351-356.
Weston, D.P., R.D. Lentz, M.D. Cahn, R.S. Ogle, A.K. Rothert, and M.J. Lydy, 2009.
Toxicity of anionic polyacrylamide compounds when used for erosion control in
agriculture. Journal of Environmental Quality 38: 238-247.
Wilkinson, B.H., and B.J. McElroy, 2007. The impact of humans on continental erosion and
sedimentation. Geological Society of America Bulletin 119(1-2): 140-156.

86
Williams J.D., M.L. Warren, K.S. Cummings, J.L. Harris, and R.J. Neves, 1993.
Conservation status of freshwater mussels of the United States and Canada. Fisheries
18(9): 6–22.
Williams, J.D., and R.J. Neves, 1995. Freshwater mussels: a neglected and declining aquatic
resource. In: Our living resources: a report to the nation on the distribution,
abundance, and health of U.S. plants, animals, and ecosystems. U.S. Department of
the Interior, National Biological Service, Washington, D.C., pp.19-21.
Wolman, M.G., and A.P. Schick, 1967. Effects of construction on fluvial sediment, urban
and suburban areas of Maryland. Water Resources Research 3(2): 451-464.
Wood, P.J., and P.D. Armitage, 1997. Biological effects of fine sediment in the lotic
environment. Environmental Management 21(2): 203–217.
Young, M.H., J.J Tappen, G.C. Miller, S. Carroll, and R.B. Susfalk, 2007. Initial risk
characterization: using linear anionic polyacrylamide (LA-PAM) to reduce water
seepage from unlined water delivery canal systems. Desert Research Institute DHS
Publication No. 41226. Las Vegas: Desert Research Institute.

87
FIGURES
FIGURE 1. Mean (+SE) chronic survival at 20 d post exposure. No significant differences
were found between test conditions (settled sediment, suspended sediment, PAM-flocculated
sediment) or turbidity treatment levels (α = 0.05).
40
60
80
100
C 50 250 1250 3500
Su
rviv
al
(%)
Turbidity (NTU)
Sediment Flocculated Suspended

88
FIGURE 2. Acute (96 h) sublethal biomarker results to a range of turbidity and experimental
conditions derived from whole body tissues of juvenile mussels. A) Mean (± SE) protein
A,a
A,a A,aA,a
A,aA,a A,a
A,a
A,abA,ab
A,bA,b
A,bA,b A,b
4
6
8
10
12
C 50 250 1250 3500
Pro
tein
(m
g/m
l)
A
A,aA,a
AB,a
B,a B,a
A,a AB,a AB,abB,a AB,a
A,b A,b A,b A,a A,b
0
1E-13
2E-13
3E-13
4E-13
Baseline C 50 250 1250 3500
Mo
les
of
AT
P
B
A,aA,a
A,a A,aA,a
A,a
A,a
A,aA,a
A,b
A,a
BC,bC,b
BC,aAB,b
0
0.2
0.4
0.6
0.8
Baseline C 50 250 1250 3500
Pro
tein
ca
rbo
nyl
(nm
ol/
mg
)
C
Baseline Sediment Flocculated Suspended

89
concentration (mg/ml). B) Mean (± SE) adenosine triphosphate concentration. C) Mean (±
SE) oxidized protein quantified by detection of protein carbonyls. Capital letters indicate
significance (α = 0.05) across treatment levels within a sediment condition and lower case
indicates significance of test conditions within given treatment level.
A,a A,a A,aA,a
A,a
A,ab A,abA,b A,b A,b
A,bA,b
A,bA,c
A,b
0
2
4
6
8
C 50 250 1250 3500
Pro
tein
(m
g/m
l)
A
BC,b C,c BC,b
A,a
AB,bAB,abB,b
AB,ab A,a AB,abA,a
A,aA,a A,a A,a
0
1E-13
2E-13
3E-13
4E-13
Baseline C 50 250 1250 3500
Mo
les
of
AT
P
B
A,aA,b
A,a
A,a
A,a
A,a
A,bA,a A,a
A,aA,a
A,a
A,a
A,aA,a
0
0.2
0.4
0.6
Baseline C 50 250 1250 3500
Pro
tein
ca
rbo
nyl
(nm
ol/
mg
)
C
Baseline Sediment Flocculated Suspended

90
FIGURE 3.Chronic (24 d) sublethal biomarker result to a range of turbidity and experimental
conditions. Whole body tissues of juvenile mussels. Whole body tissues. A) Mean (± SE)
protein concentration (mg/ml). B) Mean (± SE) adenosine triphosphate concentration. C)
Mean (± SE) oxidized protein quantified by detection of protein carbonyls. Capital letters
indicate significance (α = 0.05) across treatment levels within a sediment condition and lower
case indicates significance of test conditions within given treatm