eric null, conemaugh valley conservancy, "incorporated data logger and biological monitoring to...
TRANSCRIPT

Incorporating Data Logger and Biological Monitoring to Diagnose Stream Pollutants
and Aid in Reclamation Efforts
By Eric NullAquatic Biologist
Conemaugh Valley Conservancy
Data Logger and Biological Monitoring
• Two Very Powerful Tools for Pollution Monitoring
• Biological Sciences and Data Logging Technology are Advancing Rapidly
• Both are Long Term Monitoring Practices • When Used Together They can Produce
Powerful Data
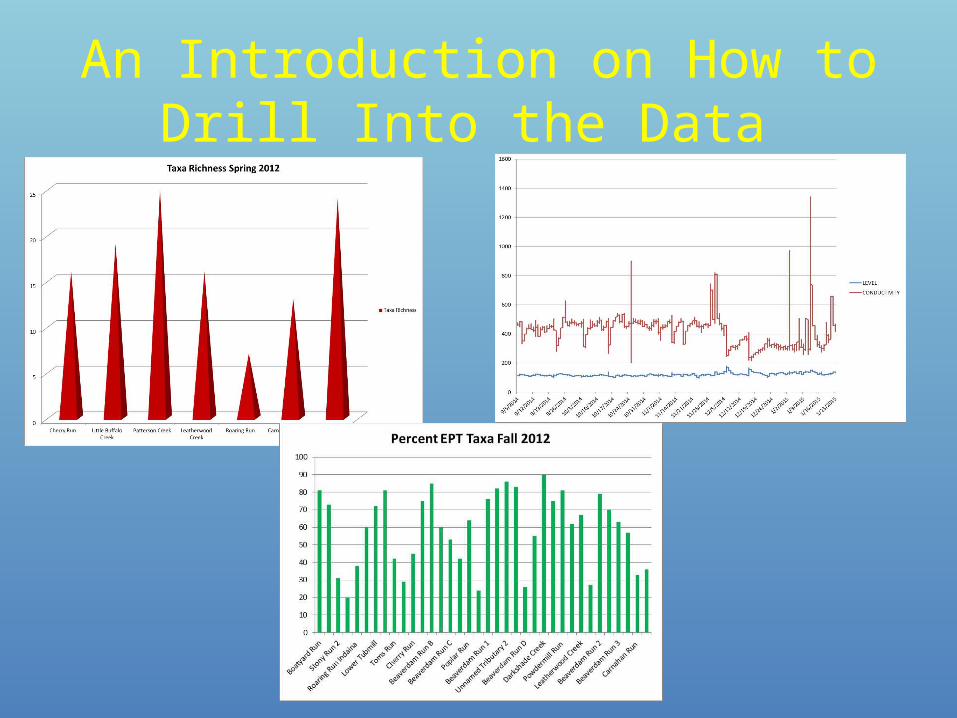
An Introduction on How to Drill Into the Data

Data Logger Data

The Unique Qualities of Data Logger Data
• Data Logger Data Sets are Immense • Logging Intervals Must Be Short To Capture
Episodes (15 min)• This Data can not be Looked at Like Grab Data • Averages Change Drastically • Full Stream Behavior is Seen • Eyes Going Crossed and Migraines are
Symptoms

Every Stream is Different

Spikes and Valleys
• Can be Caused Naturally or by Disturbance • Frequency and Duration can Determine
Between Causes
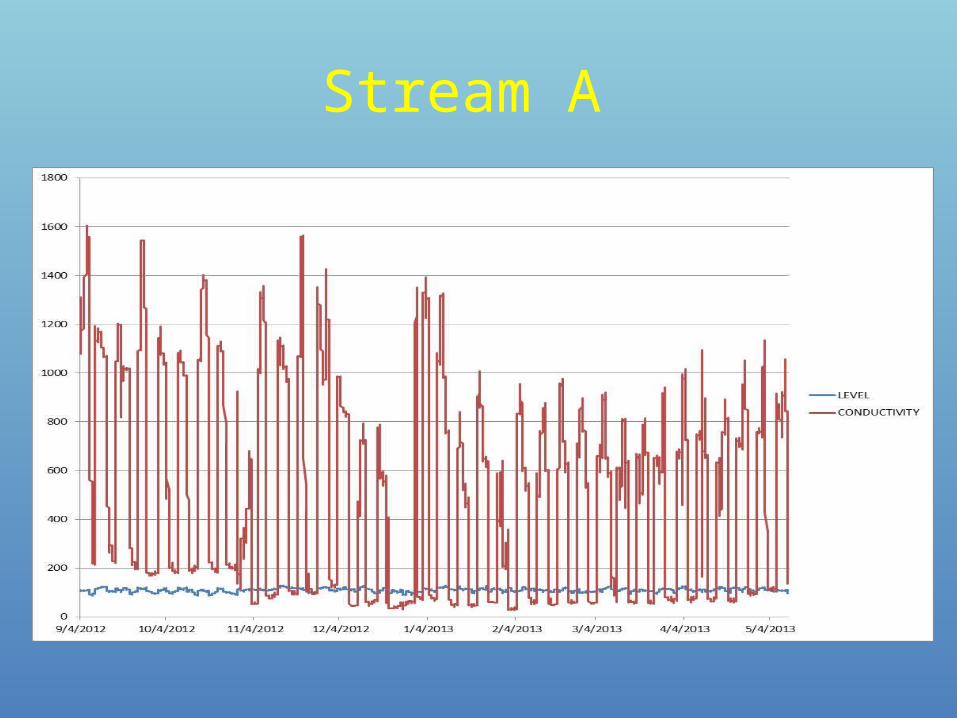
Stream A

Stream B
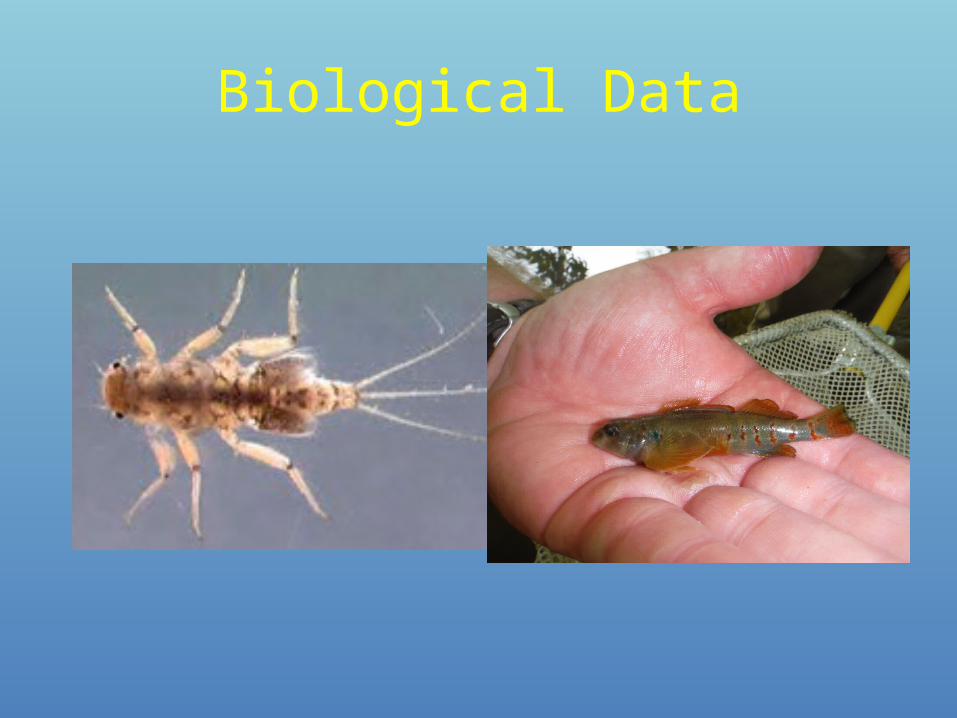
Biological Data

Macroinvertebrates
• Macroinvertebrate Taxa Act Like Letters in the Alphabet that can Spell Out Pollutants
• Certain Taxa only Thrive in Certain Polluted Conditions
• Abundance and Diversity Can Determine the Type of Pollutant

Spelling Test
• Your Stream is Dominated by the following Taxa, What is the Pollutant ?– Amphinemura– Cheumatopshche – Ilybius – Diptera – ACID Impacts
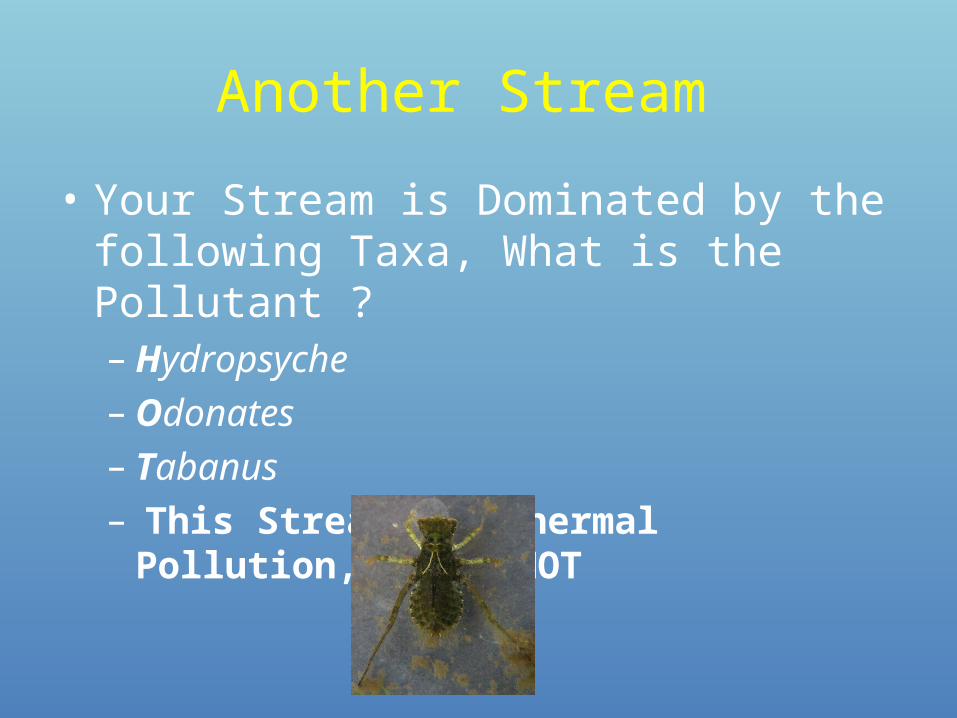
Another Stream
• Your Stream is Dominated by the following Taxa, What is the Pollutant ?– Hydropsyche – Odonates – Tabanus – This Stream has Thermal Pollution, It is HOT

One More
• Take a Guess what is Wrong Here – Psilotreta – Oligochaeta – Ochlerotatus– You guessed it Organics and Sewage

Fish Data
• Fish Abundance and Diversity can Determine Pollution
• Fish Disappear Before Macroinvertebrates in Polluted Streams
• Different Fish Life Stages are impacted by Different Pollutants

Cross Referencing Biological and Data Logger Data to Diagnose the Pollutant • This is When Both Make More Sense • Conductivity and Other Parameters Influence
Community Structure • The Community Structure Indicates What is
causing the Conductivity and Other Parameters to Behave the way they are Behaving

Stream A
Logger Data Biological Data • Macroinvertebrates
– Extremely Low Numbers of Individuals
– Poor Diversity – Acid Tolerant Taxa
• Fish – All Juveniles – Low Numbers of
Individuals – Ok Diversity

Stream A
• Pulsing Spikes with a Constant Occurrence• Depressed Biological Communities • No Adult Fish • Pollution Tolerant Macroinvertebrates • ACID and METALS

Stream B
Data Logger Data Biological Data • Macroinvertebrates
– High Biomass and Individuals
– Low Diversity – Organic and Acid
Tolerant Black Fly Taxa were Dominant
– Most Taxa Collected were Pollution Tolerant

Stream B
• Large Conductivity Spikes • High Biomass and Abundance • Low Diversity of Macros • Acidophilic Macroinvertebrates • ORGANICS AND ACID
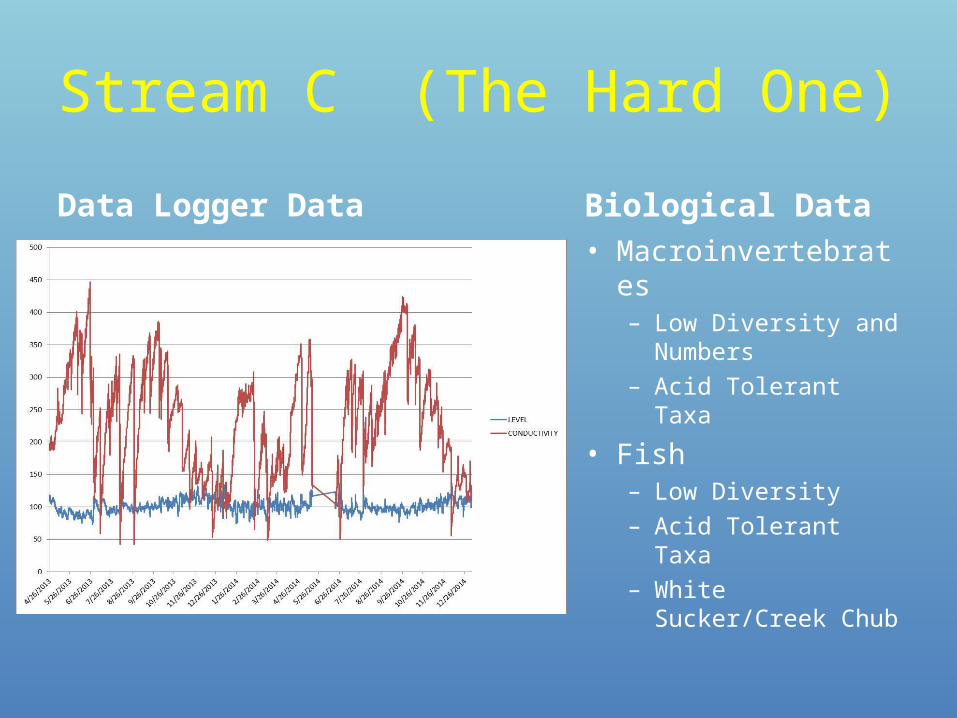
Stream C (The Hard One)
Data Logger Data Biological Data • Macroinvertebrates
– Low Diversity and Numbers
– Acid Tolerant Taxa
• Fish– Low Diversity – Acid Tolerant Taxa – White Sucker/Creek
Chub

Stream C
• Consistent Mid Level Conductivity • Low Macroinvertebrate Diversity and
Abundance • Low Fish Abundance and Diversity • Pollution Tolerant Taxa (Fish and Macros)• Episodic Acidification with Alkalinity
Replacement by Metals and Acidity

Stream D
Data Logger Data Biological Data • Macroinvertebrate
– Very High Diversity – Very High
Abundance – Dominated by
Pollution Intolerant Taxa
– No Organic Loading

Stream D
• Very Consistent and Low Conductivity • Very Diverse Macroinvertebrate Community • Volunteers and Staff Very Excited to
Electrofish in 2015 • HIGH QUALITY H2O

Conclusions
• Data Logger and Biological Data on their Own are Powerful Assessment Tools
• When Combined they can be used Very Effectively to Isolate Individual Pollutants
• Data Sets May Appear Confusing at First, but Over Time Become Easier to Interpret
• Using Both can Better Interpret Each Individual Data Set

Questions?