supcolog logger interface software - data acquisition logger data ... sl300th temperature humidity...
TRANSCRIPT

SupcoLog Logger Interface Software
USER’S GUIDE
Version 1.2x
January 17, 2007
Copyright © 2001 - 2007 – All rights reserved
Sealed Unit Parts Co., Inc P.O. Box 21, 2230 Landmark Place
Allenwood, NJ 08720, USA
Phone: (732) 223-6644 Fax: (732) 223-6828

Trademarks SUPCOLog, and the SUPCO logo are trademarks of Sealed Unit Parts Co., Inc. All other trademarks and registered trademarks mentioned in this document are the property of their respective owners.
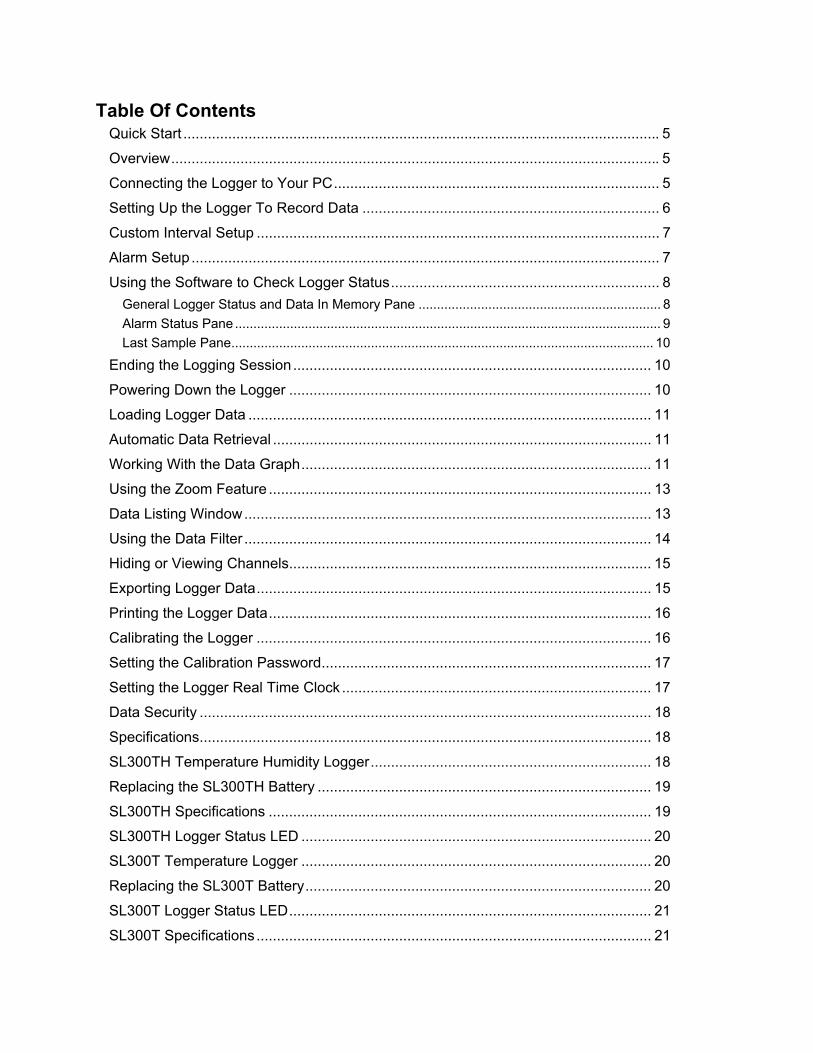
Table Of Contents Quick Start ..................................................................................................................... 5 Overview........................................................................................................................ 5 Connecting the Logger to Your PC................................................................................ 5 Setting Up the Logger To Record Data ......................................................................... 6 Custom Interval Setup ................................................................................................... 7 Alarm Setup ................................................................................................................... 7 Using the Software to Check Logger Status.................................................................. 8
General Logger Status and Data In Memory Pane .................................................................. 8 Alarm Status Pane .................................................................................................................... 9 Last Sample Pane................................................................................................................... 10
Ending the Logging Session........................................................................................ 10 Powering Down the Logger ......................................................................................... 10 Loading Logger Data ................................................................................................... 11 Automatic Data Retrieval ............................................................................................. 11 Working With the Data Graph...................................................................................... 11 Using the Zoom Feature .............................................................................................. 13 Data Listing Window.................................................................................................... 13 Using the Data Filter .................................................................................................... 14 Hiding or Viewing Channels......................................................................................... 15 Exporting Logger Data................................................................................................. 15 Printing the Logger Data.............................................................................................. 16 Calibrating the Logger ................................................................................................. 16 Setting the Calibration Password................................................................................. 17 Setting the Logger Real Time Clock ............................................................................ 17 Data Security ............................................................................................................... 18 Specifications............................................................................................................... 18 SL300TH Temperature Humidity Logger..................................................................... 18 Replacing the SL300TH Battery .................................................................................. 19 SL300TH Specifications .............................................................................................. 19 SL300TH Logger Status LED ...................................................................................... 20 SL300T Temperature Logger ...................................................................................... 20 Replacing the SL300T Battery..................................................................................... 20 SL300T Logger Status LED......................................................................................... 21 SL300T Specifications ................................................................................................. 21

DVTH Temperature Humidity Logger with Display ...................................................... 22 Turning the DVTH On and Off ..................................................................................... 22 DVTH Sample Screen ................................................................................................. 22 The DVTH Summary Screen....................................................................................... 23 DVTH Graph Screen.................................................................................................... 24 DVTH Buttons.............................................................................................................. 25 Replacing the DVTH Battery........................................................................................ 25 DVTH Specifications.................................................................................................... 26

Version 1.2x SupcoLog Logger Interface Software 5/26
Quick Start Follow the procedure below to start using your data logger:
1. Connect the data logger to a free USB port on your computer. 2. Start the SUPCOLog Interface Program. 3. From the Logger menu, select Setup. 4. Select the "Logging starts immediately when setup is complete" option. 5. Click Continue to start logging.
The logger is now logging data. You can click on the icon on the toolbar to download and view the data that has been logged.
Overview The SUPCO USB data loggers are versatile devices that can be used for a wide range of logging applications. Each logger is capable of sampling data as fast as once per second or as slow as once every 18 hours. Each logger can stop recording when memory becomes full, or rollover for continuous recording. The start of recording is software selectable to be immediate, delayed, or initiated when the Start button is press. The loggers can also be used to monitor high and low alarm events, that indicate if the recorded data passed above and/or below the user selected threshold. The loggers have a visual indication of an alarm condition. Each USB logger has an internal real time clock/calendar. This real time clock is used to record the time stamps for data samples. This real time clock is independent of your computer clock, and can be set separately, or set to match your computer clock. The USB loggers are extremely low power. Under normal operating conditions, the battery will last several years.
Connecting the Logger to Your PC Your logger comes complete with the software and the USB interface cable. To connect the logger to your computer, follow these steps:
1. Connect the USB cable to the logger and to a free USB port on your computer. 2. If you are connecting the logger to the PC for the first time, the logger will automatically be recognized and
installed on your computer.
3. Start the SUPCOLog program and click on the icon on the toolbar. The logger status screen should now be displayed. Note: The Windows operating system can not handle USB devices being unplugged and replugged too fast. When unplugging the logger, wait for about 5 seconds before plugging it (or any other USB device) in again. If you unplug and replug a device too quickly, the computer may stop recognizing any USB devices on that port. If this happens, the only solution is to restart the computer. This is a Windows USB problem and is not related to the SUPCOLog software. If more then one logger is connected to your computer at the same time, the program will ask you to select one of the loggers:

Version 1.2x SupcoLog Logger Interface Software 6/26
To select a logger click on one of the loggers on the list, and click the Connect button.
Setting Up the Logger To Record Data To set your logger to start recording data, select Setup from the Logger menu. The setup options window is shown below.

Version 1.2x SupcoLog Logger Interface Software 7/26
• Sample Interval (Total Recording Length): Select the sample interval from a predefined list of intervals. • Custom Interval: Add your own interval to the sample interval list. • Enable Data Rollover: Check this box to have the logger continuously record the data, overwriting earliest
recorded data. When this box is not checked, logging is stopped when the logger memory becomes full. • Logging Control: Logging can start in three ways depending on the selection you make: • Logging starts when the Start button is pushed: Logging will start when the Start button is pushed for about 3
seconds. • Logging starts immediately when setup is complete: Logging will start immediately once the Continue button
is clicked. • Logging starts at this time: Logging will start at the user specified time. There is no limit how far in the future
you can set the logging to start. • Channels to Log: You can elect to disable unused logger channels. When a channel is disabled, its memory is
allocated to the other channels, increasing the total logging time. The total logging time will be reflected in the Sample Interval window. Depending on the logger, some channels are required and cannot be disabled. Channels that can not be disabled are grayed out and can not be unchecked. For instance, in the picture above, the Temperature channel is required to record Realative Humidity, so the Temperature channel cannot be disabled. At least one channel must be enabled for logging.
• User Information: Enter any text you like in this box. This field is used to identify the logger to the user. You can enter descriptive location, serial number, etc.
• Alarm Setup: Click this button to open the Alarm Setup Window.
Custom Interval Setup Commonly used intervals are predefined in the Sample Interval box in the Logger Setup screen. If needed, a custom interval can be defined by the user. This is done by clicking on the Custom Interval button in the Logger Setup screen. The custom interval window will popup, as shown below. You can select a custom logging interval using this window.
In the window above, the sampling interval was set to 1 minute, 24 seconds, to allow a 3 week recording.
Alarm Setup Alarms are used to indicate whether or not the data inside the logger exceeded a user specified threshold. This can be an indication that an important event has occurred and the data is worth downloading and looking at. The alarm status is indicated visually by pressing the Check button and watching the LED light. The LED will flash green when no alarms occurred. The LED will flash red when an alarm has occurred and is stored in logger memory. To get to the Alarm Setup window, click the Alarm Setup button in the Logger Setup screen. The Alarm Setup windows allows you to set high and/or low alarm thresholds for each logger channel, or disable these alarms.

Version 1.2x SupcoLog Logger Interface Software 8/26
Alarms are set by entering the thresholds as shown in the window below.
The checkbox to the left of the low/high alarms enables the alarm when checked, and disables the alarm when clear.
Using the Software to Check Logger Status Selecting Status from the Logger menu brings up the Logger Status window. You can also bring up the status
window by pressing the button on the toolbar. The logger status screen is separated into three panes:
General Logger Status and Data In Memory Pane
Logger State shows the internal state of the logger:
o Power Save Mode: This mode is entered when the battery is replaced, or the user powered down the

Version 1.2x SupcoLog Logger Interface Software 9/26
logger. The logger battery is not used in this mode and can last for up to 10 years. The logger's real time clock is not running in this mode.
o Idle, waiting for setup: The logger is not logging. It is waiting for a setup from the user. The logger's real time clock is active in this mode.
o Logging will start on button press: Logging has been setup to start when the logger's Start button is pressed.
o Logging will start at xxxx: Delayed logging. Logging has been selected to start at a future time. The logger is waiting for this time to arrive to start logging.
o Logging in Progress: The logger is currently logging data. o Logger ID: An ID that is unique for each logger. This ID can be used to ensure that the logged data has
not been tampered with. See the Data Security section for more details. o Recording #: Indicates the number of times the logger has been setup to log. This counter can be used to
ensure that the logged data has not been tampered with. See the Data Security section for more details. o Logger Time: Shows the date and time of the logger's real time clock. o Battery Level: Shows the current level of the logger's battery. It is recommended that the battery is
replaced when this indicator reaches yellow. When this indicator reaches red, it is imperative that the battery is replaced before logging becomes unpredictable.
• Logging Started At: Shows at what time the logging has started. • Logging Duration: Shows how long the logging session has been active. • Sample Rate shows how often the logger is recording the data. • Data Rollover shows how many times the sample memory wrapped around after becoming full. • Samples in Memory: Shows information on how many samples are currently stored in the logger memory, and
how much space remains free. Note that if rollover occurs, this value will always be 100%.
Alarm Status Pane
The Alarm Status pane displays the alarm thresholds for the active channels. If a high alarm occurred the threshold is displayed in red. If a low alarm occurred, the threshold is displayed in blue.

Version 1.2x SupcoLog Logger Interface Software 10/26
Last Sample Pane
The Last Sample pane shows the value of the last sample taken, for all the active channels. It also shows when the next sample will be taken.
Ending the Logging Session There are a number of ways that the logging session can end:
1. When the logger memory becomes full, and data rollover was not selected during logger setup, the logger will automatically stop logging and enter the idle state.
2. Selecting End Logging from the Logger menu. 3. Logging will stop automatically if the logger detects a low battery condition. 4. If the battery is removed from the logger, logging will stop. No data will be lost.
Once logging has ended, it cannot be resumed without erasing the logged samples stored in the logger memory.
Powering Down the Logger Your logger uses very little power and has a long battery life. If you want to extend the battery life farther, you can power down the logger when it is not logging. In the power down mode the logger uses practically no power, and can be stored without loosing battery power, as long as the battery shelf life allows (10 years for Lithium batteries, 6 years for Alkaline). This state is useful if the logger is going to be stored without being used for an extended period of time.
• To put the logger into the power down mode, select Power Down from the Logger menu. • To check if the logger is in power down mode, check the logger status using the PC. Logger State will be indicated
as Power Save Mode. • The logger automatically exits power save mode when it is set up to log, or when the logger's real time clock is set.
Note: The power down mode can only be entered when the logger is idle (not logging). In the power down mode the logger's real time clock is not running.

Version 1.2x SupcoLog Logger Interface Software 11/26
Loading Logger Data
To get the sampled data from your logger, connect the logger to your computer and click the button on the toolbar, or select Get Data from the Logger menu. Once the data is transferred from the logger to your PC, the data graph and data listing windows will be displayed. Logged data can be retrieved from the logger at any time. You do not have to stop the logging session to retrieve the data. The graph display will be blank if there are less than two data points logged. The listing window will be blank if there are no data points logged (as can happen during delayed logging, or when logging is set to start on button press).
Automatic Data Retrieval The SUPCOLog Interface Software can be setup to automatically load the data from the logger into the computer as samples become available. In this mode the graph and the listing windows are updated automatically with the new data. To enable this feature follow these steps:
• Make sure that your logger is connected to your computer. • Make sure that the logger is logging data. Automatic retrieval is not available when the logger is not logging.
• Manually download the data for the first time by clicking the button on the toolbar, or select Get Data from the Logger menu.
• From the Logger menu select Auto Update. The computer will download data as often as the sampling interval you setup. For instance, if you set your logger to collect data once every minute, the software will perform a download once a minute. Of course the logger has to be connected to your computer while the Auto Update mode is active. When the Auto Update mode is active, the software does not change the zoom level of your graph. Instead it scrolls the graph as new data becomes available.
Working With the Data Graph Clicking anywhere within the graph window activates the graph toolbar buttons and the graph window features.

Version 1.2x SupcoLog Logger Interface Software 12/26
• The graph plots each data channel using a different color and dot style. A small rectangular legend shows the color and the dot style of each channel. This legend can be moved by clicking the left mouse button while inside the legend and dragging the legend to where you want it to be. The legend can be turned ON and OFF by pressing the
button on the toolbar. • There is an additional legend above each of the Y axis. This legend is the channel name drawn in the same color as
the channel line on the graph. This legend helps identify which channel belongs to which axis. For instance, in the graph above, the Temperature in red and Dew Point in green correspond to the left Y axis, the Relative Humidity in blue corresponds to the right Y axis.
• The Cursor Location Markers show the cursor position on the graph. The position is shown on each of the axis in a
slightly larger, bold text. The position indicators can be turned ON and OFF by pressing the button on the toolbar

Version 1.2x SupcoLog Logger Interface Software 13/26
• Clicking the button activates the sample marker function. When this function is active, clicking a point on the graph, marks this point, and shows the point values for all channels, at the specified time. An example of sample markers is shown above.
• During zoom mode, you can use the vertical and horizontal scroll bars to move the graph around.
• Clicking the button activates the zoom mode. To zoom to an area, click the left mouse button at one corner and drag the mouse, while holding down the button, to the opposite corner. Releasing the button will activate the zoom. Clicking the right mouse button unzooms the graph one level. When the graph is zoomed, you can use the vertical and horizontal scroll bars to move the graph around. See Using the Zoom Feature section for more details.
• The button turns ON and OFF the marks at the data points.
• The button connects the sample points with a line.
• The button turns the grid lines ON and OFF.
• The button on the toolbar causes the graph to unzoom to the full scale of the recorded data. This means that the minimum and maximum scale will be about equivalent to the minimum and the maximum of the data.
Using the Zoom Feature There are a number of ways to zoom to the data you would like to see on the screen.
• Graphic Zoom: You can graphically zoom on the portion of the data that is displayed on the screen by pressing the left mouse button and dragging the box around the part of the graph you would like to zoom to. You can repeat this until the graph is zoomed to just a few points. Pressing the right mouse button reverses the graphic zoom (causes unzoom).
• Unzoom: Pressing the left mouse button, then releasing it without dragging the mouse causes the graph to unzoom (zoom out). Once again pressing the right mouse button reverses this zoom.
• The button on the toolbar causes the graph to unzoom to the full scale of the data. This means that the minimum and maximum scale will be about equivalent to the minimum and the maximum of the data.
• Autoscaling a specific axis: You can also autoscale the time or one of the data axes only, without affecting the other axes. To autoscale the time axis only, choose Time -> Auto Scale from the Zoom menu. To autoscale one of the data axis only, choose Auto Scale for the appropriate channel from the Zoom menu.
• Numerical Zoom: Another way to specify the zoom is to enter the minimum and maximum limits of the graph numerically. You can do this individually for the time axis and for each of the data axis. To do this, select Custom for the appropriate axis from the Zoom menu, and enter the minimum and maximum limits for the axis.
Data Listing Window The data listing window is shown below.

Version 1.2x SupcoLog Logger Interface Software 14/26
The Data pane lists the data samples collected by the logger. If the data rollover check box in the setup window was cleared, the earliest data samples are listed. If the data rollover check box was checked, the latest data samples are listed. The column width of each column is adjustable by using the left mouse button and dragging the column to the desired width. The icon next to a data sample indicates an alarm condition. That is, one or more of the data channels are outside the minimum or maximum (alarm low and alarm high) thresholds.
Using the Data Filter The data filter helps to display only relevant information in the data listing window. It can also decrease the number of printed pages when the data listing is printed. The data filter allows you to:
• Hide sample points when the data did not change sufficiently. • Show only data points that were sampled in a specified time period.
To apply the data filter, select the Data Filter… option from the View menu. The filter selection dialog box is

Version 1.2x SupcoLog Logger Interface Software 15/26
shown below.
• The filter can be disabled by checking the “No Data Filter” box. • Sample range filtering can be disabled by checking the “Don’t limit using xxxx” box for all the channels or for
specific channels. Channels are selected by clicking on the channel pane. • Date range filtering can be disabled by checking the “Don’t Limit By Date” box. • The filter settings apply consecutively. It is therefore very easy to find settings that will display no samples at all.
The SUPCOLog program will give you a warning if you selected a filter that results in no samples being displayed.
Hiding or Viewing Channels The SUPCOLog software has the ability to hide channels you do not wish to view. This feature is accessed by selecting Channels > from the View menu, and then deselecting or selecting the specific channels you wish to hide or view. The hidden channels do not appear in either the plot or the data listing. They also are not exported through the export to text and export to Excel features.
Exporting Logger Data The SUPCOLog software allows exporting sample data to a text file or to a Microsoft Excel file.
• To export sample data to a text file, select Export -> Text File from the File menu. • To export sample data to a Microsoft Excel file, select Export -> Excel File from the File menu.
The file exported to Microsoft Excel is an Excel .csv file. The easiest way to open this file in Excel is to just double click on the created file. The file can also be opened from within Microsoft Excel:

Version 1.2x SupcoLog Logger Interface Software 16/26
1. From the Microsoft Excel application choose Open… from the File menu. 2. In the Open window, under Files of type:, select Text Files (*.prn, *.txt, *.csv). 3. Navigate to the directory where you saved the exported file. The file name should be listed in the window. 4. Select the file and click Open.
When you first open the .csv file in Excel, the Date Time column will be in a strange format. To convert to a normal time and date format follow these steps:
1. Select the entire Date Time column by clicking on the column header (E). 2. While the cursor is in the column, click the right mouse button and select Format Cells. 3. Under Category: select Date or Time, then choose the format that suits you in the Type: column. 4. Click OK when done.
Printing the Logger Data The SUPCOLog software can print the data graph and data samples list. To print these, select Print from the File menu. You can also view how your data will be printed using the Print Preview option from the File menu. Graphs and data samples are printed as they appear on the screen. For graphs, this includes the current zoom detail, marking of sample points, etc (see Working with the Data Graph for more detail). For sample listing printout, any data filters applied to the data will be applied to the printed output as well. Data filters are especially useful for reducing the amount of pages that the data sample printout generates.
Calibrating the Logger Your logger is factory calibrated to an accuracy given in the logger specifications. However, there may be times when you wish to adjust the calibration of your logger. NIST traceable calibration certificate is available at the factory for an additional cost. The SUPCOLog software also provides you with the ability to perform a single point offset calibration. This calibration can be used to increase the accuracy of your logger for a restricted data range. For instance, if your application calls for logging temperature between 20°F and 32°F, you may want to calibrate your logger at 26°F. Warning: Calibrating the logger erases the data that is stored in logger memory. Calibration only can be performed when the logger is idle (not logging). To calibrate your logger, select Calibrate… from the Logger menu. For extra security, calibration is password protected. You must enter the correct password in the Calibration Password window before you’re allowed to calibrate the unit. The Password Calibration window also allows you to change the password. Once the password is entered correctly, a window asking you to select the channel to calibrate pops up. Select the channel you would like to calibrate and click OK. Each channel must be calibrated separately. The User Calibration window for the channel you selected will appear:

Version 1.2x SupcoLog Logger Interface Software 17/26
To perform the calibration: 1. Select a stable and accurate reference instrument. It is best to use a reference instrument that has at least 2
to 4 times the accuracy of the logger you are calibrating. For instance, if the accuracy of the logger temperature channel is given as +/-1ºF, the accuracy of your reference instrument should be at least +/-0.5ºF to +/-0.25ºF.
2. Make sure that both the logger and your reference instrument are reading the same stable source. For temperature and humidity, it is best to place the logger and the reference sensor in a stable chamber.
3. Adjust your source to the value at which you would like to perform the calibration. 4. Wait for your reference instrument and the reading in the “Logger Reading” box to stabilize. 5. Enter the reading from your reference instrument in the “Reference Instrument” box, and hit the Calibrate!
button.
Setting the Calibration Password
To change the calibration password select Calibrate… from the Logger menu. When the Calibration Password window is displayed, follow these steps:
• Enter the current calibration password in the “Enter Calibration Password” box. If you are setting the password for the first time, do not enter anything in this box, since the logger is factory configured not to have a password as a default.
• Enter the new password in the “New Password” box. • Enter the new password again in the “Repeat New Password” box. • Click OK.
You can also remove password protection (restore factory default empty password) by checking “Remove Password”. Warning: If you forget the calibration password, the logger has to be returned to the factory for the password to be reset.
Setting the Logger Real Time Clock Each logger has an internal Real Time Clock. This clock is updated every second. During logging, the time stamps of the data samples are set by the Real Time Clock. When you first connect a new battery to the logger, or when the logger is in power down state, the real time clock is not running. When the real time clock is stopped, and you setup your logger to log, the SUPCOLog software

Version 1.2x SupcoLog Logger Interface Software 18/26
automatically matches the logger clock to your computer’s clock. You can also manually set the logger’s real time clock, using the SUPCOLog software To set the logger’s Real Time Clock, select Set Clock… from the Logger menu . Make sure that “Use Windows Clock” is unchecked, then enter the current date and time in the appropriate fields. If the “Use Windows Clock” is checked, the logger's real time clock will be matched to your Windows clock. Note: You cannot set the Real Time Clock while logging is in progress.
Data Security The SUPCO loggers and the SUPCOLog software have a number of features to prevent tampering with, or falsifying the logged data. The security features are as follows:
• Each logger comes with a factory set unique logger ID. The logger ID is always displayed in the Logger Status window and the Data Summary window. The logger ID cannot be changed by the user. The logger ID prevents somebody from switching loggers once the data is collected.
• Once logging has started, parameters such as sample rate, logging start time, logging sample counter, etc. cannot be changed without first clearing the recorded data. This prevents gathering many data samples at a fast sample rate and then lowering the sample rate to give the appearance that the data was recorded over a longer period of time.
• Each logger has an internal recording session counter. This counter counts how many times the logger was setup to record data. This counter cannot be reset. This counter can be used to guarantee that the logger data has not been cleared during a given period of time. To do this, make a note of the recording counter after you setup the logger to log. This counter should now remain the same. If at a later time, the recording counter has increased, you know that somebody stopped the recording, and initiated a new logging session.
• The logger's internal real time clock cannot be changed during the logging session. • The calibration data is password protected. This prevents a third party from recalibrating the unit to yield a false
data. • Calibrating the logger erases the logged data from the logger memory. This prevents somebody from adjusting the
logged data after a recording was made.
Specifications Common logger specifications are shown below. For specific logger specification, see the logger documentation. PC Interface USB port. USB cable is included Sampling Interval User selectable from 1 second to 18 hours, in 1 second increments. Data Security Unique factory set logger ID. Recording session counter. Password protected
calibration. Operating System Compatibility
Windows 98SE, Windows ME, Windows 2000, Windows XP and above. Not compatible with Windows NT or Windows 95.
Minimum System Requirements
5MB of free disk space, 800 x 600 screen resolution, 1 free USB port.
Recording Start On button press, immediate after setup, or at a user specified date and time. Recording Mode Stop on memory full, or continuous recording with memory rollover Real Time Status Visual indication through the status LED. Software real time status. User Calibration Password protected calibration for each channel. User Information Up to 30 characters Logger Channels User selectable. Disabling channels increases the storage capacity of the other
channels. Units US and Metric Data Format Exportable to text or Excel files.
SL300TH Temperature Humidity Logger

Version 1.2x SupcoLog Logger Interface Software 19/26
The SL300TH is a self-contained, precision instrument for recording the temperature and relative humidity of the surrounding environment. The SL300TH can store up to 43,344 temperature samples, or up to 21,672 of both temperature and relative humidity samples. In addition to Temperature and Humidity, the SUPCOLog software computes and displays the Dew Point Temperature. The SL300TH logger temperature and relative humidity sensors are open to the air. It is therefore important to ensure that water does not get into the unit. This is especially important in high humidity situations (90% RH and above) where water may condense inside the logger, causing damage to the internal electronics. Warning: Care must be taken to ensure that the logger is not operating under condensing conditions. This means that the dew point temperature must be below the ambient temperature. Condensation will damage the humidity sensor and the logger electronics.
Replacing the SL300TH Battery The battery level of the SL300TH can be checked using the SUPCOLog software, by opening the Logger Status window. It is suggested that the battery is replaced when the battery level reaches yellow. When the battery level reaches red, it is imperative that the battery is replaced as soon as possible. When the battery level is too low, the logger will stop logging automatically, resulting in data not being recorded. The SUPCOLog software will give you a warning if you try to start a logging session while the battery is low. To replace the battery follow these steps:
1. Disconnect the logger from the USB cable. Do not replace the battery while the USB cable is connected! 2. Using a screwdriver, remove the screw in the back of the logger. 3. Remove the logger from the case. 4. Using a pen or a pencil, push the battery out of the casing, then use your fingers to slide the battery out
Avoid using pliers as they will short the battery. 5. Press and hold the logger button for about 2 seconds. This step removes any extraneous charge from the
logger system. This step is very important. The logger may not operate correctly if this step is not performed.
6. Slide the new CR2032 battery into the battery case. Make sure that the + indicator on the battery matches the + indicator on the battery case.
7. When the battery is replaced correctly, the LED will flash a single green flash for about 1 second. 8. Place the logger back in the case and replace the screw.
General guidelines as to how long a battery will last is shown in the table below. It is assumed that the logger uses a fresh CR2032 battery, and is setup for continuous logging with rollover enabled. Logging Interval Battery Life 1 Second 4 Months 5 Seconds 17 Months 10 Seconds 2.5 Years 30 Seconds 4.5 Years 1 Minute 6 Years 2 Minutes 7 Years
SL300TH Specifications Sample Point Capacity 43,344 points for temperature only. 21,672 points for temperature, humidity and
dew point. Alarms Visual over and under alarm indicator for temperature and humidity. Dew point
alarms are not available Calibration User single point offset calibration is available through software for both

Version 1.2x SupcoLog Logger Interface Software 20/26
temperature and humidity. Calibration is password protected. Operating Temperature -35°F to 160°F (-31°C to 70°C)* Storage Temperature -40°F to 170°F (-40°C to 77°C) Time Accuracy +/-100ppm @75°F Relative Humidity Range 0% to 99%RH, non condensing. Relative Humidity Accuracy
+/- 2%RH, from 10% to 90% RH
Relative Humidity Resolution
0.01%RH
Temperature Accuracy +/-1°F (0.5°C) Temperature Resolution 0.01°F or 0.01°C Dimensions 3’’ x 1.6" x 0.6’’ (7.6cm x 4.0cm x 1.5cm) Weight 1.0 oz (23g) Power Source 3V CR2032 Lithium coin cell battery (Included) Battery Life (average use) 6 Years
* Lithium batteries do not perform well in very low temperatures. If the logger is going to be used in temperatures below 32°F (0°C), make sure to start with a fresh battery, and check the battery level often.
SL300TH Logger Status LED Pressing the Start/Check button makes the LED flash a series of flashes to indicate the logger status. The table below shows the different logger states that the status light can show. Status Light Logger State Flashed Green one time Logging is not in progress. Data in memory did not exceed the
alarm thresholds. Flashed Red one time Logging is not in progress. Data in memory exceeded one of the
alarm thresholds. Flashed Green four times Logging is in progress. Data in memory did not exceed the
alarm thresholds Flashed Red four times Logging is in progress. Data in memory exceeded one of the
alarm thresholds Flashed Green-Red three times Delayed logging. Logging will start at the user specified time.
SL300T Temperature Logger The SL300T is a self-contained, precision instrument for recording the temperature of the surrounding environment. The SL300T can store up to 43,344 temperature samples.
Replacing the SL300T Battery The battery level of the SL300T can be checked using the SUPCOLog software, by opening the Logger Status window. It is suggested that the battery is replaced when the battery level reaches yellow. When the battery level reaches red, it is imperative that the battery is replaced as soon as possible. When the battery level is too low, the logger will stop logging automatically, resulting in data not being recorded. The SUPCOLog software will give you a warning if you try to start a logging session while the battery is low. To replace the battery follow these steps:
1. Disconnect the logger from the USB cable. Do not replace the battery while the USB cable is connected! 2. Using a screwdriver, remove the screw in the back of the logger.

Version 1.2x SupcoLog Logger Interface Software 21/26
3. Remove the logger from the case. 4. Using a pen or a pencil, push the battery out of the casing, then use your fingers to slide the battery out
Avoid using pliers as they will short the battery. 5. Press and hold the logger button for about 2 seconds. This step removes any extraneous charge from the
logger system. This step is very important. The logger may not operate correctly if this step is not performed.
6. Slide the new CR2032 battery into the battery case. Make sure that the + indicator on the battery matches the + indicator on the battery case.
7. When the battery is replaced correctly, the LED will flash a single green flash for about 1 second. 8. Place the logger back in the case and replace the screw.
General guidelines as to how long a battery will last is shown in the table below. It is assumed that the logger uses a fresh CR2032 battery, and is setup for continuous logging with rollover enabled. Logging Interval Battery Life 1 Second 4 Months 5 Seconds 17 Months 10 Seconds 2.5 Years 30 Seconds 4.5 Years 1 Minute 6 Years 2 Minutes 7 Years
SL300T Logger Status LED Pressing the Start/Check button makes the LED flash a series of flashes to indicate the logger status. The table below shows the different logger states that the status light can show. Status Light Logger State Flashed Green one time Logging is not in progress. Data in memory did not exceed the alarm
thresholds. Flashed Red one time Logging is not in progress. Data in memory exceeded one of the alarm
thresholds. Flashed Green four times Logging is in progress. Data in memory did not exceed the alarm
thresholds Flashed Red four times Logging is in progress. Data in memory exceeded one of the alarm
thresholds Flashed Green-Red three times
Delayed logging. Logging will start at the user specified time.
SL300T Specifications Sample Point Capacity 43,344 temperature points. Alarms Visual over and under alarm indicator for temperature. Calibration User single point offset calibration is available through software. Calibration is
password protected. Operating Temperature -40°F to 185°F (-40°C to 85°C)* Storage Temperature -40°F to 185°F (-40°C to 85°C) Time Accuracy +/-100ppm @75°F Temperature Accuracy +/-0.9°F (0.5°C) for the range of 0°F to 120°F (-17°C to 50°C) Temperature Resolution 0.01°F or 0.01°C

Version 1.2x SupcoLog Logger Interface Software 22/26
Dimensions 3’’ x 1.6" x 0.6’’ (7.6cm x 4.0cm x 1.5cm) Weight 1.0 oz (23g) Power Source 3V CR2032 Lithium coin cell battery (Included) Battery Life (average use) 6 Years
* Lithium batteries do not perform well in very low temperatures. If the logger is going to be used in temperatures below 32°F (0°C), make sure to start with a fresh battery, and check the battery level often.
DVTH Temperature Humidity Logger with Display The DataView DVTH is a self-contained, precision instrument for recording the temperature and relative humidity of the surrounding environment. The DVTH can store up to 43,344 temperature samples, or up to 21,672 of both temperature and relative humidity samples. In addition to Temperature and Humidity, the unit computes and displays the Dew Point Temperature. The DVTH features a display that allows the user to see the current temperature, humidity and dew point simultaneously. In addition the unit shows, graphically, the temperature and relative humidity data that has been logged during the current logging session. A summary screen shows information about the current logging session, such as the logging rate, the number of samples recorded, the length of the current recording and the amount of time left for recording. The DVTH temperature and relative humidity sensors are open to the air. It is therefore important to ensure that water does not get into the unit. This is especially important in high humidity situations (90% RH and above) where water may condense inside the logger, causing damage to the internal electronics. Warning: Care must be taken to ensure that the logger is not operating under condensing conditions. This means that the dew point temperature must be below the ambient temperature. Condensation will damage the humidity sensor and the logger electronics.
Turning the DVTH On and Off To conserve battery life, the DVTH will turn itself Off after about 1hour of operation, if the unit is not logging and no buttons are pushed. The display will go blank and the unit will enter a Power Save mode. In this mode the logger uses practically no power, and the battery will last as long as its shelf life (typically 6 years for an alkaline battery). In the Power Save mode you can still use all the features of the SUPCOLog software to communicate with the logger, even set the logger for a new logging session. The logger will automatically exit the Power Down mode when it is set to log. Another way to turn the logger Off is to power down the logger using the SUPCOLog software. To turn the logger On at any time, just press any of the logger's buttons. The display will come back on and the logger will operate normally
DVTH Sample Screen There are three different screens that the user can switch between, using the View button. The Sample and Summary screen show the current status of the logger. The Graph screen shows a record of the logged temperature and humidity samples in memory. The Sample screen is shown below.
Version 1.2x SupcoLog Logger Interface Software 23/26
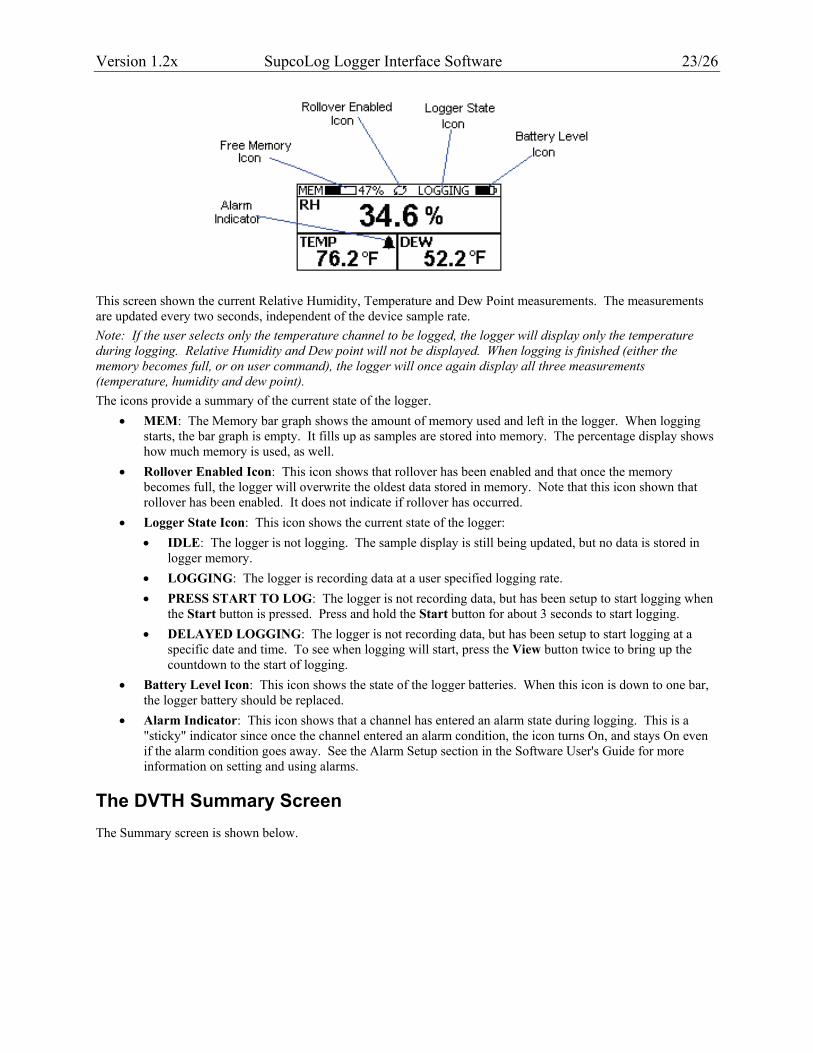
This screen shown the current Relative Humidity, Temperature and Dew Point measurements. The measurements are updated every two seconds, independent of the device sample rate. Note: If the user selects only the temperature channel to be logged, the logger will display only the temperature during logging. Relative Humidity and Dew point will not be displayed. When logging is finished (either the memory becomes full, or on user command), the logger will once again display all three measurements (temperature, humidity and dew point). The icons provide a summary of the current state of the logger.
• MEM: The Memory bar graph shows the amount of memory used and left in the logger. When logging starts, the bar graph is empty. It fills up as samples are stored into memory. The percentage display shows how much memory is used, as well.
• Rollover Enabled Icon: This icon shows that rollover has been enabled and that once the memory becomes full, the logger will overwrite the oldest data stored in memory. Note that this icon shown that rollover has been enabled. It does not indicate if rollover has occurred.
• Logger State Icon: This icon shows the current state of the logger: • IDLE: The logger is not logging. The sample display is still being updated, but no data is stored in
logger memory. • LOGGING: The logger is recording data at a user specified logging rate. • PRESS START TO LOG: The logger is not recording data, but has been setup to start logging when
the Start button is pressed. Press and hold the Start button for about 3 seconds to start logging. • DELAYED LOGGING: The logger is not recording data, but has been setup to start logging at a
specific date and time. To see when logging will start, press the View button twice to bring up the countdown to the start of logging.
• Battery Level Icon: This icon shows the state of the logger batteries. When this icon is down to one bar, the logger battery should be replaced.
• Alarm Indicator: This icon shows that a channel has entered an alarm state during logging. This is a "sticky" indicator since once the channel entered an alarm condition, the icon turns On, and stays On even if the alarm condition goes away. See the Alarm Setup section in the Software User's Guide for more information on setting and using alarms.
The DVTH Summary Screen The Summary screen is shown below.
Version 1.2x SupcoLog Logger Interface Software 24/26
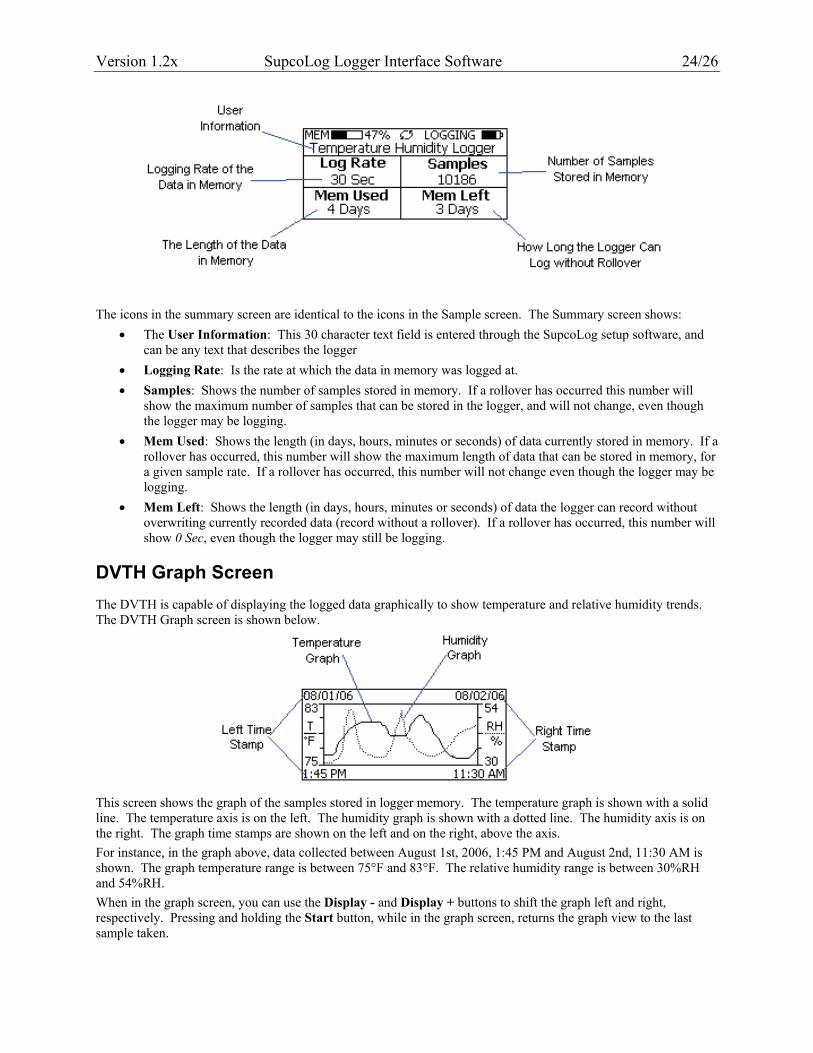
The icons in the summary screen are identical to the icons in the Sample screen. The Summary screen shows:
• The User Information: This 30 character text field is entered through the SupcoLog setup software, and can be any text that describes the logger
• Logging Rate: Is the rate at which the data in memory was logged at. • Samples: Shows the number of samples stored in memory. If a rollover has occurred this number will
show the maximum number of samples that can be stored in the logger, and will not change, even though the logger may be logging.
• Mem Used: Shows the length (in days, hours, minutes or seconds) of data currently stored in memory. If a rollover has occurred, this number will show the maximum length of data that can be stored in memory, for a given sample rate. If a rollover has occurred, this number will not change even though the logger may be logging.
• Mem Left: Shows the length (in days, hours, minutes or seconds) of data the logger can record without overwriting currently recorded data (record without a rollover). If a rollover has occurred, this number will show 0 Sec, even though the logger may still be logging.
DVTH Graph Screen The DVTH is capable of displaying the logged data graphically to show temperature and relative humidity trends. The DVTH Graph screen is shown below.
This screen shows the graph of the samples stored in logger memory. The temperature graph is shown with a solid line. The temperature axis is on the left. The humidity graph is shown with a dotted line. The humidity axis is on the right. The graph time stamps are shown on the left and on the right, above the axis. For instance, in the graph above, data collected between August 1st, 2006, 1:45 PM and August 2nd, 11:30 AM is shown. The graph temperature range is between 75°F and 83°F. The relative humidity range is between 30%RH and 54%RH. When in the graph screen, you can use the Display - and Display + buttons to shift the graph left and right, respectively. Pressing and holding the Start button, while in the graph screen, returns the graph view to the last sample taken.

Version 1.2x SupcoLog Logger Interface Software 25/26
When the logger is logging, the graph display is automatically updated as new samples are logged.
DVTH Buttons The DVTH has five buttons as shown below.
• Units: Use this button to change the displayed units between °F and °C. • View: Use this button to change the displayed screen. • Start: If the logger has been setup to start on button press, press and hold the Start button to begin
logging. In the Graph screen, pressing and holding this button returns the view to the last sample logged. • Display +: Use this button to increase the screen contrast when in Sample and Summary screens. When in
the Graph screen this button shifts the graph to the right. • Display -: Use this button to decrease the screen contrast when in Sample and Summary screens. When in
the Graph screen this button shifts the graph to the left.
Replacing the DVTH Battery The DVTH uses three AA type alkaline or lithium batteries. Using rechargeable Ni-MH batteries is not recommended. The battery level of the DVTH is shown on the screen, or can be checked using the SUPCOLog software, by opening the Logger Status window. It is suggested that the battery is replaced when the battery level reaches 1 bar on the display, or in the yellow zone in the SUPCOLog software. When the battery indicator is empty, or reaches red in the SUPCOLog software, it is imperative that the battery is replaced as soon as possible. When the battery level is too low, the logger will stop logging automatically, resulting in data not being recorded. The SUPCOLog software will give you a warning if you try to start a logging session while the battery is low. To conserve battery power, the DVTH will shutdown automatically, when not logging, after about one hour of operation. To turn the logger back On, just press any button. The logger can run while logging continuously for one year on a single set of three AA alkaline batteries. To replace the batteries follow these steps:
1. Disconnect the logger from the USB cable. Do not replace the battery while the USB cable is connected! 2. Using a screwdriver, remove the 4 screws in the back of the logger. 3. Carefully remove the back case. Be very careful not to pull on the battery wires. 4. Remove the three used AA batteries. 5. Press and hold any logger button for about 2 seconds. This step removes any extraneous charge from the
logger system. This step is very important. The logger may not operate correctly if this step is not performed.
6. Insert three new AA batteries into the battery holder. Make sure that the + indicator on the battery matches the + indicator on the battery case.
7. When the batteries is replaced correctly, the logger should start up automatically and show the Sample screen.
8. Replace the DVTH back cover and replace the 4 screws.

Version 1.2x SupcoLog Logger Interface Software 26/26
DVTH Specifications Text Display Displays real time temperature, humidity and dew point. Displays logging
summary, sample rate, memory used and memory left. Graph Display Shows measurement trends graphically. Graph can be scrolled through the entire
logged data. Sample Point Capacity 43,344 points for temperature only. 21,672 points for temperature, humidity and
dew point. Alarms Visual over and under alarm indicator for temperature and humidity. Dew point
alarms are not available Calibration User single point offset calibration is available through software for both
temperature and humidity. Calibration is password protected. Operating Temperature 15°F to 150°F (-10°C to 65°C) Storage Temperature -5°F to 160°F (-20°C to 70°C) Time Accuracy +/-100ppm @75°F Relative Humidity Range 0% to 99%RH, non condensing. Relative Humidity Accuracy
+/- 2%RH, from 10% to 90% RH
Relative Humidity Resolution
0.01%RH
Temperature Accuracy +/-1°F (0.5°C) Temperature Resolution 0.01°F or 0.01°C Dimensions 4’’ x 3.05" x 1.5’’ (10.2cm x 7.7cm x 3.8cm) Weight 7.0 oz (200g) Power Source Three AA batteries (Included) Battery Life 1 year continuous use, 2 years average use. The logger automatically turns itself
Off after 1 hour, when not logging. Turn On by pressing any button.