equity one limited annual report 2016/2017 · 2 equity one limited annual report 2016/2017 business...
TRANSCRIPT

A Carson Cumberbatch Company
EQUITY ONE LIMITED ANNUAL REPORT 2016/2017one

ContentsChairman’s Statement 1Business Review 2Annual Report of the Board of Directors on the A�airs of the Company 5
Financial Calendar 11Independent Auditors' Report 12Statement of Pro�t or Loss and otherComprehensive Income 13Statement of Financial Position 14Statement of Changes in Equity 15Statement of Cash Flow 16Notes to the Financial Statements 17Five Year Summary 50Notice of Meeting 51Form of Proxy 55

1
Chairman’s Statement
Dear Shareholder,
As the Chairman of the Board, it is with utmost pleasure that I welcome you to the 35th Annual General Meeting of the company and present to you the Annual Report and the Audited Financial Statements of Equity One Limited for the financial year ended 31st March 2017.
The Economy grew by a moderate rate of 4.4% during the year. Yet the construction sector growth recorded an impressive 14.9% against the backdrop of increased activity in the spheres of high-rise residential and commercial property development. The capital city of the country, Colombo is experiencing a wide transformation in terms of architectural and infrastructure development, along with notable progress observed in the Port City Development project during the course of the year.
The developments in Sri Lankan tourism are noteworthy with a promising target of 4 Mn arrivals to be secured by 2020. Further, on the infrastructure arena, the Colombo and the Hambanthota ports are being developed as well as an increased number of projects in the Northern and Eastern regions of the country are being implemented.
Backed by these developments, increased business activities are taking place across the country which augurs well for the commercial property market-space. Stepping in to the new financial year, the growth momentum in the industry is likely to continue. Nevertheless, in the forthcoming period, both interest rates and the inflation seem to be on the gradual rise, indicating a potential slowdown in the property development market. Already high and ever-increasing construction costs continue to worry the construction industry.
The Property portfolio of your Group continued to be able to command decent rent and high occupancy due to their strategic locations in Colombo combined with superior and personalised service offered to its tenants. This was well visible during the year under consideration, which observed an average occupancy of 93%, up by 3% against the prior year. Consequently, the consolidated revenue for the year under consideration reached Rs. 254.7 Mn, demonstrating a YoY growth of 9%, also supported by a noticeable increase in rentals.
Total investment property value of the group as at the end of the reporting period stood at Rs. 3.2 Bn. There were no notable changes observed in the investment property valuations for the year. Your Company, on consolidation, recorded a profit before tax of Rs. 156.7 Mn for the financial year 2016/17, which is a Rs. 522.7 Mn contraction in comparison with the corresponding year, mainly due to the gain on fair valuation of investment properties of Rs. 537.5 Mn recognised in the
financial year 2015/16. If the said gain in the previous year is excluded, the consolidated profit before tax of the group for the period under review shows an increase of 10%.
Likewise, for the year ended 31st March 2017, on a standalone basis, your company observed a 71% decline in its profit before tax to reach Rs. 116.8 Mn, due to the absence of gains from investment properties whereas Rs. 327.1 Mn gain was recognised in the previous financial year. Excluding the said gain, profit before tax of the Company increased by 51% mainly due to the increase in dividend income received during the period under review from its subsidiary, Equity Two PLC as further stated below. The year under consideration was the first year of operations where the subsidiary company, Equity Two PLC, received its full rent roll in cash terms since of the renovation and renting of the second building of its property portfolio, with the final settlement of rent in advance collected. The advance rent collected in 2013 was fully utilised to renovate the said building of Equity Two PLC. With this increase in operational cash flows, the subsidiary company, declared and paid a first interim dividend amounting to Rs. 43.4 Mn for the year ended 31st March 2017. Utilising the funds of the said dividend received, the Company too declared and paid an interim dividend of Rs. 0.75 per share for the year ended 31st March 2017. This is a significant 400% increase in comparison to the first and final dividend of Rs. 0.15 per share, proposed in the corresponding year.
To conclude, on behalf of the Board of Equity One Limited, I wish to express my sincere gratitude and appreciation to our valued shareholders who have placed their trust in the company and we assure that we will direct our best efforts towards realising the full potential of our business. I also appreciate our valued tenants, business affiliates, financiers, regulatory authorities and all other stakeholders for their continuous support throughout the year. I extend my appreciation to the members of the Audit Committee, Nomination Committee, Remuneration Committee and the Related Party Transactions Review Committee for their guidance during their tenure of service and to my colleagues on the Board for their precious inputs. I also wish to express our gratitude to all our employees, whose hard work and commitment have been central to our continuing success.
(Sgd.) D.C.R. GunawardenaChairman
Colombo15th May 2017

2 Equity One Limited | Annual Report 2016/2017
Business Review
MACRO OVERVIEWAs per the Central Bank data, Sri Lankan economy grew by 4.4% during 2016, while industrial activities expanded by 6.7% and the construction sector advanced by 14.9%. The Government increased key policy rates again by 25 basis points in March 2017 in the midst of growing inflationary pressure, after increasing the rates by 50 basis points each in the months of February and July 2016.
For the months ahead, the country seems to be carrying an exposure to an economic environment of rising interest rates where inflation is possibly controlled and maintained. This could present a challenging environment for the real estate sector of the country.
However, at present, the real estate industry is encountering swift growth with accelerated construction of residential and commercial developments throughout the Colombo city as well as the suburbs and gradually penetrating other regions. Adding to this would be the port city development with another hefty supply of commercial and residential developments. Healthy demand conditions witnessed over the years for both upper and middle class residential properties are heating up the activity levels in the residential real estate market which may reach saturation sooner rather than later.
Nonetheless, the commercial real estate market-space in the country seems to be portraying less saturated conditions to that of the residential property market and forecasts growth potential in the next 2 to 3 years. The current growing demand for high grade office space from expanding private business firms is currently met with supply shortage of such space.
Hopefully, the consequent demand drive would translate to increased property yields and appreciations in property values in the short term.
Yet the lack of long-term mortgage debt, tax concessions for housing, high borrowing rates as well as ever escalating construction costs remain as key constraints in the industry to date, which require in-depth consideration.
2010 2011 2012 2013 2014 2015 20160
1
2
3
4
5
6
7
8
CONSTRUCTION SECTOR SHARE OF GROSS VALUE ADDED AND GDP AT CONSTANT (2010) MARKET PRICES
Source : Based on the Central Bank Annual Report 2016
(%)
2010 2011 2012 2013 2014 2015 2016
AWPR
INTEREST RATE BEHAVIOUR (PER CENT PER ANNUM AT YEAR END)
AWFDR AWDR
Source : Central Bank of Sri Lanka
(%)
AWLR
0
2
4
6
8
10
12
14
16
18
2015 2016 2017
0
1
2
3
4
5
6
7
8
YEAR ON YEAR CCPI BEHAVIOUR
Source : Based on the Central Bank Annual Report 2016
(%)
Jan
Feb
Mar
Ap
rM
ay Jun
Jul
Au
gSe
pO
ctN
ov
Dec Jan
Feb
Mar
Ap
rM
ay J
un
Jul
Au
gSe
pO
ctN
ov
Dec Jan
Feb
Mar

3
AVERAGE OCCUPANCY DURING THE PERIOD - GROUP
FY 14/15 FY 15/16 FY 16/1770
75
80
85
90
95
100
(%)
46%41%
13%
AGE ANALYSIS OF TENANTS (FY 16/17)
> 8 Years 3 - 8 Years < 3 Years
OUR BUSINESSFinancial year 2017 was another year of good performance and progress across the Group. The properties of the Company registered an average occupancy of 94% in comparison to the average occupancy of 91% in the corresponding year. Aggregate average occupancy of the Group for the financial year ended 31st March 2017 averaged at 93%, with an increase of 3% against the occupancy of 90% recorded in the corresponding period. Nevertheless, the main concerning factor of the Group remain unchanged, being the Janadhipathi Mawatha properties. The iron fence barricading the properties alongside Janadhipathi Mawatha, continue to hinder the performance of the said properties to their full potential, by denying access through main entrance.
Overall, we have continued to place utmost significance on attracting high quality tenants, with whom we seek to establish long term, mutually beneficial relationships based on confidence, which will ultimately create a win-win situation for both parties and we are always committed to continuously maintain and improve our property in order to provide the best possible service, within our capacity, to our valued tenants.
FINANCIAL REVIEWGroup
Increased occupancy and rate revisions strengthened the rental income of the group to reach Rs. 254.7 Mn, with a year-on-year growth of 9%. Investment property values of the group did not reflect major changes during the year under consideration. Direct costs increased by 5% for the year under review to reach Rs. 72.2 Mn amid increased rates and taxes, insurance and repair and maintenance charges pertaining to
-6
-4
-2
0
2
4
6
8
10
12
REAL GDP (PERCENTAGE CHANGE)
Source : Based on the data from Department of Census & Statistics
(%)
2010 2011 2012 2013 2014 2015 2016
Agriculture Industry Services
the buildings and plant and machinery. Administrative and other operating expenses at Rs. 23.9 Mn show a marginal dip in comparison to the financial year 2015/16.
Equity One Limited saw a consolidated finance cost of Rs. 7.3 Mn in comparison to Rs. 4.1 Mn witnessed in the corresponding financial year, mainly due to Rs. 1.8 Mn interest expense on the short term loan obtained to fully settle the amounts due to parent Company, Carson Cumberbatch PLC. Unwinding of interest on refundable deposits also witnessed an increase of Rs. 1.5 Mn, as a result of the increase in refundable deposits during the year from new tenants.
Aforementioned reasons resulted in a profit before tax of Rs. 156.7 Mn and a profit after tax of Rs. 105.6 Mn, against a profit before tax and a profit after tax of Rs. 679.4 Mn and

4 Equity One Limited | Annual Report 2016/2017
Business Review
8%
13%16%
17%
46%
TENANT PROFILE BASED ON REVENUE (FY 16/17)
Management Services & BPO Operations
Communication
Banks
Wholesale & Retail
Others
Rs. 630.3 Mn respectively, registered in the corresponding financial year. Predominantly due to the full exhaustion of capital allowances during the financial year 2015/16, income tax expense of the subsidiary company Equity Two PLC increased significantly contributing to a notable increase in the consolidated income tax expense which amounted to Rs. 37.7 Mn for the year under review.
Eliminating the impact of the fair value gains on investment property valuations in the comparative year, the profit before tax of the Group recorded a YoY increase of 10%.
Company
On a standalone basis, the aforementioned increase in occupancy combined with upward revisions of rentals, drove the revenue up by 4% YoY, to reach Rs. 110.8 Mn.
The direct cost of the Company remained flat at Rs. 36.5 Mn whilst administrative and other operating expenses declined by 11% with the lower commission charges paid on new tenancies in comparison to the previous year. Finance Income of the company notably improved as a result of increased dividend income received from the subsidiary Equity Two PLC, to Rs. 54.2 Mn from Rs. 14.6 Mn in the corresponding period.
Excluding the gain on fair valuation of investment properties, the profit before tax of the company reflected a YoY increase of 51% to reach Rs. 116.8 Mn for the year under consideration mainly due to the aforementioned increase in dividend income received. Accordingly, Equity One Limited observed a standalone net profit of Rs. 97.8 Mn in comparison to Rs. 386.7 Mn reported in the financial year 15/16.
A key highlight of the year for the group, is the subsidiary company, Equity Two PLC receiving its full rent roll of the second building located at No. 55 Janadhipathi Mawatha from October 2016 in cash terms after fully settling the advance rent collected in 2013. The advance rent collected was used to finance the renovation of the said building at the time. This, along with the full settlement of company’s borrowings, notably strengthened the cash flow position of Equity Two PLC, where First Interim Dividend amounting to Rs. 43.4 Mn was declared and distributed during the year under review to its shareholders. Above dividend receipts predominantly facilitated the dividend payments of the parent, Equity One Limited, where it declared and paid a First Interim Dividend of Rs. 0.75 per share for the year, in comparison to Rs. 0.15 First and Final Dividend declared during the financial year 2015/16.
Future Outlook
In spite of the near overheating residential property market, Sri Lanka promises positive economic prospects. Properties of Equity One Limited are well placed in the heart of Colombo city to benefit from this growth. However, the effects of rising interest rates, curtailment of credit growth as well as the currency depreciation could exert pressure on the property market.
Carsons Management Services (Private) Limited
Managers
15th May 2017

5
Annual Report of the Board of Directors on the Affairs of the Company
The Board of Directors of Equity One Limited have pleasure in presenting to the Shareholders their Report together with the Audited Financial Statements for the year ended 31st March 2017.
The details set out herein provide the pertinent information required by the Companies Act No. 07 of 2007 and are guided by recommended best Accounting Practices.
The Annual Report was approved by the Board of Directors on 15th May 2017.
1. General Equity One Limited (the “Company”), a public limited
liability Company incorporated in Sri Lanka in 1981.
"Equity One PLC" was listed on the Colombo Stock Exchange and was delisted from the Colombo Stock Exchange on 2nd November 2016. Therefore, with effect from 26th December 2016 the name of the Company changed to "Equity One Limited".
2. The Principal Activities of the Company and its subsidiaries
The principal activities of the Company and its subsidiaries are letting of office and warehouse premises for commercial purpose.
There were no significant changes in nature of the principal activities of the Company and the Group during the financial year under review.
3. Business Review and Future Developments
The Chairman’s Statement and Business Review on pages 01 to 04 provide an overall assessment of the
business performance of the Company and the Group and its future developments.
These reports together with the audited consolidated financial statements reflect the state of affairs of the Company and the Group.
4. Financial Statements The consolidated financial statements which comprises
the statement of Profit or Loss and Other Comprehensive Income, Statement of Financial Position, Statement of Cash Flows, Statement of Changes in Equity and Notes to the financial statements of the Company and the Group for the year ended 31st March 2017 are set out on pages 13 to 49. These financial statements comply with the requirements of the Companies Act No 7 of 2007.
4.1. Revenue
The Group and the Company generated revenues of Rs. 254.7 mn and Rs. 110.8 mn (2016 - Rs.233.5 mn and Rs.106.5 mn), respectively. An analysis of the revenue for the year is given in note 11 to the financial statements.
4.2. Financial results and appropriations
An abridgement of the financial performance of the Company and the Group is presented in the table below:
4.3. Significant accounting policies
The accounting policies adopted in the preparation of these financial statements are given on pages 17 to 28.
(In Rupees thousands) Group Company
For the year ended 31st March 2017 2016 2017 2016
Profit for the year 105,629 630,328 97,809 386,656
Other comprehensive income / (expense) for the year 305 (28) 100 13
Total comprehensive income for the year 105,934 630,300 97,909 386,669
Accumulated loss as at the beginning of the year (119,477) (219,809) (295,213) (334,835)
Super Gain Tax for the year of assessment 2013/14 - (15,696) - (13,897)
Adjusted accumulated loss as at the beginning of the year (119,477) (235,505) (295,213) (348,732)
Accumulated loss before appropriations (13,543) 394,795 (197,304) 37,937
Transfer to fair value adjustment reserve - (488,803) - (327,102)
Profit attributable to non-controlling interest (6,357) (19,430) - -
Forfeited dividends - 9 - -
Dividends paid (36,290) (6,048) (36,290) (6,048)
Accumulated loss as at the end of the year (56,190) (119,477) (233,594) (295,213)

6 Equity One Limited | Annual Report 2016/2017
4.4. Investment properties
The Company and the Group has recognized the carrying value of investment property held to earn rental income and for capital appreciation in the Balance Sheet on ‘fair value’ in accordance with Sri Lanka Accounting Standards (LKAS 40) – ‘ Investment Property ’.
During the year, Director ’s valuation was carried out for the investment properties of the Company and the Group. Accordingly, in the opinion of the Directors no material change has occurred in the fair value of the investment properties compared to the previous year ’s professional valuation. The last professional valuation on the investment properties of the Company and the Group had been per formed by an independent professional valuer, Mr. S. Sivaskantha, F.I .V. (Sri Lanka) of Perera Sivaskantha & Company, Incorporated valuers, as at 31st March 2016 on the basis of Market Approach.
As at the year end, the carrying value of investment properties stood at Rs. 1,710.5 mn and Rs. 3,216.4 mn (2016 – Rs.1,706 mn and Rs. 3,211.5 mn) for the Company and the Group, respectively.
There were no significant changes in the investment properties of the Company and the Group during the year, other than the above. Details of the investment properties are given in note 17 to the financial statements.
4.5. Property, plant and equipment
Details of property, plant and equipment are given in note 18 to the financial statements. There were no significant changes in the property, plant and equipment since the last f inancial year.
4.6. Capital expenditure
The details of capital expenditure of the Company and the Group were as follows;
(In Sri Lankan Rupees Thousands) Group Company
For the year ended 31st March 2017 2016 2017 2016
Investment properties 4,896 22,705 4,520 19,787
Property, plant and equipment - 9,489 - 9,489
4.7. Reserves
As at 31st March 2017, the Group’s total reserves stood at Rs. 1,729 mn (2016 - Rs. 1,665.7 mn) comprising capital reserves of Rs. 13.2 mn (2016 - Rs. 13.2 mn) and revenue reserves of Rs. 1,715.7 mn (2016 - Rs. 1,652.4 mn).
The total reserves of the Company stood at Rs. 1,065.6 mn (2016 - Rs. 1,004 mn) comprising capital reserves of Rs. 13.2 mn (2016 - Rs. 13.2 mn) and revenue reserves of Rs. 1,052.4 mn (2016 - Rs. 990.8 mn) as at that date.
The movements are set out in the Statement of Changes in Equity and notes 23 and 24 to the financial statements.
5. Statement of Directors’ Responsibilities The responsibilities of the Directors, in relation to
the financial statements are detailed in the following paragraphs, whilst the responsibilities of the Auditors are set out in the Independent Auditors’ Report.
According to the Companies Act No. 07 of 2007 and the Sri Lanka Accounting and Auditing Standards Act No. 15 of 1995, Directors are required to prepare financial statements for each financial year, giving a true and fair view of the state of affairs of the Company as at the end of the financial year and of the performance for the said period.
Annual Report of the Board of Directors on the Affairs of the Company

7
The financial statements comprise of inter alia:
- a Statement of Financial Position, which presents a true and fair view of the state of affairs of the Company as at the end of the financial year.
- a Statement of Profit or Loss and Other Comprehensive Income of the Company, which presents a true and fair view of the Profit and Loss and Other Comprehensive Income of the Company for the financial year.
In preparing these financial statements, the Directors are required to ensure that:
- appropriate accounting policies have been selected and applied consistently, while material departures, if any, have been disclosed and explained;
- all applicable Accounting Standards have been complied with;
- reasonable and prudent judgments and estimates have been made;
- provides the information required by and otherwise comply with the Companies Act No. 07 of 2007; and
The Directors are responsible for ensuring that the Company and the Group maintains sufficient accounting records to disclose with reasonable accuracy, the financial position of the Company in order to ensure that its financial statements have been prepared and presented in accordance with Sri Lanka Accounting and Auditing Standards Act No. 15 of 1995 and meet with the requirements of the Companies Act No. 07 of 2007.
They are also responsible for taking reasonable measures to safeguard the assets of the Company and the Group and in this regard to give proper consideration to the establishment and effective operation of appropriate systems of internal control with a view to prevent, detect and rectify fraud and other irregularities.
These financial statements have been prepared on a going concern basis, since the Directors are of the view that the Company has adequate resources to continue in operation in the foreseeable future from the date of approving these financial statements. The Directors are also of the view that they have discharged their responsibilities as set out in this statement.
The Directors confirm that to the best of their knowledge,
� all taxes, duties and levies payable to the statutory bodies,
� all contributions, levies and taxes payable on behalf of and in respect of the employees and
� all other known statutory dues as were due and payable
by the Company as at the reporting date have been paid, or where relevant provided for in these financial statements.
6. Outstanding Litigation There are no litigations currently pending against
the Company.
7. Independent Auditors' Report The Independent Auditors' Report on the financial
statements is given on page 12 of this Annual Report.
8. Interests Register The Company maintains an Interests Register
conforming to the provisions of the Companies Act No. 07 of 2007. All Directors have made declarations as provided for in Section 192(2) of the Companies Act aforesaid.
The relevant details as required by the Companies Act No. 07 of 2007 have been entered in the Interests Register during the year under review.
The Interests Register is available for inspection as required under the Companies Act.
8.1 Remuneration of Directors
Directors’ remuneration for the financial year ended 31st March 2017 is given in note 13 to the financial statements.
8.2 Directors’ Interest in Contracts and
Shares
Directors' Interest in contracts of the Company are disclosed in note 32 to the financial statements and have been declared at Meetings of the Board of Directors. The Directors have had no direct or indirect interest in any other contracts or proposed contracts in relation to the business of the Company,
8 Equity One Limited | Annual Report 2016/2017
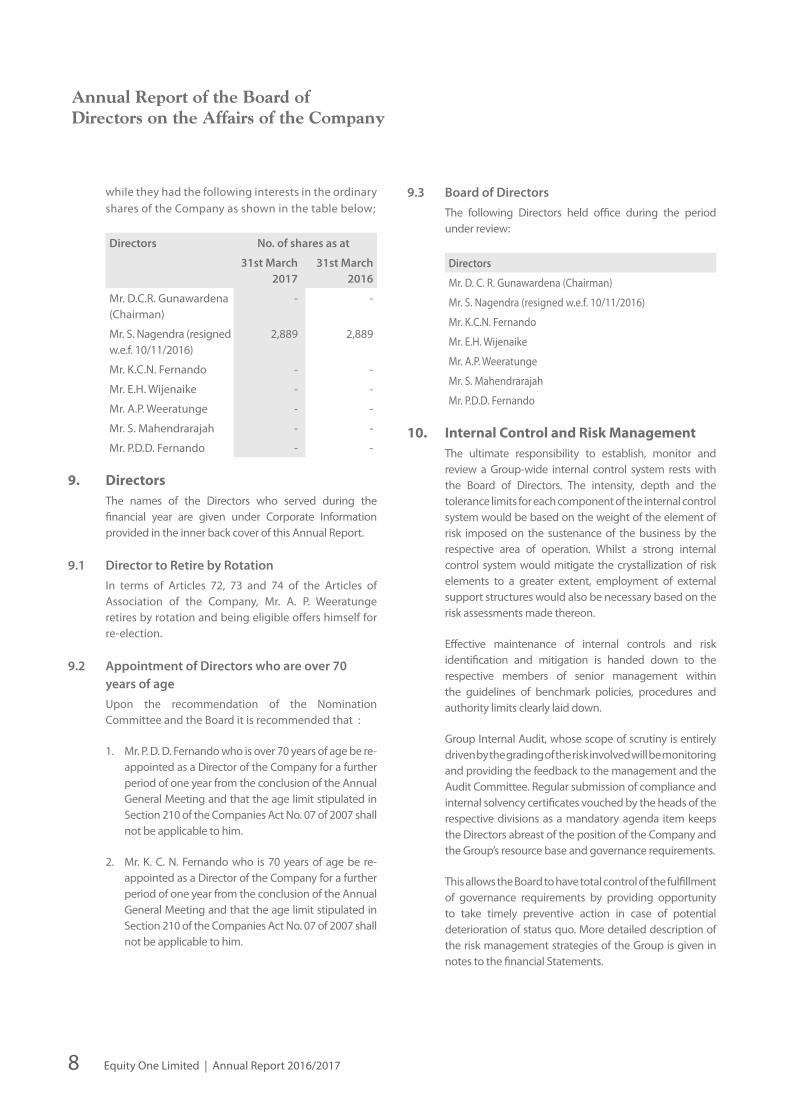
while they had the following interests in the ordinary shares of the Company as shown in the table below;
Directors No. of shares as at
31st March 2017
31st March2016
Mr. D.C.R. Gunawardena (Chairman)
- -
Mr. S. Nagendra (resigned w.e.f. 10/11/2016)
2,889 2,889
Mr. K.C.N. Fernando - -
Mr. E.H. Wijenaike - -
Mr. A.P. Weeratunge - -
Mr. S. Mahendrarajah - -
Mr. P.D.D. Fernando - -
9. Directors The names of the Directors who served during the
financial year are given under Corporate Information provided in the inner back cover of this Annual Report.
9.1 Director to Retire by Rotation
In terms of Articles 72, 73 and 74 of the Articles of Association of the Company, Mr. A. P. Weeratunge retires by rotation and being eligible offers himself for re-election.
9.2 Appointment of Directors who are over 70 years of age
Upon the recommendation of the Nomination Committee and the Board it is recommended that :
1. Mr. P. D. D. Fernando who is over 70 years of age be re-appointed as a Director of the Company for a further period of one year from the conclusion of the Annual General Meeting and that the age limit stipulated in Section 210 of the Companies Act No. 07 of 2007 shall not be applicable to him.
2. Mr. K. C. N. Fernando who is 70 years of age be re-appointed as a Director of the Company for a further period of one year from the conclusion of the Annual General Meeting and that the age limit stipulated in Section 210 of the Companies Act No. 07 of 2007 shall not be applicable to him.
9.3 Board of Directors
The following Directors held office during the period under review:
Directors
Mr. D. C. R. Gunawardena (Chairman)
Mr. S. Nagendra (resigned w.e.f. 10/11/2016)
Mr. K.C.N. Fernando
Mr. E.H. Wijenaike
Mr. A.P. Weeratunge
Mr. S. Mahendrarajah
Mr. P.D.D. Fernando
10. Internal Control and Risk Management The ultimate responsibility to establish, monitor and
review a Group-wide internal control system rests with the Board of Directors. The intensity, depth and the tolerance limits for each component of the internal control system would be based on the weight of the element of risk imposed on the sustenance of the business by the respective area of operation. Whilst a strong internal control system would mitigate the crystallization of risk elements to a greater extent, employment of external support structures would also be necessary based on the risk assessments made thereon.
Effective maintenance of internal controls and risk identification and mitigation is handed down to the respective members of senior management within the guidelines of benchmark policies, procedures and authority limits clearly laid down.
Group Internal Audit, whose scope of scrutiny is entirely driven by the grading of the risk involved will be monitoring and providing the feedback to the management and the Audit Committee. Regular submission of compliance and internal solvency certificates vouched by the heads of the respective divisions as a mandatory agenda item keeps the Directors abreast of the position of the Company and the Group’s resource base and governance requirements.
This allows the Board to have total control of the fulfillment of governance requirements by providing opportunity to take timely preventive action in case of potential deterioration of status quo. More detailed description of the risk management strategies of the Group is given in notes to the financial Statements.
Annual Report of the Board of Directors on the Affairs of the Company

9
11. Independent Auditors Company’s Auditors during the year under review were
Messrs. KPMG, Chartered Accountants.
A sum of Rs. 300,000/- and Rs. 565,000/- (2016 - Rs. 300,000/- and Rs. 565,000/-) paid to them by the Company and the Group respectively, as audit fees for the year ended 31st March 2017. In addition to the above, the auditors were paid Rs. 149,000/- and Rs. 299,000/- (2016 – Rs. 53,000/- and Rs. 106,000/-) as professional fees for audit related services for the Company and the Group, respectively.
The retiring auditors have expressed their willingness to continue in office. A resolution to re-appoint them as Independent Auditors of the Company and authorizing the Directors to fix their remuneration will be proposed at the forthcoming Annual General Meeting.
The Audit Committee reviewed the appointment of the auditors, its effectiveness and their relationship with the Company and its subsidiaries, including the level of audit and non-audit fees paid to the auditors.
12. Auditors’ relationship or any interest with the Company
The Directors are satisfied that, based on written representations made by the independent auditors to the Board, the auditors do not have any interest with the Company and its subsidiaries that would impair their independence.
13. Significant Events During the Year
13.1. Company
De-Listing of the Company "Equity One PLC" was listed on the Colombo Stock
Exchange and subsequent to obtaining shareholder approval was delisted from the Colombo Stock Exchange on 2nd November 2016. Following the delisting the status of the Company changed from being a Public Quoted Company to a Public Unquoted Company and therefore, with effect from 26th December 2016 the name of the Company changed to "Equity One Limited".
13.2 Subsidiaries
There were no significant events for the subsidiaries during the year.
14. Human Resources The Company and the Group continued to invest in
human capital development and implement effective human resource practices and policies to develop and build an efficient and effective workforce aligned to it’s business priorities and to ensure that its employees are developing the skills and knowledge required for future success of the Company and the Group.
The number of persons employed by the Company and the Group as at 31st March 2017 were 12 and 17 (2016 - 12 and 18) respectively.
15. Equitable treatment to Shareholders The Company endeavors at all times to ensure
equitable treatment to all shareholders.
16. Environmental Protection The Company and the Group is sensitive to the needs of
the environment and makes every endeavor to comply with the relevant environmental laws, regulations and best practices applicable in the country. After making adequate inquiries from the management, the Directors are satisfied that the Company and its subsidiaries operates in a manner that minimizes the detrimental effects on the environment and provides services that have a beneficial effect on the customers and the communities within which the Company and its subsidiaries operate.
17. Dividend The Company paid a First & Final Dividend of 15 cents
per ordinary share for the year ended 31st March 2016 amounting to Rs. 6,048,259/50 on 8th August 2016.
The Company also paid a First Interim Dividend of 75 cents per ordinary share for the year ending 31st March 2017 amounting to Rs.30,241,297/50 on 31st March 2017.
The details of the dividends are set out in note 33 to the financial statements.
18. Solvency Test Taking into account the said distributions, the Directors
were satisfied that the Company would meet the Solvency Test requirement under Section 56(2) of the Companies Act No. 07 of 2007 immediately after the distributions.

10 Equity One Limited | Annual Report 2016/2017
Annual Report of the Board of Directors on the Affairs of the Company
The Company’s Auditors, Messrs. KPMG, Chartered Accountants have issued Certificates of Solvency for the dividends mentioned above confirming same.
19. Stated Capital The stated capital of the Company as at 31st March 2017
was Rs. 1,085.6 mn consisting of 40,321,730 ordinary shares. There was no change in the stated capital of the Company during the year.
20. Material Issues pertaining to Employees and Industrial Relations
There were no material issues relating to employees and industrial relations during the year ended 31st March 2017.
21. Statutory Payments The Directors to the best of their knowledge and belief
are satisfied that all statutory payments have been paid up to date or have been provided for in these financial statements.
22. Going Concern The Board of Directors is satisfied that the Company
has adequate resources to continue its operations in the foreseeable future. Accordingly, these financial statements are prepared based on the going concern concept.
23. Events after the Reporting Date Subsequent to the reporting date, no circumstances
have arisen, which would require adjustments to or disclosures in the financial statements.
24. Contingent Liabilities and Capital Commitment
The contingent liabilities and capital commitments made on account of capital expenditure as at 31st March 2017 are given in note 30 to the financial statements, if any.
25. Corporate Donations There were no donations granted during the year.
26. Annual Report The Board of Directors have approved the Audited
consolidated financial statements of the Company, together with the Reviews and other Reports which form part of the Annual Report on 15th May 2017. The Annual Report would be submitted to the Sri Lanka Accounting and Auditing Standards Monitoring Board and the Registrar General of Companies within the given time frames.
27. Annual General Meeting The 35th Annual General Meeting of the Company will be
held on Friday, the 16th day of June 2017 at 2.30 p.m. at the 8th Floor, No. 65C, Dharmapala Mawatha, Colombo 7, Sri Lanka.
The Notice of the Annual General Meeting, setting out the business which will be transacted thereat is on page 51 of the Annual Report.
Signed on behalf of the Board,
(Sgd.)D. C. R. GunawardenaChairman
(Sgd.)K. C. N. FernandoDirector
(Sgd.)K. D. De Silva (Mrs.)DirectorCarsons Management Services (Private) LimitedSecretaries
Colombo15th May 2017

11
FINANCIAL CALENDAR
Financial year end 31st March 2017
35th Annual General Meeting 16th June 2017
Financial Calendar

12 Equity One Limited | Annual Report 2016/2017
Independent Auditors' Report
TO THE SHAREHOLDERS OF EQUITY ONE LIMITED
Report on the Financial StatementsWe have audited the accompanying financial statements of Equity One Limited (“the Company”) and the consolidated financial statements of the Company and its subsidiaries (“the Group”), which comprise the statement of financial position as at March 31, 2017, the statement of profit or loss and other comprehensive income, statement of changes in equity and cash flow statement for the year then ended, and a summary of significant accounting policies and other explanatory information as set out on pages 13 to 49.
Board’s Responsibility for the Financial StatementsThe Board of Directors (“Board”) is responsible for the preparation of these financial statements that give a true and fair view in accordance with Sri Lanka Accounting Standards, and for such internal control as Board determines is necessary to enable the preparation of financial statements that are free from material misstatement, whether due to fraud or error.
Auditors’ ResponsibilityOur responsibility is to express an opinion on these financial statements based on our audit. We conducted our audit in accordance with Sri Lanka Auditing Standards. Those standards require that we comply with ethical requirements and plan and perform the audit to obtain reasonable assurance about whether the financial statements are free from material misstatement.
An audit involves performing procedures to obtain audit evidence about the amounts and disclosures in the financial statements. The procedures selected depend on the auditors’ judgment, including the assessment of the risks of material misstatement of the financial statements, whether due to fraud or error. In making those risk assessments, the auditor considers internal control relevant to the entity’s preparation of the financial statements that give a true and fair view in order to design audit procedures that are appropriate in the circumstances, but not for the purpose of expressing an opinion on the effectiveness of the entity’s internal control. An audit also includes evaluating the appropriateness of accounting policies used and the reasonableness of
accounting estimates made by Board, as well as evaluating the overall presentation of the financial statements.
We believe that the audit evidence we have obtained is sufficient and appropriate to provide a basis for our audit opinion.
OpinionIn our opinion, the consolidated financial statements give a true and fair view of the financial position of the Group as at March 31, 2017, and of its financial performance and cash flows for the year then ended in accordance with Sri Lanka Accounting Standards.
Report on Other Legal and Regulatory RequirementsAs required by section 163 (2) of the Companies Act No. 07 of 2007, we state the following:
a) The basis of opinion and scope and limitations of the audit are as stated above.
b) In our opinion:
• we have obtained all the information and explanations that were required for the audit and, as far as appears from our examination, proper accounting records have been kept by the Company,
• The financial statements of the Company give a true and fair view of its financial position as at March 31, 2017, and of its financial performance and cash flows for the year then ended in accordance with Sri Lanka Accounting Standards.
• The financial statements of the Company, and the Group comply with the requirements of sections 151 and 153 of the Companies Act No.07 of 2007.
CHARTERED ACCOUNTANTSColombo15th May 2017.

13
Statement of Profit or Loss and other Comprehensive Income
Group Company
For the year ended 31st March Note 2017 2016 2017 2016
Revenue 11 254,744 233,510 110,772 106,481
Direct costs (72,227) (68,734) (36,527) (36,862) 182,517 164,776 74,245 69,619
Other income 12 4,098 4,258 2,560 3,713 Net gain arising from changes in fair value of investment properties 17 - 537,498 - 327,102
186,615 706,532 76,805 400,434 Administrative and other operating expenses (23,904) (24,284) (11,411) (12,831)Results from operating activities 13 162,711 682,248 65,394 387,603
Finance income 14 1,320 1,261 55,372 18,010 Finance costs 14 (7,357) (4,138) (3,972) (1,336)Net finance income/ (costs) (6,037) (2,877) 51,400 16,674
Profit before taxation 156,674 679,371 116,794 404,277 Income tax expense 15 (37,731) (21,897) (15,953) (13,860)Deferred taxation 15 (13,314) (27,146) (3,032) (3,761)Profit for the year 105,629 630,328 97,809 386,656
Profit for the year attributable to:Equity holders of the parent 99,295 610,893 - - Non controlling interest 6,334 19,435 - -
105,629 630,328 - -
Other comprehensive incomeActuarial (loss) / gain from valuation of employee benefits 27.3 423 (28) 139 13 Related tax (118) - (39) - Other comprehensive income / (expense) for the year 305 (28) 100 13
Total comprehensive income for the year 105,934 630,300 97,909 386,669
Total comprehensive income attributable to:Equity holders of the parent 99,577 610,870 97,909 386,669 Non controlling interest 6,357 19,430 - -
105,934 630,300 97,909 386,669
Earnings per share (Rs.) 16 2.46 15.15 2.43 9.59
The notes from pages 17 to 49 form an integral part of these financial statements.
Figures in brackets indicate deductions.
(All figures are in Sri Lankan Rupees thousands)

14 Equity One Limited | Annual Report 2016/2017
Statement of Financial Position(All figures are in Sri Lankan Rupees thousands)
Group Company
As at 31st March Note 2017 2016 2017 2016
ASSETSNon-current assetsInvestment properties 17 3,216,396 3,211,500 1,710,524 1,706,004 Property, plant and equipment 18 5,410 7,458 5,410 7,458 Investment in subsidiaries 19 - - 552,048 552,048 Total non-current assets 3,221,806 3,218,958 2,267,982 2,265,510 Current assetsTrade and other receivables 20 33,895 29,001 4,663 24,870 Cash and cash equivalents 21 11,985 10,539 5,988 3,181 Total current assets 45,880 39,540 10,651 28,051 Total assets 3,267,686 3,258,498 2,278,633 2,293,561
EQUITY AND LIABILITIESEquityStated capital 22 1,085,584 1,085,584 1,085,584 1,085,584 Capital reserves 23 13,236 13,236 13,236 13,236 Revenue reserves 24 1,715,734 1,652,447 1,052,404 990,785 Total equity attributable to equity holders of the parent 2,814,554 2,751,267 2,151,224 2,089,605 Non controlling interest 112,505 111,141 - - Total equity 2,927,059 2,862,408 2,151,224 2,089,605 Non-current liabilitiesRefundable rental deposits 25 77,607 63,662 30,529 26,609 Deferred tax liability 26 192,919 179,487 59,668 56,597 Employee benefits 27 3,505 4,267 2,172 1,974 Total non-current liabilities 274,031 247,416 92,369 85,180 Current liabilitiesTrade and other payables 28 42,332 131,784 28,045 113,961 Deferred revenue 29 7,579 11,242 1,214 2,873 Current tax liabilities 16,685 5,648 5,781 1,942 Total current liabilities 66,596 148,674 35,040 118,776 Total liabilities 340,627 396,090 127,409 203,956 Total equity and liabilities 3,267,686 3,258,498 2,278,633 2,293,561
Net assets per share (Rs.) 69.80 68.23 53.35 51.82
The Notes from pages 17 to 49 form an integral part of these financial statements. I certify that these financial statements are in compliance with the requirements of Companies Act No. 7 of 2007.
(Sgd.) V. R. Wijesinghe Financial Controller Carsons Management Services (Private) Limited
The Board of Directors is responsible for the preparation and presentation of these financial statements. These financial statements were approved by the Board on 15th May 2017.
Approved and signed on behalf of the Managers, Approved and signed on behalf of the Board,
(Sgd.) (Sgd.) (Sgd.)A. P. Weeratunge D. C. R. Gunawardena K. C. N. FernandoDirector Chairman DirectorCarsons Management Services (Private) Limited Colombo 15th May 2017

15
Statement of Changes in EquitySt
ated
ca
pita
lCa
pita
l res
erve
sRe
venu
e re
serv
esTo
tal e
quity
at
trib
utab
le
to e
quity
ho
lder
s of
the
pare
nt
Non
co
ntro
lling
in
tere
st
Tota
l equ
ity
Capi
tal
accr
etio
n re
serv
e
Mac
hine
ry
repl
acem
ent
rese
rve
Oth
er ca
pita
l re
serv
esG
ener
al
rese
rve
Fair
valu
e ad
just
men
t re
serv
e
Accu
mul
ated
lo
ss
Gro
upBa
lanc
e as
at 1
st A
pril 2
015
1,0
85,5
84
158
5
,109
7
,969
3
9 1
,283
,082
(2
19,8
09)
2,1
62,1
32
92,
348
2,2
54,4
80
Supe
r Gain
Tax f
or th
e yea
r of A
sses
smen
t 201
3/14
* -
-
-
-
-
-
(1
5,69
6) (1
5,69
6) (1
4) (1
5,71
0)Ad
just
ed b
alan
ce a
s at
1st
Apr
il 20
15 1
,085
,584
1
58
5,1
09
7,9
69
39
1,2
83,0
82
(235
,505
) 2
,146
,436
9
2,33
4 2
,238
,770
Pr
ofit f
or th
e ye
ar -
-
-
-
-
-
6
10,8
93
610
,893
1
9,43
5 6
30,3
28
Oth
er c
ompr
ehen
sive
exp
ense
for t
he y
ear
-
-
-
-
-
-
(23)
(23)
(5)
(28)
Tota
l com
preh
ensi
ve in
com
e fo
r the
yea
r -
-
-
-
-
-
6
10,8
70
610
,870
1
9,43
0 6
30,3
00
Tran
sfer
s -
-
-
-
-
4
88,8
03
(488
,803
) -
-
-
Fo
rfei
ted
divi
dend
s -
-
-
-
-
-
9
9
1
1
0 Fi
rst &
fina
l div
iden
d 20
14/1
5 -
-
-
-
-
-
(6
,048
) (6
,048
) (6
24)
(6,6
72)
Bal
ance
as
at 3
1st M
arch
201
6 1
,085
,584
1
58
5,1
09
7,9
69
39
1,7
71,8
85
(119
,477
) 2
,751
,267
1
11,1
41
2,8
62,4
08
Bala
nce
as a
t 1st
Apr
il 20
16 1
,085
,584
1
58
5,1
09
7,9
69
39
1,7
71,8
85
(119
,477
) 2
,751
,267
1
11,1
41
2,8
62,4
08
Profi
t for
the
year
-
-
-
-
-
-
99,
295
99,
295
6,3
34
105
,629
O
ther
com
preh
ensi
ve in
com
e fo
r the
yea
r -
-
-
-
-
-
2
82
282
2
3 3
05
Tota
l com
preh
ensi
ve in
com
e fo
r the
yea
r -
-
-
-
-
-
9
9,57
7 9
9,57
7 6
,357
1
05,9
34
Tran
sfer
s -
-
-
-
-
-
-
-
-
-
Fi
rst &
fina
l div
iden
d 20
15/1
6 -
-
-
-
-
-
(6
,048
) (6
,048
) (6
24)
(6,6
72)
Firs
t int
erim
div
iden
d 20
16/1
7 -
-
-
-
-
-
(3
0,24
2) (3
0,24
2) (4
,369
) (3
4,61
1)B
alan
ce a
s at
31s
t Mar
ch 2
017
1,0
85,5
84
158
5
,109
7
,969
3
9 1
,771
,885
(5
6,19
0) 2
,814
,554
1
12,5
05
2,9
27,0
59
Stat
ed
capi
tal
Capi
tal r
eser
ves
Reve
nue
rese
rves
Tota
l equ
ity
Capi
tal
accr
etio
n re
serv
e
Mac
hine
ry
repl
acem
ent
rese
rve
Oth
er ca
pita
l re
serv
esG
ener
al
rese
rve
Fair
valu
e ad
just
men
t re
serv
e
Accu
mul
ated
lo
ss
Com
pan
yBa
lanc
e as
at 1
st A
pril
2015
1,0
85,5
84
158
5
,109
7
,969
3
9 9
58,8
57
(334
,835
) 1
,722
,881
Su
per G
ain
Tax f
or th
e ye
ar o
f Ass
essm
ent 2
013/
14 *
-
-
-
-
-
-
(13,
897)
(13,
897)
Adju
sted
bal
ance
as
at 1
st A
pril
2015
1,0
85,5
84
158
5
,109
7
,969
3
9 9
58,8
57
(348
,732
) 1
,708
,984
Pr
ofit f
or th
e ye
ar -
-
-
-
-
-
3
86,6
56
386
,656
O
ther
com
preh
ensi
ve in
com
e fo
r the
yea
r -
-
-
-
-
-
1
3 1
3 To
tal c
ompr
ehen
sive
inco
me
for t
he y
ear
-
-
-
-
-
-
386
,669
3
86,6
69
Tran
sfer
s -
-
-
-
-
3
27,1
02
(327
,102
) -
Fi
rst &
fina
l div
iden
d 20
14/1
5 -
-
-
-
-
-
(6
,048
) (6
,048
)B
alan
ce a
s at
31s
t Mar
ch 2
016
1,0
85,5
84
158
5
,109
7
,969
3
9 1
,285
,959
(2
95,2
13)
2,0
89,6
05
Bala
nce
as a
t 1st
Apr
il 20
16 1
,085
,584
1
58
5,1
09
7,9
69
39
1,2
85,9
59
(295
,213
) 2
,089
,605
Pr
ofit f
or th
e yea
r -
-
-
-
-
-
9
7,80
9 9
7,80
9 O
ther
com
preh
ensi
ve in
com
e fo
r the
yea
r -
-
-
-
-
-
1
00
100
To
tal c
ompr
ehen
sive
inco
me
for t
he y
ear
-
-
-
-
-
-
97,
909
97,
909
Firs
t & fi
nal d
ivid
end
2015
/16
-
-
-
-
-
-
(6,0
48)
(6,0
48)
Firs
t int
erim
div
iden
d 20
16/1
7 -
-
-
-
-
-
(3
0,24
2) (3
0,24
2)B
alan
ce a
s at
31s
t Mar
ch 2
017
1,0
85,5
84
158
5
,109
7
,969
3
9 1
,285
,959
(2
33,5
94)
2,1
51,2
24
* A
s pe
r the
pro
visi
ons
of P
art I
II of
the
Fina
nce
Act,
No.
10
of 2
015,
alth
ough
Equ
ity O
ne L
imite
d, th
e Co
mpa
ny, a
nd it
's su
bsid
iarie
s di
d no
t bec
ome
liabl
e to
pay
sup
er g
ain
tax
as st
and-
alon
e en
titie
s, ho
wev
er th
e Co
mpa
ny a
nd E
quity
One
Lim
ited
grou
p pa
id R
s. 13
.9m
n an
d Rs
. 15.
7mn
resp
ectiv
ely
as su
per g
ain
tax
on th
e ba
sis t
hat t
he C
ompa
nies
are
pa
rt o
f the
Buk
it D
arah
PLC
gro
up, o
f whi
ch th
e co
nsol
idat
ed p
rofit
bef
ore
tax
exce
eded
the
thre
shol
d as
stip
ulat
ed in
the
afor
esai
d Ac
t. Ac
cord
ing
to th
e Ac
t, th
e su
per g
ain
tax
shal
l be
deem
ed to
be
an e
xpen
ditu
re in
the
finan
cial
sta
tem
ents
rela
ting
to th
e ye
ar o
f ass
essm
ent w
hich
com
men
ced
on 1
st A
pril
2013
. The
Act
sup
erse
des
the
requ
irem
ents
of
the
Sri
Lank
a Ac
coun
ting
Stan
dard
s an
d he
nce
the
expe
nse
of s
uper
gai
n ta
x is
acc
ount
ed in
acc
orda
nce
with
the
req
uire
men
ts o
f the
sai
d Ac
t as
rec
omm
ende
d by
the
St
atem
ent o
f Alte
rnat
ive
Trea
tmen
t (So
AT) o
n Ac
coun
ting
for s
uper
gai
n ta
x is
sued
by
the
Inst
itute
of C
hart
ered
Acc
ount
ants
of S
ri La
nka,
dat
ed 2
4th
Nov
embe
r 201
5.
The
note
s fr
om p
ages
17
to 4
9 fo
rm a
n in
tegr
al p
art o
f the
se fi
nanc
ial s
tate
men
ts.
Figu
res
in b
rack
ets
indi
cate
ded
uctio
ns.
(All figures are in Sri Lankan Rupees thousands)

16 Equity One Limited | Annual Report 2016/2017
Statement of Cash Flow
Group Company
For the year ended 31st March Note 2017 2016 2017 2016
Cash flows from operating activitiesProfit before taxation 156,674 679,371 116,794 404,277 Adjustments for:Finance costs 14 7,357 4,138 3,972 1,336 Interest income 14 (1,320) (1,261) (1,145) (3,334)Dividend income 14 - - (54,227) (14,676)Net gains arising from changes in fair value of investment properties - (537,498) - (327,102)Profit on disposal of property, plant and equipment 12 - (788) - (788)Depreciation on property, plant and equipment 18 2,048 2,741 2,048 2,741 Amortization of deferred revenue 29 (5,587) (3,665) (2,179) (1,334)Provision for employee benefits 27 674 769 337 451 Operating profit before working capital changes 159,846 143,807 65,600 61,571 (Increase) / decrease in trade and other receivables (4,894) (7,168) 4,350 (3,979)Increase / (decrease) in trade and other payables (8,800) (46,689) (2,744) (10,723)Operating profit after working capital changes 146,152 89,950 67,206 46,869 Rental deposits received 25 14,328 19,140 6,284 10,924 Rental deposits refunded 25 (4,059) (9,556) (4,059) (4,978)Cash generated from operations 156,421 99,534 69,431 52,815 Income tax paid (26,694) (38,881) (12,114) (30,584)Employee benefits paid 27 (1,013) (1,767) - (1,767)Net cash generated from operating activities 128,714 58,886 57,317 20,464
Cash flows from investing activitiesAdditions to the investment properties 17 (4,896) (22,705) (4,520) (19,787)Purchase of property, plant and equipment 18 - (9,489) - (9,489)Net proceeds on sale of property, plant and equipment - 788 - 788 Settlement from amount due from related companies - - 15,857 33,325 Interest received 1,320 1,261 1,145 3,334 Dividends received - - 54,227 14,676 Net cash generated from / (used in) investing activities (3,576) (30,145) 66,709 22,847
Cash flows from financing activitiesAmounts settled on amounts due to related companies (80,674) (40,500) (83,174) (44,512)Short term loan interest expenses paid (1,757) - (1,757) - Dividend paid (41,261) (6,640) (36,288) (6,046)Net cash (used in) / generated from financing activities (123,692) (47,140) (121,219) (50,558)
Net increase / (decrease) in cash and cash equivalents 1,446 (18,399) 2,807 (7,247)Cash and cash equivalents at the beginning of the year 10,539 28,938 3,181 10,428 Cash and cash equivalents at the end of the year 21 11,985 10,539 5,988 3,181
The notes from pages 17 to 49 form an integral part of these financial statements. Figures in brackets indicate deductions.
(All figures are in Sri Lankan Rupees thousands)

17
1. Reporting Entity Equity One Limited is a limited liability Company
which is incorporated and domiciled in Sri Lanka.
The registered office and the principal place of business of the Company is located at No. 61 Janadhipathi Mawatha, Colombo 1 and No. 65C Dharmapala Mawatha, Colombo 7 respectively.
The consolidated financial statements as at and for the year ended 31st March 2017 comprise of financial information of the Company and its subsidiaries (together referred to as the ‘Group’ and individually as ‘Group entities’).
The business activities of the Company and the Group are focused on the real estate sector providing office and warehouse premises on rental. There were no significant change to the nature of the principal activities of the Company and the Group during the financial year under review.
A list of subsidiaries is set out in note 19 to the financial statements. Out of the two subsidiaries, Equity Two PLC is listed on the Colombo Stock Exchange.
The Group had 17 (2016 – 18) employees at the end of the financial year. The Company had 12 (2016 – 12) employees as at the reporting date.
2. Basis of Preparation
a) Statement of compliance The financial statements of the Company and the
Group comprise the statement of financial position, statement of profit or loss and other comprehensive income, statement of changes in equity and statement of cash flows together with the notes to the financial statements.
The consolidated financial statements have been prepared in accordance with Sri Lanka Accounting Standards (LKAS / SLFRS) laid down by the Institute of Chartered Accountants of Sri Lanka and the requirements of the Companies Act, No. 7 of 2007.
These consolidated financial statements were authorized for issue by the Board of Directors on 15th May 2017.
b) Basis of measurement The consolidated financial statements have been
prepared on the historical cost basis and applied consistently with no adjustments being made for inflationary factors affecting the financial statements, except for the following material items in the statement of financial position;
� Non-derivative financial instruments classified as “Loans and receivables” and “Other financial liabilities” measured at amortised cost;
�Investment properties are measured at fair value;
�Defined benefit obligations are measured at its present value, based on an actuarial valuation as explained in note 27.
These financial statements have been prepared on the basis that the Company and the Group would continue as a going concern for the foreseeable future.
c) Functional and presentation currency Items included in the financial statements of each of
the Group’s entities are measured using the currency of the primary economic environment in which the entities operate (‘the functional currency’). The consolidated financial statements are presented in Sri Lankan Rupees, which is the Company’s functional and presentation currency.
d) Use of estimates and judgments The preparation of the consolidated financial
statements in conformity with LKAS/SLFRS requires management to make judgments, estimates and assumptions that affect the application of accounting policies and the reported amounts of assets, liabilities, income and expenses. Actual results may differ from these estimates.
Estimates and underlying assumptions are reviewed on an ongoing basis. Revisions to accounting estimates are recognised in the period in which the estimates are revised and in any future periods affected.
Information about critical judgments in applying accounting policies that have the most significant effect on the amounts recognised in the consolidated financial statements are included in the following notes;
Notes to the Financial Statements(All figures are in Sri Lankan Rupees thousands)

18 Equity One Limited | Annual Report 2016/2017
�Determination of owner-occupied properties and investment properties
In determining whether a property qualifies as investment property the Company makes a judgment whether the property generates independent cash flows rather than cash flows that are attributable not only to the property but also to the other assets. Judgment is also applied in determining if ancillary services provided are significant, so that a property does not qualify as an investment property.
Information about assumptions and estimation uncertainties that have a significant risk of resulting in a material adjustment within the next financial year are included in the following notes:
�Assessment of Impairment - Key assumptions used in discounted cash flow projections.
The Company and Group assesses at each reporting date whether there is objective evidence that an asset or portfolio of assets is impaired. The recoverable amount of an asset or Cash Generating unit (CGU) is the greater of its value in use and its fair value less costs to sell. In assessing value in use, the estimated future cash flows are discounted to present value using appropriate discount rates that reflects the current market assessments of the time value of money and risks specific to the asset.
�Deferred taxation - utilization of tax losses
Deferred tax assets are recognized for all unused tax losses to the extent that it is probable that taxable profit will be available against which the losses can be utilized. Management judgment is required to determine the amount of deferred tax assets that can be recognized, based upon the level of future taxable profits together with future tax planning strategies.
�Defined benefit plans The assessment of the liability of defined benefit
obligations involves a significant element of assumptions; including discount rates, future salary increases, mortality rates and future pension increases and due to the long-term nature of these plans, such estimates are subject to uncertainty.
�Current tax liabilities Current tax liabilities are provided for in the financial
statements applying the relevant tax statutes and regulations which the management believes reflect the actual liability. There can be instances where the stand
taken by the Company and Group on transactions is contested by revenue authorities. Any additional costs on account of these issues are accounted for as a tax expense at the point the liability is confirmed on any group entity.
e) Measurement of fair values A number of the Group’s accounting policies and
disclosures require the measurement of fair values, for both financial and non- financial assets and liabilities.
Group regularly reviews significant unobservable inputs and valuation adjustments. If third party information is used to measure fair values, Group assesses the evidence obtained from the third parties to support the conclusion that such valuations meet the requirements of SLFRS, including the level in the fair value hierarchy in which such valuations should be classified.
Significant valuation issues are reported to the Group’s Audit Committee.
When measuring the fair value of an asset or a liability, the Group uses observable market data as far as possible. Fair values are categorised into different levels in a fair value hierarchy based on the inputs used in the valuation techniques as follows.
Level 1: quoted prices (unadjusted) in active markets for identical assets or liabilities.
Level 2: inputs other than quoted prices included in Level 1 that are observable for the asset or liability, either directly (i.e. as prices) or indirectly (i.e. derived from prices).
Level 3: inputs for the asset or liability that are not based on observable market data.(Unobservable inputs).
If the inputs used to measure the fair value of an asset or a liability fall into different levels of the fair value hierarchy, then the fair value measurement is categorised in its entirety in the same level of the fair value hierarchy as the lowest level input that is significant to the entire measurement.
The group recognises transfers between levels of the fair value hierarchy at the end of the reporting period during which the change has occurred.
(All figures are in Sri Lankan Rupees thousands)Notes to the Financial Statements

19
� Property, plant and equipment The fair value of property, plant and equipment
recognised as a result of a business combination is the estimated amount for which property could be exchanged on the acquisition date between a willing buyer and a willing seller in an arm’s length transaction after proper marketing wherein the parties had each acted knowledgeably. The fair value of items of plant, equipment, fixtures and fittings is based on the market approach and cost approaches using quoted market prices for similar items when available and depreciated replacement cost when appropriate. Depreciated replacement cost reflects adjustments for physical deterioration as well as functional and economic obsolescence.
� Investment property An external, independent valuer having appropriate
recognised professional qualifications and recent experience in the location and category of property being valued, values the Company’s and the Group’s. The fair values are based on market values, being the estimated amount for which a property could be exchanged on the date of the valuation between a willing buyer and a willing seller in an arm’s length transaction after proper marketing wherein the parties had each acted knowledgeably.
In the absence of current prices in an active market, the valuations are prepared by considering the estimated rental value of the property. A market yield is applied to the estimated rental value to arrive at the gross property valuation. When actual rents differ materially from the estimated rental value, adjustments are made to reflect actual rents.
Valuations reflect, when appropriate, the type of tenants actually in occupation or responsible for meeting lease commitments or likely to be in occupation after letting vacant accommodation, the allocation of maintenance and insurance responsibilities between the Company and the Group and the lessee, and the remaining economic life of the property. When rent reviews or lease renewals are pending with anticipated reversionary increases, it is assumed that all notices, and when appropriate counter-notices, have been served validly and within the appropriate time.
Investment property under construction is valued by estimating the fair value of the completed investment property and then deducting from that amount the
estimated costs to complete construction, financing costs and a reasonable profit margin.
� Trade and other receivables The fair values of trade and other receivables,
excluding construction work in progress, are estimated at the present value of future cash flows, discounted at the market rate of interest at the measurement date. Short-term receivables with no stated interest rate are measured at the original invoice amount if the effect of discounting is immaterial. Fair value is determined at initial recognition and, for disclosure purposes, at each annual reporting date.
� Other non-derivative financial liabilities Other non-derivative financial liabilities are measured
at fair value, at initial recognition and for disclosure purposes, at each reporting date. Fair value is calculated based on the present value of future principal and interest cash flows, discounted at the market rate of interest at the measurement date.
For finance leases, the market rate of interest is determined with reference to similar lease agreements
� Contingent consideration The fair value of contingent consideration arising in a
business combination is calculated using the income approach based on the expected payment amounts and their associated probabilities. When appropriate, it is discounted to present value.
f) Materiality and aggregation Each material class of similar items is presented
in aggregate in the financial statements. Items of dissimilar nature or function are presented separately unless they are immaterial.
3. Significant Accounting Policies The Accounting Policies set out below have been
applied consistently to all periods presented in the financial statements of the Company and the Group unless otherwise indicated.
a) Basis of consolidation The consolidated financial statements comprise the
financial statements of the Group and its subsidiaries as at 31 March 2017. The Group controls an investee when it is exposed, or has rights, to variable returns from its involvement with the investee and has the

20 Equity One Limited | Annual Report 2016/2017
(All figures are in Sri Lankan Rupees thousands)Notes to the Financial Statements
ability to affect those returns through its power over the investee. Thus, the Group controls an investee if and only if the investor has all the following:
� Power over the investee
� Exposure, or rights, to variable returns from its involvement with the investee
� The ability to use its power over the investee to affect the amount of the investor’s returns
Generally, there is a presumption that a majority of voting rights result in control. To support this presumption and when the Group has less than a majority of the voting or similar rights of an investee, the Group considers all relevant facts and circumstances in assessing whether it has power over an investee, including:
� Contractual arrangement with the other vote holders of the investee
� Rights arising from other contracts and arrangements
� The Group’s voting rights and potential voting rights
The Group re-assesses whether or not it controls an investee if facts and circumstances indicate that there are changes to one or more of the three elements of control. Consolidation of a subsidiary begins when the Group obtains control over the subsidiary and ceases when the Group loses control of the subsidiary. Assets, liabilities, income and expenses of a subsidiary acquired or disposed of during the year are included in the consolidated financial statements from the date the Group gains control until the date the Group ceases to control the subsidiary.
i. Business combinations Business combinations are accounted for using the
acquisition method as at the acquisition date – i.e. when control is transferred to the Group.
The Group measures goodwill at the acquisition date as:
� the fair value of the consideration transferred; plus
� the recognised amount of any non-controlling interests in the acquire; plus
� if the business combination is achieved in stages, the fair value of the pre-existing equity interest in the acquire; less
� the net recognised amount (generally fair value) of the identifiable assets acquired and liabilities assumed.
When the excess is negative, a bargain purchase gain is recognised immediately in profit or loss.
The consideration transferred does not include amounts related to the settlement of pre-existing relationships. Such amounts are generally recognised in profit or loss.
Transactions costs, other than those associated with the issue of debt or equity securities, that the Group incurs in connection with a business combination are expensed as incurred. Any contingent consideration payable is measured at fair value at the acquisition date. If the contingent consideration is classified as equity, then it is not re-measured and settlement is accounted for within equity. Otherwise, subsequent changes in the fair value of the contingent consideration are recognised in profit or loss.
ii. Non-controlling interests For each business combination, the Group elects to
measure any non-controlling interests in the acquiree either:
� at fair value; or
� at their proportionate share of the acquiree’s identifiable net assets, which are generally at fair value.
Changes in the Group’s interest in a subsidiary that do not result in a loss of control are accounted for as transactions with owners in their capacity as owners. Adjustments to non-controlling interests are based on a proportionate amount of the net assets of the subsidiary.
iii. Subsidiaries Subsidiaries are entities controlled by the Group. The
financial statements of subsidiaries are included in the consolidated financial statements from the date that control commences until the adjustments required to the accounting policies of subsidiaries have been changed where ever necessary to align them with the policies adopted by the Group.

21
In the Company’s financial statements, investments in subsidiaries are carried at cost less impairment if any, in net recoverable value.
The consolidated financial statements are prepared to a common financial year end of 31st March.
iv. Loss of control On the loss of control, the Group derecognises the
assets and liabilities of the subsidiary, any non- controlling interests and the other components of equity related to the subsidiary. Any surplus or deficit arising on the loss of control is recognised in profit or loss. If the Group retains any interest in the previous subsidiary, then such interest is measured at fair value at the date that the control is lost.
Subsequently that retained interest is accounted for as an equity-accounted investee or as an available-for- sale financial asset depending on the level of influence retained.
v. Transactions eliminated on consolidation Intra-group balances and transactions are eliminated
in preparing the consolidated financial statements.
b) Foreign currencyi. Foreign currency transactions Transactions in foreign currencies are translated to
the respective functional currencies of Group entities at exchange rates at the dates of the transactions. Monetary assets and liabilities denominated in foreign currencies at the reporting date are retranslated to the functional currency at the exchange rate as at that date.
The foreign currency gain or loss on monetary items is the difference between amortised cost in the functional currency at the beginning of the year, adjusted for effective interest and payments during the year, and the amortised cost in foreign currency translated at the exchange rate at the end of the year.
Non-monetary assets and liabilities that are measured at fair value in a foreign currency are retranslated to the functional currency at the exchange rate at the date that the fair value was determined. Non-monetary items that are measured based on historical cost in a foreign currency are translated using the exchange rate at the date of the transaction.
Foreign currency differences arising on retranslation are generally recognised in Profit or Loss.
c) Financial instrumentsi. Non-derivative financial assets The Company and Group initially recognises loans
and receivables on the date that they are originated. All other financial assets are recognised initially on the trade date, which is the date that the Company and the Group becomes a party to the contractual provisions of the instrument.
The Company and the Group derecognises a financial asset when the contractual rights to the cash flows from the asset expire, or it transfers the rights to receive the contractual cash flows in a transaction in which substantially all the risks and rewards of ownership of the financial asset are transferred. Any interest in such transferred financial assets that is created or retained by the Company and the Group is recognised as a separate asset or liability.
Financial assets and liabilities are offset and the net amount presented in the statement of financial position when, and only when, the Company and the Group has a legal right to offset the amounts and intends either to settle them on a net basis or to realize the asset and settle the liability simultaneously.
The Company and the Group only holds financial assets that are categorized in to the ‘loans and receivables’ classification.
Loans and receivables Loans and receivables are financial assets with fixed
or determinable payments that are not quoted in an active market. Such assets are recognised initially at fair value plus any directly attributable transaction costs. Subsequent to initial recognition, loans and receivables are measured at amortised cost using the effective interest method, less any impairment losses.
Loans and receivables comprise cash and cash equivalents, and trade and other receivables.
Cash and cash equivalents Cash and cash equivalents comprise cash balances,
placement in government securities and placements in repurchase agreements with maturities of three months or less from the acquisition date that are subject to insignificant risk of changes in their fair

22 Equity One Limited | Annual Report 2016/2017
(All figures are in Sri Lankan Rupees thousands)Notes to the Financial Statements
value, and are used by the Company and the Group in the management of its short-term commitments.
ii. Non-derivative financial liabilities The Company and Group initially recognizes
subordinated liabilities on the date, which is the date that the Company and the Group becomes a party to the contractual provisions of the instrument.
The Company and Group derecognises a financial liability when its contractual obligations are discharged, cancelled or expired.
The Company and Group classifies non-derivative financial liabilities into the ‘other financial liabilities’ category. Such financial liabilities are recognised initially at fair value less any directly attributable transaction costs. Subsequent to initial recognition, these financial liabilities are measured at amortised cost using the effective interest method.
Other financial liabilities comprise loans and borrowings, refundable rental and other deposits, bank overdrafts, and trade and other payables.
Bank overdrafts that are repayable on demand and form an integral part of the Company’s and the Group’s cash management are included as a component of cash and cash equivalents for the statement of cash flows.
iii. Stated capital Ordinary shares Ordinary shares are classified as equity. Costs
attributable to the issue of ordinary shares are recognised as an expense.
d) Property, plant and equipmenti. Recognition and measurement All items of property, plant and equipment are initially
recorded at cost. Where items of property, plant & equipment are subsequently revalued, the entire class of such assets is revalued. Revaluations are made with sufficient regularity to ensure that their carrying amounts do not differ materially from their fair values at the reporting date.
Subsequent to the initial recognition of the asset at cost, the revalued property, plant & equipment are carried at revalued amounts less accumulated depreciation thereon and accumulated impairment
losses. The Group applies cost model for assets under property, plant & equipment which are stated at historical cost less accumulated depreciation less accumulated impairment losses, if any.
Cost includes expenditure that is directly attributable to the acquisition of the asset. The cost of self-constructed assets includes the following:
� the cost of materials and direct labour;
� any other costs directly attributable to bringing the assets to a working condition for their intended use;
� when the Company and the Group has an obligation to remove the asset or restore the site, an estimate of the costs of dismantling and removing the items and restoring the site on which they are located; and
� Capitalised borrowing costs.
When parts of an item of property, plant and equipment have different useful lives, they are accounted for as separate items (major components) of property, plant and equipment.
Purchased software that is integral to the functionality of the related equipment is capitalized as part of that equipment.
ii. Reclassification to investment property When the use of a property changes from owner-
occupied to investment property, the property is remeasured to fair value and reclassified as investment property. Any gain arising on this remeasurement is recognised in profit or loss to the extent that it reverses a previous impairment loss on the specific property, with any remaining gain recognised in other comprehensive income and presented in the revaluation reserve in equity. Any loss is recognised immediately in profit or loss.
iii. Subsequent costs Subsequent expenditure is capitalised only when it is
probable that the future economic benefits associated with the expenditure will flow to the Company and the Group. Ongoing repairs and maintenance are expensed as incurred.
iv. Depreciation Items of property, plant and equipment are depreciated
from the date they are available for use or, in respect of
23
self-constructed assets, from the date that the asset is completed and ready for use.
Depreciation is calculated to write off the cost of items of property, plant and equipment less their estimated residual values using the straight- line basis over their estimated useful lives. Depreciation is generally recognised in profit or loss, unless the amount is included in the carrying amount of another asset.
The estimated useful lives for the current and comparative years of significant items of property, plant and equipment are as follows;
No.of Years
Plant & machinery 5-27
Motor vehicles 4-5
Furniture, fittings & office equipments
5-16
Computer 3-5
Depreciation of an asset begins when it is available for use whereas depreciation of an asset ceases at the earlier of the date that the asset is classified as held for sale and the date that the asset is derecognised.
Depreciation methods, useful lives and residual values are reviewed at each reporting date and adjusted if appropriate.
v. Disposal The gains or losses arising on disposal or retirement
of an item of property, plant and equipment are determined by comparing the proceeds from disposal with the carrying amount of the property, plant and equipment are recognized net within other income in Profit or Loss. When revalued assets are sold, the amounts included in the revaluation reserve are transferred to retained earnings.
vi. Capital work-in-progress Capital work-in-progress represents the accumulated
cost of materials and other costs directly related to the construction of an asset. Capital work in progress is transferred to the respective asset accounts at the time it is substantially completed and ready for its intended use.
vii. Investment property Investment property is property held either to earn rental
income or capital appreciation or for both, but not for sale on the ordinary course of business, use in production or supply of goods and services or for administrative purposes. Investment properties are measured initially at cost, including transaction costs. The carrying amount includes the cost of replacing part of an existing investment property at the time that cost is incurred if the recognition criteria are met; and excludes the costs of day- to-day servicing of an investment property.
Subsequent to initial recognition, investment properties are stated at fair value, which reflects market conditions as at the reporting date. Formal valuations are carried out every 3 years by qualified valuers. Gains or losses arising from changes in the fair values of investment properties are recognized in Profit or Loss in the year in which they arise.
Investment properties are derecognised when either they have been disposed of or when the Investment property is permanently withdrawn from use and no future economic benefit is expected from its disposal. Any gains or losses on the retirement or disposal of an investment property are recognized in profit or loss in the year of retirement or disposal.
Transfers are made to investment property when, and only when, there is a change in use, evidenced by commencement/ end of owner occupation, commencement of development with a view to sale, commencement of an operating lease to another party or completion of construction or development.
For a transfer from investment property to owner occupied property or inventories, the deemed cost of property for subsequent accounting is its fair value at the date of change in use. If the property occupied by the Company and the Group as an owner occupied property becomes an investment property, the Company and the Group accounts for such property in accordance with the policy stated under property, plant & equipment up to the date of change in use. For a transfer from inventories to investment property, any difference between the fair value of the property at that date and its previous carrying amount is recognized in profit or loss. When the Company and the Group completes the construction or development of a self-constructed investment property, any difference between the fair value of the property at that date and its previous carrying amount is recognized in Profit or Loss.

24 Equity One Limited | Annual Report 2016/2017
(All figures are in Sri Lankan Rupees thousands)Notes to the Financial Statements
Any gain or loss on disposal of an investment property (calculated as the difference between the net proceeds from disposal and the carrying amount of the item) is recognised in profit or loss. When an investment property that was previously classified as property, plant and equipment is sold, any related amount included in the revaluation reserve is transferred to retained earnings.
e) Impairmenti. Non-derivative financial assets Financial asset classified as ‘loans and receivables’
are assessed at each reporting date to determine whether there is objective evidence that it is impaired. A financial asset is impaired if there is objective evidence of impairment as a result of one or more events that occurred after the initial recognition of the asset, and that loss event(s) had an impact on the estimated future cash flows of that asset that can be estimated reliably.
Objective evidence that financial assets are impaired includes default or delinquency by a debtor, restructuring of an amount due to the Company and the Group on terms that the Company and the Group would not consider otherwise, indications that a debtor or issuer will enter bankruptcy, adverse changes in the payment status of borrowers or issuers, economic conditions that correlate with defaults or the disappearance of an active market for a security.
Financial assets measured at amortised cost Company and the Group considers evidence
of impairment for financial assets measured at amortised cost (loans and receivables) on specific assets accordingly, all individually significant assets are assessed for specific impairment.
In assessing collective impairment, the Group uses historical trends of the probability of default, the timing of recoveries and the amount of loss incurred, adjusted for management’s judgment as to whether current economic and credit conditions are such that the actual losses are likely to be greater or lesser than suggested by historical trends.
An impairment loss in respect of a financial asset measured at amortised cost is calculated as the difference between its carrying amount and the present value of the estimated future cash flows
discounted at the asset’s original effective interest rate. Losses are recognised in Profit or Loss and reflected in an allowance account against loans and receivables. Interest on the impaired asset continues to be recognised. When an event occurring after the impairment was recognised causes the amount of impairment loss to decrease, the decrease in impairment loss is reversed through Profit or Loss.
ii. Non-financial assets The carrying amounts of the Company’s and the
Group’s non-financial assets, other than investment property and deferred tax assets, are reviewed at each reporting date to determine whether there is any indication of impairment. If any such indication exists, then the asset’s recoverable amount is estimated. An impairment loss is recognised if the carrying amount of an asset or cash generating unit (CGU) exceeds its recoverable amount.
The recoverable amount of an asset or CGU is the greater of its value in use and its fair value less costs to sell. In assessing value in use, the estimated future cash flows are discounted to their present value using a pre-tax discount rate that reflects current market assessments of the time value of money and the risks specific to the asset or CGU. For impairment testing, assets are grouped together into the smallest group of assets that generates cash inflows from continuing use that are largely independent of the cash inflows of other assets or CGUs. Subject to an operating segment ceiling test, CGUs to which goodwill has been allocated are aggregated so that the level at which impairment testing is performed reflects the lowest level at which goodwill is monitored for internal reporting purposes. Goodwill acquired in a business combination is allocated to groups of CGUs that are expected to benefit from the synergies of the combination.
Impairment losses are recognised in Profit or Loss. Impairment losses recognised in respect of CGUs are allocated reduce the carrying amount of the other assets in the CGU (group of CGUs) on a pro rata basis.
An impairment loss is reversed only to the extent that the asset’s carrying amount does not exceed the carrying amount that would have been determined, net of depreciation or amortisation, if no impairment loss had been recognized.

25
f) Employee benefitsi. Short-term employee benefits Short-term employee benefit obligations are measured
on an undiscounted basis and are expensed as the related service is provided. A liability is recognised for the amount expected to be paid under short-term cash bonus or profit-sharing plans if the Company and the Group has a present legal or constructive obligation to pay this amount as a result of past service provided by the employee, and the obligation can be estimated reliably.
ii. Defined contribution plans A defined contribution plan is a post-employment
benefit plan under which an entity pays fixed contributions into a separate entity and has no legal or constructive obligation to pay further amounts. Obligations for contributions to defined contribution plans are recognised as an employee benefit expense in profit or loss in the periods during which related services are rendered by employees.
iii. Defined benefit plans A defined benefit plan is a post-employment benefit
plan other than a defined contribution plan.
The liability recognised in the Financial Statements in respect of defined benefit plans is the present value of the defined benefit obligation as at the reporting date.
The defined benefit obligation is calculated by a qualified actuary as at the reporting date using the Projected Unit Credit (PUC) method as recommended by LKAS 19 - ‘Employee Benefits’. Such actuarial valuations will be carried out once in every year. The liability is not externally funded. All Actuarial gains or losses are recognised immediately in other comprehensive income.
Under the Payment of Gratuity Act No. 12 of 1983, the liability to an employee arises only on completion of 5 years of continued service.
The liability is not externally funded.
g) Provisions A provision is recognised if, as a result of a past event,
the Company and the Group has a present legal or constructive obligation that can be estimated reliably, and it is probable that an outflow of economic benefits will be required to settle the obligation. Provisions are
determined by discounting the expected future cash flows at a pre-tax rate that reflects current market assessments of the time value of money and the risks specific to the liability. The unwinding of the discount is recognised as a finance cost.
h) Contingent liabilities and contingent assets A contingent liability is a possible obligation that
arises from past events whose existence will be confirmed by the occurrence or non-occurrence of one or more uncertain future events beyond the control of the Company and the Group or a present obligation that is not recognized because it is not probable that an outflow of resources will be required to settle the obligation.
A contingent liability also arises in extremely rare cases where there is a liability that cannot be recognized because it cannot be measured reliably. The Company and the Group does not recognize a contingent liability but discloses its existence in the financial statements.
A contingent asset is a possible asset that arises from past events whose existence will be confirmed by the occurrence or non-occurrence of one or more uncertain future events beyond the control of the Company and the Group. The Company and the Group does not recognize contingent assets but discloses its existence where inflows of economic benefits are probable, but not virtually certain. In the acquisition of subsidiaries by the Group under business combinations, contingent liabilities assumed are measured initially at their fair value at the acquisition date, irrespective of the extent of any minority interest.
i) Revenue The Group revenue represents sales to customers
outside the Group and sales within the Group which are intended for internal consumption.
Revenue is recognized to the extent that it is probable that the economic benefits will flow to the Company and the Group, and the revenue and associated costs incurred or to be incurred can be reliably measured. Revenue is measured at the fair value of the consideration received or receivable, net of trade discounts and sales taxes.
In arriving at the revenue for consolidation financial statements, sales within the Group are eliminated.

26 Equity One Limited | Annual Report 2016/2017
(All figures are in Sri Lankan Rupees thousands)Notes to the Financial Statements
The following specific criteria are used for the purpose of recognition of revenue;
i. Rental income Rental income from investment property is recognised
as revenue on a straight-line basis over the term of the lease. Lease incentives granted are recognised as an integral part of the total rental income, over the term of the lease. Rental income from other property are recognised as other income.
ii. Other Income - on accrual basis. Net gains and losses of a revenue nature resulting from
the disposal of property, plant & equipment have been accounted for in profit or losses and disposal of investments are accounted for in profit or loss on the basis of realized net profit.
j) Expenditure Recognitioni. Operating expenses All expenses incurred in day-to-day operations of the
business and in maintaining the property, plant & equipment in a state of efficiency has been charged to revenue in arriving at the profit or loss for the year. Provision has also been made for bad and doubtful debts, all known liabilities and depreciation on property, plant & equipment.
ii. Finance income and finance costs Finance income comprises interest income on funds
invested and dividend income.
Interest income is recognised as it accrues in profit or loss, using the effective interest method.
Dividend income is recognized in profit or loss on the date that the Company’s and the Group’s right to receive payment is established, which in the case of quoted securities is normally the ex-dividend date.
Finance costs comprise interest expense on borrowings, unwinding of the discount on provisions and deferred consideration.
Borrowing costs that are not directly attributable to the acquisition, construction or production of a qualifying asset are recognised in profit or loss using the effective interest method.
Foreign currency gains and losses on financial assets and financial liabilities are reported on a net basis as either finance income or finance cost depending on
whether foreign currency movements are in a net gain or net loss position.
k) Income tax expense Income tax expense comprises current and deferred
tax. Current tax and deferred tax is recognised in profit or loss except to the extent that it relates to a business combination, or items recognised directly in equity or in other comprehensive income.
i. Current taxation Current tax is the expected tax payable or receivable
on the taxable income or loss for the year, using tax rates enacted or substantively enacted at the reporting date, and any adjustment to tax payable in respect of previous years. Current tax payable also includes any tax liability arising from the declaration of dividends.
ii. Deferred taxation Deferred tax is recognised in respect of temporary
differences between the carrying amounts of assets and liabilities for financial reporting purposes and the amounts used for taxation purposes.
Deferred tax is not recognised for:
� temporary differences on the initial recognition of assets or liabilities in a transaction that is not a business combination and that affects neither accounting nor taxable profit or loss;
� temporary differences related to investments in subsidiaries, associates and jointly controlled entities to the extent that the Group is able to control the timing of the reversal of the temporary differences and it is probable that they will not reverse in the foreseeable future; and
The measurement of deferred tax reflects the tax consequences that would follow the manner in which the Company and the Group expects, at the end of the reporting period, to recover or settle the carrying amount of its assets and liabilities. For investment property that is measured at fair value, the resumption that the carrying amount of the investment property will be recovered through sale has not been rebutted.
Deferred tax is measured at the tax rates that are expected to be applied to temporary differences when they reverse, using tax rates enacted or substantively enacted at the reporting date.

27
Deferred tax assets and liabilities are offset if there is a legally enforceable right to offset current tax liabilities and assets, and they relate to taxes levied by the same tax authority on the same taxable entity, or on different tax entities, but they intend to settle current tax liabilities and assets on a net basis or their tax assets and liabilities will be realised simultaneously.
A deferred tax asset is recognised for unused tax losses, tax credits and deductible temporary differences to the extent that it is probable that future taxable profits will be available against which they can be utilised. Deferred tax assets are reviewed at each reporting date and are reduced to the extent that it is no longer probable that the related tax benefit will be realised, based on the level of future taxable profit forecasts and tax planning strategies.
iii. Tax exposures In determining the amount of current and deferred
tax, the Company and the Group takes into account the impact of uncertain tax positions and whether additional taxes and interest may be due. This assessment relies on estimates and assumptions and may involve a series of judgments about future events. New information may become available that causes the Group to change its judgment regarding the adequacy of existing tax liabilities; such changes to tax liabilities will impact tax expense in the period that such a determination is made.
l) Related party transactions Disclosure has been made in respect of the transactions
in which one party has the ability to control or exercise significant influence over the financial and operating policies/decisions of the other, irrespective of whether a price is charged.
4. Events after the reporting period All material and important events which occur after the
reporting date have been considered and disclosed in notes to the financial statements.
5. Cash Flow Interest paid and dividend paid are classified as
financing cash flows while interest received and dividend received are classified as investing cash flows, for the purpose of presentation of the Cash Flow Statement which has been prepared using the “Indirect Method”.
6. Earnings Per Share The Company and the Group presents basic earnings
per share (EPS) data for its ordinary shares. Basic EPS is calculated by dividing the profit or loss attributable to ordinary shareholders of the Company by the weighted average number of ordinary shares outstanding during the period.
7. Dividends on Ordinary Shares Dividends on ordinary shares are recognized as a
liability and deducted from equity when they are approved by the Company’s shareholders. Interim dividends are deducted from equity when they are declared and are no longer at the discretion of the Company.
8. Presentation Assets and liabilities are grouped by nature and
listed in an order that reflects their relative liquidity and maturity pattern.
Where appropriate, the significant accounting policies are disclosed in the succeeding notes.
a.) Offsetting Income and Expenses Income and expenses are not offset unless required
or permitted by accounting standards.
b.) Offsetting Assets and Liabilities Assets and liabilities are offset and the net amount
reported in the statement of financial position only where there is;
� a current enforceable legal right to offset the asset and the liability; and
� an intention to settle the liability simultaneously
9. Segment Reporting Segment results that are reported to the Board of
directors include items that are directly attributable to a segment as well as those that can be allocated on a reasonable basis. Unallocated items mainly comprise audit, directors and legal fee and other operating expense.

28 Equity One Limited | Annual Report 2016/2017
(All figures are in Sri Lankan Rupees thousands)Notes to the Financial Statements
10. New Accounting Standards Issued but not Effective
A number of new standards and amendments to standards issued but not yet effective as at the reporting date have not been applied in preparing these Financial Statements.
SLFRS 9-Financial Instruments SLFRS 9, published in July 2014, replaces the existing
guidance in LKAS 39 financial Instruments: Recognition and Measurement. SLFRS 9 includes revised guidance on the classification and measurement of financial instruments, including a new expected credit loss model for calculating impairment on financial assets, and the new general hedge accounting requirements. It also carries forward the guidance on recognition and derecognition of financial instruments from LKAS 39.
SLFRS 9 is effective for annual reporting periods beginning on or after 1st January 2018, with early adoption permitted.
The Group is assessing the potential impact on its consolidated financial statements resulting from the application of SLFRS 9.
SLFRS 15 Revenue from Contracts with Customers SLFRS 15 establishes a comprehensive framework for
determining whether, how much and when revenue is recognised. It replaces existing revenue recognition guidance, including LKAS 18 Revenue, LKAS 11 Construction Contracts and IFRIC 13 Customer Loyalty Programmes.
SLFRS 15 is effective for annual reporting periods beginning on or after 1st January 2018, with early adoption permitted.
The Group is assessing the potential impact on its consolidated financial statements resulting from the application of SLFRS 15. However possible impacts are limited.
SLFRS 16 – ‘Leases’ SLFRS 16 eliminates the current dual accounting model
for lessees which distinguishes between On-Balance Sheet fiancé leases and Off-Balance Sheet operating leases. Instead there will be a single On-Balance Sheet accounting model that is similar to current finance lease accounting.
SLFRS 16 is effective for annual Reporting periods beginning on or after January 01, 2019. The Group is assessing the potential impact on its Financial Statements resulting from the application of SLFRS 16.

29
Group Company
For the year ended 31st March 2017 2016 2017 2016
11 RevenueProperty rental 254,744 233,510 110,772 106,481
254,744 233,510 110,772 106,481
Group Company
For the year ended 31st March 2017 2016 2017 2016
12 Other incomeParking fees 780 510 - -
On services provided to tenants 3,318 2,960 2,560 2,925
Profit on disposal of property, plant and equipment - 788 - 788
4,098 4,258 2,560 3,713
Group Company
For the year ended 31st March 2017 2016 2017 2016
13 Profit from operationsProfit from operations is stated after charging all expenses including the following:
Depreciation (note 13.2) 2,048 2,741 2,048 2,741
Nomination committee fees 58 100 58 100
Auditors' remuneration - audit services 565 565 300 300
Auditors' remuneration - audit related services 299 106 149 53
Professional services cost (note 13.1) 1,259 2,500 1,071 974
Support service fee 9,174 2,441 4,337 1,523
Personnel costs (note 13.3) 39,013 38,595 21,544 20,650
13.1 Professional services costValuation services 225 281 112 179
Other services 1,034 2,219 959 795
1,259 2,500 1,071 974
13.2 DepreciationDepreciation is included in the statement of profit or loss under the following headings:
Direct costs 1,725 2,300 1,725 2,300
Administrative and other operating expenses 323 441 323 441
2,048 2,741 2,048 2,741

30 Equity One Limited | Annual Report 2016/2017
Group Company
For the year ended 31st March 2017 2016 2017 2016
13.3 Personnel costsSalaries, wages and other related expenses 35,779 35,371 19,726 18,864 Defined benefit plan cost - Employee benefits (note 27.2) 674 769 337 451 Defined contribution plan cost - EPF and ETF 2,560 2,455 1,481 1,335
39,013 38,595 21,544 20,650
The above include:
Directors’ emoluments - - - -
Directors’ fees 1,100 1,100 650 700
1,100 1,100 650 700
Group Company
For the year ended 31st March 2017 2016 2017 2016
14 Net finance income / (costs)Finance income
Interest income 1,320 1,261 1,145 3,334
Dividend income - - 54,227 14,676
1,320 1,261 55,372 18,010
Finance costs
Interest expenses on short term loan 1,757 - 1,757 - Unwinding of interest on refundable deposits (note 25) 5,600 4,138 2,215 1,336
7,357 4,138 3,972 1,336 Net finance income/(costs) (6,037) (2,877) 51,400 16,674
Group Company
For the year ended 31st March 2017 2016 2017 2016
15 Current taxation
15.1 Income tax expensesIncome tax expense for the year (note15.2) 39,186 22,313 16,642 14,171 Over provision in respect of previous years (1,455) (416) (689) (311)
37,731 21,897 15,953 13,860
Deferred taxationOn origination and reversal of temporary differences (note 26.1) 13,314 27,146 3,032 3,761
13,314 27,146 3,032 3,761 Current tax expense for the year 51,045 49,043 18,985 17,621
(All figures are in Sri Lankan Rupees thousands)Notes to the Financial Statements

31
Group Company
For the year ended 31st March 2017 2016 2017 2016
15.2 Reconciliation between accounting profit and taxable profitAccounting profit before taxation 156,674 679,371 116,794 404,277
Aggregate disallowable expenses 8,602 11,274 6,245 7,012
Aggregate allowable expenses (30,391) (66,821) (13,291) (16,318)
Profits not charged to income tax - - (54,227) (14,676)
Net gain arising from changes in fair value of investment properties - (537,498) - (327,102)
Notional adjustments arising on application of LKAS/SLFRS 1,193 (6,039) 3,916 (2,581)
Utilisation of tax losses (note 15.5 c) (19,627) (6,669) - -
Taxable profit 116,451 73,618 59,437 50,612
Income tax thereon (note 15.4 a & 15.5 b) 32,606 20,613 16,642 14,171
Dividend tax 6,580 1,700 - -
Income tax expense for the year 39,186 22,313 16,642 14,171
15.3 Movement in tax lossesTax losses brought forward 19,007 24,097 - -
Adjustment on finalization of liability 620 1,579 - -
Utilisation of tax losses during the year (note15.5.c) (19,627) (6,669) - -
Tax losses carried forward - 19,007 - -
15.4 Company(a) In terms of the provisions of the Inland Revenue Act, No 10 of 2006 and amendments thereto, the Company is liable to
taxation at 28% ( 2016 - 28%).
15.5 Group(a) Group tax expenses is based on the taxable profit of individual companies within the Group. At present, the tax laws of Sri
Lanka do not provide for Group taxation.
(b) In terms of the provisions of the Inland Revenue Act, No.10 of 2006 and amendments thereto, Companies within the Group are liable to taxation at a tax rate of 28% (2016 - 28%).
(c) Utilisation of tax losses are restricted to 35% of current year’s Statutory Income. Any unabsorbed tax losses can be carried forward indefinitely.
(d) Deferred tax has been computed using a tax rate of 28%.

32 Equity One Limited | Annual Report 2016/2017
16 Earnings per shareThe Company's and the Group's earnings per share is calculated on the profit attributable to the shareholders of Equity One Limited over the weighted average number of ordinary shares outstanding, as required by Sri Lanka Accounting Standard (LKAS 33) - "Earnings per Share".
The following reflect the income and share data used in the earnings per share computation:
Group Company
For the year ended 31st March 2017 2016 2017 2016
Amounts used as the numerator
Profit attributable to the ordinary shareholders of the Company (Rs. '000) 99,295 610,893 97,809 386,656
Amounts used as the denominator
Weighted average number of ordinary shares outstanding during the year (In thousands) 40,322 40,322 40,322 40,322
Earnings per share (Rs) 2.46 15.15 2.43 9.59
Freehold Freehold Other Capital Total as at Total as at
land building equipment work-in 31st March 31st March
Progress 2017 2016
17 Investment properties
17.1 GroupBalance as at the beginning of the year 2,397,494 679,248 132,844 1,914 3,211,500 2,651,297
Additions during the year - 4,434 462 - 4,896 22,705
Transfer from capital work-in-progress - - 1,914 (1,914) - -
Changes in fair value of investment properties - - - - - 537,498
2,397,494 683,682 135,220 - 3,216,396 3,211,500
17.2 CompanyBalance as at the beginning of the year 1,442,800 214,729 48,475 - 1,706,004 1,359,115
Additions during the year - 4,434 86 - 4,520 19,787
Changes in fair value of investment properties
- - - - - 327,102
1,442,800 219,163 48,561 - 1,710,524 1,706,004
(All figures are in Sri Lankan Rupees thousands)Notes to the Financial Statements

33
17.4
Det
ails
of i
nves
tmen
t pro
per
ties
Tenu
reM
etho
dN
etLa
nd e
xten
tH
isto
rical
Fair
valu
eFa
ir va
lue
Prop
erty
and
loca
tion
of p
rope
rty
Des
crip
tion
of v
alua
tion
rent
able
are
a(H
ecta
res)
cost
2017
2016
Equi
ty O
ne L
imite
d.
Dhar
map
ala
Mw
., Col
ombo
7Fr
eeho
ldO
ffice
spac
eM
arke
t app
roac
h 4
4,64
7 0.
238
120
,288
1
,084
,609
1
,080
,089
Vaux
hall
Lane
, Col
ombo
2Fr
eeho
ldW
areh
ouse
spac
eM
arke
t app
roac
h 3
2,40
8 0.
455
226
,917
6
25,9
15
625
,915
Equi
ty T
wo
PLC.
No. 6
1, Ja
nadh
ipat
hi M
awat
ha, C
olom
bo 0
1Fr
eeho
ldO
ffice
spac
eM
arke
t app
roac
h 4
1,12
4 0.
072
128
,364
4
20,9
09
420
,533
No. 5
5, Ja
nadh
ipat
hi M
awat
ha C
olom
bo 0
1Fr
eeho
ldO
ffice
spac
eM
arke
t app
roac
h 4
4,04
6 0.
146
427
,629
7
16,1
64
716
,164
Equi
ty T
hree
(Priv
ate)
Lim
ited.
Geor
ge R
. De
Silv
a M
w., C
olom
bo 1
3Fr
eeho
ldO
ffice
spac
eM
arke
t app
roac
h 3
1,23
7 0
.208
6
9,25
6 3
68,7
99
368
,799
3,2
16,3
96 3
,211
,500
17.3
Dur
ing
the
year
, Dire
ctor
's va
luat
ion
was
car
ried
out
for
the
inve
stm
ent
prop
ertie
s of
the
Com
pany
and
the
Gro
up. T
he la
st p
rofe
ssio
nal v
alua
tions
on
the
inve
stm
ent p
rope
rtie
s of
the
Com
pany
and
the
Gro
up w
ere
perf
orm
ed b
y an
inde
pend
ent p
rofe
ssio
nal v
alue
r, M
r. S.
Siv
aska
ntha
, F.I.
V. (S
ri La
nka)
of P
erer
a Si
vask
anth
a &
Com
pany
, Inc
orpo
rate
d va
luer
s, on
the
basi
s of
Mar
ket A
ppro
ach
as a
t 31s
t Mar
ch 2
016.
In th
e op
inio
n of
the
Dire
ctor
s no
mat
eria
l cha
nge
has
occu
rred
in th
e fa
ir va
lue
of th
e in
vest
men
t pro
pert
ies
com
pare
d to
the
prev
ious
yea
r's p
rofe
ssio
nal v
alua
tion.
The
det
ails
of w
hich
are
as
follo
ws;

34 Equity One Limited | Annual Report 2016/2017
Group Company
As at 31st March 2017 2016 2017 2016
17.5 Analysis of capital work-in-progress - AdditionsInvestment properties - Other equipment - 1,914 - -
- 1,914 - -
17.6 No items of the investment properties of the Company and the Group were pledged as security for liabilities as at the reporting date.
17.7 There were no restrictions on titles of the investment properties of the Company and the Group, as at the reporting date.
17.8 Capitalization of borrowing costs into investment propertiesNo borrowing cost capitalized for the year ended 31st March 2017 (2016 - Rs. Nil).
17.9 Contractual obligations to construct and develop investment propertiesNo contractual obligations entered in to construct and develop investment properties as at the reporting date.
17.10 All the direct operating expenses of the company and the Group are incurred on investment properties generating rental income.
18 Property, plant and equipment18.1 Group / Company
Machinery Furniture Motor Total as at Total as at
and and fittings vehicles 31st March 31st March
equipment 2017 2016
Cost
As at the beginning of the year 2,026 681 9,200 11,907 16,168 Additions during the year - - - - 9,489 Disposals during the year - - - - (13,750)As at the end of the year 2,026 681 9,200 11,907 11,907
Accumulated Depreciation
As at the beginning of the year 1,566 583 2,300 4,449 15,458
Charge for the year 284 39 1,725 2,048 2,741
Depreciation on disposal - - - - (13,750)
As at the end of the year 1,850 622 4,025 6,497 4,449
Carrying amount as at the end of the year 176 59 5,175 5,410 7,458
18.2 Details of fully depreciated assets in property, plant and equipment are as follows;
Group Company
As at 31st March 2017 2016 2017 2016
Machinery and equipment 1,454 873 1,454 873
Furniture and fittings 321 285 321 285
1,775 1,158 1,775 1,158
18.3 There were no restrictions to the title of property, plant and equipment of the Company and the Group, as at the reporting date. Further no items were pledged as security.
(All figures are in Sri Lankan Rupees thousands)Notes to the Financial Statements

35
Company
As at 31st March 2017 2016
19 Investments in subsidiariesInvestments in subsidiaries (note 19.1) 552,048 552,048
552,048 552,048
As at 31st March 2017 2016
No. of Cost No. of Cost
shares shares
19.1 Quoted
Equity Two PLC 27,532,525 448,834 27,532,525 448,834
448,834 448,834
Unquoted
Equity Three (Private) Limited 5,399,997 103,214 5,399,997 103,214
103,214 103,214
Total investment in subsidiaries 552,048 552,048
Group Company
As at 31st March 2017 2016 2017 2016
20 Trade and other receivablesFinancial
Trade receivables 22,195 23,298 2,971 6,827
Other receivables 9,585 2,584 442 442
Amounts due from related companies (note 32.4) - - - 15,857
Loans given to company officers (note 20.1) 1,161 897 565 368
32,941 26,779 3,978 23,494
Non-financial
Prepaid expenses 726 1,451 457 605
Advance payments 228 771 228 771
954 2,222 685 1,376
33,895 29,001 4,663 24,870
20.1 Loans given to company officersBalance as at the beginning of the year 897 472 368 246
Loans granted during the year 1,502 1,435 729 528
Settlements during the year (1,238) (1,010) (532) (406)
Balance as at the end of the year 1,161 897 565 368

36 Equity One Limited | Annual Report 2016/2017
Group Company
As at 31st March 2017 2016 2017 2016
21 Cash and cash equivalentsCash at bank and in hand 11,985 10,539 5,988 3,181
Cash and cash equivalents for the purpose of cash flow statement 11,985 10,539 5,988 3,181
Group Company
As at 31st March 2017 2016 2017 2016
22 Stated capitalIssued and fully paid
As at the beginning of the year (40,321,730 shares) 1,085,584 1,085,584 1,085,584 1,085,584
As at the end of the year (40,321,730 shares) 1,085,584 1,085,584 1,085,584 1,085,584
Group Company
As at 31st March 2017 2016 2017 2016
23 Capital reservesCapital accretion reserve 158 158 158 158
Machinery replacement reserve 5,109 5,109 5,109 5,109
Other capital reserves 7,969 7,969 7,969 7,969
13,236 13,236 13,236 13,236
23.1 Capital accretion reserve, machinery replacement reserve and other capital reserves represent the amounts set aside by the Directors for future expansion and to meet any contingencies.
The movements of the above reserves are given in the Statement of Changes in Equity.
Group Company
As at 31st March 2017 2016 2017 2016
24 Revenue reservesGeneral reserve (note 24.1) 39 39 39 39
Fair value adjustment reserve (note 24.2) 1,771,885 1,771,885 1,285,959 1,285,959
Accumulated loss (56,190) (119,477) (233,594) (295,213)
1,715,734 1,652,447 1,052,404 990,785
24.1 General reserveGeneral reserve represents the amounts set aside by the Directors for future expansion and to meet any contingencies.
24.2 Fair value adjustment reserveGains arising from fair value adjustment of investment properties will be transferred from retained earnings/ accumulated loss to fair value adjustment reserve and any fair valuation losses arising will be transferred to fair value adjustment reserve to the extent that loss does not exceed the balance held in the said reserve.
The movements of the above reserves are given in the Statement of Changes in Equity.
(All figures are in Sri Lankan Rupees thousands)Notes to the Financial Statements

37
Group Company
As at 31st March 2017 2016 2017 2016
25 Refundable rental depositsBalance as at the beginning of the year 63,662 55,943 26,609 22,237
Receipts during the year 14,328 19,140 6,284 10,924
Transferred to deferred revenue (1,924) (6,003) (520) (2,910)
Refunds during the year (4,059) (9,556) (4,059) (4,978)
Unwinding of interest on refundable deposits 5,600 4,138 2,215 1,336
77,607 63,662 30,529 26,609
Group Company
As at 31st March 2017 2016 2017 2016
26 Deferred tax liabilitiesBalance as at the beginning of the year 179,487 152,341 56,597 52,836
Charge for the year (note 26.1) 13,432 27,146 3,071 3,761
Balance as at the end of year 192,919 179,487 59,668 56,597
26.1 Charge for the year The amounts recognised in the statement of profit or loss are as follows;
Investment properties 7,896 25,449 3,126 3,389
Employee benefits 96 271 (94) 372
Tax losses brought forward 5,322 1,426 - -
13,314 27,146 3,032 3,761
The amount recognised in the statement of other comprehensive income is as follows;
Employee benefits 118 - 39 - 118 - 39 -
Net deferred tax charged for the year 13,432 27,146 3,071 3,761
26.2 Deferred tax assetTax effect on employee benefits 981 1,195 608 553
Tax effect on brought forward tax losses - 5,322 - -
Total deferred tax asset 981 6,517 608 553
26.3 Deferred tax liabilitiesTax effect on investment properties and property, plant and equipment 193,900 186,004 60,276 57,150
Total deferred tax liability 193,900 186,004 60,276 57,150
Net deferred tax liability 192,919 179,487 59,668 56,597

38 Equity One Limited | Annual Report 2016/2017
26.4 The deferred tax effect of undistributed reserves of subsidiaries has not been recognised since the Company can control the timing of the reversal of these temporary differences.
Group Company
As at 31st March 2017 2016 2017 2016
27 Employee benefits
27.1 The movement in the liabilities recognised in the statement of financial position is as follows:
Balance as at the beginning of the year 4,267 5,237 1,974 3,303
Current service cost 226 245 130 121
Interest cost 448 524 207 330
Actuarial (gains) / losses (423) 28 (139) (13)
Payments made during the year (1,013) (1,767) - (1,767)
Balance as at the end of the year 3,505 4,267 2,172 1,974
27.2 The amount recognised in the statement of profit or loss are as follows;
Current service cost 226 245 130 121
Interest cost 448 524 207 330
Charge for the year 674 769 337 451
27.3 The amount recognised in the statement of other comprehensive income is as follows;
Actuarial (gains) / losses (423) 28 (139) (13)
(Gain) / charge for the year (423) 28 (139) (13)
Amounts recognized in the total comprehensive income 251 797 198 438
27.4 Liability on employee benefits as at 31st March 2017 amounting to Rs.2,172,486/- and Rs.3,505,052/- ( 2016 - Rs.1,974,342 /- and Rs. 4,267,178 /-) for the Company and the Group respectively is made based on an actuarial valuation carried out by Mr. M. Poopalanathan (AIA) of Messrs. Actuarial and Management Consultants (Pvt) Ltd. As recommended by the Sri Lanka Accounting Standards (LKAS 19) - "Employee benefits" , the "Projected Unit Credit (PUC)" method has been used in this valuation.
The principal assumptions used are:Rate of discount 11.5% p.a. (2016 - 10.5% p.a)Rate of pay increase 10% p.a. (2016 - 12% p.a)Retirement age 55 yearsMortality A 67/70 mortality table, issued by the Institute of Actuaries, London was used. Withdrawal rate 5% for age up to 49 and zero thereafter.The Company is a going concern.
(All figures are in Sri Lankan Rupees thousands)Notes to the Financial Statements

39
27.5 Sensitivity analysis
Reasonably possible changes to one of the relevant actuarial assumptions at the reporting date, holding other assumptions constant, would have affected the employee benefits by the amounts shown below,
Group Company
As at 31st March 2017 2016 2017 2016
1% increase in discount rate (112) (146) (39) (53)
1% decrease in discount rate 172 168 107 58
1% increase in salary escalation rate 130 128 88 12
1% decrease in salary escalation rate (166) (214) (45) (113)
27.6 The above provision is not externally funded.
Group Company
As at 31st March 2017 2016 2017 2016
28 Trade and other payablesFinancial
Trade payables 1,205 547 1,002 -
Other payables 35,186 43,656 22,690 26,321
Amounts due to related companies (note 32.5) - 80,674 - 83,174
36,391 124,877 23,692 109,495
Non financial
Provisions and accrued expenses 5,941 6,907 4,353 4,466
5,941 6,907 4,353 4,466
42,332 131,784 28,045 113,961
Group Company
As at 31st March 2017 2016 2017 2016
29 Deferred revenueBalance as at the beginning of the year 11,242 8,904 2,873 1,297
Amount transferred from refundable deposits 1,924 6,003 520 2,910
Amortization of deferred revenue (5,587) (3,665) (2,179) (1,334)
Balance as at the end of the year 7,579 11,242 1,214 2,873

40 Equity One Limited | Annual Report 2016/2017
30 Commitments and contingencies30.1 Capital expenditure commitments
There were no significant financial commitments for the Company and the Group as at 31st March 2017.
30.2 Contingent liabilitiesThere were no material contingent liabilities as at the reporting date.
30.3 Litigations and claimsThere were no material litigations and claims against the Company and the Group as at the reporting date.
31 Financial instruments Financial risk management - Overview
The Group has exposure to the following risks arising from financial instruments: - Credit risk
- Market risk - Liquidity risk This note presents information about the Group’s exposure to each of the above risks, the Group’s objectives, policies and
processes for measuring and managing risk.
Risk management framework The Company’s Board of Directors has overall responsibility for the establishment and supervision of the Group’s risk
management framework. The Board of Directors has delegated this function to Carsons Management Services (Private) Limited, the management company, which is responsible for developing and monitoring the Group’s risk management policies and reports regularly to the Board of Directors on its activities.
The Group’s risk management policies are established to identify and analyse the risks faced by the Group, to set appropriate risk limits and controls, and to monitor risks and adherence to risk limits. Risk management policies and systems are reviewed regularly to reflect changes in the market conditions and the Group’s activities. The Group, through its training and management standards and procedures, aims to develop a disciplined and constructive control environment in which all employees understand their roles and obligations.
The Audit Committee of Carson Cumberbatch PLC, the parent company, oversees how management monitors compliance with the Group’s risk management policies and procedures, and reviews the adequacy of the risk management framework in relation to the risks faced by the Group. The Audit Committee is assisted in its supervision role by Group Internal Audit. Group Internal Audit undertakes both regular and ad-hoc reviews of risk management controls and procedures, the results of which are reported to the Audit Committee.
31.1 Credit risk
Credit risk is the risk of a financial loss to the Group, if a customer or a counterparty to a financial instrument fails to meet its contractual obligations, and arises primarily from the Group’s receivables from customers, placements in deposits with banking institutions and placements in government securities.
(All figures are in Sri Lankan Rupees thousands)Notes to the Financial Statements

41
31.1.1 Exposure to credit risk
The carrying amount of financial assets represents the maximum credit exposure. The maximum exposure to credit risk at the end of the reporting period was as follows.
Group
As at 31st March 2017 2016
Credit risk
Trade and other receivables 32,941 26,779
Less; Revenue on lease agreements recognized on straight line basis (22,033) (23,213)
10,908 3,556
Cash and cash equivalents 11,985 10,539
22,893 14,105
Trade receivables The Group’s exposure to credit risk on 'Trade receivables' is influenced mainly by the individual characteristics of each
customer, and primarily arising on the rent receivable from its tenants.
The Group has obtained refundable rental deposits from non-related party tenants, covering the rental income for a period of 3-6 months, which provides cover to the Group in the event of a default. Details of the Refundable rental and other deposits held by the Group as at the reporting date is as follows.
Group
As at 31st March 2017 2016
Refundable rental deposits
Carrying value 77,607 63,662
Face value 85,860 75,591
The sector also follows a careful credit evaluation process for new tenants before entering in to rent agreements with such parties.
The terms of the lease agreements provide that the tenants should pay rental in advance on a monthly basis, which provides further cover against a default.
31.1.2 The age analysis of trade receivables at the end of the reporting period that were not impaired was as follows.
Group
As at 31st March 2017 2016
Revenue on lease agreements recognized on straight line basis 22,033 23,213
1–30 days 160 85
31–90 days 2 -
22,195 23,298
31.1.3 There were no circumstances that would require impairment in respect of trade and other receivable as at the year end (2016- Nil).
Other receivables A significant component of other receivables of the Group comprises of deposits placed with suppliers in securing their
services, with whom the Group regularly transacts with and have dues outstanding against.

42 Equity One Limited | Annual Report 2016/2017
Cash and cash equivalents The Group held cash and cash equivalents of Rs.12mn as at 31st March 2017 (2016: Rs 10.5mn), which represents its
maximum credit exposure on these assets. The cash and cash equivalents are held with bank and financial institution counterparties, which are rated AAA(lka) to AA-(lka), based on Fitch Ratings.
Investments in Government securities primarily comprises of investments in government treasury bills, extending to a period less than 3 months.
Group
As at 31st March 2017 2016
Cash at Bank 11,985 10,539
11,985 10,539
31.2 Liquidity risk Liquidity risk is the risk that the Group will encounter difficulty in meeting the obligations associated with its financial
liabilities that are settled by delivering cash or another financial asset. The Group’s approach to managing liquidity is to ensure, as far as possible, that it will always have sufficient liquidity to meet its liabilities when due, under both normal and stressed conditions, without incurring unacceptable losses or risking damage to the Group’s reputation.
The Group monitors the level of expected cash inflows on trade and other receivables together with expected cash outflows on trade and other payables. This excludes the potential impact of extreme circumstances that cannot reasonably be predicted, such as natural disasters.
In addition, the Group has unutilised overdraft facility of Rs. 100mn as at 31st March 2017 and has access to short-term financing facilities extended from the parent company, Carson Cumberbatch PLC, if required.
31.2.1 The following are the remaining contractual maturities of financial liabilities as at the end of the reporting period:
As at 31st March 2017 Carrying Contractual cash flows
amount Total 3 months or less
4-12 months
1-2 years 2-5 years More than 5 years
Non-derivative financial liabilities
Refundable rental deposits 77,607 85,860 9,693 19,327 42,591 13,559 690
Trade Payables 1,205 1,205 1,205 - - - -
Other payables 35,186 35,186 9,446 9,290 9,450 7,000 -
113,998 122,251 20,344 28,617 52,041 20,559 690
As at 31st March 2016 Carrying Contractual cash flows
amount Total 3 months or less
4-12 months
1-2 years 2-5 years More than 5 years
Non-derivative financial liabilities
Refundable rental deposits 63,662 75,591 2,284 702 30,333 38,033 4,239
Trade Payables 547 547 547 - - - -
Other payables 43,656 43,656 12,323 13,783 16,200 1,350 -
Amount due to related Companies 80,674 80,674 80,674 - - - -
188,539 200,468 95,828 14,485 46,533 39,383 4,239
The amounts disclosed in the above table represent the contractual undiscounted cash out flows relating to non-derivative financial liabilities and which are usually not closed out before contractual maturity.
(All figures are in Sri Lankan Rupees thousands)Notes to the Financial Statements

43
31.2.2 Management of liquidity risk
The Group's approach to managing liquidity is to ensure, as far as possible, that it will always have sufficient liquidity to meet its liabilities when due, under both normal and stressed conditions, without incurring unacceptable losses or risking damage to the Group's reputation.
The Group maintains a portion of its assets in highly liquid form - demand deposits and placements in government securities in order to meet its contractual obligations during the normal course of its operations. As at the reporting date, the Group maintains " cash and cash equivalents" amounting to Rs. 12mn (2016 - Rs 10.5 mn).
The Company is of the view that the liabilities arise on the Refundable Rental Deposits with the expiration of the rent agreements in the forthcoming financial year, will be renewed by the respective tenants for a further tenure. Typically, the rent agreements of the Company are entered in to a period of two years with a renewal clauses.
In addition, the Group has unutilised overdraft facility in place of Rs. 100mn as at 31st March 2017 and has access to short-term financing facilities extended from the parent company, Carson Cumberbatch PLC, if required.
31.3 Market risk
Market risk is the risk that changes in market prices, such as foreign exchange rates and interest rates which will affect the Group’s income or the value of its financial instruments. The objective of market risk management is to manage and control market risk exposures within acceptable parameters, while optimizing the return.
31.3.1 Currency risk
Foreign currency risk is the risk that the fair value or future cash flows of a financial instrument will fluctuate, due to changes in foreign exchange rates. The Group do not engage in transactions associated with foreign currencies in its ordinary course of operations, hence the related risk is avoided. However, the Group is exposed to currency risk, primarily arising from its capital expenditure related transactions, if any.
Therefore a sensitivity analysis on the Groups currency risk exposure may not be representative of the risks for which the Group is exposed to given its incidental nature.
31.3.2 Interest rate risk
The Group's interest bearing financial assets / liabilities are factored on variable rates of interest, accordingly the Group's exposure to interest rate risk is given below, which is not significant.
Profile As at the end of the reporting period the interest rate profile of the Group’s interest-bearing financial instruments as reported
to the Management of the Group was as follows.
Group
As at 31st March 2017 2016
Variable rate instruments
Financial assets 1,161 897
1,161 897

44 Equity One Limited | Annual Report 2016/2017
Sensitive analysis for variable rate instruments A change of 1% in interest rates at the end of the reporting period would have increased / (decreased) equity and profit or
loss by the amounts shown below. This analysis assumes that all other variables remain constant.
Profit / (loss)
Group Increase Decrease
by 1% by 1%
31st March 2017
Variable rate instruments 12 (12)
31st March 2016
Variable rate instruments 9 (9)
31.4 Accounting classifications and fair values The Group do not designate any of its financial assets / liabilities at fair value, hence a classification required for fair value
hierarchy will not apply.
31.5 Fair value vs. Carrying amountAs at 31st March 2017 Fair value Held to Loans and Available Other Total Fair value
through maturity receivables for sale financial carrying
profit or loss
liabilities amount
Cash and cash equivalents - - 11,985 - - 11,985 11,985
Trade and other receivables - 32,941 - - 32,941 32,941
- - 44,926 - - 44,926 44,926
Refundable rental deposits - - - - 77,607 77,607 77,607
Trade and other payables - - - - 36,391 36,391 36,391
- - - - 113,998 113,998 113,998
As at 31st March 2016 Fair value Held to Loans and Available Other Total Fair value
through maturity receivables for sale financial carrying
profit or loss
liabilities amount
Cash and cash equivalents - - 10,539 - - 10,539 10,539
Trade and other receivables - 26,779 - - 26,779 26,779
- - 37,318 - - 37,318 37,318
Refundable rental deposits - - - - 63,662 63,662 63,662
Trade and other payables - - - - 124,877 124,877 124,877
- - - - 188,539 188,539 188,539
(All figures are in Sri Lankan Rupees thousands)Notes to the Financial Statements

45
31.6 Fair value hierarchy The table below analyses financial instruments carried at fair value, by the levels in the fair value hierarchy. The different levels have been defined as follows.
Level 1: Availability of quoted prices (unadjusted) in active markets for identical assets or liabilities.Level 2: Use of inputs other than quoted prices that are observable for the asset or liability, either directly
(i.e. as prices) or indirectly (i.e. derived from prices).Level 3: Use of inputs for the asset or liability that are not based on observable market data (unobservable inputs).
GroupNote Level 1 Level 2 Level 3 Total
As at 31st March 2017
Investment property 17 - - 3,216,396 3,216,396
As at 31st March 2016
Investment property 17 - - 3,211,500 3,211,500
There were no transfers between Level 1, Level 2 and Level 3 financial assets during the period under review ( 2016 - Nil).
Valuation techniques and significant unobservable inputs
The following table depicts the valuation techniques used in measuring level 3 fair values, as well as the significance unobservable inputs used.
The fair values of the properties were determined by an external independent property valuer with appropriate and recognised professional qualifications and recent experience in the location and category of the properties being valued.
The fair value measurements of all the properties have been categorised as Level 3 fair value, based on the input to the valuation technique used.
Description Location Valuation technique Significant Unobservable Inputs
Interrelationship between Key Unobservable Inputs and Fair Value Measurements
Land Colombo Market approach Market value of the land (Price per Perch).
Valuer has used a range of prices for respective lands based on their recently transacted cost.
Current market conditions and the comparable property prices have been used for the valuation.
The estimated fair value would increase/(decrease) if –
Market value per perch was higher/ (lower)
Building Colombo Contractor’s Method: The contractor’s method works on the basis that a property’s value can be equated to its cost. Valuer assess the cost of the building if it would have constructed in current year, and deduct margin for usage of the property-based on the year of construction.
Construction cost per square feet of a building.
Depreciation rate for the usage of assets.
The estimated fair value would increase/(decrease) if –
Cost per square feet was higher/(lower)
Depreciation rate for usage lower/(higher)

46 Equity One Limited | Annual Report 2016/2017
32 Related party transactions. The Company carried out transactions in the ordinary course of its business with parties who are defined as related parties
in Sri Lanka Accounting Standard 24 (LKAS 24) “Related party disclosures ”, the details of which are reported below.
32.1 Parent and ultimate controlling entity In the opinion of the Directors, Carson Cumberbatch PLC is the parent company of Equity One Limited and Bukit Darah PLC
is the Ultimate Parent and Controlling entity of Equity One Limited.
32.2 Transactions with Key Management Personnel (KMP) According to Sri Lanka Accounting Standard (LKAS 24) - “Related party disclosures”, Key Management personnel (KMP) are
those having authority and responsibility for planning and controlling the activities of the entity. Accordingly, the Directors of the Company (including executive and non-executive directors) have been classified as Key Management Personnel of the Company.
Group Company
For the year ended 31st March 2017 2016 2017 2016
32.2.1 Key management personnel compensation
Short-term employee benefits - Directors fees 1,100 1,100 650 700
- Nomination committee fees 58 100 58 100
Post-employment benefits - - - -
Termination benefits - - - -
Other long-term benefits - - - -
1,158 1,200 708 800
No other transactions have taken place during the year, other than those disclosed above, between the company and its KMP.
(All figures are in Sri Lankan Rupees thousands)Notes to the Financial Statements

47
32.3
Tran
sact
ion
s w
ith
rela
ted
com
pan
ies
Nam
e an
d th
e na
ture
of t
he re
latio
nshi
pN
ame/
s of
the
com
mon
D
irect
or/s
Nat
ure
of tr
ansa
ctio
nsVa
lue
of th
e tr
ansa
ctio
n
Gro
upCo
mpa
ny20
1720
1620
1720
16
Pare
nt c
ompa
nyCa
rson
Cum
berb
atch
PLC
D. C
. R. G
unaw
arde
naSe
ttlem
ents
mad
e on
shor
t-ter
m a
dvan
ces
obta
ined
80,
674
40,
500
80,
674
40,
500
Subs
idia
ries
Equi
ty Tw
o PL
CD.
C. R
. Gun
awar
dena
Settl
emen
ts m
ade
on sh
ort-t
erm
adv
ance
s ob
tain
ed in
clud
ing
inte
rest
-
-
16,
654
36,
250
K. C
. N. F
erna
ndo
A.P.
Wee
ratu
nge
Inte
rest
rece
ived
on
shor
t-ter
m a
dvan
ces
prov
ided
-
-
797
2
,925
E.
H. W
ijena
ike
P. D.
D. F
erna
ndo
Divi
dend
rece
ived
-
-
39,
647
4,9
56
Equi
ty Th
ree
(Priv
ate)
Lim
ited
K. C
. N. F
erna
ndo
Shor
t-ter
m a
dvan
ces o
btai
ned
-
-
9,8
70
5,5
00
Settl
emen
ts m
ade
on sh
ort-t
erm
adv
ance
s ob
tain
ed
-
-
12,
370
9,5
12
Divi
dend
rece
ived
-
-
1
4,58
0 9
,720
Fe
llow
subs
idia
ries
Cars
ons M
anag
emen
t Ser
vice
s (Pr
ivat
e)
Lim
ited
(CM
SL)
K. C
. N. F
erna
ndo
A.
P. W
eera
tung
eSu
ppor
t ser
vice
fee
paid
9
,174
7
,665
4
,337
3
,784
Se
cret
aria
l fee
s pai
d 8
78
878
4
11
411
Co
mpu
ter c
harg
es p
aid
5
82
582
3
06
306
Re
ntal
inco
me
rece
ived
2
5,20
0 2
3,58
1 8
,100
8
,100
Pa
rkin
g fe
es re
ceiv
ed54
031
4-
-
Guar
dian
Fund
Man
agem
ent L
imite
dA.
P. W
eera
tung
eRe
ntal
inco
me
rece
ived
5
,693
5
,176
-
-
Pa
rkin
g fe
es re
ceiv
ed18
016
0-
-
Re
nt c
harg
ed fr
om re
late
d co
mpa
nies
are
bas
ed o
n th
e re
nt a
gree
men
ts s
igne
d be
twee
n th
e re
spec
tive
com
pani
es o
n an
arm
's le
ngth
bas
is.
Su
ppor
t ser
vice
fees
and
oth
er e
xpen
ses
char
ged
are
base
d on
the
resp
ectiv
e se
rvic
es p
rovi
ded
by C
arso
ns M
anag
emen
t Ser
vice
s (P
rivat
e) L
imite
d (C
MSL
) as
per t
he s
ervi
ce a
gree
men
ts s
igne
d be
twee
n th
e co
mpa
nies
on
an a
rm's
leng
th b
asis
.
Re
late
d co
mpa
ny le
ndin
g ha
ve b
een
char
ged
inte
rest
at A
WPL
R +
1% ,
whe
re a
pplic
able
.
A
mou
nt b
orro
wed
by
the
com
pany
from
Car
son
Cum
berb
atch
PLC
is o
n in
tere
st fr
ee b
asis
.

48 Equity One Limited | Annual Report 2016/2017
Group Company
As at 31st March 2017 2016 2017 2016
32.4 Amounts due from related companiesEquity Two PLC - - - 15,857
- - - 15,857
32.5 Amounts due to related companiesCarson Cumberbatch PLC - 80,674 - 80,674 Equity Three (Private) Limited - - - 2,500
- 80,674 - 83,174
32.6 Group entities % of equity interest
As at 31st March 2017 2016
Equity Two PLC 88.8% 88.8%
Equity Three (Private) Limited 100.0% 100.0%
32.7 Transactions, Arrangements and Agreements involving KMP and their close family members (CFM)CMF of a KMP are those family members who be expected to influence, or be influenced by that individual in their dealings with the entity. They may include;
(a) the individual’s domestic partner and children;
(b) children of the individual’s domestic partner; and
(c) dependents of the individual or the individual’s domestic partner's CFM are related parties to the entity.
There were no transactions with CMF during the year.
33 Dividend per shareCompany
For the year ended 31st March 2017 2016
Dividends paid during the year
Final / Interim dividends 36,290 6,048 Dividends proposed during the year
First interim dividend
Total dividends 30,242 - Dividend per share (Rs.) 0.75 -
Proposed final dividend*Total dividend - 6,048 Total dividend per share (Rs.) 0.75 0.15
*The propose dividends are subject to the approval by the shareholders. According to Sri Lanka Accounting Standard (LKAS 10) - "Events after the reporting period", the liabilities on propose dividends will not be provided for in the financial statements.
(All figures are in Sri Lankan Rupees thousands)Notes to the Financial Statements

49
34 Events after the reporting date.Subsequent to the reporting period, no circumstances have arisen which would require adjustments to or disclosures in the financial statements.
35 Comparative Figures Previous period's figures and phrases have been re-arranged wherever necessary to conform to the current period's
presentation.
Support service fees Considering the nature of the transactions Support service fees have been reclassified under the administrative expenses.
Accordingly the comparative figures have been reclassified to provide a better presentation as required by LKAS 8 - Accounting Policies, Changes in Accounting Estimates and Errors. Accordingly the Financial statements impact is given below.
Group Company
As at 31st March Direct costs Administrative and otheroperating expenses
Direct costs Administrative and otheroperating expenses
As previously reported in the published financial statements for the year ended 31st March 2016
73,958 19,060 39,123 10,570
Adjustments made on Support service fees (5,224) 5,224 (2,261) 2,261 Adjusted balance in the published financial statements for the year ended 31st March 2017 68,734 24,284 36,862 12,831
36 Directors' responsibilityThe Board of Directors is responsible for the preparation and presentation of these financial statements. This is more fully described under the relevant clause in the Director's Report.
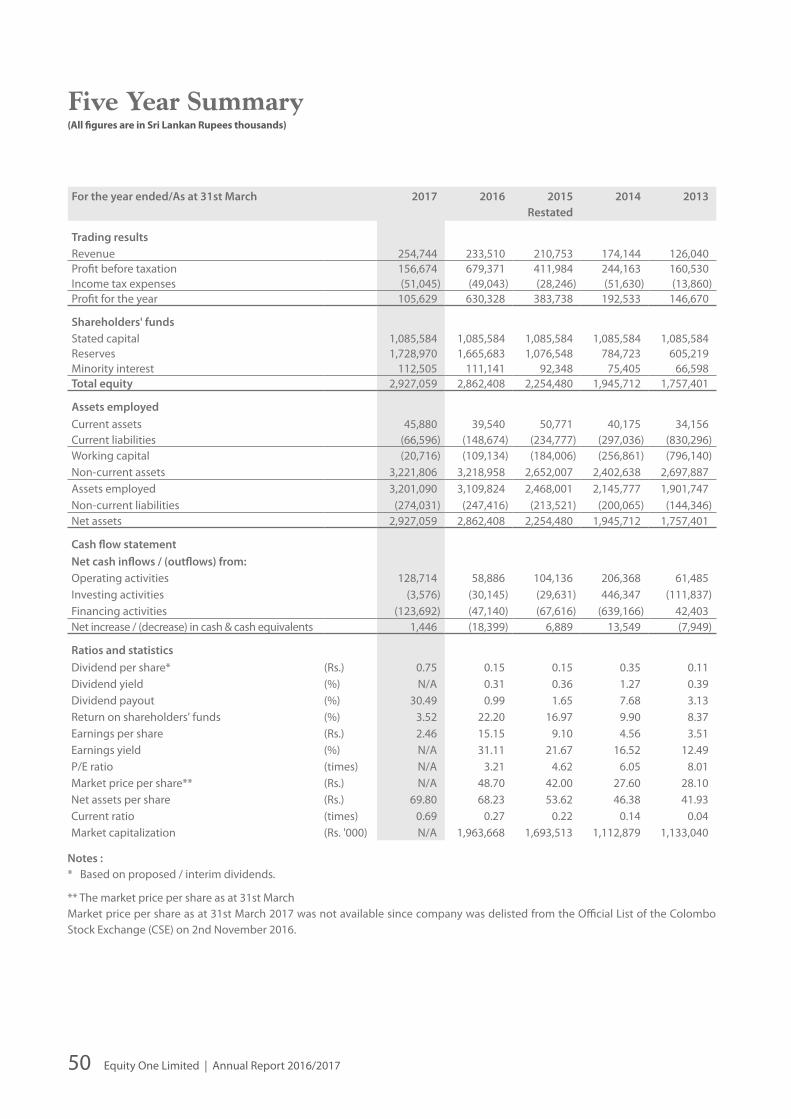
50 Equity One Limited | Annual Report 2016/2017
Five Year Summary(All figures are in Sri Lankan Rupees thousands)
For the year ended/As at 31st March 2017 2016 2015Restated
2014 2013
Trading resultsRevenue 254,744 233,510 210,753 174,144 126,040 Profit before taxation 156,674 679,371 411,984 244,163 160,530 Income tax expenses (51,045) (49,043) (28,246) (51,630) (13,860)Profit for the year 105,629 630,328 383,738 192,533 146,670
Shareholders' fundsStated capital 1,085,584 1,085,584 1,085,584 1,085,584 1,085,584 Reserves 1,728,970 1,665,683 1,076,548 784,723 605,219 Minority interest 112,505 111,141 92,348 75,405 66,598 Total equity 2,927,059 2,862,408 2,254,480 1,945,712 1,757,401
Assets employed
Current assets 45,880 39,540 50,771 40,175 34,156 Current liabilities (66,596) (148,674) (234,777) (297,036) (830,296)Working capital (20,716) (109,134) (184,006) (256,861) (796,140)Non-current assets 3,221,806 3,218,958 2,652,007 2,402,638 2,697,887 Assets employed 3,201,090 3,109,824 2,468,001 2,145,777 1,901,747 Non-current liabilities (274,031) (247,416) (213,521) (200,065) (144,346)Net assets 2,927,059 2,862,408 2,254,480 1,945,712 1,757,401
Cash flow statement
Net cash inflows / (outflows) from:Operating activities 128,714 58,886 104,136 206,368 61,485 Investing activities (3,576) (30,145) (29,631) 446,347 (111,837)Financing activities (123,692) (47,140) (67,616) (639,166) 42,403 Net increase / (decrease) in cash & cash equivalents 1,446 (18,399) 6,889 13,549 (7,949)
Ratios and statistics
Dividend per share* (Rs.) 0.75 0.15 0.15 0.35 0.11 Dividend yield (%) N/A 0.31 0.36 1.27 0.39 Dividend payout (%) 30.49 0.99 1.65 7.68 3.13 Return on shareholders' funds (%) 3.52 22.20 16.97 9.90 8.37 Earnings per share (Rs.) 2.46 15.15 9.10 4.56 3.51 Earnings yield (%) N/A 31.11 21.67 16.52 12.49 P/E ratio (times) N/A 3.21 4.62 6.05 8.01 Market price per share** (Rs.) N/A 48.70 42.00 27.60 28.10 Net assets per share (Rs.) 69.80 68.23 53.62 46.38 41.93 Current ratio (times) 0.69 0.27 0.22 0.14 0.04 Market capitalization (Rs. '000) N/A 1,963,668 1,693,513 1,112,879 1,133,040
Notes :* Based on proposed / interim dividends.
** The market price per share as at 31st MarchMarket price per share as at 31st March 2017 was not available since company was delisted from the Official List of the Colombo Stock Exchange (CSE) on 2nd November 2016.

51
Notice of Meeting
NOTICE IS HEREBY GIVEN that the THIRTY FIFTH Annual General Meeting of EQUITY ONE LIMITED will be held on Friday, the 16th day of June 2017 at 2.30 p.m. at the 8th Floor, No.65C, Dharmapala Mawatha, Colombo 7, Sri Lanka for the following purposes:
1. To receive and adopt the Annual Report of the Board of Directors and the Financial Statements for the year ended 31st March 2017, together with the Report of the Independent Auditors thereon.
2. To re-elect Mr.A.P. Weeratunge who retires by rotation in terms of Articles 72, 73 and 74 of the Articles of Association of the Company.
3. To re-appoint Mr. P.D.D. Fernando as a Director of the Company who is over Seventy years of age and to consider and if deemed fit to pass the following Resolution :
“IT IS HEREBY RESOLVED that the age limit stipulated in Section 210 of the Companies Act No. 07 of 2007 shall not be applicable to Mr. P.D.D. Fernando who is 74 years of age and that he be re-appointed as a Director of the Company from the conclusion of the Annual General Meeting for a further period of one year.”
4. To re-appoint Mr.K.C.N. Fernando as a Director of the Company who is Seventy years of age and to consider and if deemed fit to pass the following Resolution :
“IT IS HEREBY RESOLVED that the age limit stipulated in Section 210 of the Companies Act No. 07 of 2007 shall not be applicable to Mr.K.C.N. Fernando who is 70 years of age and that he be re-appointed as a Director of the Company from the conclusion of the Annual General Meeting for a further period of one year.”
5. To re-appoint Messrs. KPMG, Chartered Accountants as Auditors of the Company as set out in Section 154 (1) of the Companies Act No. 07 of 2007 and to authorize the Directors to determine their remuneration.
By Order of the Board
(Sgd.)K.D. De Silva (Mrs.)DirectorCarsons Management Services (Private) LimitedSecretaries
Colombo15th May 2017
Notes
1. A shareholder is entitled to appoint a proxy to attend and vote instead of him/her. A proxy need not be a shareholder of the Company. A Form of Proxy accompanies this notice.
2. The completed Form of Proxy must be deposited at the Registered Office, No.61, Janadhipathi Mawatha, Colombo 1, Sri Lanka not later than 4.45 p.m. on 14th June 2017.
3. A person representing a corporation is required to carry a certified copy of the resolution authorising him/her to act as the representative of the corporation. A representative need not be a shareholder.
4. The transfer books of the Company will remain open.5. Security check We shall be obliged if the shareholders/proxies attending the Annual General Meeting, produce their National Identity Card
to the security personnel stationed at the entrance.

52 Equity One Limited | Annual Report 2016/2017
Notes

53

54 Equity One Limited | Annual Report 2016/2017
Notes

55
Form of Proxy
*I/We .........................................................................................................................................................................................................................................................
of ................................................................................................................................................................................................................................................................
being *a Shareholder/Shareholders of EQUITY ONE LIMITED
hereby appoint .....................................................................................................................................................................................................................................
.....................................................................................................................................................................................................................................................................
of ................................................................................................................................................................................................................................................................
bearing NIC No./Passport No .............................................................................................................. or failing him/her
Don Chandima Rajakaruna Gunawardena or failing him,
Kurukulasuriya Calisanctus Nalake Fernando or failing him,
Eranjith Harendra Wijenaike or failing him,
Ajith Prashantha Weeratunge or failing him,
Subramaniam Mahendrarajah or failing him,
Panthiage Donald Dunstan Fernando
as *my/our proxy to attend at the Thirty Fifth Annual General Meeting of the Company to be held on Friday, the 16th day of June 2017 at 2.30 p.m., at the 8th Floor, No. 65C, Dharmapala Mawatha, Colombo 07, Sri Lanka and at any adjournment thereof and at every poll which may be taken in consequence thereof.
1. To adopt the Annual Report of the Board of Directors and the Financial Statements for the year ended 31st March 2017, together with the Report of the Independent Auditors thereon.
2. To re-elect Mr.A.P. Weeratunge who retires by rotation in terms of Articles 72, 73 and 74 of the Articles of Association of the Company.
3. To re-appoint Mr. P.D.D. Fernando who is over Seventy years of age as a Director of the Company.
4. To re-appoint Mr.K.C.N. Fernando who is Seventy years of age as a Director of the Company.
5. To re-appoint Messrs. KPMG, Chartered Accountants as Auditors of the Company as set out in Section 154 (1) of the Companies Act No. 07 of 2007 and to authorize the Directors to determine their remuneration.
Signed this.....................day of ……………..…………..………..Two Thousand and Seventeen.
........................................................ Signature/s
Note:a) * Please delete the inappropriate words.b) A shareholder entitled to attend and vote at a General Meeting of the Company, is entitled to appoint a proxy to attend and
vote instead of him/her and the proxy need not be a shareholder of the Company. A proxy so appointed shall have the right to vote on a show of hands or on a poll and to speak at the General Meeting of the shareholders.
c) A shareholder is not entitled to appoint more than one proxy to attend on the same occasion.d) Instructions are noted on the reverse hereof.
For Against

Corporate Information
Name of the CompanyEquity One Limited(A Carson Cumberbatch Company)
Company Registration No.PQ 19 PB
Legal FormA Public Company with Limited Liability Incorporated in Sri Lanka in 1981
Parent and Controlling Entity In the opinion of the Directors, Carson Cumberbatch PLC is the Parent Company of Equity One Limited and Bukit Darah PLC is the Ultimate Parent and Controlling Entity of Equity One Limited.
DirectorsD. C. R. Gunawardena (Chairman)S. Nagendra (resigned w.e.f. 10th November 2016)K. C. N. FernandoE. H. WijenaikeA. P. WeeratungeS. MahendrarajahP.D.D. Fernando
Place of BusinessNo. 65C, Dharmapala Mawatha, Colombo 7, Sri Lanka.
BankersCiti Bank NAStandard Chartered BankHatton National Bank PLC Commercial Bank of Ceylon PLC Deutsche Bank AG
AuditorsMessrs. KPMG Chartered Accountants,No. 32A, Sir Mohamed Macan Marker Mawatha, Colombo 03, Sri Lanka.
Managers & SecretariesCarsons Management Services (Private) Limited No. 61, Janadhipathi Mawatha,Colombo 01, Sri Lanka. Telephone No: +94-11-2039200Fax No: +94-11-2039300
Registered O�ceNo.61, Janadhipathi Mawatha, Colombo 01, Sri Lanka. Telephone No: +94-11-2039200Fax No: +94-11-2039300
Corporate Websitewww.carsoncumberbatch.com
Designed & produced by
Printed by Printage (Pvt) Ltd

56 Equity One Limited | Annual Report 2016/2017
INSTRUCTIONS AS TO COMPLETION
1. Kindly perfect the form of proxy after filling in legibly your full name and address and sign in the space provided. Please fill in the date of signature.
2. If you wish to appoint a person other than the Directors as your proxy, please insert the relevant details in the space provided overleaf.
3. In terms of Article 54 of the Articles of Association of the Company:
1. Any shareholder entitled to attend and vote at a meeting shall be entitled to appoint another person (whether a Shareholder or not) as his proxy to attend and vote instead of him. A proxy so appointed shall have the same right as the Shareholder to vote on a show of hands or on a poll and to speak at the meeting.
2. An instrument appointing a proxy shall be in writing and:
a) in the case of an individual shall be signed by the appointor or by his attorney; and
b) in the case of a corporation shall be either under the common seal or signed by its attorney or by an authorized officer on behalf of the corporation
4. In terms of Article 50 of the Articles of Association of the Company:
Where there are joint registered holders of any Share any one (01) of such persons may vote and be reckoned in a quorum at any meeting either personally or by Proxy as if he were solely entitled thereto and if more than one (01) of such joint holders be so present at any meeting one (01) of such persons so present whose name stands first in the Register in respect of such Share shall alone be entitled to vote in respect thereof. Several executors or administrators of a deceased Shareholder in whose name any Share stands shall for the purpose of this Article be deemed joint holders thereof.
5. To be valid the completed form of proxy should be deposited at the Registered Office of the Company situated at No. 61, Janadhipathi Mawatha, Colombo 01, Sri Lanka not later than 4.45 p.m. on 14th June 2017.
Please fill in the following details
Name : …………………………………………………………. Address : ………………………………………………………….
…………………………………………………………. Jointly with : ………………………………………………………….
Share Folio No. : ………………………………………………………….
