equity in early learning opportunitieskirwaninstitute.osu.edu/reports/2011/06_2011_early...equity in...
TRANSCRIPT

Equity in Early Learning Opportunities: Examining the Roles of Place, Space, and Race
Exploratory Spatial Analysis of Availability of High-Quality Early Care and Education Centers,
Neighborhood Opportunities, and Race-, Ethnicity- and Nativity-Based Differences
in Selected U.S. States
Conference Paper Prepared for The Federal Reserve Bank of Cleveland
2011 Policy Summit June 2011
Dolores Acevedo-Garcia and Erin Hardy Northeastern University, Institute on Urban Health Research
diversitydata-kids Project, with funding from the W.K. Kellogg Foundation
Jason Reece and Samir Gambhir The Kirwan Institute For the Study of Race and Ethnicity
at Ohio State University
Special Thanks to Craig Ratchford, Ohio State University; Liz Colombo, Ohio State University; Theresa Osypuk, Northeastern University; Nancy McArdle, Northeastern University;
Pam Joshi, Northeastern University.

Abstract
Two recent high-profile Federal policy initiatives--Promise Neighborhoods and Choice Neighborhoods--aim to transform neighborhoods of concentrated poverty into communities of opportunity. Implicit in their policy designs are two well-supported ideas that have emerged from over a decade of research--that improved neighborhood contexts can positively influence child health and development, and that high-quality early care and education centers (including child care centers and preschools) serve as critical developmental resources within neighborhoods. While the evidence is clear about the positive effects of high-quality early education and the negative effects of poor neighborhood contexts on disadvantaged children, little is known about the extent to which disparities in early childhood education arise from limited access at the neighborhood level. The present study focuses on equity in early opportunities to learn and aims to advance our understanding of the roles that place, space and race play in shaping access to early learning experiences. The place-focused analysis explores the relationship between the presence of high-quality early care and education (ECE) programs and other aspects of neighborhood opportunity (defined as environmental conditions or resources that are conducive to healthier, vibrant communities and that are likely to help families in a community succeed--e.g. high-quality schools, healthy food access, proximity to employment). This is the first study of its kind to focus on “high-quality” ECE programs--defined as programs that are nationally accredited and that go beyond providing a healthy and safe environment to also providing a developmentally rich learning environment. The space-focused analysis examines whether the opportunity level in nearby (adjacent) neighborhoods is associated with a given neighborhood’s availability of high-quality ECE services. The race-focused analysis examines the distribution of children of varying race, ethnic and nativity groups across different types of neighborhoods, in terms of both neighborhood opportunity level and neighborhood access to a high-quality ECE center. Results in two states, Massachusetts and Ohio, are compared. The place-focused analysis suggests that likelihood of presence of a high-quality ECE center does not monotonically increase with neighborhood opportunity level, and the relationship between presence of an ECE center and neighborhood opportunity varies by state. The space-focused analysis finds that when high-quality ECE providers locate in very low opportunity neighborhoods, those neighborhoods tend to be in areas of spatially concentrated disadvantage--not in neighborhoods that are proximal to higher opportunity areas. The race-focused results reveal very large numbers of racial and ethnic minority children living in neighborhoods that we consider most detrimental to development--opportunity poor neighborhoods that also lack access to high-quality ECE resources. That said, many more racial and ethnic minority children living in otherwise opportunity poor neighborhoods have a high-quality ECE center in their neighborhood in Massachusetts as compared to Ohio. Results suggest the importance of using specific measures of developmental resources, as opposed to proxy measures such as neighborhood poverty, to capture the extent of inequities in the distribution of developmentally supportive settings for children. The results also suggest that local policy context may play an important role in shaping the distribution of neighborhood ECE resources for children, and evidence from Massachusetts suggests that high-quality ECE resources can be made available in otherwise opportunity poor neighborhoods.

Table of Contents Introduction ................................................................................................................................................. 1
Background ................................................................................................................................................. 5
Methods ...................................................................................................................................................... 21
Results ........................................................................................................................................................ 30
Discussion .................................................................................................................................................. 65
Maps ........................................................................................................................................................... 71
References .................................................................................................................................................. 87
1
I. INTRODUCTION
Two recent high-profile Federal policy initiatives--Promise Neighborhoods and Choice
Neighborhoods--aim to transform neighborhoods of concentrated poverty into communities of
opportunity. Implicit in their policy designs are two well-supported ideas that have emerged
from over a decade of research--that improved neighborhood contexts can positively influence
child health and development, and that high-quality early care and education centers (including
child care centers and preschools) serve as critical developmental resources within
neighborhoods. On the early childhood side, these policies are informed by scientific research
documenting the importance of positive early experiences for brain development and subsequent
capacity to learn (National Research Council and Institute of Medicine, 2000; Hackman & Farah,
2009), and by social science literature demonstrating the strong positive and cost-effective
impacts that high-quality early education programs can have, particularly for disadvantaged
children (Schweinhart et al., 2005; Kirp, 2004; Campbell & Ramey, 1995; Ramey et al., 2000;
Heckman, 2000; Barnett, 1993). They also aim to address racial/ethnic disparities found in
access to high-quality early learning opportunities (Magnuson & Waldfogel, 2005). On the
place-based/neighborhood transformation side, their designs are motivated by a substantial body
of evidence about how neighborhood contextual factors (e.g. neighborhood poverty rates,
joblessness, crime, degree of racial residential segregation) affect child health and development
(for a review see Acevedo-Garcia et al., 2010). While the evidence is clear about the positive
effects of high-quality early education and the negative effects of poor neighborhood contexts on
disadvantaged children, little is known about the extent to which disparities in early childhood
education arise from limited access at the neighborhood level.
The present study focuses on equity in early opportunities to learn and aims to advance
our understanding of the roles that place, space and race may play in shaping access to early

2
learning experiences. Our analysis is therefore comprised of three main lines of inquiry relating
to place, space and race, respectively.
First, we explore the relationship between the presence of high-quality early care and
education (ECE) programs and other dimensions of neighborhood opportunity (PLACE).
Neighborhood opportunity is defined as environmental conditions or resources that are
conducive to healthier, vibrant communities and that are likely to help families in a community
succeed. Neighborhood contextual factors (e.g. concentration of poverty, joblessness, racial
residential segregation, crime), environmental factors (e.g., housing quality, transportation), and
the quality of institutional resources (e.g. school quality) all factor into neighborhood opportunity
levels. We examine the extent to which children living in otherwise “opportunity poor”
neighborhoods are also deprived of a high-quality ECE center--a critically important resource
that can potentially offset some of the accumulative detrimental effects of living in an
impoverished neighborhood. Past studies have shown that neighborhoods with high poverty
concentrations are not necessarily deprived of early childhood care and education resources, but
these studies have not focused on high-quality ECE centers. For purposes of this study, a “high-
quality” ECE center is one that meets national accreditation standards and goes beyond
providing a healthy, safe and clean place for children to spend time, to providing a
developmentally rich early learning environment that prepares children for school entry and later
success.
A second line of inquiry--made possible with the spatial methods employed in this study-
-is the examination of whether the opportunity level in nearby (contiguous or adjacent)
neighborhoods is associated with a given neighborhood’s availability of high-quality ECE
services (SPACE). For example, we can examine the availability of high-quality ECE centers in
neighborhoods that experience spatially concentrated disadvantage (defined as a very low
3
opportunity neighborhood that is also surrounded only by other very low opportunity
neighborhoods) compared to very low opportunity neighborhoods that are surrounded by higher
opportunity neighborhoods (see Figure 1 for visual representation of these neighborhood spatial
configurations). Prior research has shown that some indicators of opportunity, such as
neighborhood crime rates, are influenced not only by the socioeconomic profile of the
neighborhood in question but also by the clustering of socioeconomic disadvantage in adjacent
neighborhoods (Krivo & Peterson, 1996). Our spatial analysis focuses on very low opportunity
neighborhoods that have high-quality ECE centers. Are these neighborhoods typically
surrounded by other disadvantaged neighborhoods or are they surrounded by higher opportunity
neighborhoods? These spatial patterns provide information about the types of low opportunity
neighborhoods that high-quality ECE providers tend to locate in, which has important
implications for policy. We expect that spatial patterns and locational tendencies will vary with
variations in state policy contexts.
Figure 1. Contrasting hypothetical spatial patterns of neighborhood opportunity and ECE center presence
Neighborhood with high-quality ECE services Very low opportunity neighborhood Moderate opportunity neighborhood High opportunity neighborhood
A tendency for high-quality services to be located in areas of spatially concentrated
disadvantage
A tendency for high-quality services to be located in very low opportunity areas whose
neighbors are areas of higher opportunity

4
Our third line of inquiry examines the distribution of children of varying race, ethnic
and nativity groups across different types of neighborhoods, in terms of both neighborhood
opportunity level and neighborhood access to a high-quality ECE center (RACE). While many
studies have documented pervasive patterns of contextual inequality (Logan 2002a and 2002b;
Logan et al., 2001; Massey, 2001 and 2004; Massey, 2008; Massey, Condran & Denton, 1987;
Massey & Fischer, 2000), few studies present evidence that captures what we believe to be a
central issue—the extent to which access to supportive developmental contexts is unequal. The
race-focused analysis in this study therefore aims to document the magnitude and nature of any
inequities between groups and describe the extent to which racial and ethnic minority and
immigrant children are concentrated in the areas we consider most detrimental to development--
very low opportunity neighborhoods with no high-quality ECE providers.
This study utilizes data from the National Association for the Education of Young
Children (NAEYC), a leading national early care and education (ECE) program accreditation
body, to identify the locations of high-quality ECE providers. These data are then combined
with spatial data to construct a neighborhood-level indicator: presence of at least one high-
quality ECE center in neighborhood (neighborhoods are defined as census tracts). We then use
this neighborhood-level indicator to explore the relationship between presence of a high-quality
ECE center in a neighborhood and other dimensions of the neighborhood opportunity structure.
We explore spatial hypotheses using an exploratory spatial data analysis framework and also
examine the distribution of children of varying race, ethnicity and nativity groups across
different neighborhood types (in terms of opportunity and presence of a high-quality ECE
center). Separate analysis is conducted for Head Start centers given the increased likelihood that
racial and ethnic minority and immigrant families will attend those (versus privately funded)

5
programs. Pilot results from two states, Massachusetts and Ohio, are discussed1. By contrasting
results in two states, Massachusetts and Ohio, we are able to generate further testable hypotheses
about how the role of place, space and race in shaping early learning opportunities may vary
between U.S. states.
II. BACKGROUND
This study sits at the intersection of several lines of work that cross disciplines. This
background discussion aims to bring together key findings and hypotheses from these disparate
lines of work as they relate to the present study. We start by briefly summarizing the research
describing the connection between early childhood care and education programs and child
outcomes. We then explain why neighborhood access to ECE programs is important and then
discuss what is known about racial/ethnic disparities in access to ECE programs. Next, we
describe what is known about neighborhood contexts and the availability of ECE centers, and
then summarize literature about the spatial distribution and properties of both neighborhood
opportunity levels and child care markets. Finally, we discuss our rationale for focusing on high-
quality ECE programs.
Relevance of ECE Programs for Child Outcomes
Scores of studies have documented that racial and ethnic minority children in the U.S., on
average, arrive at kindergarten and first grade with lower levels of (cognitive and socio-
emotional) school readiness than their white peers. Therefore, we have learned that the well-
documented, race/ethnicity-based gaps in U.S. educational outcomes are attributable, in part, to
differences in children’s experiences in their first five years of life (birth to school entry). This
1 Analysis of the 10 most populous states and (eventually) national analysis are planned as follow-up analyses to this pilot work.

6
period is a critical time for the behavioral, socio-emotional and cognitive development of
children and research has documented how differences in family structure, parental education,
occupation and income--which occur along racial lines in the U.S.--affect children’s early
experiences. A classic example of how family resources can affect child development is
demonstrated by the Hart and Risley (1995) study that documents the very large difference in the
number of words spoken and the extensiveness of the vocabulary used by white middle-class
parents compared to poor African American parents when talking to their preschoolers. By 36
months of age, African American children’s vocabularies are significantly smaller than whites’
and other studies have shown that these differences persist through the time of school entry (with
black 6 yr olds’ vocabularies equal to white 5 year olds’ at school entry). In terms of vocabulary
development, black children are essentially a full year behind white children even before they
arrive at school (Phillips, Crouse, & Ralph, 1998).
For children who lack sufficiently developmentally supportive family, home and
neighborhood contexts, ECE programs play a role of increased importance in shaping early
developmental experiences (and subsequent outcomes). Research has shown that children who
attend center-based ECE programs have, on average, higher levels of school readiness. An
evidence base drawing from experimental research asserts that participation in high-quality child
care and preschool programs has substantial short-term benefits that likely lead to long-term
gains as children progress through school in into adulthood (Schweinhart, 2004; Kirp, 2004;
Campbell & Ramey, 1995; Ramey et al., 2000). High-quality ECE programs, particularly those
that primarily enroll economically vulnerable and racial/ethnic minority children, and provide a
rich developmental curriculum (often in combination with health and family support services and
parenting education) have been shown to enhance children’s cognitive development and
academic skills at school entry (Barnett, 1995; Currie, 2001; Karoly et al. 1998; Waldfogel,

7
2002). In addition, a study of the Infant Health and Development Program (IHDP)--a full time
high-quality program for low birth weight children ages birth to three--was shown to have short-
term positive effects on children’s behavior (Ramey et al., 1992; McCarton et al., 1997).
Magnuson & Waldfogel (2005) estimate that making preschool enrollment universal for three-
and four- year-old children in poverty and increasing the quality of care could close up to 20
percent of the black-white school readiness gap and up to 36 percent of the Hispanic-white gap.
Relevance of local availability of ECE services
As the number and proportion of racial and ethnic minority and immigrant children
steadily grows in the U.S., so does our need for proven approaches to closing the gaps in school
readiness that form between birth and school entry. Given evidence that high-quality ECE
programs boost school readiness, the participation of racial and ethnic minority and immigrant
children in high-quality ECE programs is of increased importance since these children are at
greater risk of lagging their peers at school entry (and beyond) and may be less likely to have
other developmentally supportive settings to turn to in lieu of a high-quality ECE program.
Studies of participation in center-based care and preschool programs suggest that local
availability of centers influences participation decisions, and that proximity and availability may
be of heightened importance for the most disadvantaged families that typically face multiple
structural and cultural barriers to access (e.g. impoverished immigrant families who face
language and other cultural barriers, or families who lack access to a car). These findings are
consistent with economic models of program participation centered on the idea that people will
participate in programs when the benefits outweigh the costs. Spatial accessibility (or local
availability) reduces costs in the form of travel time, transportation expenditures and foregone
earnings. Therefore, communities with less spatial accessibility to services face higher costs that
may translate into greater constraints on program participation.

8
Two recent studies provide direct evidence of the influence of spatial accessibility/local
availability on program participation and take-up of ECE services. In a study of the influence of
local availability of Head Start centers on immigrant child participation, Neidell and Waldfogel
(2009) find that having a Head Start center in a child’s census tract significantly raises
participation of immigrant children (roughly 10 percentage points), and that the impacts are
larger for recent migrants and for those with less access to private transportation. These results
suggest that local availability of Head Start centers may influence take-up by providing
information about availability, since the visible presence of the center provides information and
since information about local resources is likely to flow through locally-based social networks.
This may be especially relevant for non-English speaking immigrants who rely on social
networks for information (See Bertrand et al., 2000). The results also suggest that local
availability may influence take-up by reducing transportation burdens that serve as barriers to
participation among families without vehicles. A second recent study using spatial methods
(Herbst & Tekin, 2010) found that an increase in the distance to a social service agency reduces
the likelihood that a family receives a Child Care and Development Fund (CCDF) child care
subsidy. Distance to an agency had a greater impact on subsidy participation among families
with higher transportation costs (those residing in low car ownership neighborhoods) than those
with lower transportation costs (those residing in high car ownership neighborhoods).
Another reason to consider the importance of local ECE availability is that ECE centers
can be fairly categorized as true neighborhood resources in the sense that their clients are often
neighborhood residents and that parents strongly prefer centers in their own neighborhoods
(Small & Stark, 2005). This is certainly true of Head Start centers since children must attend the
Head Start center in their home census tract if one exists. Also, Small and Stark (2005) point to
a Maryland parent survey suggesting that parents prefer a childcare center near their home, and

9
proximity was the most important factor associated with formal childcare use--even more
important than quality, cost or hours of operation (Maryland Committee for Children, 2003).
Evidence also suggests that preferences for local centers may be even stronger among low-
income parents. A U.S. Department of Education study found that nearly 70 percent of low-
income parents rate conveniently located services as very important to their child care decisions,
compared to 50 percent among high-income parents (U.S. Department of Education, 1995).
Another important consideration is the influence of local availability and proximity on
consistency of program attendance. Particularly for Head Start and other publicly-funded
programs that are typically oversubscribed (since they are appropriation funded and often reach
enrollment limits in high demand areas) consistent attendance is often required for a child to
maintain his or her seat in the program. By reducing transportation barriers, local availability
may improve a family’s chances of getting its child to the ECE center on time on a regular basis,
reducing the likelihood that the child gets dismissed from a program on the grounds of low
attendance (Neidell & Waldfogel, 2009).
Beyond the importance of local availability for program participation, early care and
education centers are among the most important community institutions in distressed
neighborhoods, making their local presence an important part of the fabric of the neighborhood
environment. ECE centers are often visited by parents twice a day, for purposes of drop off and
pickup, where parents have opportunities to interact with staff (who may also be parents from the
community in Head Start centers in particular; See Zigler & Styfco, 2010) and other parents from
the local community, making the ECE center a potentially supportive context for parents as well
as children. In addition, high-quality ECE centers are required to establish and maintain
collaborative relationships with children’s families, often offering parenting classes and
extending services like health screenings to parents, and are required to establish and maintain

10
reciprocal relationships with agencies and other institutions in the community, making them
important access points for additional services, particularly in low-income communities.
According to social disorganization theorists (Wilson, 1987 and 1996), stable institutions are
likely to be scarce in impoverished neighborhoods, making the incremental importance of any
one stable institution even greater in neighborhoods that may be otherwise resource-deprived.
For the reasons described above, local availability of high-quality ECE centers is the
most relevant dimension of access to examine for these types of services as it relates to their
potential to facilitate program participation and to help close school readiness gaps. The focus
on local availability of high-quality centers instead of all centers rests on the notion that if we are
serious about ECE centers as a means for improving outcomes and closing racial and ethnic gaps
in child well-being, only centers that are high-quality (i.e., go beyond typical health and safety
standards to provide a developmentally rich learning environment) demonstrate even near
sufficient promise for preparing disadvantaged children for school. Moreover, learning more
about the interaction between local availability of ECE centers and other aspects of
neighborhood opportunity informs our understanding of the role that various types of
neighborhood institutions play in promoting community transformation to break long-standing
cycles of concentrated poverty.
Racial/Ethnic Disparities in Access to ECE
Despite the available evidence on the positive effects of early childhood education on
child outcomes, data suggest that there are racial/ethnic disparities in access to high-quality early
childhood education. Research has found that both the share of children enrolled in ECE
programs and the quality of programs vary substantially by race, ethnicity and nativity. Black
children are more likely than white children to participate in preschool education, while Latino
children are less likely: 23 percent of Latino three-year-olds were enrolled in preschool in 2000,
11
compared with 49 percent and 43 percent of their black and white peers, respectively. However,
the preschool programs to which black and Latino children have access are of lower quality than
those available to white children (Magnuson & Waldfogel, 2005). Also, a recent study finds that
immigrant children have lower rates of participation in nonparental care of any type, including
center-based ECE programs, than their native counterparts (Karoly & Gonzalez, 2011). Despite
these documented disparities in access to high-quality ECE programs, there is limited data on the
extent to which disparities in early childhood education arise from limited access at the
neighborhood level.
Relevant Evidence on Neighborhood Context and Availability of ECE Centers
Empirical tests of social disorganization theory (i.e., that poor neighborhoods are more
likely to be resource deprived), suggest that there is not necessarily a monotonic relationship
between concentration of poverty and resource deprivation. A small number of studies have
demonstrated the presence of organizations in poor urban neighborhoods (Small & McDermott,
2006) and have documented the varying degrees to which neighborhoods are organizationally
rich (Murphy & Wallace, 2010; Allard, 2004; Joassart-Marcelli & Wolch, 2003; Peck, 2008).
Specific to ECE resources, Small and Stark (2005) in their case study of child care
centers in New York City found: (1) that the probability of presence of a child care center does
not decline as neighborhood poverty level increases, and (2) that the relationship between
presence of child care centers and neighborhood poverty level depends strongly on center
funding source. Publicly funded centers (including Head Start and city-funded programs) were
more likely to be found in poor neighborhoods while privately funded centers were less likely to
be found in poor neighborhoods. The study’s qualitative work suggests that two different
mechanisms may explain why public centers are more likely to be found in poor neighborhoods.
First, Head Start centers are required to locate in communities of demonstrated need and

12
therefore have formal policy requirements guiding location decisions. The second factor that
explains why public centers are more likely to locate in poor neighborhoods is that mission-
driven nonprofit agencies, at least in New York City, appear to target the areas of greatest need,
even though they are not required to locate in these areas.
While there is not an abundance of evidence describing the relationship between
neighborhood contextual factors and presence of ECE centers, there is at least a limited and
directly relevant research base to build from. A main take away from the available evidence is
that ECE centers may behave differently than other neighborhood institutional resources and
other dimensions of the neighborhood opportunity structure (including poverty level, ethnic
minority concentration, residential instability, unemployment and joblessness, and presence of
public housing project--all included as control variables in the Small & Stark study). Another is
that federal, state and local government and non-governmental actors and policies can
meaningfully influence the distribution of ECE resources within and across neighborhoods.
Relevant Evidence on Spatial Distributions of Neighborhood Opportunity and Neighborhood ECE Resources
While there is relatively little information about the presence of high-quality ECE centers
in disadvantaged (versus more advantaged) neighborhoods, even less is known about how these
centers are distributed across regions and how that spatial distribution compares with the
distribution of other dimensions of neighborhood opportunity across regions. Despite the dearth
of direct evidence on the spatial distribution of high-quality ECE resources, we draw on two
lines of recent work to inform spatial hypotheses: (1) the growing empirical documentation of
the spatial distribution of opportunity across regions, and (2) preliminary examinations of the
spatial properties of metropolitan child care markets. Both lines of work also provide
preliminary evidence on how spatial patterns may vary by race/ethnicity.

13
Spatial Distribution of Neighborhood Opportunity. Evidence from studies that map the
geographic distribution of opportunity across regions and states suggest that in U.S metropolitan
areas, opportunities are not equally geographically distributed (based on more than a two dozen
metropolitan area and state opportunity mapping studies conducted since 2003 by a national
leader in this work--the Kirwan Institute For the Study of Race and Ethnicity at Ohio State
University2). Opportunities are often geographically clustered in a few communities, while they
are lacking or insufficient in others, creating a web of high- and low-opportunity neighborhoods
across metropolitan regions. The analytic framework that guides this work acknowledges that
neighborhood inequality has a geographic footprint and that historical factors and the presence of
discriminatory and exclusionary policies have spatially segregated people over time. In the
context of regional or community development, neighborhoods are the primary environments in
which people access key opportunity structures and therefore many low-income communities are
often spatially isolated and segregated from critical opportunities.
These opportunity mapping studies have also found a clear racial segregation from
neighborhoods of opportunity for people of color, especially for African Americans (Reece &
Gambhir, 2008). On average, they find approximately two thirds to three quarters of the African
American population in metropolitan regions concentrated in opportunity poor communities.
Although low opportunity communities represented only 40% of the census tracts in the area of
analysis, these low opportunity tracts have regularly been found to contain 60 to 80% of the non- 2 Opportunity maps have been utilized in policy advocacy, litigation, applied research, community organizing, coalition building and to inform service delivery. Recent partners who have partnered with the Institute to create opportunity maps include: Maryland ACLU, NAACP Legal Defense Fund, Poverty Race & Research Action Council, The Miami Workers Center, The Greater New Orleans Fair Housing Center, Green Doors (formerly the Austin Coalition for the Homeless), The Presidents’ Council of Cleveland, The Michigan Roundtable for Diversity & Inclusion, ISIAIH (MN Gamaliel affiliate), The Connecticut Fair Housing Center, Massachusetts Law Reform Institute, Washington County Oregon Department of Community Development, Gulf Coast Regional Planning Commission, The Columbus Community Development Collaborative and the Northwest Justice Project. For more information and background on opportunity mapping please see Roy & Reece (2010) and Reece & Schultheis (2009).

14
White population. The degree of opportunity segregation was found to be higher in areas in the
Midwest and Northeast (compared to the South) and the state of Massachusetts had the highest
concentration of African Americans in low opportunity areas (more than 90%). Their findings
suggest that race plays a greater role in opportunity isolation than class alone. Similar isolation
was seen in Ohio opportunity mapping analysis, with 74% of Ohio’s African American
population living in low opportunity neighborhoods, contrasted with 26% of whites living in the
State (Powell & Grant-Thomas, 2010)
Spatial Properties of Child Care Markets. An extensive literature exists on the factors that
drive supply and demand in child care markets (For summary see Small & Stark, 2005). Factors
found to most consistently impact the demand for child care are joblessness and unemployment,
the proportion of children under six, the number of children under six and the ratio of men to
women. Also, we know that large chain for-profit child care providers prefer site locations near
major highways, locations between middle-class residential areas and commercial areas,
communities with high female labor force participation rates and traditional two-parent families
with two-wage earners and more than 50 percent above median family income (Kahn &
Kamerman, 1987). On the supply side, recent studies suggest that market forces may be more
influential in determining where private providers locate, while government and non-
governmental actors may be more likely to shape the distribution of public services across
neighborhoods (Small & Stark, 2005). Despite understanding many of the factors that influence
child care market supply and demand, there remains relatively little documentation of how these
forces play out spatially across metropolitan regions and states and how the outcomes of these
dynamics may result in geographic inequalities in the availability of neighborhood ECE services.
One recent study provides some preliminary evidence of the geographical unevenness of
neighborhood child care supply within metropolitan-wide systems, and how patterns vary by

15
race/ethnicity. Covington (2007) uses a dissimilarity index to describe the geographical
unevenness of local access to child care services for families in all major U.S. metropolitan
regions. Index values can be interpreted as the percentage of families that would have to move
across zip codes to yield perfect proportional balance between locally available child care
facilities and families with children under age five3. The index is calculated for four population
groups: all families, white families, black families and Latino families with young children under
the age five at two points in time: 1990 and 2000. Covington found that families were
significantly less spatially segregated from child care establishments in 2000 as compared to
1990, with the exception of white families. While spatial segregation decreased over time for
most groups, results at either time point show that black and Latino families are significantly
more spatially segregated from child care services than white families. In 2000, the dissimilarity
score for white families was 54, while the score was 82 for black families and 76 for Latino
families. Despite these results, blacks’ and Latinos’ access to child care facilities improved more
dramatically from 1990 to 2000 compared to whites. Between 1990 and 2000, the dissimilarity
score for black families went from 93 to 82 and from 84 to 76 for Latino families (the
dissimilarity score for white families increased over the time period from 50 in 1990 and to 54 in
2000). Decomposition analyses concluded that the reduction in spatial mismatch between
families and child care centers observed between 1990 and 2000 was almost entirely explained
3 Equation for the dissimilarity index: Define Familyi as the number of families with children who are less than 5 years old residing in ZIP code i (where i=(1,...,n) and indexes the ZIP codes in a given metropolitan area), CCFacilityi as the number of child care facilities in ZIP code i, Family as the total family population having children younger than age 5 in the metropolitan area, and CCFacility as the total number of facilities in the metropolitan area. The dissimilarity score between families and child care facilities is given by applying the following equation:
12

16
(for blacks and to lesser extent Latinos) by shifts in the locations of child care establishments,
rather than residential movement by families.
Relevance of Spatial Findings for the Present Study. The spatial research on neighborhood
opportunity suggests that opportunity is not equally distributed across neighborhoods within
regions, but rather clustered in high opportunity and low opportunity areas, and that
neighborhoods with higher percent racial and ethnic minority and immigrant populations are
more likely to be spatially segregated from opportunity. Likewise, the preliminary evidence
exploring spatial and racial properties of child care markets across U.S. metropolitan areas
suggests that neighborhoods with higher percents black or Latino are more likely to lack local
access to child care services. If we assume that high-quality ECE centers, as a critical dimension
of the neighborhood opportunity structure, will behave similarly to other dimensions of the
neighborhood opportunity, then these findings would lead us to the following hypotheses: (1)
Higher opportunity neighborhoods will be more likely to have a high-quality ECE centers, (2)
By virtue of the fact that racial and ethnic minority and immigrant families are more
concentrated in low opportunity neighborhoods, racial and ethnic minority and immigrant
children will be less likely to live in neighborhoods with a high-quality ECE provider, and (3)
the relationship between child race/ethnicity and presence of high-quality ECE centers will be
stronger than the relationship between neighborhood opportunity and availability of ECE centers
alone. However, the seminal work in this area by Small and Stark (2005) calls into question the
assumption that ECE centers behave like other dimensions of the neighborhood opportunity
structure. Also, the lack of direct evidence on the availability of high-quality institutional
resources in impoverished neighborhoods leaves us guessing as to whether the same patterns
found for all ECE resources will hold for high-quality ECE resources. As a result of the mixed

17
evidence, we take an exploratory approach to the empirical evidence and rely on the findings
from prior studies to inform our interpretations of findings in the empirical work.
Rationale for Focusing on High-Quality ECE Centers
The claim that high-quality early childhood care and education programs have strong and
lasting positive impacts on disadvantaged children is most often supported by evidence from
experimental, longitudinal evaluation studies of two seminal early childhood demonstration
programs--the Perry Preschool Program and the Abecedarian Project. Consider for a moment the
characteristics of these programs. A two-year program for students ages 3 to 5, Perry Preschool
offered a part-day preschool program that emphasized child-initiated learning, low child-to-staff
ratios (5:1 to 6:1), 100% college educated and early childhood-certified teachers, weekly or
biweekly home visits, and monthly group meetings with parents aimed at shaping the home
environment. The Abecedarian Project offered all that Perry Preschool did and more. The
treatment began at infancy and the project provided full-day, full-year care over the five years of
treatment from birth to school entry. The available evidence on these programs is extremely
impressive with children in the treatment groups demonstrating increased education, increased
employment, decreased criminal activity, and lower teen parenting later in life. Other programs
studied in a rigorous way have also demonstrated positive results, including Chicago Public
Schools Kindergarten program, and the Infant Health and Development Programs--a high-
quality, full-day early intervention child development center.
These demonstration programs are incredibly intensive and expensive and fall outside the
range of routine practice in early childhood care and education. However, these are the types of
programs that, if implemented at large scale, would likely be our best bet (based on the available
evidence) at closing persistent school readiness gaps and as a result serve as the relevant

18
aspirational benchmark for ECE quality. Moreover, studies that do not account for quality tell us
little about the availability of ECE services that come closest to these aspirational benchmarks.
To be clear, we do not mean to suggest that studies that focus on availability of all ECE services
regardless of quality are not highly informative. We acknowledge that the goals and intents of
ECE programs go beyond preparing children for school entry by offering a safe, sanitary,
consistent place for parents to send their children while they work. In fact, it is only in the last
decade that prominent early childhood care and education programs, including Early Head Start
and Head Start, have made explicit the emphasis on early education and school readiness.
However, we do want to make clear the distinction that this study focuses more narrowly on the
availability of high-quality ECE programs--those that stand the best chance of making significant
strides towards the specific goal of closing large and persistent racial and ethnic gaps in school
readiness.
The best available nationally-comparable approach for identifying high-quality ECE
providers is to locate programs that are accredited by the National Association for the Education
of Young Children (NAEYC). Founded in 1926, NAEYC is the world's largest organization
working on behalf of young children with nearly 80,000 members, a national network of over
300 local, state, and regional affiliates. Within NAEYC, two departments--the NAEYC
Academy and Accreditation Program Support--work jointly to maintain the integrity of NAEYC
Accreditation, assisting the more than 7,500 NAEYC-accredited programs as well as the almost
13,500 programs engaged in the accreditation process. The NAEYC Academy sets and monitors
standards for high-quality programs and accredits programs meeting these standards. NAEYC
conducted 1,500 site visits in 2009.
To receive NAEYC accreditation, ECE programs must meet rigorous standards for
quality. Minimally, centers must be in operation for at least one year before applying for

19
candidacy and must be licensed by the relevant state/local licensing or regulatory authority. The
program administrator must have a bachelor’s degree and a certain amount of college level
coursework in administration, leadership, or management and early childhood development and
education (or a 5-yr plan to achieving this credential or an appropriate combination of
demonstrated academic and work experience through a rigorous alternate pathways provision).
In addition, 75 percent of all teachers (and 50 percent of all assistant teachers/teacher aides) in
the program must meet one of the following requirements: (i) have a specific early childhood
development credential4 or equivalent, (ii) be working on associates degree or higher in early
childhood education, or (iii) have an associate’s degree or higher in other field plus three or more
years of work experience in another NAEYC accredited program (or equivalent5). Finally, the
program must agree to site visits for assessment and must document satisfactory performance on
at least 80 percent on the accreditation criteria (which is outlined in a lengthy and detailed 111-
page All Criteria Document6) for the 10 NAEYC Early Childhood Program Standards that cover
all programmatic dimensions: Relationships, Curriculum, Teaching, Assessment of Child
Progress, Health, Teachers, Families, Community Relationships, Physical Environment,
Leadership and Management7.
While NAEYC standards arguably still fall short of the aspirational benchmarks of Perry
Preschool and the Abecedarian Project, they are the best mechanism for identifying programs
that come closest to these prototypes by meeting the most rigorous quality standards available
that are also nationally comparable for programs across the country. That being said, there are
important limitations of this approach. First, the NAEYC accreditation process is voluntary, so 4Child Development Associate (CDA) credential awarded by the Council for Professional Recognition or equivalent. 5 An associate’s or higher in other field PLUS three or more years of work experience in a non-accredited program and at least 30 contact hours of relevant training during that past three years. 6For All Criteria Document, see http://www.naeyc.org/files/academy/file/AllCriteriaDocument.pdf. 7 For overview, see Overview of the NAEYC Early Childhood Program Standards http://www.naeyc.org/files/academy/file/OverviewStandards.pdf.

20
there could certainly be high-quality ECE centers have opted not to pursue this credential for
myriad reasons. The labor intensity of the accreditation process alone will deter organizations
that believe they do not require or value the credential. Also, there may be an argument that the
credential has different meaning and different value in advantaged versus disadvantaged
neighborhoods or has differential value for privately versus publicly funded centers. These
limitations need to be considered when interpreting results. Finally, this measure is blunt in the
sense that it only differentiates between the highest-quality centers and NOT the highest-quality
centers as measured by this credential. It tells us nothing about the gradient of quality. Despite
these limitations, the lack of evidence on the distribution and presence of high-quality ECE
services and the importance of such information warrants an attempt at bringing quality into the
conversation with the best available measures (even if those measures are imperfect).

21
III. METHODS
Data Sources and Variables
Geographic Base Layer Data. The spatial data layer that serves as the foundation for this
analysis was constructed using U.S. Census TIGER (Topologically Integrated Geographic
Encoding and Referencing system) Shapefiles. TIGER Shapefiles are designed for use with
geographic information system (GIS) software. The TIGER Shapefiles do not include
demographic data, but they contain geographic entity codes that can be linked to the Census
Bureau’s demographic data. TIGER files for Massachusetts and Ohio were used to create the
base geographic data files for this analysis that contain the boundaries of each census tract in the
two states.
Presence of High-Quality ECE Provider in Census Tract. This study utilizes data from the
National Association for the Education of Young Children (NAEYC), a leading national early
care and education (ECE) program accreditation body, to identify the locations of high-quality
ECE providers. NAEYC maintains a list of programs that are currently accredited for each state.
We used NAEYC accreditation status as an indicator that an ECE center is of high quality, i.e. if
a center had received NAEYC accreditation, it was classified as “high-quality”. The NAEYC list
is updated with new accreditation decisions every Friday8. The list contains full point address
information for each accredited program. Each address was geocoded so that each point address
could then be associated with the neighborhood/census tract in which it is located. Using this
combined dataset, we construct a neighborhood-level indicator--presence of at least one high-
quality ECE center in neighborhood. This neighborhood indicator takes the form of a
dichotomous variable that equals zero if there is no high-quality provider located in the
neighborhood and 1 if there is at least one high-quality ECE provider in the neighborhood.
8 The NAEYC data used for analysis were current as of January 2011.

22
Presence of High-Quality Head Start Center. To identify high-quality Head Start centers, all
accredited programs that identified as Head Start or Early Head Start programs were included in
the list of high-quality Head Start center locations for each state. For this subset of accredited
programs, a similar process as that described above for all high-quality ECE centers was
conducted, where each Head Start center point address was geocoded onto its respective
neighborhood/census tract location. These combined data were then used to create a second
neighborhood indicator--presence of at least one high-quality Head Start center in neighborhood.
This indicator also takes the form of a dichotomous variable that equals zero if there is no high-
quality Head Start center located in the neighborhood and 1 if there is at least one high-quality
Head Start center in the neighborhood.
Neighborhood Opportunity. The following presents the methodology and indicators for the
Massachusetts and Ohio opportunity analyses conducted by the Kirwan Institute. To map
opportunity in each state, we use variables that are indicative of high and low opportunity. High-
opportunity indicators include the availability of sustainable employment, high-performing
schools, a safe environment, and safe neighborhoods. A central requirement of indicator
selection is a clear connection between the indicator and opportunity. What is opportunity? For
this analysis, opportunity is defined as environmental conditions or resources that are conducive
to healthier, vibrant communities and are more likely to be conducive to helping residents in a
community succeed. Indicators could either be impediments to opportunity (which are analyzed
as negative neighborhood factors, e.g., high neighborhood poverty) or conduits to opportunity
(which are analyzed as positive factors, e.g., an abundance of jobs). These multiple indicators of
opportunity are assessed at the same geographic scale, thus enabling the production of a
comprehensive opportunity map for each state.

23
Calculating the Opportunity Index:
The various opportunity indicators were analyzed relative to the other census tracts within each
state by standardizing through the use of “z scores.” A z score is a statistical measure that
quantifies the distance (measured in standard deviations) a data point is from the mean of a data
set. The use of z scores allows data for a census tract to be measured based on their relative
distance from the data average for the entire region. The final “opportunity index” for each
census tract is based on the average of all z scores for all indicators by category. The
corresponding level of opportunity (very low, low, moderate, high, very high) is determined by
sorting all census tracts into quintiles based on their opportunity index scores. Thus, the census
tracts identified as “very high” opportunity represent the top 20% of scores among census tracts.
Conversely, census tracts identified as “very low” opportunity represent the lowest scoring 20%
of census tracts.
Z scores are helpful in the interpretation of raw score performance, since they take into
account both the mean of the distribution and the amount of variability (or the standard
deviation). The z score indicates how far the raw score is from the mean, either above it or
below in standard deviation units. A positive z score is always above the median (upper 50%). A
negative z score is always below the median (lower 50%) and a z score of zero is always exactly
on the median or equal to 50% of the cases. Thus, when trying to understand the overall
comparative performance of different groups with respect to a certain variable, we can assess
how a certain group (of individuals, tracts, etc.) is performing with respect to the median
performance for the certain variable. No weighting was applied to the various indicators; all
indicators were treated as equal in importance.

24
Multiple opportunity indicators were identified and analyzed at the census tract level for
each category of opportunity. Data for the opportunity indicators was obtained from multiple
sources including the U.S. Census Bureau, EPA data, private data sets provided by ESRI, state
and national school quality databases and other local data sources. Due to geographical
inconsistencies with the various sources of data, specific geographic information systems
techniques were applied to analyze the data at the census tract level. When calculating final z
scores for the neighborhood health indicators, census tracts with missing data were given z
scores of 0 (analyzed as being equivalent to the mean for the region).
Massachusetts and Ohio Opportunity Indicators. The Massachusetts analysis utilized 19
indicators of opportunity, assessed separately in three different opportunity areas. The Ohio
analysis utilized 26 indicators divided between five different opportunity areas. For both
assessments, the analyses were conducted using census tracts as geographic representations of
neighborhoods. Data for education was disaggregated from the school district level to census
tracts for the analysis. The comprehensive opportunity map represents the combined score based
on these primary opportunity areas for each state.
Exhibits A and B below present the indicators utilized in the analysis for both the
Massachusetts and Ohio mapping assessments. Both mapping assessments were conducted
independently as part of local applied research projects with partners in each state. Social science
research and previous opportunity mapping research guided the selection of indicators chosen for
this analysis. The number of indicators utilized in each analysis was different due to data
availability and the separate stakeholder engagement processes utilized with partners in each
state to identify the opportunity mapping indicators.

25
Exhibit A: Massachusetts Opportunity Indicators
Educational Opportunity Economic Opportunity Neighborhood/Housing Quality
Student expenditures Student poverty rate Students passing math tests Students passing reading tests Dropout rate Graduation rate Number of certified teachers
Unemployment rates Population on public assistance Proximity to employment Economic climate (Job trends) Mean commute time
Home values Neighborhood vacancy rate Crime index or Crime rate Neighborhood poverty rate Home ownership rate Proximity to toxic waste release
sites Proximity to Superfund sites
Note: For more detail, see Reece & Gambhir (2009).
Exhibit B: Ohio Opportunity Indicators
Education and Child Welfare
Economic Opportunity and
Mobility
Housing and Neighborhood and
Community Development
Public Health Public Safety and Criminal
Justice
Education attainment for total population
Student Poverty Rate Teacher qualifications for
neighborhood schools (or certified teachers)
Performance Index Disciplinary actions Education quality Expenditure per pupil Dropout rate Student Teacher Ratio Proximity to libraries Graduation Rate
Unemployment Rates Population on
Public Assistance Proximity to
employment Economic Climate Mean Commute
Time
Home Values Home Vacancy
Rates Home Ownership
Rate Neighborhood
Poverty
Number of health clinics in a neighborhood Access to
health clinics in a neighborhood Number of
grocery stores Access to
grocery stores
Adult incarcerations Crime Index
Note: For more detail, see Powell & Grant-Thomas (2010).
Neighborhood Child Populations By Race/Ethnicity and Immigrant Status. U.S. Census
data from 2000 (Summary File 1) was used to obtain the number of non-Hispanic white, non-
Hispanic black, Hispanic and total children under age 5 that reside in each census tract in MA
and OH. Census data from 2000 (Summary File 4) was used to obtain the number of foreign-
born children under age 18 in each census tract in MA and OH. (Please note that the number of
foreign-born children under age 5 was not available.)

26
Exploratory Spatial Data Analysis (ESDA) Methods
This study utilizes Exploratory Spatial Data Analysis (ESDA) methods to formally
analyze and understand certain spatial patterns and relationships in the data. More specifically,
we perform statistical tests to help determine whether patterns found in the neighborhood-level
data are spatially random versus spatially associated. If neighborhood opportunity, for example,
is spatially random, neighborhood opportunity in one location will not depend on the
neighborhood opportunity levels in surrounding (contiguous) neighborhoods. Also, the observed
spatial pattern would be equally as likely as any other spatial pattern and the location of
neighborhood opportunity values could be altered without affecting the information content of
the data. When spatial randomness is violated, then there is spatial autocorrelation. The literal
meaning of spatial autocorrelation is self-correlation (autocorrelation) of observed values of a
single attribute (in this case neighborhood opportunity level), according to the geographical
(spatial) ordering of values. There are two kinds of spatial autocorrelation: positive, when the
relationship between the value at a location and the values of its neighbors is positive, and
negative, otherwise. A Global Moran’s I statistic provides a single measure of the presence of
spatial autocorrelation for an attribute in a region as a whole. A Moran’s I value of 1 represents
perfect positive spatial autocorrelation, a value of 0 represents little/no evidence of spatial
autocorrelation (i.e. a random spatial pattern), and a value of -1 represents perfect negative
spatial autocorrelation (or perfect dispersion).
Spatial autocorrelation measures require a weights matrix that defines a local
neighborhood or area around each geographic unit (in this case, the geographic unit is the census
tract). The value at each unit is compared with the weighted average of the values of its
neighbors. Weights (wij) for this study are constructed based on contiguity with
neighboring/surrounding tracts and take the form:

27
(1) C
C with Cij, equal to 1 when i is linked to j (in other words, when i is
contiguous to j) and Cij = 0 otherwise.
Once the weights matrix is defined, a Moran’s I statistic for the entire study geography,
or region as a whole, can be calculated using the following formula:
2 N
∑ ∑ W
∑ ∑ W
∑ …where there are N units, the attribute
value for each unit i is yi, and wij is the weight (or connectivity) for units i and j. Notice that the
locational information for this formula is found in the weights. For non-neighboring tracts, the
weight is zero, so these add nothing to the correlation.
In addition to global tests of spatial autocorrelation, we also perform Local Moran’s i
tests to determine the extent to which each neighborhood (and its relationship to its surrounding
neighbors) contributes to the overall presence of spatial autocorrelation in each state. In other
words, we can compute a measure of spatial association for each neighborhood in Massachusetts
and Ohio--a Local Indicator of Spatial Autocorrelation (LISA) statistic--using the following
equation:
3 where zi and zj are standardized scores of attribute values for
units i and j, and j is among the identified neighbors of i according to the weights matrix
wij.
We summarize LISA results using a cluster map, which indicates cases that are
statistically significant (p-value<0.05) and describes the type of spatial association. In a cluster
map there are five possible types of spatial association:

28
LISA Statistic Value
Own-Neighborhood Value (i)
Linked-Neighbor Values (j)
Not significant n.a. n.a. High-High High High Low-Low Low Low High-Low High Low Low-High Low High
As an example, a neighborhood with a “high-high” LISA value is a neighborhood with a
statistically significant LISA value (i.e., p-value<0.05) and is a neighborhood which is a high
opportunity neighborhood itself and is also surrounded by a high opportunity neighborhoods. In
other words, the individual neighborhood’s value for the attribute (in this case, opportunity) is
high and the values of the contiguous (surrounding) neighborhoods are also high on that same
attribute.
Model Estimation
We use a logit model to examine how the odds of having at least one high-quality ECE
center in a neighborhood changes as a function of neighborhood opportunity level. Separate
analyses are conducted for Massachusetts and Ohio. The model for each state takes the
following form:
ln )HQECE = β1 (Opportunitylow) + β2 (Opportunitymoderate) + β3 (Opportunityhigh) + β4
(Opportunityvery high) … where Opportunitylow equals 1 if neighborhood opportunity
level is low and 0 otherwise, Opportunitymoderate equals 1 if neighborhood opportunity
level is moderate and 0 otherwise, and so on. The dependent variable, HQECE, is
presence of high-quality ECE center in neighborhood (1 if there is a high-quality ECE
center in neighborhood, 0 otherwise). The omitted category is very low opportunity
neighborhoods.

29
A similar specification is used to examine how the odds of having at least one high-
quality Head Start center in a neighborhood changes as a function of neighborhood opportunity,
but the dependent variable, HQHS, is presence of high-quality Head Start center (1 if there is a
high-quality Head Start center in neighborhood, 0 otherwise) instead of presence of high-quality
ECE center and takes the form:
ln )HQHS = β1 (Opportunitylow) + β2 (Opportunitymoderate) + β3 (Opportunityhigh) + β4
(Opportunityvery high) … where Opportunitylow equals 1 if neighborhood opportunity
level is low and 0 otherwise, Opportunitymoderate equals 1 if neighborhood opportunity
level is moderate and 0 otherwise, and so on. The omitted category is very low
opportunity neighborhoods.
All models presented are unadjusted. Two types of sensitivity tests were performed to
assure the robustness of the results. We may expect that the density of the child population per
tract area (which is a function of both the size of the child population and the size of a
neighborhood in terms of square area) may affect the number of centers. In both states, we
tested whether inclusion of density of the child population per tract area as a control variable
affected results and it did not. In Massachusetts, we ran one additional sensitivity. Because
census tract boundaries are determined based on population counts, not geographic areas, in
Massachusetts, neighborhood geographic areas are much larger in suburban areas, since they are
less densely populated than urban areas. In addition, suburban areas in Massachusetts are much
more likely to be higher opportunity areas making neighborhood opportunity positively
associated with neighborhood area in Massachusetts. We therefore tested whether inclusion of
tract area as a control variable affects results and found that it does not. All regression results
presented are unadjusted and meet these robustness tests.

30
V. RESULTS
Results for Massachusetts and Ohio are first discussed separately and then followed by a
discussion comparing the findings in the two states.
Massachusetts Descriptive Overview
Table 1. Selected Characteristics of State Child Population
Massachusetts
Racial/Ethnic Composition of Children Under Age 5 (n=394,848) Non-Hispanic White 74% Non-Hispanic Black 7% Hispanic (Any Race) 11% Non-Hispanic Other Race 8% Total 100% Immigrant Composition of Children Under Age 18 (n= 1,495,719) Percent Foreign-Born (born outside U.S.) 4% Poverty Rates by Race/Ethnicity for Children Under Age 5 All Children (Under Age 5) 12% Non-Hispanic White Children (Under Age 5) 7% Non-Hispanic Black Children (Under Age 5) 29% Hispanic Children (Under Age 5) 39%
Source: Author tabulations of 2000 U.S. Census of Population and Housing, Summary File 1 and Summary File 4.
Table 1 provides an overview of relevant characteristics of the Massachusetts (MA) child
population. In MA, approximately 26% of children under age 5 are racial and ethnic minority
children. Seven percent of all children in MA are non-Hispanic black, 11 percent of children are
Hispanic (all races), and 4 percent of all children under 18 years old are foreign-born. Poverty
rates among white and racial and ethnic minority children in MA differ substantially. While the
overall child poverty rate is 12 percent, 7 percent of white children in MA are poor compared to
29 percent of black children, and 39 percent of Hispanic children. So, while the size of the black

31
and Hispanic child populations are small compared to the size of the white child population in
MA, black and Hispanic children, together, represent almost half of the state’s poor children.
Spatial Distribution of Neighborhood Opportunity
In 2009, the Kirwan Institute performed an opportunity mapping analysis for the state of
Massachusetts that provided an overview of the spatial distribution, or geographic footprint, of
neighborhood-level opportunity across the state, based on education, economic and mobility and
housing and neighborhood indicators (For more detail, see Methods section). Map 1a is a
comprehensive opportunity map that shows the spatial distribution of neighborhood opportunity
across the state. Map 1b shows the comprehensive opportunity map with the locations of high-
quality providers. It is clear from Map 1a that high and low opportunity areas each tend to
cluster together in certain regions of the state. For example, in the Greater Boston area, high
opportunity neighborhoods cluster in the suburbs surrounding Suffolk County, and much of the
inner city of Boston consists of clusters of low opportunity neighborhoods. Similar clustering
occurs in the Northeast part of the state while Central and Southeast Massachusetts show more
fragmented geographies of opportunity. However, in the urban areas of Central and Southeast
Massachusetts there are clusters of low opportunity neighborhoods. In Western Massachusetts,
we find very few high opportunity neighborhoods.
For the entire state of Massachusetts, the Global Moran’s I statistic for spatial
autocorrelation in neighborhood opportunity levels is 0.749. This suggests strong presence of
positive spatial autocorrelation, which means that the level of opportunity in any one
neighborhood is strongly positively related to the level of opportunity in the surrounding
(contiguous) neighborhoods. In practice, this means that similar or like values cluster together;
high opportunity neighborhoods have a strong tendency to cluster with other high opportunity
9Rook continuity is assumed for calculating spatial weights.

32
neighborhoods and low opportunity neighborhoods have a strong tendency to cluster with other
low opportunity neighborhoods.
In addition to global tests of spatial autocorrelation, we performed Local Moran’s i tests.
Map 2 shows the distribution of neighborhood LISA statistics for the entire state of
Massachusetts. This map formalizes the clustering patterns we saw in Map 1a, by identifying the
clusters where the spatial association between neighborhoods is statistically significant. The
bright red (high-high) values represent high opportunity neighborhoods that are statistically
associated with their neighbors who are also high opportunity neighborhoods (i.e., spatial
clusters of high opportunity or areas of spatially concentrated advantage). The bright blue (low-
low) values represent low opportunity neighborhoods that are statistically associated with their
neighbors who are also low opportunity neighborhoods (i.e. spatial clusters of low opportunity or
areas of spatially concentrated disadvantage). The light blue (low-high) and light red (high-low)
values represent instances of negative spatial autocorrelation – for example, low-high values
represent neighborhoods that are low opportunity neighborhoods surrounded by higher
opportunity neighborhoods. Table 2 shows that just over half of the neighborhoods in MA
(55%) do not have statistically significant spatial association with their surrounding
neighborhoods. Among the remaining 45% of neighborhoods that do have statistically
significant LISA values, 21% have “high-high” LISA values and a similar percent (23%) have
“low-low” LISA values. This means that roughly 20% of neighborhoods in MA are in areas of
spatially concentrated advantaged and another (roughly) 20% of neighborhoods are in areas of
spatially concentrated disadvantage.

33
Table 2. Distribution of Local Indicators of Spatial Autocorrelation (LISA) Statistics
(Massachusetts)
LISA Statistic Value Number of Tracts Percent of Tracts
Not significant 751 55% High-high 282 21% Low-Low 316 23% Low-High 3 <1% High-Low 9 <1% Total 1,361 100%
Both the global and local tests of spatial association reveal that the geography of
opportunity in Massachusetts is not spatially random, suggesting that a good proportion of
children throughout the state are likely to live in either areas of concentrated high opportunity or
spatially concentrated disadvantage--areas that are spatially isolated from opportunity. To the
extent that these geographic patterns occur along racial and ethnic lines, these clusterings or
concentrations of high and low advantage can have significant implications for equity in
children’s access to opportunity.
Spatial Distribution of Children by Race, Ethnicity, Immigrant Status
Maps 3a, 3b, 3c and 3d show that racialized isolation from neighborhoods of opportunity
is very evident in Massachusetts. Across the state, racial and ethnic minority and immigrant
children are much more likely to live in lower opportunity neighborhoods than non-Hispanic
white children. Table 3 shows that 37% of all children in Massachusetts under age 5 live in very
low or low opportunity neighborhoods, with the remaining 63 percent of children under age 5
evenly split across moderate, high and very high opportunity neighborhoods. Comparing panels
(b)-(e) of Table 3, we see that while 8 percent of all non-Hispanic white children live in very low
opportunity tracts, approximately 60% of both non-Hispanic black and Hispanic children live in
34
very low opportunity tracts, and 35% of foreign-born children under age 18 live in very low
opportunity tracts.
Table 3. Distribution of Children by Race/Ethnicity/Nativity Across Neighborhood Opportunity Levels (Massachusetts)
(a) (b) (c) (d) (e)
All Children
White Children
Black Children
Hispanic Children
Foreign-Born Children
n=394,848 n=292,939 n=26,977 n=43,316 n=66,869
Nei
ghb
orh
ood
O
pp
ortu
nit
y Very Low 19% 8% 59% 60% 35% Low 18% 16% 24% 21% 21% Moderate 20% 23% 9% 9% 14% High 22% 27% 5% 5% 10% Very high 21% 25% 3% 5% 19%
Total 100% 100% 100% 100% 100%
Sources: Author tabulations. Neighborhood population counts by race, ethnicity and immigrant status: 2000 Census. Neighborhood Opportunity: MA Opportunity Mapping Analysis, Kirwan Institute (Reece & Sambhir, 2009). N values in panels a-d represent children under age 5. N values in panel e represent children under age 18.
Moreover, large percentages of racial and ethnic minority and immigrant children are
living in neighborhoods that are spatially isolated from opportunity. Table 4 shows that 62% of
non-Hispanic black and Hispanic children live in areas of spatially concentrated disadvantage
(compared to 11% of white children and 21% of children overall). These are neighborhoods that
are not only themselves low opportunity neighborhoods but that are also surrounded by low
opportunity neighborhoods (i.e., they have “low-low” LISA statistics).
Table 4. Concentration of Children in High Opportunity vs. Low Opportunity Spatial Clusters by Race, Ethnicity, and Nativity (Massachusetts)
% in High Opp. Clusters % in Low Opp. Clusters Under Age 5: All Children 24% 21% Non-Hispanic White 29% 11% Non-Hispanic Black 5% 62% Hispanic 6% 62% Under Age 18: All Children 24% 21% Foreign-Born Children 19% 40%

35
It is clear that racial and ethnic minority and immigrant children in Massachusetts suffer
higher rates of poverty and live in lower opportunity neighborhoods that are also spatially
isolated from higher opportunity areas. The question remains whether racial and ethnic minority
children are also more likely to be deprived of a critical neighborhood resource-the high-quality
ECE center--that holds promise to offset some of the accumulative negative effects that
neighborhood disadvantage can have on child development.
Neighborhood Opportunity, High-Quality Early Childhood Care and Education Centers, and Racial/Ethnic Differences
In Massachusetts, there are 936 high-quality (NAEYC-accredited) ECE centers,
representing about one third of all licensed, center-based ECE providers in the state. These
providers are located in 626 of the 1,361 neighborhoods across the state of Massachusetts.
Therefore, less than half (or 46%) of neighborhoods in Massachusetts have one or more high-
quality ECE provider (See Table 5). Of the 626 neighborhoods with at least one high-quality
provider, the vast majority have one or two high-quality providers and less than 5% have more
than two providers.
Table 5. Distribution of High-Quality Centers by Neighborhood Opportunity Level (Massachusetts)
Neighborhood Opp. Level
Num. of Neighborhoods with
High-Quality Centers
% of Neighborhoods with
High-Quality Centers
% of Neighborhood within Opp. Level
with at least 1 provider
Very Low 104 17% 38%
Low 127 20% 47%
Moderate 130 21% 48%
High 135 22% 50%
Very High 130 21% 48%
Total or Average 626 (Total)
100% (Total)
46% (Average)

36
Seventeen percent of high-quality ECE providers in Massachusetts, or 104 centers, are
located in very low opportunity neighborhoods. The remaining providers are distributed roughly
evenly across the remaining four neighborhood opportunity levels, with approximately 130
centers located in each of the four remaining neighborhood opportunity level types. The percent
of very low opportunity tracts that have at least one provider is 38%, which is a substantially
lower percent (between 9 and 12 percentage points lower) than those found in each of the four
higher opportunity level categories (ranging from low to very high opportunity).
Formal statistical tests, using a logistic regression framework, confirm that very low
opportunity neighborhoods are less likely than other neighborhoods to have a high-quality ECE
provider. The odds of having a high-quality ECE provider are 1.4 times higher in a low
opportunity neighborhood than the odds of having a provider in a very low opportunity tract (See
Figure 1).
*p<0.05, **p<0.01 Note: Omitted category is “very low opportunity” neighborhoods. Twelve tracts with child populations of zero are excluded from analysis.
Figure 1. Odds of Having a High-Quality Center in Tract (Compared to Very Low Opportunity Tracts)
N=1,349
Log-likelihood: -927.140
1.41*
1.48*
1.58**
1.47*
1.30
1.35
1.40
1.45
1.50
1.55
1.60
Low opportunity Moderate opportunity
High opportunity Very high opportunity
Odd
s R
atio
Neighborhood Opportunity Level

37
The relationship between likelihood of presence of a high-quality provider and
neighborhood opportunity is linear and monotonically increasing from the very low opportunity
level up through the high opportunity level. However, very high opportunity neighborhoods are
less likely than high opportunity neighborhoods to have a provider and have about the same
likelihood of having a provider as moderate opportunity neighborhoods (although very high
opportunity neighborhoods still have a higher likelihood of having a provider than low and very
low opportunity neighborhoods). These regression results, like all others presented, are
unadjusted.
Since we know that racial and ethnic minority children are more likely to live in lower
opportunity neighborhoods, the next question is: How are children of different race/ethnic
groups distributed across different neighborhood “types” (in terms of neighborhood opportunity
and the presence of a high-quality provider). There are ten potential neighborhood “types” that
children could reside in. See Figure 2.
Figure 2. Overview of Neighborhood Types by Neighborhood
Opportunity and Presence of High-Quality ECE Center
Has High-Quality ECE Center? No Yes
Nei
ghbo
rhoo
d O
ppor
tuni
ty L
evel
Very Low Very Low Opp.- No Center
Very Low Opp.- Has Center
Low Low Opp.- No Center
Low Opp.- Has Center
Moderate Moderate Opp. – No Center
Moderate Opp. – Has Center
High High Opp.- No Center
High Opp.- Has Center
Very High Very High Opp. – No Center
Very High Opp. – Has Center

38
Note: N values in panels a-d represent children under age 5. N values in panel e represent children under age 18.
Children residing in neighborhoods at every opportunity level, except very low
opportunity, are about equally likely to live in a neighborhood with a high-quality provider as
they are to live in a neighborhood without a high-quality provider (See Table 6). Within the very
low opportunity level, children are less likely to live in a neighborhood with a high-quality
provider and this pattern is most pronounced for racial and ethnic minority and immigrant
children. That said, a sizeable proportion of children living in very low opportunity areas have a
high-quality provider in their neighborhood. This result suggests that, in Massachusetts,
geographic access to high-quality ECE services is greater than access to other dimensions of the
neighborhood opportunity structure for racial and ethnic minority and immigrant children10.
Said another way, racial and ethnic minority and immigrant children are more spatially isolated
from other dimensions of neighborhood opportunity than they are from high-quality ECE
services. While 60% of both black and Hispanic children live in very low opportunity areas,
only 32% of both black and Hispanic children live in very low opportunity areas with no high- 10 It is important to note that geographic access, or geographic/spatial proximity to a high-quality ECE center is only one dimension of access since the ability of any child to access services is also a function of other factors including, for example, the availability of open slots or the affordability of services. However, geographic access is a minimally sufficient condition--without at least one center to access, other dimensions of access become irrelevant.
Table 6. Distribution of Children by Race/Ethnicity/Nativity Across Neighborhood Types (Massachusetts)
(a) (b) (c) (d) (e)
All Children
White Children
Black Children
Hispanic Children Foreign-Born
Children
n=394,848 n=292,939 n=26,977 n=43,316 n=66,869
HQ Provider in Tract?
HQ Provider in Tract?
HQ Provider in Tract?
HQ Provider in Tract?
HQ Provider in Tract?
No Yes Total No Yes Total No Yes Total No Yes Total No Yes Total
Nei
ghb
orh
ood
Op
port
un
ity
Very Low 11% 8% 19% 6% 3% 8% 32% 27% 59% 32% 28% 60% 21% 15% 35% Low 9% 9% 18% 9% 8% 16% 11% 13% 24% 10% 11% 21% 10% 11% 21% Moderate 10% 10% 20% 11% 11% 23% 5% 4% 9% 4% 4% 9% 7% 7% 14% High 11% 12% 22% 13% 14% 27% 2% 3% 5% 2% 3% 5% 4% 6% 10% Very high 11% 11% 21% 13% 13% 25% 2% 1% 3% 2% 3% 5% 9% 10% 19%
Total 51% 49% 100% 51% 49% 100% 52% 48% 100% 51% 49% 100% 51% 49% 100%

39
quality providers. That being said, this still means that over 40% of both black and Hispanic
children live in very low and low opportunity neighborhoods with no high-quality providers,
compared to 15% of white children and 20% of children overall.
Another way to distill the distributional results is to compare, for each group of children,
the likelihood that children live in very low or low opportunity tracts with no providers to the
likelihood that they live in high or very high opportunity tracts with at least one provider (See
Figure 3).
Figure 3. Percent of Children Residing in High Opportunity Areas with Providers vs.
Percent Residing in Low Opportunity Areas without Providers
Massachusetts
Fourteen percent of white children live in very low or low opportunity tracts with NO
providers, while 27% of white children live in high or very high opportunity tracts with at least
one provider. This suggests that white children are almost twice as likely to live in a high/very
high opportunity tract with at least one provider as they are to live in a very low/low opportunity
22%
27%
4%6%
16%
20%
14%
43% 42%
31%
0%
5%
10%
15%
20%
25%
30%
35%
40%
45%
50%
All White Black Hispanic Foreign-Born
Per
cent
of C
hild
ren
High/Very High Opp. With Provider Very Low/Low Opp. NO Provider

40
tract with NO provider. Meanwhile, 43% of black children live in very low or low opportunity
tracts with NO providers compared to the 4% of black children that live in very high/high opp.
tracts with at least one provider. This suggests that black children are 10 times more likely to
live in very low or low opportunity neighborhoods with NO provider than they are to live in high
or very high opportunity areas with a provider. A similar pattern emerges, although to a slightly
lesser extent for Hispanic children. Hispanic children are seven times more likely to live in a
very low/low opportunity neighborhood with NO provider than in a very high/high
neighborhoods with at least one provider. Foreign-born children are about twice as likely to live
in a very low/low opportunity tract with no provider.
In conclusion, in Massachusetts, a substantial proportion of racial and ethnic minority and
immigrant children living in otherwise opportunity poor neighborhoods have neighborhood
access to a high-quality ECE provider. This suggests that spatial access to high-quality ECE
providers does not move in perfect lockstep with other dimensions of the neighborhood
opportunity structure. However, we do find evidence that higher opportunity neighborhoods are
more likely to have high-quality ECE providers. So, while geographic access to high-quality
ECE services appears to be greater than access to other dimensions of neighborhood opportunity
for racial and ethnic minority and immigrant children, a finding of concern is the large and
disproportionate number of these children that live in low and very low opportunity tracts with
NO providers (over 40 percent), who lack access to this critical developmental resource and may
not have sufficient alternative supportive contexts to turn to in the absence of high-quality ECE
providers. A second finding of concern is the high degree of inequity in access to high-quality
neighborhood ECE resources between white children on the one hand and racial and ethnic
minority and immigrant children on the other.

41
Low Opportunity Neighborhoods with High-Quality ECE Providers: Spatial Patterns
Given evidence that substantial numbers of high-quality ECE providers choose to locate
in very low opportunity neighborhoods in Massachusetts, the question arises whether there is
anything unique or systematic in the spatial patterns related to these neighborhoods. More
specifically, we ask whether the 104 very low opportunity neighborhoods that have at least one
high-quality provider are more likely to be surrounded by other low opportunity neighborhoods
or by higher opportunity neighborhoods. Note that this spatial analysis is univariate and only
considers the opportunity level of the neighborhoods that surround the 104 very low opportunity
neighborhoods with at least one high-quality provider. In other words, we are not considering
whether surrounding neighborhoods also have a high-quality provider (this analysis falls outside
of the scope of this paper and will be included in future analysis). Figure 4 presents some
contrasting patterns we may expect to find.
Figure 4. Contrasting Hypothetical Spatial Patterns of
Neighborhood Opportunity and ECE Provider Availability
Very low opportunity neighborhoods with providers tend to be surrounded by other very low opportunity neighborhoods (i.e., in areas of spatially concentrated disadvantage)
Very low opportunity neighborhoods with providers tend to be surrounded by higher opportunity neighborhoods
No pattern found in opportunity levels of neighborhoods surrounding very low opportunity neighborhoods with providers (i.e., perfect dispersion)
Very Low Opp. Neighborhood w/ high-quality provider Very low opportunity neighborhood Moderate opportunity neighborhood High opportunity neighborhood

42
Among all 273 very low opportunity neighborhoods in Massachusetts, 82% have “low-
low” LISA statistic values--the statistic we use to test whether neighborhood opportunity level in
a given location is statistically associated with opportunity levels in surrounding (contiguous)
neighborhoods. This means that 82% of very low opportunity neighborhoods are located in
clusters of spatially concentrated disadvantage. So, not only are 60% of both black and Hispanic
children living in very low opportunity areas, most are living in areas of spatially concentrated
disadvantage. In other words, they cannot simply access higher resourced neighborhoods by
traveling to nearby or neighboring higher opportunity areas. The remaining 18% of very low
opportunity tracts have non-statistically significant LISA values, suggesting that opportunity
levels in these neighborhoods are not spatially associated with neighboring tracts.
Table 7. Distribution of Local Indicators of Spatial Autocorrelation (LISA) Statistics Among Very Low Opportunity Tracts
(Massachusetts)LISA Statistic Value
% of Very Low Opp. Tracts
ALL (n=273)
% Very Low Opp. Tracts
WITH Provider (n=104)
% Very Low Opp. Tracts
No Provider (n=169)
Not significant 18% 21% 16%
High-high 0% 0% 0%
Low-Low 82% 79% 84%
Low-High 0% 0% 0%
High-Low 0% 0% 0%
Total 100% 100% 100%
Among the 273 very low opportunity neighborhoods, 104 neighborhoods have at least
one high-quality provider. In testing whether spatial patterns surrounding these neighborhoods
are different from very low opportunity neighborhoods without a provider, we find that 79% of
very low opportunity neighborhoods with a provider have “low-low” LISA values and the
remaining 21% have non-statistically significant LISA values (Table 7). These results suggest
two things. First, among very low opportunity tracts, the spatial relationships with neighboring

43
tracts are not systematically different for tracts with and without providers. Second, these results
suggest that high-quality providers are choosing to locate in areas of spatially concentrated
disadvantage in Massachusetts, instead of very low opportunity areas that are proximal to higher
opportunity areas.
Head Start Centers: An Important Sub-Analysis
Thus far in the analysis we have not distinguished between private and publicly funded
centers, however, separate analysis of publicly-funded programs is pertinent given that in
Massachusetts, racial and ethnic minority and immigrant children--the population of focus--are
more likely to be income eligible for public programs, including Head Start, than white children.
As the largest federally funded early childhood care and education program for poor children,
Head Start is among the publicly-funded ECE programs with a strong presence in the state.
Table 8. Distribution of High-Quality Head Start Centers by Neighborhood Opportunity Level (Massachusetts)
Neighborhood Opp. Level Number of High-Quality HS Centers
Percent of High-Quality HS Centers
Very low 23 29% Low 29 37% Moderate 19 24% High 7 9% Very High 2 3% Total 80 100%
In Massachusetts, there are 80 high-quality (NAEYC accredited) Head Start centers,
representing just over one third of all Head Start centers in the state. These Head Start centers
are spread across 77 neighborhoods, with close to 70% of all high-quality Head Start centers
located in very low or low opportunity neighborhoods. Another quarter of centers are located in
moderate opportunity areas and 12% are located in high and very high opportunity areas. See
Table 8.

44
Table 9. Distribution of Children by Race/Ethnicity/Nativity Across Neighborhood Types (Massachusetts)
(a) (b) (c) (d) (e)
All Children
White Children
Black Children
Hispanic Children Foreign-Born
Children
n=394,848 n=292,939 n=26,977 n=43,316 n=66,869
HQ HS in Tract? HQ HS in Tract? HQ HS in Tract? HQ HS in Tract? HQ HS in Tract?
No Yes Total No Yes Total No Yes Total No Yes Total No Yes Total
Nei
ghb
orh
ood
Op
port
un
ity Very Low 17% 2% 19% 8% 0% 8% 52% 7% 59% 51% 9% 60% 31% 5% 35%
Low 16% 2% 18% 15% 2% 16% 21% 4% 24% 18% 3% 21% 18% 3% 21% Moderate 18% 2% 20% 21% 2% 23% 7% 1% 9% 8% 1% 9% 13% 1% 14% High 22% 0% 22% 27% 0% 27% 5% 0% 5% 4% 0% 5% 10% 0% 10% Very high 21% 0% 21% 25% 0% 25% 3% 0% 3% 5% 0% 5% 19% 0% 19%
Total 94% 6% 100% 95% 5% 100% 88% 12% 100% 87% 13% 100% 91% 9% 100%
Note: N values in panels a-d represent children under age 5. N values in panel e represent children under age 18.
Despite child poverty rates for children under age 5 in Massachusetts of approximately
12-13%, only 6% of all children in Massachusetts have a high-quality Head Start center in their
neighborhood. Poverty rates among white children in Massachusetts are approximately 7% and
about 5% of white children in Massachusetts live in neighborhoods with a high-quality Head
Start center. Meanwhile, while black and Hispanic child poverty rates are substantially higher
than those for white children at approximately 29% and 36%, respectively, only 12% of black
children live in neighborhoods with a high-quality Head Start center and only 13% of Hispanic
children live in neighborhoods with a high-quality Head Start center. Similar patterns hold to a
lesser extent for immigrant children.
Regression analysis shows that high and very high opportunity neighborhoods are
significantly less likely than very low opportunity neighborhoods to have a high-quality Head
Start center. Differences in likelihood of presence of a high-quality Head Start center between
very low, low and moderate opportunity neighborhoods are not statistically significant. As a
reminder, these regression results, like all other regression results presented, are unadjusted.

45
*p<0.05, **p<0.01 Note: Omitted category is “very low opportunity” neighborhoods. Twelve tracts with child populations of zero are excluded from analysis.
Zooming into the 77 tracts with high-quality Head Start centers, we find that in 41 tracts (over
half), the opportunity levels of the tract and the neighboring tracts are not statistically
significantly associated. However, 30 tracts (or close to 40%) with a high-quality Head Start
center, which comprise 40% of all high-quality Head Start centers in the State, have “low-low”
LISA values. Low-low LISA values suggest that these neighborhoods are themselves low
opportunity areas and that own-neighborhood opportunity level is statistically significantly
related to opportunity levels in surrounding neighborhoods (which are also low). This is
suggestive that among the existing high-quality Head Start centers, a preponderance of these
centers locates in areas of spatially concentrated disadvantage. In other words, they tend to be
located in very low / low opportunity neighborhoods surrounded by other low opportunity
neighboring areas.
Figure 5. Odds of Having a High-Quality Head Start Center in Tract (Compared to Very Low Opportunity Tracts)
Massachusetts N=1,349
Log-likelihood: -276.810
1.24
0.84
0.30**
0.08**0.00
0.20
0.40
0.60
0.80
1.00
1.20
1.40
Low opportunity Moderate opportunity
High opportunity Very high opportunity
Odd
s R
atio
Neighborhood Opportunity Level

46
Ohio Descriptive Overview
Table 10. Selected Descriptive Characteristics of State Child Populations
Ohio
Racial/Ethnic Composition of Children Under Age 5 (n=754,930) Non-Hispanic White 77% Non-Hispanic Black 14% Hispanic (Any Race) 3% Non-Hispanic Other Race 5% Total 100% Immigrant Composition of Children Under Age 18 (n= 2,884,632) Percent Foreign-Born (born outside U.S.) 1% Poverty Rates by Race/Ethnicity for Children Under Age 5 All Children 17% Non-Hispanic White Children 12% Non-Hispanic Black Children 44% Hispanic Children 28%
Source: Author tabulations of 2000 U.S. Census of Population and Housing, Summary File 1 and Summary File 4.
Table 10 provides an overview of relevant characteristics of the Ohio (OH) child
population. In OH, approximately 23% of children under age 5 are racial and ethnic minority
children. Fourteen percent of all children in OH are non-Hispanic black, three percent of
children are Hispanic (all races), and one percent of all children under 18 years old are foreign-
born. Poverty rates among white and racial and ethnic minority children in OH differ
substantially. While the overall child poverty rate is 17 percent, 12 percent of white children
under age 5 in Ohio are poor compared to 44 percent of black children, and 28 percent of
Hispanic children. So, while the combined size of the black and Hispanic child populations (17
percent of children) is small compared to the size of the white child population (compared to 77
percent of children) in Ohio, together black and Hispanic children represent over 40% of the
state’s poor children.
47
Spatial Distribution of Neighborhood Opportunity
In 2010, the Kirwan Institute performed an opportunity mapping analysis for the state of
Ohio that provided an overview of the spatial distribution, or geographic footprint, of
neighborhood-level opportunity across the state, based on education and child welfare, economic
opportunity and mobility, housing/neighborhood and community development, public health,
and public safety, and criminal justice indicators (For more detail, see Methods section). Map 4a
is a comprehensive opportunity map that shows the spatial distribution of neighborhood
opportunity across Ohio. Map 4b shows the comprehensive opportunity map plus the locations
of high-quality ECE providers. It is clear from Map 4a that high and low opportunity areas each
tend to cluster together in certain regions of the state. For example, almost the entire southeast
and southern central portion of the state is comprised of a large spatial cluster of very low and
low opportunity areas. Near each of the major cities (Cleveland, Columbus, Cincinnati, Dayton,
Toledo, Akron) similar patterns emerge where we observe clusters of very low opportunity
neighborhoods near the central cities and then clusters of very high opportunity areas in the areas
that surround the urban centers. In regions between major cities in the central, northern and
western parts of the state there is more dispersion of opportunity (or dissimilarity between
neighborhood opportunity levels), however, these areas are mainly comprised of low, moderate
and high opportunity areas (there are relatively few very low opportunity or very high
opportunity neighborhoods).
For the entire state of Ohio, the Global Moran’s I statistic for spatial autocorrelation in
neighborhood opportunity levels is 0.6811. This suggests strong presence of positive spatial
autocorrelation, which means that the level of opportunity in any one neighborhood is strongly
positively related to the level of opportunity in the surrounding (contiguous) neighborhoods. In
11Rook continuity is assumed for calculating spatial weights.

48
practice, this means that similar or like values cluster together; high opportunity neighborhoods
have a strong tendency to cluster with other high opportunity neighborhoods and low opportunity
neighborhoods have a strong tendency to cluster with other low opportunity neighborhoods.
In addition to global tests of spatial autocorrelation, we also performed Local Moran’s i
tests. Map 5 shows the distribution of neighborhood LISA statistics for the entire state of Ohio.
This map formalizes the clustering patterns we saw in Map 4a, by identifying the clusters where
the spatial association between neighborhoods is statistically significant (p<.05). The bright red
(high-high) values represent high opportunity neighborhoods that are statistically associated with
their neighbors who are also high opportunity neighborhoods (i.e., spatial clusters of high
opportunity or areas of spatially concentrated advantage). The bright blue (low-low) values
represent low opportunity neighborhoods that are statistically associated with their neighbors
who are also low opportunity neighborhoods (i.e. spatial clusters of low opportunity or areas of
spatially concentrated disadvantage). The light blue (low-high) and light red (high-low) values
represent instances of negative spatial autocorrelation – for example, low-high values represent
neighborhoods that are low opportunity neighborhoods surrounded by higher opportunity
neighborhoods. Table 11 shows that 58% of the neighborhoods in OH do not have statistically
significant spatial association with their surrounding neighborhoods. Among the remaining 42%
of neighborhoods that do have statistically significant LISA values, 20% have “high-high” LISA
values and 20% have “low-low” LISA values. This means that 20% of neighborhoods in OH are
in areas of spatially concentrated advantaged and another 20% of neighborhoods are in areas of
spatially concentrated disadvantage.

49
Table 11. Distribution of Local Indicators of Spatial Autocorrelation (LISA) Statistics
(Ohio)
LISA Statistic Value Number of Tracts Percent of Tracts
Not significant 1,690 58% High-high 597 20% Low-Low 585 20% Low-High 20 1% High-Low 43 1% Total 2,935 100%
Both the global and local tests of spatial association reveal that the geography of
opportunity in Ohio is not spatially random, suggesting that a good proportion of children
throughout the state are likely to live in either areas of concentrated high opportunity or
concentrated disadvantage--areas that are spatially isolated from opportunity. To the extent that
these geographic patterns occur along racial and ethnic lines, these clusterings or concentrations
of high and low advantage can have significant implications for equity in children’s access to
opportunity.
Spatial Distribution of Children by Race, Ethnicity, Immigrant Status
Maps 6a, 6b, 6c and 6d show that racialized isolation from neighborhoods of opportunity
is very evident in Ohio. Across the state, racial and ethnic minority children are much more
likely to live in lower opportunity neighborhoods than non-Hispanic white children. Table 12
shows that 35% of all children in Ohio under age 5 live in very low or low opportunity
neighborhoods, with the remaining 65 percent of children under age 5 roughly evenly split across
moderate, high and very high opportunity neighborhoods. Comparing panels (b)-(e) of Table 12
we see that while 8 percent of all non-Hispanic white children live in very low opportunity tracts,

50
56% of non-Hispanic black and 28% of Hispanic children live in very low opportunity tracts,
respectively and 12% of foreign-born children under age 18 live in very low opportunity tracts.
Table 12. Distribution of Children by Race/Ethnicity/Nativity Across Neighborhood Opportunity Levels (Ohio)
(a) (b) (c) (d) (e)
All Children
White Children
Black Children
Hispanic Children
Foreign-Born Children
n=754,930 n=584,828 n=108,785 n=25,216 n=31,976
Nei
ghb
orh
ood
O
pp
ortu
nit
y Very Low 16% 8% 56% 28% 12% Low 19% 18% 21% 21% 16% Moderate 20% 23% 10% 19% 13% High 22% 25% 8% 17% 20% Very high 23% 26% 6% 15% 39%
Total 100% 100% 100% 100% 100%
Sources: Author tabulations. Neighborhood population counts by race, ethnicity and immigrant status: 2000 Census. Neighborhood Opportunity: OH Opportunity Mapping Analysis, Kirwan Institute (Powell & Grant-Thomas, 2010). N values in panels a-d represent children under age 5. N values in panel e represent children under age 18.
Moreover, large percentages of racial and ethnic minority children are living in
neighborhoods that are spatially isolated from opportunity, particularly non-Hispanic black
children in Ohio. Table 13 shows that 50% of non-Hispanic black and 26% of Hispanic children
live in areas of concentrated disadvantage (compared to 10% of white children and 16% of
children overall). These are neighborhoods that are not only themselves low opportunity
neighborhoods but that are also surrounded by low opportunity neighborhoods (i.e., they have
“low-low” LISA statistics). Among the large amounts of non-Hispanic black and Hispanic
children living in very low and low opportunity areas (77% and 49%, respectively), non-
Hispanic black children are more likely than Hispanic children to live in the areas that are the
most spatially isolated from opportunity.
51
Table 13. Concentration of Children in High Opportunity vs. Low Opportunity Spatial Clusters by Race, Ethnicity, and Immigrant Status (Ohio)
% in High Opp. Clusters % in Low Opp. Clusters Under Age 5: All Children 23% 16% Non-Hispanic White 26% 10% Non-Hispanic Black 7% 50% Hispanic 15% 26%
Under Age 18: All Children 24% 16% Foreign-Born Children 41% 10%
It is clear that racial and ethnic minority children in Ohio suffer higher rates of poverty
and live in lower opportunity neighborhoods that are also spatially isolated from higher
opportunity areas. The question remains whether racial and ethnic minority children are also
more likely to be deprived of a critical neighborhood resource-the high-quality ECE center--that
holds promise to offset some of the accumulative negative effects that neighborhood
disadvantage can have on child development.
Neighborhood Opportunity, High-Quality Early Childhood Care and Education Centers, and Racial/Ethnic Differences
In Ohio, there are 206 high-quality (NAEYC-accredited) ECE centers, representing about
10% of all licensed ECE providers in the state. These providers are located in 184 of the 2,935
neighborhoods across the state of Ohio. Therefore, just over 6% of neighborhoods in Ohio have
one or more high-quality ECE providers (See Table 14). Of the 184 neighborhoods with at least
one high-quality provider, 163 (or 88%) have one provider, 20 (or 11%) have two providers and
one neighborhood has three providers.

52
Table 14. Distribution of High-Quality Centers by Neighborhood Opportunity Level (Ohio)
Neighborhood Opp. Level
Num. of Neighborhoods with
High-Quality Centers
% of Neighborhoods with
High-Quality Centers
% of Neighborhood within Opp. Level with
at least 1 provider
Very Low 40 22% 7%
Low 30 16% 5% Moderate 22 12% 4% High 30 16% 5%
Very High 62 34% 10% Total or Average 184
(Total) 100%
(Total) 6%
(Average)
Just over twenty percent of high-quality ECE providers in Ohio, or 40 centers, are located
in very low opportunity neighborhoods, while 34 percent of high-quality centers are located in
very high opportunity areas. Low, moderate and high opportunity areas have fewer centers than
very high opportunity and very low opportunity neighborhoods. The percent of very low
opportunity tracts that have at least one provider is 7%, which is lower than the percent found in
very high opportunity neighborhoods (10% of high opportunity tracts have at least one provider).
Formal statistical tests, using a logistic regression framework reveal that likelihood of
presence of a high-quality provider varies depending on neighborhood opportunity level.
[remainder of this page intentionally left blank]

53
*p<0.05, **p<0.01 Note: Omitted category is “very low opportunity” neighborhoods. Fifteen tracts with child populations of zero are excluded from analysis.
Figure 6 shows, however, that the likelihood of having a center does not monotonically increase
or decrease with opportunity level. Moderate opportunity neighborhoods are less likely than
very low opportunity neighborhoods to have a high-quality ECE center. A moderate opportunity
tract has odds 0.53 times as high as a very low opportunity tract of having a high-quality
provider. Meanwhile very high opportunity neighborhoods have odds 1.6 times higher than very
low opportunity neighborhoods of having a high-quality ECE center. There is no statistical
evidence of differences in likelihood of having a neighborhood provider between very low, low
and high opportunity neighborhoods. As a reminder, these regression results, like all other
regression results presented, are unadjusted.
Figure 6. Odds of Having a High-Quality Center in Tract (Compared to Very Low Opportunity Tracts)
Ohio N=2,920
Log-likelihood: -671.394
0.75
0.53*
0.73
1.60*
0.00
0.20
0.40
0.60
0.80
1.00
1.20
1.40
1.60
1.80
Low opportunity Moderate opportunity
High opportunity Very high opportunity
Odd
s R
atio
Neighborhood Opportunity Level

54
So far, we have established that in Ohio, children of different racial and ethnic groups
have unequal probabilities of living in high, moderate or low opportunity areas and that
likelihood of presence of a high-quality center varies with neighborhood opportunity level.
Therefore, the next question is: How are children of different race/ethnic groups distributed
across different neighborhood “types” (in terms of neighborhood opportunity and the presence of
a high-quality provider). There are ten potential neighborhood “types” (in terms of
neighborhood opportunity and presence of high-quality ECE center) that children could reside in.
See Figure 2 in Massachusetts results section for overview of ten neighborhood “types”.
Note: N values in panels a-d represent children under age 5. N values in panel e represent children under age 18.
The most striking finding that emerges from Table 15 is the extremely small percentage
of children in Ohio that live in a neighborhood with a high-quality ECE provider. Among all
children, only 7% live in a neighborhood with a high-opportunity provider and only slightly
higher percentages of children living in very high opportunity neighborhoods have neighborhood
access to a high-quality ECE provider. Another finding that emerges is that 7% of non-Hispanic
black children living in very low and low opportunity areas live in tracts with a high-quality
Table 15. Distribution of Children by Race/Ethnicity/Nativity Across Neighborhood Types (Ohio)
(a) (b) (c) (d) (e)
All Children
White Children
Black Children
Hispanic Children
Foreign-Born Children
n=754,930 n=584,828 n=108,785 n=25,216 n=31,976
HQ Provider in Tract?
HQ Provider in Tract?
HQ Provider in Tract?
HQ Provider in Tract?
HQ Provider in Tract?
No Yes Total No Yes Total No Yes Total No Yes Total No Yes Total
Nei
ghb
orh
ood
Op
port
un
ity Very Low 15% 1% 16% 8% 0% 8% 51% 5% 56% 27% 2% 28% 11% 2% 12%
Low 18% 1% 19% 18% 1% 18% 19% 2% 21% 20% 1% 21% 14% 2% 16% Moderate 20% 1% 20% 22% 1% 23% 9% 1% 10% 17% 1% 19% 12% 1% 13% High 21% 1% 22% 23% 1% 25% 7% 1% 8% 16% 1% 17% 19% 1% 20% Very high 20% 3% 23% 23% 3% 26% 5% 1% 6% 13% 2% 15% 32% 6% 39%
Total 93% 7% 100% 93% 7% 100% 91% 9% 100% 93% 7% 100% 88% 12% 100%

55
provider, compared to 2% of all children living in very low and low opportunity tracts, 1% of
non-Hispanic white children living very low/low opportunity tracts, and 3% of Hispanic children
living in very low/low opportunity tracts. This is suggestive that providers in very low
opportunity neighborhoods are choosing to locate in areas with larger concentrations of non-
Hispanic black children.
Another way to distill the distributional results is to compare, for each group of children,
the likelihood that children live in very low or low opportunity tracts with no providers to the
likelihood that they live in high or very high opportunity tracts with at least one provider (See
Figure 7).
Figure 7. Percent of Children Residing in High Opportunity Areas with Providers vs.
Percent Residing in Low Opportunity Areas without Providers
Ohio
Only four percent of children in Ohio live in a high/very high opportunity neighborhood
with a provider compared to over 30% of children who live in very low/low opportunity
4% 4%1% 3%
7%
33%
25%
70%
47%
25%
0%
10%
20%
30%
40%
50%
60%
70%
80%
All White Black Hispanic Foreign-Born
Per
cent
of C
hild
ren
High/Very High Opp. With Provider Very Low/Low Opp. NO Provider

56
neighborhoods with NO provider. This demonstrates the scarcity of high-quality ECE services
in Ohio for neighborhoods across the opportunity spectrum. Children in Ohio are more than eight
times more likely to live in a very low/low opportunity area without a provider than in a high
opportunity neighborhood with a provider. The patterns are even more pronounced for non-
Hispanic black and Hispanic children with non-Hispanic black children 70 times more likely and
Hispanic children 16 times more likely to live in a very low/low opportunity neighborhood
without a provider than in a high opportunity neighborhood with a provider. The end result is
large proportions of racial and ethnic minority children living in neighborhoods that are deprived
of both high-quality ECE resources and other critical developmentally supportive neighborhood
resources resulting in many neighborhoods of accumulative disadvantage for racial and ethnic
minority children in Ohio.
Low Opportunity Neighborhoods with High-Quality ECE Providers: Spatial Patterns
Given that in Ohio (like in Massachusetts), we find high-quality providers located in very
low opportunity areas, we test whether the 40 very low opportunity neighborhoods that have a
high-quality ECE center in Ohio are more likely to be surrounded by other low opportunity areas
or by higher opportunity neighborhoods. See Figure 4 (in Massachusetts results section) for
examples of some contrasting patterns we may expect to find. Similar to the analysis for
Massachusetts, we perform a univariate analysis that only considers the opportunity level of the
neighborhoods that surround the very low opportunity neighborhoods with at least one high-
quality provider (i.e., we do not also consider the presence of high-quality ECE provider in
surrounding neighborhoods).
Among all 591 very low opportunity neighborhoods in Ohio, 76% have “low-low” LISA
statistic values. This means that 76% of very low opportunity neighborhoods are located in
clusters of spatially concentrated disadvantage. As a result, 50% of all non-Hispanic black

57
children and 26% of all Hispanic children are living in areas of spatially concentrated
disadvantage--i.e., they cannot simply access higher resourced neighborhoods by traveling to
nearby or neighboring higher opportunity areas (this compares to 10% of all white children and
16% of children overall). The remaining 24% of very low opportunity tracts have non-
statistically significant LISA values, suggesting that opportunity levels in these neighborhoods
are not spatially associated with neighboring tracts.
Table 16. Distribution of Local Indicators of Spatial Autocorrelation (LISA) Statistics Among Very Low Opportunity Tracts
(Ohio)LISA Statistic Value
% of Very Low Opp. Tracts ALL
(n=591)
% Very Low Opp. Tracts
WITH Provider (n=40)
% Very Low Opp. Tracts
No Provider (n=551)
Not significant 24% 25% 24% High-high 0% 0% 0% Low-Low 76% 75% 76% Low-High <1% 0% <1% High-Low 0% 0% 0% Total 100% 100% 100%
Among the 591 very low opportunity neighborhoods, 40 neighborhoods have at least one
high-quality provider. In testing whether spatial patterns surrounding these neighborhoods are
different from very low opportunity neighborhoods without a provider, we find that 75% of very
low opportunity neighborhoods with a provider have “low-low” LISA values and the remaining
25% have non-statistically significant LISA values (Table 16). These results suggest two things.
First, among very low opportunity tracts, the spatial relationships with neighboring tracts are not
systematically different for tracts with and without providers. Second, these results suggest that
high-quality providers are choosing to locate in areas of spatially concentrated disadvantage in
Ohio, instead of very low opportunity neighborhoods that are proximal to higher opportunity
areas.

58
Head Start Centers: An Important Sub-Analysis
Thus far in the analysis we have not distinguished between private and publicly funded
centers, however, separate analysis of publicly-funded programs is pertinent given that in Ohio,
racial and ethnic minority children--the population of focus--are more likely to be income
eligible for public programs, including Head Start, than white children. As the largest federally
funded early childhood care and education program for poor children, Head Start is among the
publicly-funded ECE programs with a strong presence in the state.
Table 17. Distribution of High-Quality Head Start Centers by Neighborhood Opportunity Level (Ohio)
Neighborhood Opp. Level Number of High-Quality HS Centers
Percent of High-Quality HS Centers
Very low 9 47% Low 7 37% Moderate 1 5% High 2 11% Very High 0 0% Total 19 100%
In Ohio, there are 19 high-quality (NAEYC accredited) Head Start centers, representing
3% of all Head Start centers in the state. These Head Start centers are spread across 19
neighborhoods, with 16 (or 84%) of all high-quality Head Start centers located in very low or
low opportunity neighborhoods. Of the remaining three centers, one is located in a moderate
opportunity neighborhood and two are located in high opportunity centers. See Table 17.

59
Table 18. Distribution of Children by Race/Ethnicity/Nativity Across Neighborhood Types (Ohio)
(a) (b) (c) (d) (e)
All Children
White Children
Black Children
Hispanic Children
Foreign-Born Children
n=754,930 n=584,828 n=108,785 n=25,216 n=31,976
HQ HS in Tract? HQ HS in Tract? HQ HS in Tract? HQ HS in Tract? HQ HS in Tract?
No Yes Total No Yes Total No Yes Total No Yes Total No Yes Total
Nei
ghb
orh
ood
Op
port
un
ity Very Low 15.7 0.3 16.0 7.8 0.2 8.0 55.3 0.6 55.9 27.5 0.9 28.4 11.8 0.3 12.1
Low 18.7 0.3 19.0 18.2 0.3 18.5 20.8 0.2 21.0 20.8 0.2 21.0 15.7 0.1 15.8 Moderate 20.5 0.0 20.5 22.8 0.0 22.8 9.5 0.0 9.5 18.7 0.0 18.7 13.2 0.2 13.4 High 21.6 0.1 21.7 24.5 0.1 24.7 7.6 0.0 7.6 16.8 0.0 16.8 20.0 0.1 20.1 Very high 22.8 0.0 22.8 26.1 0.0 26.1 5.9 0.0 5.9 15.0 0.0 15.0 38.6 0.0 38.6
Total 99.3 0.7 100.0 99.3 0.7 100.0 99.1 0.9 100.0 98.8 1.2 100.0 99.4 0.6 100.0
Note: N values in panels a-d represent children under age 5. N values in panel e represent children under age 18.
Despite child poverty rates in Ohio of 17% for children under age 5, less than 1% of all
children in Ohio have a high-quality Head Start center in their neighborhood. Poverty rates
among white children in Ohio are approximately 12% and less than 1% of white children in Ohio
live in a neighborhood with a high-quality Head Start center. Also, while black and Hispanic
child poverty rates are substantially higher than those for white children at approximately 44%
and 28%, respectively, just under 1% of black children live in neighborhoods with a high-quality
Head Start center and just over 1% of Hispanic children live in neighborhoods with a high-
quality Head Start center.
Regression analysis shows that moderate and high opportunity neighborhoods are
significantly less likely than very low opportunity neighborhoods to have a high-quality Head
Start center. Differences in likelihood of presence of a high-quality Head Start center between
very low and low opportunity neighborhoods are not statistically significant. Very high
opportunity neighborhoods were excluded from the analysis since none of these neighborhoods
had a Head Start center.

60
*p<0.05, **p<0.01, ***p<0.10 Note: Omitted category is “very low opportunity” neighborhoods. Twelve tracts with child populations of zero are excluded from analysis and all 593 very high opportunity tracts were omitted since no very high opportunity tracts had a high-quality Head Start center.
Zooming into the 19 tracts with high-quality Head Start centers, we find that in 11 tracts (close to
60%), the opportunity levels of the tract and the neighboring tracts are not statistically
significantly associated. However, the remaining 8 tracts (just over 40%) with a high-quality
Head Start center, have “low-low” LISA values. Low-low LISA values suggest that these
neighborhoods are themselves low opportunity areas and that own-neighborhood opportunity
level is statistically significantly related to opportunity levels in surrounding neighborhoods
(which are also low). This is suggestive that among the existing high-quality Head Start centers,
a preponderance of these centers locates in areas of spatially concentrated disadvantage. In
other words they tend to located in very low / low opportunity neighborhoods surrounded by
other low-opportunity neighboring areas.
Figure 8. Odds of Having a High-Quality Head Start Center in Tract (Compared to Very Low Opportunity Tracts)
Ohio N=2,327
Log-likelihood: -104.921
0.82
0.11*
0.22***
0.00
0.10
0.20
0.30
0.40
0.50
0.60
0.70
0.80
0.90
Low opportunity Moderate opportunity High opportunity
Odd
s R
atio
Neighborhood Opportunity Level

61
Comparison of Massachusetts and Ohio Results
In terms of demographic characteristics of children in the two states, the racial/ethnic
composition of the child populations under 5 years old in MA and OH are comparable, although
the scales differ. Ohio’s child population is about twice the size of the child population in
Massachusetts (roughly 800,000 compared to 400,000 children under age 5). Also, in MA,
Hispanic children represent a substantially larger share of the child population than they do in
OH. Poverty rates among young children are substantially higher in Ohio than in Massachusetts
(17% in OH compared to 12% in MA). However, a pattern that holds in both states is that non-
Hispanic black and Hispanic children experience substantially higher rates of poverty than non-
Hispanic white children. However, the rates of poverty for black children in Ohio (44%) are
substantially higher than black child poverty rates in MA (29%), while Hispanic child poverty
rates in MA (39%) are higher than those in OH (28%). Also, the immigrant child population in
Ohio is about half the size of that of MA and appears to be more advantaged than the immigrant
child population in MA.
In terms of the geographic footprints of opportunity in both Ohio and Massachusetts,
again we find more similarities than differences. In both states, we find strong clustering
patterns where very high opportunity neighborhoods have a strong tendency to cluster together
and very low opportunity neighborhoods tend to cluster together. The Moran’s I values in both
states are similar (0.74 in MA and 0.68 in Ohio) with strong positive spatial autocorrelation in
neighborhood opportunity found in both states. These statewide patterns are driven by about 40%
of neighborhoods in each state. Said another way, about 60% of neighborhoods are not part of
statistically significant spatial clusters, while the remaining 40% of neighborhoods are. Among
the 40% of neighborhoods that are part of statistically significant spatial clusters, about half (or
20%) are clusters of spatially concentrated advantage and the other 20% are clusters of spatially

62
concentrated disadvantage. The conclusion is that a large portion of children in both states live
in one of these two types of clusters. Because these cluster patterns also fall along racial/ethnic
lines in both states, they raise significant concern about racial/ethnic equity in access to
opportunity for large shares of the state child populations in both places.
While Massachusetts and Ohio share similar demographic and geographic patterns (in
terms of spatial distribution of neighborhood opportunity), the results of analyses related to high-
quality ECE center locations diverge meaningfully. One very notable finding is how many fewer
high-quality ECE centers there are in Ohio compared to Massachusetts (MA has 936 high-
quality ECE centers compared to 206 high-quality ECE centers in Ohio). Meanwhile, the child
population of MA is about half the size of the child population of Ohio. Overall, this difference
translates into 2.34 centers per 1,000 children in MA compared to 0.27 centers per 1,000
children. This ratio for MA is over eight times higher than the ratio for Ohio. At the
neighborhoods level, only 6% of Ohio neighborhoods have at least one high-quality ECE
provider compared to 49% of neighborhoods in Massachusetts.
The overall scarcity of high-quality ECE centers in Ohio also leads to in large differences
between MA and OH in the extent to which children in very low and low opportunity
neighborhoods have local access to high-quality ECE services. In Massachusetts, almost half of
all black and Hispanic children living in very low and low opportunity areas have a high-quality
provider in their neighborhood. This is an encouraging result. It still leaves large portions of
children without neighborhood access to a high-quality ECE provider, but it suggests the
possibility that critically important developmental resources for young children can be made
available otherwise resource impoverished areas. However, we see a stark contrast in Ohio. In
Ohio, 7% of black children and 3% of Hispanic children living in very low or low opportunity
areas have neighborhood access. This is a huge difference. First, it suggests that something is
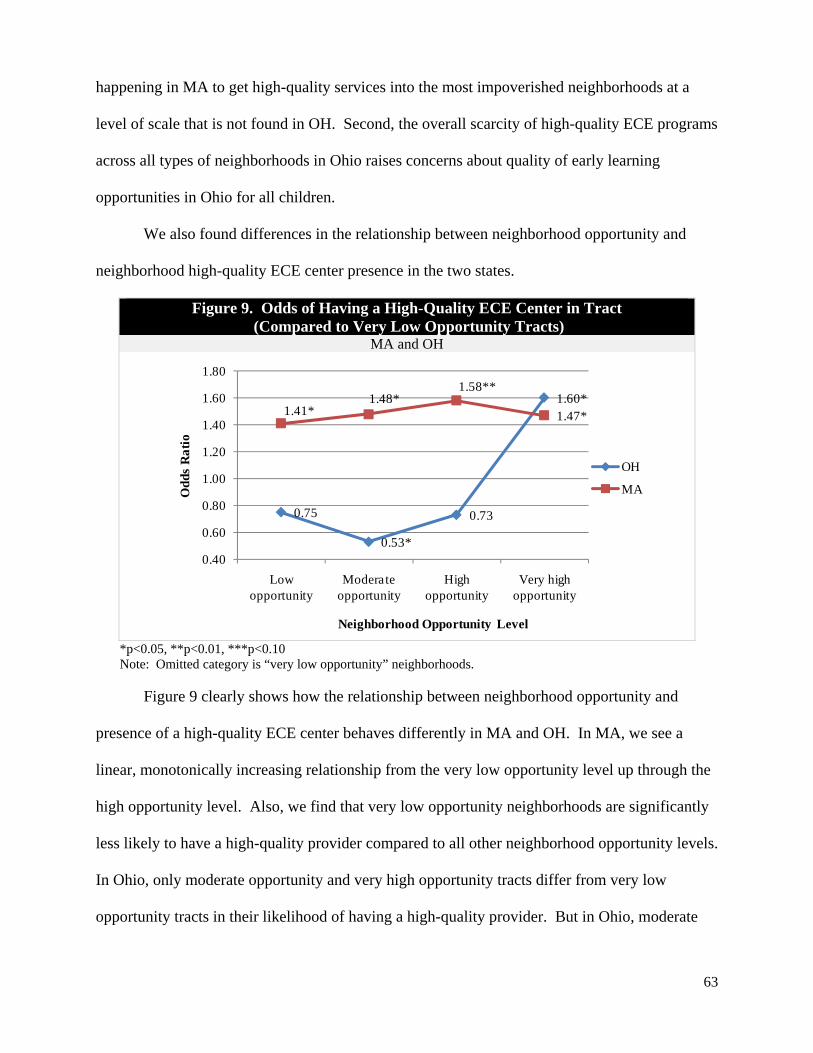
63
happening in MA to get high-quality services into the most impoverished neighborhoods at a
level of scale that is not found in OH. Second, the overall scarcity of high-quality ECE programs
across all types of neighborhoods in Ohio raises concerns about quality of early learning
opportunities in Ohio for all children.
We also found differences in the relationship between neighborhood opportunity and
neighborhood high-quality ECE center presence in the two states.
*p<0.05, **p<0.01, ***p<0.10 Note: Omitted category is “very low opportunity” neighborhoods.
Figure 9 clearly shows how the relationship between neighborhood opportunity and
presence of a high-quality ECE center behaves differently in MA and OH. In MA, we see a
linear, monotonically increasing relationship from the very low opportunity level up through the
high opportunity level. Also, we find that very low opportunity neighborhoods are significantly
less likely to have a high-quality provider compared to all other neighborhood opportunity levels.
In Ohio, only moderate opportunity and very high opportunity tracts differ from very low
opportunity tracts in their likelihood of having a high-quality provider. But in Ohio, moderate
Figure 9. Odds of Having a High-Quality ECE Center in Tract (Compared to Very Low Opportunity Tracts)
MA and OH
0.75
0.53*
0.73
1.60*1.41*
1.48*1.58**
1.47*
0.40
0.60
0.80
1.00
1.20
1.40
1.60
1.80
Low opportunity
Moderate opportunity
High opportunity
Very high opportunity
Odd
s R
atio
Neighborhood Opportunity Level
OH
MA

64
opportunity tracts are less likely than very low opportunity tracts to have a high-quality ECE
center and very high opportunity tracts are significantly more likely than very low opportunity
tracts to have a provider (and the magnitudes are similar to those found in Massachusetts).
In both Ohio and MA the fact that providers are more likely to be found in high and very
high opportunity neighborhoods is an issue of racial/ethnic equity since in both states racial and
ethnic minority children are less likely to live in high opportunity areas. That being said, it is
also an important finding that at least a portion of high-quality providers are locating in very low
opportunity areas--although to a greater extent in Massachusetts than in Ohio-- and in both
states, providers are locating in areas that are otherwise spatially isolated from opportunity--i.e.,
services are penetrating the areas of greatest need and not locating in areas that are proximal to
higher opportunity. This is suggestive that policy incentives and the strength of mission-driven
organizations are important actors in the ECE sector in both states and that location decisions are
not likely entirely market driven in either state.
Finally, the Head Start analyses for both states show that the percent of children with
neighborhood access to a Head Start center is dramatically lower than the percent of children
who are poor (and who may therefore qualify for Head Start services). The gaps are
substantially higher for black and Hispanic children than white children living in low and very
low opportunity areas in both Ohio and Massachusetts. However, high-quality Head Start
centers tend to be located in areas of spatially concentrated disadvantage -- i.e., there is not a
strong tendency for high-quality Head Start centers to locate near higher opportunity areas. This
is an interesting and important finding given that Head Start centers can locate selectively, at
least to a certain extent. Head Start centers must locate in areas of “demonstrated need”, but
“communities” in the Head Start legislation are defined very broadly and can include “a city,
county, or multicity or multicounty unit within a State…, or a neighborhood or other area”

65
(Small & Stark 2005 pp. 1017; 42 U.S.C. §9801 et seq.). Therefore, it is of interest that high-
quality Head Start centers in Ohio and Massachusetts are more likely to locate in areas of
spatially concentrated disadvantage. Given the flexibility of the definition, these results are not
necessarily generalizable since Head Start location decisions may be made differently in other
states.
VI. DISCUSSION
This paper is about equity in early opportunities to learn and the roles that place, space
and race may play in shaping experiences during the most developmentally critical time for
children. In terms of place, we examined what a child’s neighborhood, and the corresponding
level of opportunity in that neighborhood, tells us about a child’s access to a high-quality early
learning experiences. In terms of space, we zoomed in to impoverished neighborhoods that had
at least one high-quality ECE center to determine whether these neighborhoods were located
near higher opportunity areas or surrounded by low opportunity neighborhood--i.e., areas of
spatially concentrated disadvantage. In terms of race, we examined how children of varying
racial, ethnic and nativity groups are distributed across different types of neighborhoods (in
terms of both levels of opportunity and the presence of a high-quality ECE center). The focus
was to understand the nature and magnitude of inequities between groups and to document the
extent to which racial and ethnic minority and immigrant children are concentrated in the areas
we consider most detrimental to development--very low opportunity neighborhoods with no
high-quality ECE providers. By contrasting results in two states, Massachusetts and Ohio, we
are able to generate further testable hypotheses about how the roles of place, space and race in
shaping early learning opportunities may vary between U.S. states.

66
Place. Comparing results in Ohio and Massachusetts, we find pronounced differences in the
relationship between neighborhood opportunity and neighborhood presence of a high-quality
ECE center. In both states, very high opportunity areas are more likely than very low
opportunity areas to have a high-quality ECE center. However, in Massachusetts, we observed a
more linear positive relationship between neighborhood opportunity level and likelihood of
presence of a high-quality ECE center. This is the type of pattern we expect to find if we believe
pure market forces underlie center location decisions. Following the basic assumptions of social
disorganization theory, more advantaged neighborhoods attract and sustain high-quality
institutional resources more easily than impoverished neighborhoods, making it more likely that
high-quality providers will locate in high opportunity neighborhoods. In contrast to the findings
in Massachusetts, the relationship between neighborhood opportunity level and likelihood of
presence of a high-quality ECE center was not found to be linear in Ohio. While very high
opportunity neighborhoods were still the most likely to have a high-quality ECE center (similar
to MA), very low opportunity areas were found to be more likely than moderate opportunity
areas to have a high-quality ECE center. This result runs counter to the basic assumptions of
social disorganization theory (as described above), suggesting that non-private market forces and
actors may be influencing center location decisions in Ohio.
These findings illustrate the important information we gain by using richer, child
development-focused indicators of neighborhood opportunity. By examining measures of
specific resources that foster child development, as opposed to using proxies such as
neighborhood poverty or other broad stroke measures of racial and ethnic differences in
developmental contexts, we can measure the extent to which racial and ethnic minority and
immigrant children experience “triple jeopardy”12-- face challenging developmental contexts in
12 Concept and definition of “triple jeopardy” drawn from Acevedo et al. (2010).

67
their families, their neighborhoods and their educational settings, all at the same time. Logistical
and cost limitations often reduce the availability of rich contextual measures, narrowing
comparisons to just a few neighborhoods or cities. However, the publicly-available NAEYC
dataset on high-quality providers offers at least a starting point13 for building a nationally
comparable set of measures of the availability of high-quality ECE centers in neighborhoods
across the U.S. The results also highlight the value of using measures that do not conflate
neighborhood racial composition with indicators of disadvantage or lack of opportunity, but
rather use a racially neutral measure that can then be correlated with race. For future work as we
collect more nationally comparable measures of neighborhood resources, factor analysis will
inform decisions about which measures to include in a summary index and which neighborhood
measures may be more informative when analyzed individually.
Finally, what is arguably most interesting about the observed differences in results
between Massachusetts and Ohio is that the differences in early childhood education policies in
the two states would predict these differences in center location decisions. Over the past two
decades, many states have adopted statewide quality rating and improvement systems (QRIS)
that essentially create an accountability structure for ECE providers14. QRIS systems are akin to
those implemented along with the accountability movement in elementary and secondary
13 As noted previously, there are many limitations to using the NAEYC database alone and future work will aim to include other data that may be publicly available or that we may be able to obtain through restricted use agreements. For future work, we plan to explore other data sources, including center location data available from other national accreditation bodies. We may also extend the analysis to go beyond center-based care to include family daycares since they are also important ECE providers, particularly in low-income areas. Another source of data to be explored is data specific to Head Start quality that is captured through program performance data. Finally, within-state analyses may be possible using data from states’ Quality Rating and Improvement Systems (QRIS). These measures will provide more information about quality gradient for centers within a state. However, due to the fact that QRIS systems are state-specific, they are not well-equipped to support cross-state quality comparisons (although it is likely possible to identify and compare a subset of common elements and standards). 14 For a full review of state QRIS systems see Compendium of Quality Rating Systems and Evaluations, April 2010 Report for Office of Planning, Research and Evaluation (Administration for Families), Mathematica Policy Research Inc. and ChildTrends. Available at: http://www.acf.hhs.gov/programs/opre/cc/childcare_quality/compendium_qrs/qrs_compendium_final.pdf.

68
education where policies are put in place to track and encourage quality improvements over time.
Some state QRIS systems are voluntary and do not have any associated financial incentives. In
Ohio, the QRIS system incorporates formal financial incentives. Programs that are “Star Rated”
in the statewide QRIS system (“Step Up to Quality”) and that serve subsidized children qualify
for additional reimbursement from the counties. This system has been in development since
1999 and was implemented statewide in 2007. Meanwhile, in Massachusetts, the QRIS system
was only adopted in early 2011 and financial incentives, in the form of QRIS Program Quality
Improvement Grants of up to $10,000 to be awarded to between 300 and 600 organizations, are
available to all ECE providers in the state regardless of whether centers serve socioeconomically
disadvantaged children or not. So, while more analysis is required to formally understanding the
relationship between state policies and high-quality ECE center locations, we can conclude that
the observed patterns in center locations in Ohio and Massachusetts align with the corresponding
policy structures in the two states. In Massachusetts, where no formal policies have been in
place to intervene with market forces, we see a more linear relationship between neighborhood
opportunity and likelihood of presence of a high-quality ECE provider. In Ohio, high-quality
ECE providers have greater financial incentives to serve children in very low opportunity areas
versus those in moderate opportunity areas, where children may be just well-off enough not to
qualify for subsidies. However, the overall lack of availability of access to ECE services
suggests that the Ohio incentive system has not sufficiently addressed this access gap.
At minimum, our findings suggest that spatial access to high-quality ECE providers does
not move in perfect lockstep with other dimensions of the neighborhood opportunity structure
and that state policies may play an important role in shaping the distribution of neighborhood
ECE resources.

69
Space. The most important finding of our spatial analyses was that at least a portion of high-
quality providers are locating in very low opportunity areas, although this is true to a much
greater extent in Massachusetts than in Ohio. Moreover, in both states, providers are locating in
areas of spatially concentrated disadvantage--i.e., areas that are otherwise spatially isolated from
opportunity. In Massachusetts, almost half of all black and Hispanic children living in very low
and low opportunity areas have a high-quality provider in their neighborhood. While this still
leaves large portions of children without neighborhood access to a high-quality ECE provider, it
suggests the possibility that critically important developmental resources for young children can
be made available in otherwise resource impoverished areas. This is again suggestive that policy
incentives and the strength of mission-driven organizations are important actors in the ECE
sector and have an important role to play in bringing high-quality resources to the children who
need them most.
Race. Both global and local tests of spatial association reveal that the geographies of
opportunity in Massachusetts and Ohio are not spatially random, suggesting that significant
proportions of children in both states are likely to live in either areas of concentrated high
opportunity or spatially concentrated disadvantage--areas that are spatially isolated from
opportunity. In addition, we observe that these geographic patterns occur along racial and ethnic
lines in both states. Therefore, these clusterings or concentrations of high and low advantage
result in significant issues of equity between white children on the one hand and racial and ethnic
minority children on the other. The result is very large numbers of racial and ethnic minority
children living in resource poor neighborhoods that also lack access to high-quality ECE
resources, which could arguably offset some of the detrimental effects of living in a resource
poor area. That said, at least in Massachusetts, a sizeable proportion of children living in very
low opportunity areas have a high-quality provider in their neighborhood. This result suggests

70
that, in Massachusetts, geographic access to high-quality ECE services is greater than access to
other dimensions of the neighborhood opportunity structure for racial and ethnic minority and
immigrant children. It is therefore at least possible for high-quality ECE services to reach the
most impoverished neighborhoods and future work will aim to understand the conditions that
best support improved access to high-quality ECE resources in these neighborhoods.

71
Map 1a: Comprehensive Opportunity Map (State of Massachusetts) This map displays the spatial pattern of the distribution of neighborhood opportunity based on Education, Economic & Mobility, and Housing & Neighborhood Indicators.

72
Map 1b: Comprehensive Opportunity Map with High-Quality ECE Center Locations (State of Massachusetts) This map displays the spatial pattern of the distribution of neighborhood opportunity based on Education, Economic & Mobility, and Housing & Neighborhood Indicators AND the locations of high-quality early childhood care and education centers.

73
Map 2: Distribution of Univariate Local Indicators of Spatial Autocorrelation (LISA) Statistics (Variable: Neighborhood Opportunity) for the State of Massachusetts
This map displays the distribution of neighborhood LISA statistics or cluster values for neighborhood opportunity levels. There are five possible LISA cluster values represented in the map.
White (or hollow) tracts represent neighborhoods with LISA statistics that are not statistically significant. Bright red clusters, or “high-high” values, represent opportunity “hot spots” (i.e., spatial clusters of high opportunity, where neighborhood opportunity
values are high and the value in any one neighborhood is statistically associated with the value of neighborhood opportunity in the contiguous neighborhoods).
Bright blue clusters, or “low-low” values, represent opportunity “cold spots” (i.e., spatial clusters of low opportunity, where the values of neighborhood opportunity are low and the value in any one neighborhood is statistically associated with the value of neighborhood opportunity in contiguous neighborhoods).
Light blue clusters represent “low-high” values where the statistical association between contiguous tracts is statistically significant, but low opportunity neighborhoods are surrounded by high opportunity neighborhoods.
Light red clusters represent “high-low” values where the statistical association between contiguous tracts is statistically significant, but high opportunity neighborhoods are surrounded by low opportunity neighborhoods.

74
Map 3a: Comprehensive Opportunity Map and Distribution of Children Under Age 5 Across Neighborhoods
(State of Massachusetts) This map displays the spatial pattern of the distribution of neighborhood opportunity based on Education, Economic & Mobility, and Housing & Neighborhood Indicators AND the dot density of neighborhood child population under age 5.

75
Map 3b: Comprehensive Opportunity Map and Distribution of Non-Hispanic White Children Under Age 5
Across Neighborhoods (State of Massachusetts) This map displays the spatial pattern of the distribution of neighborhood opportunity based on Education, Economic & Mobility, and Housing & Neighborhood Indicators AND the dot density of neighborhood non-Hispanic white child population under age 5.

76
Map 3c: Comprehensive Opportunity Map and Distribution of Non-Hispanic Black Children Under Age 5 Across Neighborhoods (State of Massachusetts) This map displays the spatial pattern of the distribution of neighborhood opportunity based on Education, Economic & Mobility, and Housing & Neighborhood Indicators AND the dot density of neighborhood non-Hispanic Black child population under age 5.

77
Map 3c (Additional Detail - Illustrative): Comprehensive Opportunity Map and Distribution of Non-Hispanic Black Children Under Age 5 In Selected Urban Areas (State of Massachusetts)

78
Map 3d: Comprehensive Opportunity Map and Distribution of Hispanic Children Under Age 5 Across Neighborhoods (State of Massachusetts) This map displays the spatial pattern of the distribution of neighborhood opportunity based on Education, Economic & Mobility, and Housing & Neighborhood Indicators AND the dot density of neighborhood Hispanic child population under age 5.

79
Map 4a: Comprehensive Opportunity Map (State of Ohio) This map displays the spatial pattern of the distribution of neighborhood opportunity based on Education & Child Welfare, Economic Opportunity & Mobility, Housing & Neighborhood & Community Development, Public Health, and Public Safety & Criminal Justice Indicators.

80
Map 4b: Comprehensive Opportunity Map with High-Quality ECE Center Locations (State of Ohio) This map displays the spatial pattern of the distribution of neighborhood opportunity based on Education & Child Welfare, Economic Opportunity & Mobility, Housing & Neighborhood & Community Development, Public Health, and Public Safety & Criminal Justice Indicators AND the locations of high-quality early childhood care and education centers.

81
Map 5: Distribution of Univariate Local Indicators of Spatial Autocorrelation (LISA) Statistics
(Variable: Neighborhood Opportunity) for the State of Ohio This map displays the distribution of neighborhood LISA statistics or cluster values for neighborhood opportunity levels. There are five possible LISA cluster values represented in the map.
White (or hollow) tracts represent neighborhoods with LISA statistics that are not statistically significant. Bright red clusters, or “high-high” values, represent opportunity “hot spots” (i.e., spatial clusters of high opportunity, where neighborhood opportunity
values are high and the value in any one neighborhood is statistically associated with the value of neighborhood opportunity in the contiguous neighborhoods).
Bright blue clusters, or “low-low” values, represent opportunity “cold spots” (i.e., spatial clusters of low opportunity, where the values of neighborhood opportunity are low and the value in any one neighborhood is statistically associated with the value of neighborhood opportunity in contiguous neighborhoods).
Light blue clusters represent “low-high” values where the statistical association between contiguous tracts is statistically significant, but low opportunity neighborhoods are surrounded by high opportunity neighborhoods.
Light red clusters represent “high-low” values where the statistical association between contiguous tracts is statistically significant, but high opportunity neighborhoods are surrounded by low opportunity neighborhoods.

82
Map 6a: Comprehensive Opportunity Map and Distribution of Children Under Age 5 Across Neighborhoods (State of Ohio) This map displays the spatial pattern of the distribution of neighborhood opportunity based on Education & Child Welfare, Economic Opportunity & Mobility, Housing & Neighborhood & Community Development, Public Health, and Public Safety & Criminal Justice Indicators AND the dot density of neighborhood child population under age 5.

83
Map 6b: Comprehensive Opportunity Map and Distribution of Non-Hispanic White Children Under Age 5 Across Neighborhoods (State of Ohio) This map displays the spatial pattern of the distribution of neighborhood opportunity based on Education & Child Welfare, Economic Opportunity & Mobility, Housing & Neighborhood & Community Development, Public Health, and Public Safety & Criminal Justice Indicators AND the dot density of neighborhood non-Hispanic white child population under age 5.

84
Map 6c: Comprehensive Opportunity Map and Distribution of Non-Hispanic Black Children Under Age 5 Across Neighborhoods (State of Ohio) This map displays the spatial pattern of the distribution of neighborhood opportunity based on Education & Child Welfare, Economic Opportunity & Mobility, Housing & Neighborhood & Community Development, Public Health, and Public Safety & Criminal Justice Indicators AND the dot density of neighborhood non-Hispanic black child population under age 5.

85
Map 6c (Additional Detail-Illustrative): Comprehensive Opportunity Map and Distribution of Non-Hispanic Black Children Under Age 5 Across Neighborhoods in CLEVELAND area

86
Map 6d: Comprehensive Opportunity Map and Distribution of Hispanic Children Under Age 5 Across Neighborhoods (State of Ohio) This map displays the spatial pattern of the distribution of neighborhood opportunity based on Education & Child Welfare, Economic Opportunity & Mobility, Housing & Neighborhood & Community Development, Public Health, and Public Safety & Criminal Justice Indicators AND the dot density of neighborhood Hispanic child population under age 5 (Please note change in dot density scale from other maps).

87
References Acevedo-Garcia, D. Rosenfeld, L., McArdle N., & Osypuk, T. (2010). The geography of opportunity: A framework for child development. In C. Edley Jr. & J. Ruiz de Velasco (Eds.), Changing places: How communities will improve the health of boys of color. (pp. 358-406). Berkley and Los Angeles: University of California Press. Allard, Scott. (2004). Access to social services. Washington, DC: Brookings Institution. Barnett, W. S. (1993). Benefit-cost analysis of preschool education. American Journal of Orthopsychiatry, 63(4), 500-508. Barnett, W.S. (1995). Long-term effects of early childhood programs on cognitive and school outcomes. Future of Children, 5(3), 25-50. Bertrand, M., Luttmer, E. F. P., & Mullainathan, S. (2000). Network effects and welfare cultures. The Quarterly Journal of Economics, 115(3), 1019-1055. Campbell, F., & Ramey, C. (1995). Cognitive and school outcomes for high-risk African-American students at middle adolescence. American Educational Research Journal, 32(4), 743-772. Covington, K. (2007). Evidence of dynamic geographic shifts in metropolitan child care Markets over the 1990s. International Journal of Economic Development, 9(3), 159-204. Currie, J. (2001). Early childhood intervention programs: What do we know? Journal of Economic Perspectives, 15(2), 213-38. Hackman, D. & Farah, M. (2009). Socioeconomic status and the developing brain. Trends in Cognitive Sciences, 13(2), 65-73. Hart, B. & Risley, T. (1995). Meaningful differences in the everyday experience of young American children. Baltimore, MD, US: Paul H Brookes Publishing. Heckman, J. (2000). Policies to foster human capital. Research in Economics, 54(1), 3-56. Herbst, C. & Tekin, E. (2010). Distance matters: Proximity to social service agencies and the utilization of child care subsidies. Unpublished working paper funded by the W.E. Upjohn Institute for Employment Research. Joassart-Marcelli, P., & Wolch, J. (2003). The intrametropolitan geography and the nonprofit sector in S. California. Nonprofit and Voluntary Sector Quarterly 32(1),70–95. Kahn, A. & Kamerman, S. (1987). Child care: Facing the hard choices. Dover, Mass.: Auburn House.

88
Karoly, L. & Gonzalez, G. (2011). Early care and education for children in immigrant families. Future of Children, 21(1), 71-101. Karoly, L., Greenwood, P., Everingham, S., Hoube, J., Killburn, R., Rydell, et al. (1998). Investing in our children: What we do and don’t know about the costs and benefits of early childhood interventions. Santa Monica, Calif.: RAND. Kirp, D. (2004, November 21). Life way after Head Start. New York Times Magazine, 32–38. Krivo, L. J., & Peterson, R. D. (1996). Extremely disadvantaged neighborhoods and urban crime. Social Forces, 75(2), 619-650. Logan, J. R. (2002a). Choosing segregation: Racial imbalance in American public schools, 1990 – 2000. Albany, N.Y.: Lewis Mumford Center for Comparative Urban and Regional Research. Logan, J. R. (2002b). Separate and unequal: The neighborhood gap for blacks and Hispanics in metropolitan America. Albany, N.Y.: Lewis Mumford Center for Comparative Urban and Regional Research. Logan, J. R., Oakley, D., Smith, P., Stowell, J. & Stults, B. (2001). Separating the children. Albany, N.Y.: Lewis Mumford Center for Comparative Urban and Regional Research. Magnuson, K. & Waldfogel, J. (2005). Early childhood care and education: Effects on ethnic and racial gaps in school readiness. Future of Children, 15(1), 169-196. Maryland Committee for Children. (2003). Child care demographics 2003: Maryland report. Baltimore, MD: Maryland Committee for Children. Massey, D. S. (2001). Residential segregation and neighborhood conditions in U.S. metropolitan areas. In N. Smelser, W.J.Wilson & F. Mitchell (Eds.), America becoming: Racial trends and their consequences (pp. 391-434). National Research Council. Washington, D.C.: National Academy Press. Massey, D. S. (2004). Segregation and stratification: A biosocial perspective. Du Bois Review, 1(1),1-19. Massey, D. S. (2008). Origins of economic disparities: Historical role of housing segregation. In J. Carr & N. Kutty (Eds.), Segregation: The rising costs for America (pp. 39-0). New York: Routledge. Massey, D. S., Condran, G. & Denton, N. (1987). The effect of residential segregation on black social and economic well-being.”Social Forces, 66(1), 29-56. Massey, D. S. & Fischer, M. (2000). How segregation concentrates poverty. Ethnic & Racial Studies, 23(4), 670-91.

89
National Research Council and Institute of Medicine. (2000). From Neurons to Neighborhoods: The Science of Early Childhood Development. Committee on Integrating the Science of Early Childhood Development. Board on Children, Youth, and Families, Commission on Behavioral and Social Sciences and Education. J. Shonkoff & D. Phillips (Eds.), Washington, D.C.: National Academy Press. McCarton, C., Brooks-Gunn, J., Wallace, I., Bauer, C., Bennett, F., Bernbaum, J., et al. (1997). Results at age 8 years of early intervention for low-birth-weight premature infants: The Infant Health and Development Program. Journal of the American Medical Association, 277(2), 126-132. Murphy, A. K. & Wallace, D. (2010). Opportunities for making ends meet and upward mobility: Differences in organizational deprivation across urban and suburban poor neighborhoods. Social Science Quarterly, 91(5), 1164-1186. Neidell, M., & Waldfogel, J. (2009). Program participation of immigrant children: Evidence from the local availability of Head Start. Economics of Education Review, 28(6), 704-715. Peck, L. (2008). Do antipoverty nonprofits locate where people need them? Nonprofit and Voluntary Sector Quarterly 37(1),138–51. Phillips, M., Crouse, J. & Ralph, J. (1998). Does the black-white test score gap widen after children enter school? In C. Jencks & M. Phillips (Eds.), The black-white test score gap (pp.229-272). Washington, D.C.: The Brookings Institution. Powell, J. & Grant-Thomas, A. (2010). The State of Black Ohio: At a Crossroads on the Pathway to Opportunity. Report of the Kirwan Institute for The Study of Race and Ethnicity at Ohio State University. Ramey, C., Bryant, D., Wasik, B., Sparling, J., Fendt, K., & LaVange, L. (1992). Infant Health and Development Program for low birth weight, premature infants: Program elements, family participation, and child intelligence. Pediatrics, 89(3), 454-465. Ramey, C., Campbell, F., Burchinal, M., Skinner, M., Gardner, D., & Ramey, S. (2000). Persistent effects of early childhood education on high-risk children and their mothers. Applied Developmental Science, 4(1), 2-14. Reece, J. & Gambhir, S. (2008). The geography of opportunity: Review of opportunity mapping research initiatives. Report of the Kirwan Institute for The Study of Race and Ethnicity at Ohio State University. Reece, J. & Gambhir, S. (2009). The geography of opportunity: Building communities of opportunity in Massachusetts. Report of the Kirwan Institute for The Study of Race and Ethnicity at Ohio State University, Funded by the Massachusetts Legal Services Programs.

90
Reece, J. & Schultheis, E. (2009). Poverty’s place: The use of geographic information systems in poverty advocacy. Clearinghouse Review Journal of Poverty Law and Policy,42(9-10),430-447. Roy, M. & Reece, J. (2010). Poverty’s place revisited: mapping for justice & democratizing data to combat poverty. Clearinghouse Review Journal of Poverty Law and Policy, 44(3-4), 184-198. Schweinhart, L., Montie, J., Xiang, Z., Barnett, W., Belfield, C. & Nores, M. (2005). Lifetime effects: The High/Scope Perry Preschool study through age 40. Ypsilanti: High/Scope Press. Small, M., & McDermott, M. (2006). The presence of organizational resources in poor urban neighborhoods. Social Forces 84(3),1698-1724. Small, M. &. Stark, L. (2005). Are poor neighborhoods resource deprived? A case study of childcare centers in New York. Social Science Quarterly, 86(s1), 1013-1036. U.S. Department of Education. (1995). Characteristics of children’s early care and education programs: Data from the 1995 National Household Education Survey (NHES). National Center for Education Statistics. Washington, DC: U.S. Department of Education. Waldfogel, J. (2002). Child care, women’s employment and child outcomes. Journal of Population Economics, 15(3), 527-48. Wilson, W.J. (1987). The Truly Disadvantaged: The Inner City, the Underclass, and Public Policy. Chicago, IL: University of Chicago Press. Wilson, W.J. (1996). When Work Disappears: The World of the New Urban Poor. New York: Knopf. Zigler, E. & Styfco, S.J. (2010). The Hidden History of Head Start (Development at Risk). New York: Oxford University Press.