equity and fiscal policy: the income distribution effects of - imf
TRANSCRIPT

Equity and Fiscal Policy: The Income Distribution Effects of Taxation
and Social Spending in Central America
Rodrigo Cubero and Ivanna Vladkova Hollar
WP/10/112

© 2010 International Monetary Fund WP/10/112 IMF Working Paper Western Hemisphere Department
Equity and Fiscal Policy: The Income Distribution Effects of Taxation and Social Spending in Central America
Prepared by Rodrigo Cubero and Ivanna Vladkova Hollar1
Authorized for distribution by Miguel Savastano
May 2010
Abstract
This Working Paper should not be reported as representing the views of the IMF. The views expressed in this Working Paper are those of the author(s) and do not necessarily represent those of the IMF or IMF policy. Working Papers describe research in progress by the author(s) and are published to elicit comments and to further debate.
How does fiscal policy fare in improving the underlying income distribution in Central America? We integrate the data from a number of existing tax and public expenditure studies for the countries in the region and find that the distributional effect of taxation is regressive but small. In contrast, the redistributive impact of social spending is large and progressive, leading to a progressive net redistributive effect in all countries of the region. We also show that raising tax revenues and devoting the proceeds to social spending would unambiguously improve the income of the poorest households. JEL Classification Numbers: E62, H22, I38 Keywords: tax policy, expenditure policy, incidence, income distribution, Central America Author’s E-Mail Address: [email protected], [email protected]
1 We are grateful to Dominique Desruelle and Andreas Bauer for extensive comments and suggestions, and Ewa Gradzka for able research assistance. Our thanks go also to other colleagues and officials who provided comments on earlier versions, and to Johny Gramajo for comments on this version. A previous version of this paper was published as Cubero and Vladkova Hollar (2008).

2
Contents Page I. Introduction ............................................................................................................................. 4 II. Tax Systems in Central America: Structure and Distributional Impact .................................. 5 A. Tax Systems in Central America: Structure and Evolution ....................................... 6 B. Distributional Effects of Taxation ................................................................................ 8 III. Social Spending in Central America: Trends and Distributional Impact .............................. 18 A. Social Spending Trends .............................................................................................. 19 B. The Incidence and Distributional Impact of Social Spending .................................. 22 IV. Net Distributional Effects of Fiscal Policy: A Summary Analysis ....................................... 28 V. Conclusions ........................................................................................................................... 33 Figures 1. Incidence of Total Taxes ....................................................................................................... 13 2. Progression of Taxes ............................................................................................................. 16 3. Composition of Social Protection Spending ......................................................................... 21 4. Evolution of Government Expenditures ................................................................................ 21 5. Incidence of Total Social Spending ....................................................................................... 24 6. Incidence of Public Spending on Education .......................................................................... 27 7. Incidence of Public Spending on Health ............................................................................... 28 Tables 1. Evolution and Structure of Tax Revenue ................................................................................ 7 2. Distribution of Income and Taxes, by Income Quintiles ...................................................... 11 3. Redistributive Impact of the Overall Tax System ................................................................. 15 4. Evolution of Social Spending, 1994/95 vs. 2003/04 ............................................................. 20 5. Redistributive Effect of Total Social Spending: Central America and Selected Regional
Comparators .......................................................................................................................... 25 6. Incidence of Social Protection Spending ............................................................................... 26 7. Redistributive Effect of Taxation and Social Spending: Central America and Selected Regional Comparators ........................................................................................................ 30 8. Impact of Fiscal Policy on Pre-Fiscal Policy Income, by Quintile ....................................... 31 9. Simulated Impact of Specified Fiscal Policy Reform on Post-Fiscal Policy Income ........... 32

3
Appendix 1: On What Basis Should the Tax Burden Be Measured? ........................................... 35 Appendix Tables A1. Evolution and Structure of Tax Revenue .............................................................................. 36 A2. Progression of Taxes in Central America and Comparator Countries .................................. 37 A3. Redistributive Impact of Taxation in Central America and Comparator Countries .............. 38 A4. Comparison of Income vs. Consumption-Based Measures of Progressivity for Total and VAT Taxes .................................................................................................................. 39 A5. Evolution of Social Spending in Central America ................................................................ 39 References ...................................................................................................................................... 40

4
I. INTRODUCTION
Central America’s high levels of poverty and income inequality place the distributional effects of fiscal policy at the center of the policy debate in the region.2 Governments in Central America have made poverty reduction one of their key policy objectives. While poverty rates in Central America have edged down in the past decade, they still remain well above the average for Latin America as a whole. Inequality in income distribution, moreover, is as high as in other parts of Latin America and stands out in a global context.
Distributional outcomes are, fundamentally, a function of the distribution of productive resources (physical and human capital, land) and their rates of return, which depend partly on historical and geographical conditions. However, public policies can affect the market-determined distribution of income, either through changes in the distribution of resources and their returns or through a redistribution of market income. Through appropriate policies, governments can therefore address the conditions that perpetuate inequality.
This paper is concerned with the distributional effects of taxation and social spending in Central America, taking the underlying distribution of resources as given. The paper surveys a number of existing tax and expenditure studies for the countries in the region, and assembles their underlying data in a coherent comparative framework to assess the combined distributional impact of taxation and social spending in Central America. The paper also presents, as a reference, some evidence for other countries in Latin America and Europe. We find that the overall distributional effect of taxation in the region is small, while the redistributive impact of social spending is much larger, leading to a progressive net effect in all countries of the region. We also show that raising tax revenues and devoting the proceeds to social spending would unambiguously improve the income of the poorest households.
These findings are consistent with the literature. The empirical evidence for developed and developing countries suggests that the overall effect of taxes on income distribution is generally limited, and that even relatively profound changes in tax structures have only a small distributional impact.3 In contrast, the distributional effects of public spending, especially of well-targeted social spending, can have substantial positive effects on equity and poverty reduction.4 Many analysts thus conclude that tax policy considerations should focus on efficiency issues, and that the redistributive aim of fiscal policy should be accomplished through the expenditure side.5 However, the distributional impact of taxation remains a relevant question for tax policy debates, which are largely influenced by incidence
2 Throughout this paper, Central America is taken to comprise Costa Rica, El Salvador, Guatemala, Honduras, Nicaragua, Panama and the Dominican Republic.
3 See, for example, Pechman (1985) for the United States and Engel, Galetovic, and Raddatz (1999) for Chile. 4 Chu, Davoodi, and Gupta (2000) provide examine the evidence for developing countries. 5 See, for instance, Harberger (2003), IDB (1998), and Lora (2007).

5
and equity considerations.6,7 A clearer understanding of the distributional effects of certain taxes, and of the determinants of such effects, may help shape more equitable tax systems without necessarily sacrificing efficiency.
The scope of this paper imposes some limitations. First, the paper focuses on taxation and social spending, and thus does not address the distributional effects of other components of spending or the indirect effects of the overall fiscal stance. Second, the incidence and distributional impact are treated in a static sense. For instance, the analysis of spending on education does not consider its impact on the future earning potential of the poor; neither does the paper examine how taxation and the public provision of social services and transfers might interact with each other or affect behavior (for example, in changing incentives to work or invest). Third, the efficiency, effectiveness, and administrative simplicity of taxation and social spending are not assessed, although they are clearly important and may impinge on distributional outcomes. Fourth, the reliance on existing studies of tax and spending incidence limits cross-country comparability: methodology and assumptions made for estimating the incidence of taxation and spending differ from study to study. It also constrains the timeliness of the data, as the available studies for the region are mostly based on data for 2000 (2003 for Panama and 2004 for Guatemala).
Despite these limitations, the main conclusions of the paper are robust. Our findings hold for all countries in the region for which data are available, are consistent with evidence provided elsewhere, and are unlikely to have been significantly affected by changes in taxation or social spending in Central America in recent years. Tax structures change only slowly, and existing studies suggest that the distributional impact of major recent tax reforms in Nicaragua (Gasparini and Artana, 2003) and Guatemala (Auguste and Artana, 2005) have been small.8 At the same time, social spending has continued to rise across the region, suggesting that the combined redistributive effect has likely become more progressive.
The paper is organized as follows. The next section examines the features and distributive effects of tax systems in the region, while the third section focuses on social spending trends and distributive effects. The fourth section integrates the conclusions from the tax and spending incidence analysis, allowing an overall view of the net distributive impact of fiscal policy across Central America. The final section discusses policy implications. 6As Bird (2003, p. 12) states, “Distributional issues not only matter in tax policy but often dominate in the minds of those who shape that policy.” 7In tax policy, there are two different notions of equity. Horizontal equity exists when individuals or households that earn the same income, regardless of its source, pay the same taxes. Vertical equity, on the other hand, is generally taken to imply that the tax burden should increase with income. The latter notion is the relevant one for an analysis of the distributional effects of taxation. 8 There have been two other major tax reforms in the region in recent years: Guatemala (2006)and Nicaragua (2009). However, their distributional impact has not been assessed and they are therefore not considered in this paper. The main purpose of the Guatemalan reform was an increase in tax collection through an improvement in tax administration, and is therefore unlikely to have had much of an impact on income distribution. The 2009 Nicaraguan reform, however, was in part aimed at increasing the progressivity of the tax system: the threshold for paying personal income tax was raised substantially, and a 10 percent withholding tax was introduced for income on interest and dividends. This reform may have had some impact on income distribution.

6
II. TAX SYSTEMS IN CENTRAL AMERICA: STRUCTURE AND DISTRIBUTIONAL IMPACT
This section examines the effects of the tax system on income distribution in Central America. For a given income distribution, the distributional effects of the tax system are a function of two factors: the size of tax collections relative to GDP and the incidence of the tax system on different income groups. The analysis below considers these two factors in turn. After a brief description of the structure and evolution of tax systems in the region, we survey the existing evidence on the incidence of taxation in Central America and discuss the progressivity of individual taxes.
A. Tax Systems in Central America: Structure and Evolution
Tax systems in Central America are characterized by a low ratio of tax revenue to GDP. In 2003, the average tax burden of the central governments in the region was around 12.5 percent of GDP, only marginally higher than its 1995 level (Table 1).9 The regional average was below the tax ratio for Latin America as a whole, which in turn is low by international standards. It must be noted, though, that more recently tax collections in Central America have increased in all countries except Guatemala, in some cases by as much as 2 percentage points of GDP between 2003 and 2008 (Appendix Table A.1). Tax revenue accounts for most central government revenues across the region. The exception is Panama, where significant income from the Panama Canal drives down the share of taxes in central government revenue (just 54 percent in 2008).
Tax structures in Central America are similar to those in other Latin American countries but very different from the structures prevalent in OECD countries. First, income taxes contribute on average only about one-quarter of overall collection in Central America (and Latin America as a whole), compared with one-half in the OECD (Table 1). The outlier in the region is Panama, where income taxes account for about 40 percent of tax collections. By contrast, the average share of trade taxes in total tax revenues is about 16 percent in Central America, compared with only 1 percent in the OECD. Taxes on goods and services (VAT, sales, and excise taxes) account for similar shares of total revenue in Central America and the OECD. Other taxes, including property taxes, play a relatively small role in Central America (with the exception of Honduras), Latin America, and, to a lesser extent, OECD countries.
There has been an important shift in Central American tax structures away from trade taxes and toward VAT in recent years. Between 1995 and 2008, and despite a substantial increase in international trade volumes in the region, the share of trade taxes in total tax revenue fell from a regional average of 20 percent to just over 10 percent, reflecting the process of trade liberalization the region has undergone (Table 1 and Appendix Table A.1). The declining
9The choice of the base years for Table 1 (1995 and 2003) was dictated by the fact that the underlying studies on which the tax and social spending incidence analysis in this paper is based use data that range between 2000 and 2004. However, Appendix Table A.1 presents data on the level and structure of central government revenue (including nontax revenue) for the Central American countries in 2008.

7
trade revenue share has been made up by an increase in the VAT and income tax shares, while the share of excise taxes has also fallen.10
Table 1. Evolution and Structure of Tax Revenue
Total Tax Revenue
Income Taxes
Taxes on Goods and Services Trade Taxes
Other Taxes
VAT and Sales Excises
1995 2003 1995 2003 1995 2003 1995 2003 1995 2003 1995 2003
In percent of GDP
Costa Rica 12.3 13.6 3.1 4.0 4.2 4.7 1.4 2.7 3.6 1.5 0.0 0.6Dominican Republic 13.6 12.1 3.1 3.4 6.5 3.1 0.0 2.6 4.0 2.8 0.0 0.2El Salvador 11.4 12.0 3.2 3.5 4.9 6.4 n.a. 0.4 2.1 1.2 n.a 0.5Guatemala 8.0 11.7 1.6 1.5 2.9 5.3 1.0 1.2 1.9 1.4 0.6 2.3Honduras 17.8 13.7 4.9 3.0 3.5 5.0 2.6 1.2 2.0 1.3 4.8 3.2Nicaragua 12.2 15.9 1.7 4.0 3.6 2.6 5.1 3.5 0.9 4.6 1.0 1.2Panama 11.4 8.7 4.7 3.4 1.7 1.5 1.6 1.2 2.2 1.5 1.2 1.1
Central America, Panama, and DR Average 12.4 12.5 3.2 3.3 3.9 4.1 2.0 1.8 2.4 2.1 1.0 1.3OECD Average 1/ 19.7 20.8 8.8 9.9 5.7 6.0 3.3 3.2 0.5 0.2 1.5 1.5Latin America Average 2/ 11.9 13.3 3.1 3.3 3.9 5.0 1.8 2.0 1.9 1.7 1.1 1.3
In percent of total tax revenue
Costa Rica 100 100 25.4 29.6 33.7 34.8 11.6 19.8 29.4 11.3 0.0 4.5Dominican Republic 100 100 22.8 28.1 47.8 25.6 n.a. 21.5 29.4 23.1 0.0 1.7El Salvador 100 100 28.2 29.2 43.2 53.3 n.a. 3.3 18.5 10.3 10.2 3.9Guatemala 100 100 20.0 12.8 36.3 45.3 12.2 10.1 23.8 12.0 7.8 19.8Honduras 100 100 27.5 21.8 19.7 36.4 14.6 8.7 11.2 9.5 27.0 23.6Nicaragua 100 100 13.7 25.2 29.4 16.4 41.7 22.0 7.4 28.9 7.8 7.5Panama 100 100 41.0 39.1 14.8 17.2 14.0 13.8 19.3 17.2 10.9 12.6
Central America, Panama, and DR Average 100 100 25.5 26.5 32.1 32.7 18.8 14.2 19.8 16.0 3.7 10.5OECD Average 1/ 100 100 44.6 47.6 28.8 28.8 16.7 15.2 2.5 1.0 7.5 7.4Latin America Average 2/ 100 100 26.0 24.6 32.9 37.8 15.3 14.9 16.3 12.7 9.5 10.0
Source: Staff calculations, based on data from the authorities. Data refers to central government only.1/ Includes Canada, Mexico, United States, Australia, Japan, Korea, New Zealand, Austria, Belgium, Czech Republic, Denmark, Finland, France, Germany, Greece, Hungary, Iceland, Ireland, Italy, Luxembourg, Netherlands, Norway,
2/ Includes Argentina, Bolivia, Brazil, Chile, Colombia, Costa Rica, Dominican Republic, Ecuador, El Salvador, Guatemala, Mexico, Nicaragua, Panama, Paraguay, Peru, Uruguay, Venezuela.
10 It must be noted, however, that a significant fraction of VAT revenue throughout the region is collected at customs. In this sense, while the VAT has replaced import tariffs, the object of taxation remains unchanged.

8
B. Distributional Effects of Taxation
Methodological Considerations Analyzing the distributional effects of the tax system requires making assumptions about the economic incidence of taxes; that is, about who ultimately bears the burden of the taxes, which can and does differ from the legal incidence (who is statutorily required to pay them).11 The conventional assumptions, followed by the studies on which this paper is based, are that consumption taxes (VAT, sales, excise, and import taxes) are fully shifted forward to consumers, export taxes are paid by the producers, and personal income taxes are paid by the income recipients. In the case of corporate income taxes, more demanding assumptions are needed, as they can be shifted backward to capital owners or workers (through lower returns) or forward through higher consumer prices, depending on the intersectoral and international mobility of capital.12,13
The distributional impact of taxes and their redistributive potential can be measured using several indicators. This paper focuses on the most common ones:
Tax progression. This measures the effective tax ratio—that is, the tax effectively paid relative to income—per quantile (decile, quintile, quartile) of income. A tax is proportional, progressive, or regressive if the effective tax ratio remains constant, grows, or falls, respectively, as one moves up the income distribution scale.14 The analysis below uses a normalized measure of tax progression—the relative tax burden—defined as the effective tax rate, as a proportion of income, that each income group pays divided by the average tax rate for the population as a whole.
Lorenz and concentration curves. The progression of a tax can be graphically represented by a concentration curve, which measures the cumulative tax paid per quantile of pre-tax income. The progressivity of a tax can then be assessed by comparing the pre-tax Lorenz curve for income with the concentration curve for that tax.15 A tax is progressive over the entire income distribution scale if the concentration curve lies consistently below the pre-tax Lorenz curve (Lorenz dominance).
1112 See Mintz (1996) and Cullis and Jones (1998)
12 See Mintz (1996) and Cullis and Jones (1998)
13 Conclusions on the distributional effects of taxation are sensitive to incidence assumptions. They must, therefore, be taken with caution (Shah and Whalley, 1991; Gemmell and Morrissey, 2002).
14 There are other measures of progression. For a description and mathematical expression of these measures, see Gemmell and Morrissey (2002). 15Conceptually, a concentration curve and a Lorenz curve differ in that the former plots cumulative shares of X (e.g., tax payments) with respect to the quantile distribution of Y (e.g., pre-tax income), whereas the latter represents the cumulative share of Y with respect to the quantile distribution of Y.

9
Quasi-Gini coefficients. Tax progression and concentration curves are local indicators of progressivity: they show the progressivity or regressivity of the tax as one moves from one section of the income distribution scale to the next. But if the pretax Lorenz and concentration curves cross one or several times (so that Lorenz dominance fails), no unambiguous conclusion can be reached about the overall progressivity or regressivity of the given tax. In this case, summary global indicators are useful, because they allow for a complete ordering of distributions. A simple and widely used global measure of tax incidence is the quasi-Gini coefficient for a given tax—that is, the Gini coefficient for that tax’s concentration curve.16 The higher the quasi-Gini coefficient for a given tax, the more progressive it is.
Kakwani (K) index is the difference between the quasi-Gini coefficient for a given tax and the Gini coefficient for pre-tax income. If K > 0, the tax is progressive (it contributes to reducing inequality in income distribution). If K < 0, the tax is regressive.
Reynolds-Smolensky (RS) index. The K index does not take into account the importance of the revenues associated with a given tax relative to the economy and, therefore, does not provide an indication of the redistributive potential of the tax. The RS index, defined as the pre-tax Gini coefficient minus the quasi-Gini index for post-tax income, addresses this problem directly. It measures how income inequality changes (in terms of Gini points) as a result of the introduction of the tax. The sign of the RS index is consistent with that of the K index: if positive (negative), the tax is progressive (regressive). But the magnitudes of K and RS may be very different: a tax that is highly progressive but whose revenues account for a small share of total income would have a negligible redistributive capacity; thus, the tax’s K index would be high, but its RS index would be very small.
The indicators described above were expressed in terms of income, but the progressivity of taxes can also be measured in terms of the underlying distribution of expenditure or consumption (see Appendix 1). The Distributional Impact of Taxation in Central America This section summarizes the available evidence on the incidence and distributional effects of taxation in Central America.17 The analysis below is based on current total income as a
16The Gini coefficient for a concentration curve is called quasi-Gini (as opposed to the Gini coefficient proper, which corresponds to a Lorenz curve). If two concentration curves coincide, their quasi-Gini coefficients are the same; the reverse, however, does not necessarily hold: a given quasi-Gini may derive from different patterns of distribution. 17The section is based on the most recent tax incidence studies available for Costa Rica (Bolaños, 2002), El Salvador (Acevedo and González Orellana, 2005), Guatemala (Auguste and Artana, 2005; and Schenone and de la Torre, 2005); Honduras (Gillingham, Newhouse, and Yakovlev, 2008), Nicaragua (Gasparini and Artana, 2003; and Gómez Sabaini, 2005b), and Panama (Rodríguez Arosemena, 2007). For Honduras, see also Gómez Sabaini (2005a). There are no recent data for the Dominican Republic; however, some information is drawn from Santana and Rathe’s (1993) assessment of tax incidence, based on 1989 data.

10
measure of welfare, to impart some consistency for comparisons across countries.18 Data for the incidence of taxation in Honduras (from Gillingham, Newhouse, and Yakovlev, 2008) and Nicaragua (from Gómez Sabaini, 2005b), and for social spending in all countries, arebased on quintiles of income. Thus, to enable the netting out of tax and social spending effects in section IV, data for tax incidence for Costa Rica and El Salvador, which were based on deciles, were converted to quintiles of income.19 Finally, the underlying data are limited to central government taxes, except in the case of Honduras, where municipal taxes are included, and Nicaragua, where taxes for the city of Managua are reflected. Implicit taxes (such as price controls) and the inflation tax are excluded.20 To provide a broader international perspective, the regional data on the incidence and distributional effects of taxation are complemented by data for other Latin American countries, the United States (federal taxes only), and the European Union. Comparator countries were chosen on the basis of both relevance and the availability and comparability of data.
Tax systems in Central America are generally regressive. While the richer segments of the population pay the bulk of the taxes (Table 2, Panel B) just as in other parts of the world, the poor pay more taxes relative to income (Table 2, Panel C).21 This is also reflected in negative Kakwani indices. No unambiguous conclusion about the progressivity or regressivity of the tax systems can be reached for Guatemala and Panama. In these countries, as in the rest of the region, the poorest quintile pays more taxes relative to income than the richest quintile and the population as a whole. However, the quasi-Gini index for taxes is slightly larger than the Gini for income (the Kakwani index is positive), suggesting that overall the tax systems are mildly progressive (in the case of Guatemala, basically proportional).22,23 For the Dominican Republic, Santana and Rathe (1993) find that the tax system was progressive
18In the case of Panama, the data for the incidence of taxes and social spending in Rodríguez Arosemena (2007) are based on income per capita, and were approximated to total income using the number of individuals per decile. 19For this reason, the figures for tax progression and global measures of incidence shown in this paper are not the same as those presented by the authors of the source papers. For a given underlying distribution, the larger the number of groups, the higher the several indicators of inequality will be. . 20The inflation tax, however, is broadly acknowledged to be regressive, because the poor normally have a higher ratio of money to income and a reduced ability to hedge against the effects of inflation. Bolaños (2002) finds that the inflation tax has a very regressive effect in Costa Rica. 21An analysis of tax progression combines two pieces of information: the distribution of income before taxes, and the distribution of overall tax payments across income groups. The three panels in Table 2 show the interplay of these factors. 22This paradox arises because the concentration curve for taxes and the Lorenz curve for income cross (Lorenz dominance fails). It also illustrates the potential weaknesses of the Gini coefficient as a summary measure of inequality. The Gini index implicitly gives the same weight to equal transfers of resources between quintiles separated by the same distance, regardless of their position in the income scale. Thus, if $10 were taken from both the lowest quintile and the richest quintile and given to the middle quintile, or given to the second and the fourth, the Gini coefficient would remain unchanged, even though such redistributions would imply a much larger relative income loss for the poorest quintile. 23 The result for Panama seems driven by the greater weight in total tax revenues of progressive income taxes compared with the rest of the region.

11
Gini1st 2nd 3rd 4th 5th Index
Costa Rica (2000) 4.2 8.8 12.1 19.8 55.2 45.1
El Salvador (2000) 2.9 7.5 12.9 21.5 55.2 47.4
Guatemala (2004) 4.0 7.9 12.4 19.5 56.1 46.3
Honduras (2004) 3.2 7.6 12.8 20.8 55.6 47.2
Nicaragua (2000) 3.6 6.8 10.4 16.8 62.4 51.0
Panama (2003) 1.7 5.9 10.9 19.1 62.4 53.8
Bolivia (2000) 1.0 5.1 11.1 20.1 62.8 55.6
US (Federal, 2004) 4.0 8.9 13.8 20.2 53.1 43.8
EU-15 (2001) 4.1 9.2 15.9 24.5 46.3 39.9
Quasi-Gini1st 2nd 3rd 4th 5th for Taxes
Costa Rica (2000) 4.4 9.0 11.9 19.2 55.5 44.9
El Salvador (2000) 7.6 12.0 16.0 22.4 42.0 31.7
Guatemala (2004) 4.5 7.8 11.9 18.8 57.0 46.4
Honduras (2004) 6.1 8.8 13.7 19.8 51.6 40.8
Nicaragua (2000) 7.1 10.4 13.9 18.9 49.7 37.4
Panama (2003) 2.2 5.5 8.8 14.4 69.1 57.1
Bolivia (2000) 1.6 7.2 13.3 20.3 57.6 49.8
US (Federal, 2004) 0.9 4.4 9.7 17.6 67.3 58.4
EU-15 (2001) 2.1 6.3 12.7 22.6 56.4 50.0
Kakwani1st 2nd 3rd 4th 5th Index
Costa Rica (2000) 104.3 102.8 98.5 96.9 100.5 -0.2
El Salvador (2000) 261.4 159.8 123.7 104.4 76.1 -15.7
Guatemala (2004) 112.2 98.4 95.7 96.3 101.6 0.1
Honduras (2004) 190.7 116.7 106.3 95.1 92.8 -6.4
Nicaragua (2000) 195.9 154.7 133.4 112.4 79.6 -13.6
Panama (2003) 127.8 93.5 80.4 75.6 110.8 3.3
Bolivia (2000) 151.7 143.5 120.4 101.4 92.0 -5.8
US (Federal, 2004) 23.0 50.1 70.1 87.2 126.8 14.6
EU-15 (2001) 51.2 68.5 79.9 92.2 121.8 29.6
Sources: Acevedo and González Orellana (2005); Auguste and Artana (2005); Barreix et al. (2006); Bolaños (2002); Gillingham, et al. (2007);
Gómez Sabaini (2005b); Cossío Muñoz (2006); Rodríguez Arosemena (2007); U.S. Congressional Budget Off ice (2006); EUROMOD
Choice of comparator countries is driven by data availability.
1/ Effective tax/income ratio relative to the average ratio; a value greater than 100 indicates that the income group pays
a higher percentage of its income relative to the average.
Panel A. Distribution of pre-tax income (percentage of total)
Panel C. Relative tax burden 1/
Panel B. Distribution of overall tax payments (percentage of total)
Table 2. Central America. Distribution of income and taxes, by income quintiles

12
in 1989.24 Tax systems in the Central American countries for which data are available are found to be much less regressive or more progressive if consumption is used instead of income as a measure of welfare.25
The degree of overall tax regressivity varies substantially across Central America. In El Salvador, Honduras, and Nicaragua, the burden of taxation falls disproportionately on the poor (Table 2, Panel C).26 In El Salvador, for instance, the poorest quintile of the population pays more than two and a half times as much taxes relative to their income as the average citizen, and three and a half times what the richest quintile pays. This stark pattern of regressivity stems from the combination of a relatively even distribution of absolute tax payments across income groups (the low tax quasi-Ginis and higher concentration curves shown in Table 2, Panel B and Figure 1, respectively), and a highly unequal distribution of income (Table 2, Panel A). By contrast, the relative burden of taxes is distributed fairly evenly in Costa Rica and Guatemala, where tax progression is U-shaped: mildly regressive in the first three (Guatemala) or four (Costa Rica) quintiles and then progressive. This pattern of distribution favors the middle classes. The distribution of the tax burden is also U-shaped in Panama, but with a much deeper trough: there, the bottom quintile pays 28 percent more taxes than the average household, while the top fifth pays 11 percent more.
With the exceptions of Guatemala and Panama, taxation in Central America is generally more regressive, with lower quasi-Gini indices for overall taxation, than in Andean countries, the United States, and the European Union (EU) (Tables 2 and 3 and Figure 1). These comparator countries also have consistently upward-sloping tax progression patterns and positive Kakwani indices. Two interesting exceptions are Sweden and Denmark, where the tax systems are regressive, though, as shown below, the overall effect of fiscal policy is powerfully progressive.
24The effective tax rates paid (as a percentage of income) by the poorest 40 percent of households, the following 35 percent, the next 20 percent, and the top 5 percent were, respectively, 11.5 percent, 13 percent, 15.6 percent, and 17.2 percent
25 In El Salvador, Nicaragua, and Panama consumption or expenditure is more evenly distributed than income (Appendix Table A.4). The incidence of taxation therefore results in a much less regressive effective rate if measured relative to consumption. Similar results are reported by Auguste and Artana (2005) for Guatemala, and by Gillingham, Newhouse, and Yakovlev (2008) for Honduras. 26 As already mentioned (footnote 8), the underlying analysis for Nicaragua does not include the 2009 tax reform, which is likely to have improved the progressivity of the tax system.

13
Figure 1. Central America. Incidence of Total Taxes
Sources: Fund staff calculations based on Agosin, et al (2004); Acevedo and González Orellana (2005); Auguste and Artana (2005); Bolaños (2002); Gómez Sabaini (2005b); Gillingham, et al. (2007); and Barreix et al (2006).
Quasi-Gini coefficients of total taxes
0 10 20 30 40 50 60 70
United States (federal)
Panama
Colombia
EU-15
Bolivia
Guatemala
Peru
Costa Rica
Honduras
Nicaragua
El Salvador
Concentration curves for total taxes
0
20
40
60
80
100
1 2 3 4 5
Income Quintiles (lowest to highest)
Costa Rica
El Salvador
Guatemala
Honduras
Nicaragua
Panama

14
Tax systems in the region, whether progressive or regressive, have a limited effect on the overall distribution of income. This is consistent with international experience. In general terms, the impact of taxes on the distribution of income is a function of three variables: the pre-tax distribution of income, the distribution of tax payments across income groups, and the ratio of total taxes considered in the incidence analysis to total income before taxes (here called the tax pressure).27 As Table 3 shows, the redistributive potential of taxes in Central America, whether progressive or regressive, is fairly small. This results from the low rates of tax pressure in some countries, and the relatively similar distributions of taxes and income (small Kakwani indices) in others. Only for Nicaragua is the implied redistribution effect somewhat larger, because the regressivity of the tax system combines with a relatively high ratio of taxes to household income.28 Taxation also has only modest effects on the distribution of income in Andean countries, the United States, and Europe. As mentioned above, this is a common finding in tax incidence studies, and one that contrasts with the large redistributive potential of social spending (sections III and IV of this paper). How Progressive Are Individual Taxes? Income taxes are generally progressive in Central America (Appendix Table A.2 and Figure 2).29 This is consistent with the evidence for developed and developing countries.30
However, given that income taxes contribute on average only about one-fourth of an already small tax intake across Central America, their overall redistributive impact is quite small (at or under 0.4 percentage points of the pre-tax Gini coefficient for all countries) (see Appendix Table A.3). Even in Panama, where the income taxes considered are strongly progressive and account for a greater share of total tax revenue, their low share in income results in a small redistributive effect.31
27This latter ratio may differ, sometimes substantially, from the tax-to-GDP ratio. The differences may arise in the numerator; for example, if the coverage of taxes used for the analysis of incidence is limited to a subset of total taxes. The differences may also arise in the denominator, and may stem from a considerable gap between GDP and national income, as well as from differences in total income measured from national accounts vis-à-vis household surveys. This is the case for Nicaragua, as explained in the next footnote. 28The measured tax pressure for Nicaragua is high because the coverage of taxes for the incidence analysis is broad (including property and sales taxes for the city of Managua) and total disposable income was only 51 percent of GDP for 2000, according to the information used by Gómez Sabaini (2005b). 29Social security contributions are treated as taxes on wages by Bolaños (2002), and are therefore included under the income tax for Costa Rica. This contributes to underestimate the progressivity of income taxes in Costa Rica relative to the rest of the region. 30Gemmell and Morrissey (2005) conclude from their literature review that income taxes are generally progressive, although personal income taxes are more consistently so than corporate taxes. Similarly, the tabulation of tax incidence studies for developing countries presented in Chu, Davoodi, and Gupta (2000) suggests that income taxes are progressive in 12 of the 14 cases studied, while payroll taxes are more likely to be regressive. See also Engel, Galetovic, and Raddatz (1999) for Chile. 31The underlying study (Rodríguez Arosemena, 2007) considers only taxes on income from wages and self-employment. Corporate income taxes are excluded.

15
Gini for Quasi-Gini Kakwani Tax Quasi-Gini RS
pre-tax for taxes Index pressure 2/ for post-tax Index 3/
income income(A) (B) (C = B - A) (D) (E = A - D)
Central AmericaCosta Rica (2000) 45.1 44.9 -0.2 20.8 45.1 0.0
El Salvador (2000) 47.4 31.7 -15.7 8.1 48.8 -1.4
Guatemala (2004) 4/ 46.3 46.4 0.1 17.3 46.3 0.0
Honduras (2004) 47.2 40.8 -6.4 14.4 48.3 -1.1
Nicaragua (2000) 51.0 37.4 -13.6 27.5 56.2 -5.2
Panama (2003) 53.8 57.1 3.3 6.4 53.6 0.2
Andean Countries 5/Bolivia (2000) 55.6 49.8 -5.8 16.6 56.7 -1.1
Colombia (2003) 53.7 53.2 -0.5 7.7 53.7 0
Peru (2000) 53.5 46.0 -7.5 7.6 54.3 -0.8
US (Federal, 2004) 43.8 58.4 14.6 19.8 40.2 3.6
Europe 6/EU-15 (2001) 39.9 50.0 10.1 -- 37.7 2.2
Denmark (2001) 41.9 38.2 -3.7 -- 44.1 -2.2
Ireland (2001) 45.6 57.0 11.4 -- 43.3 2.3
Italy (2001) 40.1 48.3 8.2 -- 38.7 1.4
Portugal (2001) 42.2 69.4 27.2 -- 38.7 3.5
Spain (2001) 39.9 60.0 20.1 -- 36.0 3.9
Sweden (2001) 38.9 35.2 -3.7 -- 41.1 -2.2
Sources: Acevedo and González Orellana (2005); Auguste and Artana (2005); Barreix et al. (2006); Bolaños (2002); Gillingham, et al. (2007);
Gómez Sabaini (2005b); Cossío Muñoz (2006); Rodríguez Arosemena (2007); US Congressional Budget Off ice (2006); EUROMOD
Choice of comparator countries is driven by data availability.
1/ All data are based on total current income by current income quintiles, unless otherw ise noted.
2/ Tax pressure is the ratio of total taxes paid to total household income before taxes; for Colombia and Peru it is total taxes paid/GDP.
3/ RS is the Reynolds-Smolensky Index.
4/ Data are before Constitutional Court rulings in 2003 and 2004 and the tax reform in 2004. But Auguste and Artana (2005)
show that these reforms had little impact on income distribution (an RS index of 0.5; see Table 23, p. 60).
5/ Data for the three countries are based on, and ordered by, per capita income; data for Colombia and Peru are based on deciles.
6/ Data for European countries are based on, and ordered by per capita income
Table 3. Central America. Redistributive impact of the overall tax system 1/

16
Figure 2. Central America. Progression of Taxes.Relative tax burden by income quintile
Source: Staff calculations based on Agosin, et al (2004); Acevedo and González Orellana (2005); Auguste and Artana (2005); Bolaños (2002); Gillingham et al. (2007); and Gómez Sabaini (2005b).QG= Quasi-Gini coefficient of taxes.RS=Reynolds-Smolensky index. Positive values denote progressivity.
VAT / Sales
0
50
100
150
200
250
300
350
1st 2nd 3rd 4th 5th
Costa Rica (CRI) El Salvador (SLV)Guatemala (GTM) Honduras (HND)Nicaragua (NIC) Panama (PAN)
QG RSCRI 42.9 -0.2SLV 25.3 -1.3GTM 39.1 0.6HND 31.3 -1.2NIC 27.8 -2.9PAN 50.5 -0.1
Excises
0
50
100
150
200
250
300
1st 2nd 3rd 4th 5th
QG RSCRI 49.3 0.1 SLV 37.9 0.0GTM 47.9 0.0HND 24.4 -0.2NIC 27.5 -1.9PAN 51.8 0.0
International Trade
0
50
100
150
200
250
300
350
1st 2nd 3rd 4th 5th
QG RSCRI 34.4 -0.2SLV 31.8 -0.2GTM 58.3 0.4HND 27.7 -0.4NIC 39.5 -0.3PAN 42.6 -0.1
Income
0
20
40
60
80
100
120
140
160
1st 2nd 3rd 4th 5th
QG RSCRI 48.1 0.3SLV 56.3 0.1GTM 50.4 0.2HND 61.6 0.7NIC 58.6 0.4PAN 73.9 0.4

17
Appendix Tables A.2 and A.3 also show that income taxes are much more progressive in Andean countries and the United States (except, in some cases, with respect to Panama and Honduras), and that their distributional effect is much stronger in these comparator countries.32
While the empirical literature presents somewhat mixed results on the distributional impact of VAT and sales taxes33, these taxes are clearly regressive in Central America when assessed relative to income (Appendix Table A.2 and Figure 2). In El Salvador, the poorest 20 percent of the population pay over three times more VAT relative to their income than the average household in the country and five times as much relative to the richest 20 percent. Moreover, because VATs or sales taxes are the single most important source of tax revenue for most Central American countries, their pronounced regressivity has a tangible effect on the overall income distribution. This is the case in El Salvador, Honduras, and especially Nicaragua, as reflected in highly negative Reynolds-Smolensky indices (Appendix Table A.3). In contrast, local and global indicators of VAT regressivity are much lower for Costa Rica, possibly reflecting targeted exemptions; in particular, the exclusion from the tax of a basic basket of goods and services consumed mostly by the poor. On average, the VAT is more regressive and has a stronger negative redistributive effect in Central America than in Andean countries, as Appendix Table A.3 suggests.
The regressivity of the VAT in Central American countries is much lower if measured relative to consumption. Consumption tends to be more evenly spread than income, and as a result, the ratio of consumption to income for the poorest income groups tends to be much higher than for the richer ones. For instance, in El Salvador, the ratio of consumption to income is 177 percent for the lowest quintile and 52 percent for the highest, probably reflecting the under-reporting of remittances in poorer households. If consumption is used instead of current income as an indicator of capacity to pay, the VAT becomes much less regressive in El Salvador and Nicaragua, and turns progressive in Panama (Appendix Table A.4), Guatemala (Auguste and Artana, 2005) and Honduras (Gillingham, Newhouse, and Yakovlev, 2008). In the Dominican Republic, the VAT is highly progressive relative to household expenditure: the effective tax rate paid by the richest quintile is twice as large as that paid by the poorest (Jenkins, Jenkins, and Kuo, 2006).34 Yet, the fact that the VAT is regressive in El Salvador and Nicaragua, even when measured relative to consumption, suggests that exemptions may be disproportionately benefiting the rich in these countries.35 In
32Income taxes without social security are negative (that is, after-tax income is higher) for the bottom two income quintiles in the United States because of earned income tax credits. 33Several studies suggest that the incidence of VATs and sales taxes is regressive when considered relative to income (e.g., Gemmel and Morrissey, 2005, in their survey), but there is evidence that VATs have a progressive incidence in some African countries (Sahn and Younger, 1999; and Muñoz and Cho, 2004). Appendix Table A.3 shows that the VAT is progressive in Ecuador and Venezuela, even when considered relative to income. 34 Moreover, in this and other developing countries with subsistence economies and large informal markets, the regressivity of the VAT may be overestimated, as most goods consumed by poor households are own-produced or acquired in informal markets or through barter, and therefore not legally or practically subject to tax (Ibid.).

18
practice, VAT exemptions often fall on services, which normally account for a larger share of expenditures for higher income groups.
Excise taxes are also regressive, except in Costa Rica and Guatemala. Indeed, in Honduras and Nicaragua they are the most regressive tax. And, because their share in total taxation is also sizable, excises have a palpable effect on the overall distribution of income, as indicated by the Reynolds-Smolensky index (Appendix Tables A.2 and A.3). As in the case of VAT, the incidence of the tax depends largely on the consumption patterns for the taxed goods. The regressive incidence of excise taxes in these countries is driven mainly by taxes on alcohol, tobacco, and fuel, because consumption of these goods accounts for a larger share of the income of poorer households.36 In Panama, excise taxes are also regressive as a whole, but much less so.37 By contrast, excise taxes are essentially neutral in Guatemala, and fairly progressive in Costa Rica where the broader coverage of excises, which includes luxury goods, makes them even more progressive than income taxes.38 As in Central America, the evidence on the incidence of excises is mixed for other countries: they are highly progressive in Bolivia but regressive in the United States (Appendix Tables A.2 and A.3).
International trade taxes (mostly import tariffs, as export taxes are very small in the region) are highly regressive in most Central American countries (Appendix Tables A.2 and A.3),. This reflect the fact that tariffs tend to be higher on imported consumption goods that are also produced domestically, especially food and lightly processed manufactured goods, which represent a larger share of the consumption basket of poorer households. Guatemala appears to be an exception, suggesting that imported goods subject to tariffs may be more prominent in the consumption patterns of the rich in this country.39
III. SOCIAL SPENDING IN CENTRAL AMERICA: TRENDS AND DISTRIBUTIONAL IMPACT
The overall impact of social spending on income distribution depends on the magnitude of social spending and its allocation across income groups. Social spending includes capital and current spending on education, health, social protection (social insurance and social assistance), housing, water and sewage, and culture, sports, and recreation. The first part of this section examines trends in social spending in Central America, while the second surveys existing studies on the incidence and distributive impact of social spending. 35A VAT with no exemptions should, in principle, be roughly proportional to consumption. If exemptions are well-targeted, the VAT should be slightly progressive when measured in terms of consumption. Thus, as Barreix, Roca, and Vilella (2006) argue, the consumption- or expenditure-based analysis of VAT incidence provides a way to check who ultimately benefits from the VAT exemptions. 36Taxes on fuel, tobacco, and alcohol are mostly intended to mitigate potential negative externalities; equity issues are usually not a consideration. The latter do, however, play a role in the case of taxes on luxury goods. 37Consistent with the findings for other countries, in Panama excise taxes on tobacco and alcoholic and other drinks are very regressive, but those on cars and other luxury items are progressive (Rodríguez Arosemena, 2007). 38Nonetheless, Bolaños (2002) argues that a legal reform in 2001—which substantially reduced average tax rates and their dispersion—may have reduced or eliminated the progressivity of these taxes in Costa Rica. 39A previous study (Mann, 2002), however, had found that import tariffs are roughly proportional in Guatemala.

19
A. Social Spending Trends
The macroeconomic priority assigned in Central America to social spending—as measured by its share in GDP—has increased considerably over the past decade: the share was on average 11½ percent of GDP in 2004, an increase of 2¼ percent of GDP since 1995 (Table 4), slightly below the Latin American average, but well below the Latin American median.
Social spending has continued to increase in recent years in most countries (Appendix Table A.5), with the exception of Costa Rica and Panama, which already devote the highest amount of resources to social spending.. The macroeconomic priority has also increased for all the components of social spending. Public spending on education and health in the region is roughly similar to the Latin American average (and median). Spending on social protection, however, is much lower, and varies significantly across Central America, reflecting large differences in both pension and social assistance spending (including, for example, conditional cash transfer programs) (Figure 3).
The fiscal priority assigned to social spending, as measured by its share in total public expenditures, has also increased (Figure 4). Costa Rica, again, has the highest share (68½ percent, 6 percentage points more than in 1994–95), while Honduras, the Dominican Republic, and Nicaragua direct less than 40 percent of expenditure to social spending.

20
1994/95 2003/04 Increase 1994/95 2003/04 Increase
Costa Rica 15.8 18.6 2.8 4.2 5.7 1.4Dominican Republic 2/ 6.1 7.4 1.3 2.1 3.0 0.9El Salvador 6.2 8.6 2.4 2.1 3.0 0.9Guatemala 4.1 6.5 2.4 1.7 2.6 0.8Honduras 7.8 13.1 5.3 3.8 7.2 3.5Nicaragua 7.2 8.8 1.7 2.8 4.1 1.3Panama 17.3 17.3 0.0 4.3 4.7 0.4
Regional Average:Central America 9.2 11.5 2.3 3.0 4.3 1.3Latin America 3/ 11.0 12.6 1.6 3.4 4.3 0.9
Regional Median:Central America 7.2 8.8 1.7 2.8 4.1 1.3Latin America 3/ 7.8 12.4 4.6 3.6 4.1 0.5
Costa Rica 4.7 5.7 1.0 5.2 5.6 0.4Dominican Republic 2/ 1.2 1.6 0.3 0.4 1.1 0.7El Salvador 1.4 1.5 0.1 2.1 3.1 1.0Guatemala 0.9 1.0 0.1 0.7 1.2 0.4Honduras 2.6 3.5 0.9 0.2 0.5 0.3Nicaragua 2.8 3.0 0.2 … … …Panama 5.8 6.0 0.2 5.7 5.5 -0.2
Regional Average:Central America 2.8 3.2 0.4 2.4 2.8 0.4Latin America 3/ 2.5 2.7 0.2 4.4 5.0 0.6
Regional Median:Central America 2.6 3.0 0.4 1.4 2.1 0.7Latin America 3/ 2.4 2.4 0.1 2.4 4.2 1.8
Sources: ECLAC; Social Panorama of Latin America 2005; Ministry of Finance of El Salvador.
1/ 2003/2004 refers to the simple average of the data for these two years.
2/ Figures under review owing to changes in the GDP series.
3/ Includes Argentina, Bolivia, Brazil, Chile, Colombia, Costa Rica, Dominican Republic, Ecuador,
El Salvador, Guatemala, Honduras, Mexico, Nicaragua, Panama, Paraguay, Peru, Uruguay, and Venezuela.
4/ Includes social insurance and social assistance programs.
Table 4. Evolution of Social Spending, 1994/95 vs 2003/2004 1/(in percent of GDP)
o/w Education Spending
o/w Social Protection 4/
Total Social Spending
o/w Health Spending

21
0
1
2
3
4
5
6
7
Panama Costa Rica El Salvador Dominican Republic Guatemala
Figure 3. Central America: Composition of Social Protection Spending, 2004(in percent of GDP)
Social insurance
Social assistance
Sources: Fund staff calculations based on ECLAC (2006); Lindert et al (2006); Petrei and Arosemena (2006); ministries of finance.
Figure 4. Central America: Evolution of Government Expenditures
Source: Staff calculations based on ECLAC and national data sources.
Total Government Expenditure(in percent of GDP)
0
5
10
15
20
25
30
35
1995 1996 1997 1998 1999 2000 2001 2002 2003 2004 2005 2006
Costa RicaDominican RepublicEl SalvadorGuatemalaHondurasNicaraguaPanama
Share of Social Spending in Total Expenditures(in percent)
0
10
20
30
40
50
60
70
80
Costa Rica Panama Guatemala El Salvador Honduras DominicanRepublic
Nicaragua
1994/1995 2003/04

22
B. The Incidence and Distributional Impact of Social Spending
Methodological Considerations An analysis of the incidence of social spending requires identifying the actual beneficiaries of social spending programs. This can be done directly in some cases but only indirectly in others, resulting in the potential for heterogeneous assumptions on incidence across different studies. Although only a few of the studies surveyed in this section provide methodological details, there appears to be relative homogeneity in the way some beneficiaries are identified (e.g., for primary spending, by way of primary school enrollment ratios based on household surveys) and heterogeneity in others (e.g., for social assistance to the disabled, by various proxies such as general share of the disabled in total population or enrollment in programs for the disabled).
In discussing the incidence of social spending, it is useful to distinguish between absolute incidence (the share of total spending that each income group receives) and relative incidence (the distribution of social spending relative to the distribution of pre–fiscal policy income in the economy). A distribution of social spending in which, for example, the lowest quintile receives 45 percent of the total while the top quintile receives 5 percent of the total is progressive in absolute terms. In contrast, a distribution of social spending in which the bottom quintile receives 10 percent of spending and the top quintile receives 30 percent is not progressive in absolute terms, but can improve the income distribution if it is more equally distributed than income itself. The latter would thus be progressive in relative terms.
The absolute and relative incidences of social spending are measured with the same set of indicators used to assess the distributional impact of taxation, but with a different interpretation. The quasi-Gini coefficient of spending is conceptually analogous to the quasi-Gini coefficient for a given tax, as it represents the Gini coefficient for the concentration curve of spending. However, the possible values of the quasi-Gini coefficient of spending lie between –1 and 1, with a negative value denoting progressivity in absolute terms (in other words, the concentration curve of spending lies above the 45-degree line). The Kakwani index (K), defined as the difference between the quasi-Gini coefficient of spending and the Gini coefficient of the original income distribution, measures relative progressivity of spending. If K < 0, spending is progressive relative to the original income distribution. Distributional Impact of Social Spending in Central America Available data suggest that total public social spending in Central American countries is progressive in relative but not absolute terms. Costa Rica, Guatemala, and Panama—the only countries for which incidence studies are available for the most comprehensive definition of social spending—all have positive quasi-Gini coefficients of spending, which means that social spending is not progressive in absolute terms (Table 5, Panel A, column 2). However, social spending is much more equally distributed than pre-spending income, and thus is progressive in relative terms, as denoted by the negative values of the Kakwani index (Table 5, Panel A, column 3).

23
The magnitude of the distributional effect of social spending varies considerably across the region. Social spending in Costa Rica and Panama has the highest distributional impact in the region, achieving reductions in the Gini coefficient of 6 and 7.4 points, respectively. This reflects partly high levels of social spending as a share of GDP. In contrast, despite pro-poor targeting, social spending has a much more muted impact in El Salvador, with a reduction in its Gini coefficient of just 3.6 points, which is roughly on par with the impacts seen in Guatemala and Honduras.
A comparison with the distributional impact in other regions reveals a number of interesting observations:
In absolute terms, as measured by the reduction of the pre-fiscal Gini coefficient, the redistributive impact of social spending in the most progressive Central American countries (i.e., Costa Rica and Panama) is comparable to that of some European countries (e.g., Italy, Spain and Portugal) and exceeds that observed in Andean countries. However, because of the uneven initial income distribution, post–social spending inequality in Central America remains high. This is reflected in post–social spending Ginis (except for Costa Rica) that remain above the pre–social spending Ginis of European countries (Table 5, column 6). In other words, the incidence and scale of social spending is insufficient to bring down inequality in Central America even to pre–fiscal policy levels in Europe.
While the progressivity of total social spending in Central America is not substantially different from that of the least progressive European countries, there is room to improve the targeting of social spending further. The average quasi-Gini coefficient of –24.5 for social spending in the EU-15 is linked to an incidence of social spending in which 81 percent accrues to the lowest three quintiles. By contrast, the lowest three quintiles receive about 70 percent of social spending in El Salvador; 60–65 percent in Costa Rica, Guatemala, Panama, and Honduras; and only about 50 percent in Nicaragua.
How Progressive Are Individual Social Spending Components? Public spending on social protection—mainly pensions—is pronouncedly regressive in Central America. In fact, if social security is excluded, social spending is progressive in absolute terms (i.e, strongly pro-poor) in Costa Rica, El Salvador, and Panama, and progressive in relative terms in all Central American countries (Tables 5 and 6). These findings are consistent with a World Bank study of public transfers across Latin America and the Caribbean (Lindert, Skoufias, and Shapiro (2006)), which found that all 16 social insurance programs studied are regressive in absolute terms.

24
Figure 5. Central America. Incidence of Total Social Spending
Source: Staff calculations on the basis of data from ECLAC and national authorities.1/ Excluding public spending on social protection.
Quasi-Gini Index of Social Spending 1/
-15 -10 -5 0 5 10 15 20
Colombia
El Salvador (2002)
Costa Rica (2000)
Uruguay (1998)
Panama (2003)
Peru (2000)
Honduras (2004)
Guatemala (2000)
Brazil (1997)
Nicaragua (1998)
Bolivia
Concentration Curves for Social Spending
0
20
40
60
80
100
1 2 3 4 5
Income Quintiles (lowest to highest)
EqualityCosta Rica (2000)El Salvador (2000)Guatemala (2000)Honduras (2004)Nicaragua (1998)Panama (2003)

25
Pre-Spending Gini (Income)
Quasi-Gini of Spending Kakwani Index
Share of Social Spending 1/
Impact on Gini (RS Index) 2/
Post-Spending Gini
(1) (2) (3)=(2)-(1) (4) (5) (6)=(1)-(5)
Central AmericaCosta Rica (2000) 45.1 3.0 -42.1 18.2 6.2 38.9Guatemala (2004) 46.3 14.0 -32.3 6.3 3.0 43.3Panama (2003) 53.8 11.2 -42.7 17.4 6.8 47.0
Selected other comparator countriesEU-15 (2001) 41.7 -24.5 -66.2 24.0 8.8 32.8Denmark (2001) 43.7 -79.9 -123.6 29.2 13.1 30.6Ireland (2001) 47.8 -38.0 -85.8 13.8 13.2 34.6Italy (2001) 42.8 7.2 -35.6 24.4 6.1 36.6Portugal (2001) 44.4 -12.2 -56.6 21.1 6.1 38.4Spain (2001) 42.1 0.9 -41.2 19.6 6.3 35.8Sweden (2001) 40.7 -18.3 -58.9 28.9 11.3 29.4
Central AmericaCosta Rica (2000) 45.1 -9.0 -54.1 12.5 6.0 39.1El Salvador (2000) 47.4 -12.9 -60.3 5.3 3.6 43.8Guatemala (2004) 46.3 2.4 -43.9 5.2 3.1 43.2Honduras (2004) 47.2 0.7 -46.4 10.5 3.2 44.0Nicaragua (1998) 51.0 11.2 -39.8 8.6 5.6 45.5Panama (2003) 53.8 -3.5 -57.3 11.9 7.4 46.4
Andean countriesBolivia 55.6 15.3 -40.3 8.0 4.5 51.1Colombia 53.7 -13.2 -66.9 5.5 5.0 48.7Peru 53.5 -2.5 -56.0 5.5 3.5 50.0
Sources: Fund staff calculations based on Barreix et al, 2006 (for the Andean countries), ECLAC 2006, EUROMOD (for the European
countries); World Bank (various country Poverty Assessment reports); Gillingham, et al. (2007), and Petrei and Arosemena (2006).
Choice of comparator countries is driven by data availability.1/ For Latin America, the average share of social spending in GDP over 2000–2004. For Europe, 2001data.
2/ Reynolds-Smolensky index. Positive values represent progressivity.
Panel A. Total Social Spending, including Social Security
Panel B. Total Social Spending, excluding Social Security
Table 5. Redistributive effect of total social spending: Central America and selected regional comparators

26
Total education spending is progressive in relative terms in all of Central America, though more so in El Salvador and Panama (where it is progressive even in absolute terms) and less so in Nicaragua (where the richest quintile receives about 35 percent of total public spending). However, the distributional effects of spending on different levels of education differ sharply. Thus, public spending on primary education is unambiguously pro-poor (that is, strongly progressive in absolute terms) in all countries of the region. Public spending on secondary education follows an inverted U-shape, with the highest share of benefits accruing to the middle three quintiles, except in Guatemala, where it exhibits strong regressivity. In sharp contrast, spending on tertiary education is regressive across the board, with an average of only 25 percent of public spending on tertiary education accruing to the bottom 3 quintiles of the income distribution. In Guatemala and Honduras, tertiary education spending is regressive even in relative terms; that is, its distribution is worse than the original income distribution, as reflected by a positive Kakwani index.
The distribution of public spending on health is progressive in relative terms in all of Central America, and in absolute terms in four of the seven Central American countries surveyed. Costa Rica and El Salvador are able to direct more than 25 percent of total public spending on health to the poorest quintile, and more than 70 percent to the bottom three quintiles (Figure 7). Nicaragua and the Dominican Republic show a more modest, but still pro-poor, incidence of public health spending, while health spending in Guatemala, Honduras, and
% of Social1 2 3 4 5 Spending
Costa Rica (2000)
Social Protection 12 12 12 18 45 28.9Pensions 8 9 12 19 52 24.5
Contributive Regime 1/ 5 9 11 19 56 22.9Non-contributive Regime 51 22 15 11 2 1.6
Work Protection 21 26 24 21 8 0.4Assistance to Vulnerable Groups 38 25 16 14 8 4.0
Panama (2003)
Social Protection 1 3 7 19 70 23.2Pensions 0 3 6 19 72 21.7Labor standards and inspection 2 9 18 28 43 0.0Labor complaints and resolutions 2 9 18 28 43 0.1Labor force formation 9 12 16 26 38 1.1Protection of minors 30 27 20 12 12 0.2Assistance to the elderly and disabled 9 22 51 18 0 0.0Other 11 14 17 24 34 0.0
Guatemala (2000)
Social Protection 8 13 15 18 46 25.2Social Insurance 1 3 5 15 76 10.2
Pensions 1 2 4 12 81Survivorship 4 4 4 13 75Alimony 1 6 10 24 60
Social Assistance 14 21 24 21 20 15.0
Sources: Trejos, 2001 (Costa Rica); Petrei and Arosemena, 2006 (Panama); World Bank, 2003a (Guatemala).
1/ Pension benefits are assessed on a gross basis (not net of contributions).
Population Income Quintiles (lowest to highest)
Table 6. Central America. Incidence of Social Protection Spending
(Share of total spending on social protection accruing to each quintile, in percent)

27
Panama has a neutral absolute incidence, with about 60 percent of spending accruing to the bottom three quintiles, in proportion with their share of total income.
Figure 6. Central America. Incidence of Public Spending on Education(in percent of total, by quintile, non-cumulative)
Source: Staff calculations based on ECLAC(2006), World Bank (various country Poverty Assessment reports) and Petrei and Arosemena (2006).QG=Quasi-Gini of education spending; K = Kakwani Index.
Incidence of Total Education Spending
0
5
10
15
20
25
30
35
40
1 2 3 4 5
Costa Rica (CRI)
El Salvador
Guatemala (GTM)
Honduras (HND)
Nicaragua (NIC)
Panama (PAN)
QG KCRI -1 -46SLV -13 -60GTM 3 -48HND 5 -42NIC 22 -29PAN -4 -61
Incidence of Primary Education Spending
0
5
10
15
20
25
30
35
40
1 2 3 4 5
Costa Rica
Dominican Republic
El Salvador
Guatemala
Honduras
Panama
Incidence of Secondary Education Spending
0
5
10
15
20
25
30
35
40
45
1 2 3 4 5
Costa Rica
Dominican Republic
El Salvador
Guatemala
Honduras
Panama
Incidence of Tertiary Education Spending
0
10
20
30
40
50
60
70
80
90
1 2 3 4 5
Costa Rica
Dominican Republic
El Salvador
Guatemala
Honduras
Panama
QG KCRI -22 -67DR -17 -60SLV -18 -65GTM -10 -61HND -24 -71PAN -25 -82
QG KCRI -1 -46DR 4 -39SLV 8 -39GTM 30 -21HND 13 -34PAN -7 -63
QG KCRI 43 -2DR 36 -7SLV 47 -1GTM 69 18HND 57 9PAN 36 -21

28
0
5
10
15
20
25
30
35
40
1 2 3 4 5
Income Quintiles (from lowest to highest)
Figure 7. Central America. Incidence of Public Spending on Health(Percent of total, by quintiles, non-cumulative)
Costa Rica (CRI) El Salvador (SLV)
Guatemala (GTM) Honduras (HND)
Nicaragua (NIC) Panama (PAN)
Dominican Republic (DR)
QG KCRI -19 -64DR -7 -50SLV -13 -60GTM 3 -48HND 2 -45NIC -2 -53PAN 0 -56
Source: Staff caluclations based on ECLAC(2006), World Bank (various country Poverty Assessment reports) and Petrei and Arosemena (2006). QG= Quasi-Gini of education spending; K= Kakwani Index
IV. NET DISTRIBUTIONAL EFFECTS OF FISCAL POLICY: A SUMMARY ANALYSIS
This section examines the combined net distributional impact of taxation and social spending in Central America. The information on the distribution of income before fiscal policy, and on the incidence of taxes and social spending, can be pieced together to produce an estimate of the net direct distributional effect of fiscal policy. The latter can be measured by comparing the concentration patterns of income before and after fiscal policy interventions, as summarized by the Reynolds-Smolensky (RS) index. The RS, in turn, is a function of the initial distribution of income, the shares of taxation and social spending in income, and their distribution across income groups.
For Central America, available data suggest that the net redistributive effect of fiscal policy is modestly progressive (Tables 7 and 8). While taxation has a small regressive effect, social spending has a larger progressive impact, thus yielding a progressive net effect. The quasi-Gini index for income after fiscal policy is smaller than the Gini coefficient for pre-fiscal policy income (a positive RS index), and the income of the upper quintiles is redistributed to the poorer two quintiles. Therefore, inequality falls as a result of fiscal policy interventions. The size and composition of the overall redistributive effect of fiscal policy vary considerably across the six Central American countries for which full information is available. The net impact is strongest in Costa Rica and Panama, with a reduction in income

29
inequality of 7–8 percentage Gini points, and an increase in the income of the poorest quintile of 60 and 162 percent, respectively. In both countries, a broadly neutral tax system combines with high levels of well-targeted social spending.40 In Guatemala, despite the broadly neutral effect of the tax system, low levels of social spending and its incidence limit the distributive impact to a modest 3.7 Gini points. In Nicaragua, taxation is highly regressive but more than offset by the progressivity of social spending, which reduces the Gini coefficient by 3.1 points on a net basis. However, the amount of redistribution through social spending is small relative to the tax burden, and thus the net increase in the income of the poorest quintile is only 8 percent. Finally, in El Salvador and Honduras, the effects of both taxation and social spending on income distribution are modest, yielding a correspondingly small net impact.
The net redistributive impact of fiscal policy in Central America is similar to that of Andean countries, where tax systems tend to be regressive but are offset by progressive social spending, yielding a modestly progressive net effect (Tables 7 and 8). The situation is very different in the European Union, where tax systems are on average progressive (but with a small distributional impact) and social spending is highly progressive and very powerful.41 The net effect is large and strongly progressive, with the post–fiscal policy quasi-Gini index 12.5 points lower than the pre–fiscal policy Gini coefficient, and the income of the poorest quintile almost doubling as a result of fiscal redistribution.
40 Also, in Panama, a relatively high level of social spending is made possible by the large proportion of nontax revenue in total government revenue, which enhances the progressivity of the net impact. 41 Among EU comparators, it is possible to distinguish two distributive patterns: (i) countries in which the tax system is progressive and redistribution is complemented by social spending (e.g., Ireland, Italy, Portugal, Spain); and (ii) countries in which the tax system is moderately regressive but social spending is so potent and well targeted that it yields a very strong progressive overall effect (e.g., Sweden, Denmark).

30
Pre-Fiscal Policy Gini (Income)
Post-Taxation Gini 1/
Post-Social Spending Gini
1/Post-Fiscal Policy Gini
RS Index 2/
(1) (2) (3) (4) (5)
Central AmericaCosta Rica (2000) 45.1 45.1 39.1 38.3 6.8El Salvador (2000) 47.4 48.8 43.8 45.8 1.6Guatemala (2004) 46.3 46.3 43.2 42.6 3.7Honduras (2004) 47.2 48.3 44.0 44.5 2.7Nicaragua (1998) 51.0 56.2 45.5 48.0 3.1Panama (2003) 53.8 53.6 46.4 45.8 8.0
Andean CountriesBolivia 55.6 56.7 51.1 51.3 4.3Colombia 53.7 53.7 48.7 48.3 5.4Peru 53.5 54.3 50.0 50.4 3.1
Selected Other Comparator CountriesEU-15 (2001) 41.7 39.2 32.8 29.1 12.5Denmark (2001) 43.7 45.8 30.6 25.7 18.1Ireland (2001) 47.8 45.3 34.6 30.4 17.4Italy (2001) 42.8 40.7 36.6 33.7 9.1Portugal (2001) 44.4 40.6 38.4 34.3 10.2Spain (2001) 42.1 37.9 35.8 31.3 10.8Sweden (2001) 40.7 42.8 29.4 26.1 14.5
Sources: Barreix et al, 2006 (for the Andean countries and European comparators); and Fund staff calculations based on ECLAC (2006); World Bank (various country poverty assessment reports); Bolaños(2002), Agosin et al. (2005), Gillingham et al. (2007).
1/ For Latin America, excludes social security. For Europe, includes social security.2/ Reynolds-Smolensky Index. Positive values denote progressivity.
Table 7. Redistributive Effect of Taxation and Social SpendingCentral America and Selected Regional Comparators

31
1 2 3 4 5
Central AmericaCosta Rica 59.1 18.4 6.1 -1.8 -10.1El Salvador 19.0 2.0 -1.8 -4.5 -5.2Guatemala 12.8 2.2 -3.1 -8.1 -15.0Honduras 19.4 1.9 -3.8 -6.6 -10.6Nicaragua 8.6 0.8 -3.9 -11.5 -14.8Panama 161.8 51.9 22.8 10.6 -3.0
Andean countriesBolivia 48.0 22.1 11.5 7.8 -2.8
Selected European comparator countriesEU-15 92.2 39.6 7.9 -8.0 -20.4Denmark 164.5 31.3 -19.6 -33.2 -44.2Ireland 525.2 78.3 12.9 -6.8 -21.9Italy 56.9 28.3 14.5 0.5 -14.0Portugal 92.2 31.0 8.4 1.8 -14.5Spain 82.4 37.1 14.4 0.3 -15.5Sweden 114.1 33.9 -6.5 -17.8 -28.9
Sources: Fund staff calculations based on country studies, EUROMOD and Barreix et al (2006).
1/ Fiscal policy refers only to taxation and social spending.
Population Income Quintiles (form lowest to highest)
Table 8. Impact of fiscal policy on pre-fiscal policy income, by quintile 1/(in percent of pre-fiscal policy income)
The Central American and international evidence clearly shows that the redistributive potential of taxes is much smaller than that of social spending (Tables 3, 5, and 7). This is for two main reasons. The first is economic: the globalization of trade and capital flows, the extent of the informal economy, and efficiency considerations pose limits on the capacity of governments to raise revenue through income taxes. Inevitably, a considerable share of revenues must be raised through taxes on the consumption of goods and services, which may have lower redistributive potential. The second reason is purely arithmetic: every dollar redistributed through absolutely progressive social spending, even if raised through neutral or even regressive taxes (in relative terms), would have a stronger proportional effect on the income of the poor than on the income of the rich. The more unequal the original income distribution is, the higher the redistributive power of fiscal policy through well-targeted social spending. Tax-financed increases in social spending would reduce inequality and raise the income of the poor in Central America. Table 9 shows the results of various simulations in which social spending is raised by 1 percent of GDP and financed through an equivalent increase in tax collection.42 There are four different simulations, combining two sets of permutations. First, the increase in taxes is assumed to be financed either by an increase in all taxes proportional to their current shares in total collection or solely from an increase in the VAT.43 Second, the 42 For simplicity, it is assumed that no revenues are lost in the process of redistribution. 43Two considerations motivated the focus on the VAT as one alternative permutation. The first, already referred to above, is the fact that globalization limits the scope for the taxation of capital and—to a lesser extent—labor income, which leads developing countries to raise taxes mainly through increases in the VAT. The second is the
(continued…)

32
proceeds are assumed to be distributed either according to the current incidence of social spending or equally to everyone (i.e., for every additional $100, $20 is channeled to each quintile). The four scenarios are designed to provide minimum benchmarks for the redistributive power of tax-financed increases in social spending.
Change inGini 1/
1 2 3 4 5
Simulation 1: 1 percent of GDP increase in overall tax collection devoted to social spendingCosta Rica 3.3 1.4 0.6 -0.1 -0.9 -0.6El Salvador 4.4 1.3 0.4 -0.2 -0.5 -0.4Guatemala 3.7 2.1 1.1 0.2 -1.1 -0.7Honduras 4.0 1.4 0.5 0.0 -0.7 -0.5Nicaragua 3.3 2.1 1.3 0.1 -0.8 -0.6Panama 5.4 2.7 1.2 0.4 -1.2 -0.8
Simulation 2: 1 percent of GDP increase in overall tax collection channeled evenly to income groupsCosta Rica 2.5 1.1 0.7 0.0 -0.8 -0.5El Salvador 3.2 0.9 0.3 -0.1 -0.4 -0.3Guatemala 4.6 2.1 0.9 0.1 -1.1 -0.7Honduras 3.9 1.6 0.6 0.0 -0.7 -0.5Nicaragua 6.1 2.7 1.2 0.1 -1.1 -0.8Panama 5.5 2.3 1.2 0.4 -1.1 -0.7
Simulation 3: 1 percent of GDP increase in VAT collection devoted to social spendingCosta Rica 3.3 1.4 0.5 -0.2 -0.8 -0.6El Salvador 3.9 1.1 0.3 -0.2 -0.4 -0.4Guatemala 3.3 1.7 0.9 0.1 -0.9 -0.6Honduras 3.3 1.1 0.3 -0.1 -0.5 -0.4Nicaragua 2.2 1.4 0.9 -0.2 -0.4 -0.4Panama 5.4 2.5 0.9 0.1 -1.0 -0.7
Simulation 4: 1 percent of GDP increase in VAT collection channeled evenly to income groupsCosta Rica 2.5 1.1 0.6 0.0 -0.7 -0.5El Salvador 2.7 0.7 0.2 -0.1 -0.3 -0.2Guatemala 4.2 1.7 0.6 -0.1 -0.8 -0.6Honduras 3.2 1.3 0.3 -0.1 -0.5 -0.4Nicaragua 5.1 2.0 0.7 -0.2 -0.7 -0.6Panama 5.4 2.0 0.8 0.1 -0.9 -0.7
Source: Fund staff calculations.1/ Quasi-Gini coefficient for post-fiscal policy income after the reform minus quasi-Gini coefficient for
post-fiscal policy income before the reform, times 100.
Population Income Quintiles (from lowest to highest)Percentage change in post-fiscal policy income before the reform
Table 9. Simulated impact of specified fiscal policy reform on post-fiscal policy income
The outcome of the exercise is qualitatively the same across all permutations. The net distributional effect of a fiscal reform that increases tax revenue by 1 percent of GDP and devotes the proceeds to social spending is progressive. It would reduce the income Gini
weight given in policy debates to the potential regressivity of the VAT taken in isolation, without acknowledging its overall distributional effects once the allocation of the proceeds is considered.
33
coefficient between 0.5 and 0.8 percentage points in Costa Rica, Guatemala, Nicaragua, and Panama, and between 0.2 and 0.4 percentage points in El Salvador and Honduras.44
Two main findings emerge from this simulation exercise:
First, improving the targeting of social spending can result in a considerable reduction in inequality. For example, in the case of Nicaragua, the impact of an increase in social spending on the income of the poorest quintile would double if the current pattern of absolute regressivity of social spending was improved to at least a flat distribution.
Second, the redistributive impact of the increase in social spending is not much affected by the nature of the taxes that finance it (even when the higher social spending is financed from a regressive source such as an increase in the VAT).45
V. CONCLUSIONS
The limited redistributive potential of taxation, especially compared with that of social spending, suggests that a key focus of tax policy in Central America should be raising revenue efficiently. The distributional impact of taxes is generally small, whether a tax is progressive or regressive. Moreover, there is often a trade-off between the progressivity of a tax and its potential to raise revenue: if the progressivity of the tax derives from exemptions or differential tax rates, its base may be eroded. Broadening the tax base—even if that implies eliminating progressive exemptions—to increase the pool of resources available for redistribution through social spending may enhance the overall progressivity of fiscal policy.
However, these conclusions do not imply that equity considerations should be absent in tax policy debates. The evidence presented in this paper shows that income taxes can be much less progressive and VATs and sales taxes much less regressive in some countries than in others. In part, this might reflect differences in economic structures across countries, but flaws in tax design likely also play a role. These flaws may simultaneously harm equity, efficiency, effectiveness, and administrative simplicity. For example, exemptions that disproportionately favor the richer segments of society may make the tax more regressive, facilitate evasion, and reduce revenue.
Although social spending can potentially have a powerful redistributive effect, its impact on poverty and income distribution in Central America is undermined by its relatively low absolute level. Countries in the region have made a visible effort in recent years to increase
44These findings are in line with those from a similar simulation exercise reported in IDB (1998), which finds that a hypothetical 1 percent of GDP rise in VAT revenues that is distributed equally (in absolute terms) among all income groups would reduce the income Gini coefficient by between 0.4 and 0.6 percentage points in Guatemala, Colombia, and the Dominican Republic, and between 0.3 and 0.4 in Argentina and Chile. 45 The differences in terms of Gini index impact are small, except in the case of Nicaragua, where the VAT is more regressive than other taxes and the original (pre–fiscal policy) income distribution.

34
social expenditures. However, despite some variability across the region, public social spending remains generally low both relative to GDP and as a share of total public spending.
The targeting of social spending in the Central American region can also be improved. The evidence discussed in this paper suggests that spending on health and primary education is strongly progressive. By contrast, spending on pensions and tertiary education is very regressive. The access and coverage of these two components of spending should be improved to enhance their impact on the poor. Well-targeted social assistance programs, such as cash transfers to households conditional on children attending school, can have a significant effect on poverty reduction, especially in the long run.
Overall, the combined effect of taxation and well-targeted social spending can substantially improve the income of the poor, even if the tax system individually considered is regressive.

35
Appendix 1: On What Basis Should the Tax Burden Be Measured? Income vs. Consumption1
The notions of progressivity and regressivity refer to how the tax burden is distributed relative to some measure of an individual’s or household’s welfare level, which in turn is an indicator of the household’s capacity to pay taxes. The traditional measure used in tax incidence studies is current income per household (or per income group), which may be seen as a proxy for the set of opportunities available to the household. However, there are several problems with current income:
It is volatile and subject to temporary shocks. A survey conducted over a particular period ignores the position of the household relative to its life cycle. Ideally, the capacity to pay should be measured relative to permanent or lifetime income.
Certain types of income tend to be under-represented in surveys, particularly income from self-employment, professional services, and capital (interest, dividends).
Inheritances, transfers, and family remittances are often poorly captured in survey-based measures of household income. This is a particular concern in Central America, where family remittances are an important source of income and welfare, especially for the poor.2
To avoid some of these problems, many researchers have proposed the use of consumption, instead of income, as a measure of welfare for tax incidence analyses.3 Consumption is less volatile than current income and might be taken as a reasonable proxy for permanent income. It is also less likely to be under-reported. Finally, donations, remittances, and other transfers, even if not fully captured in income, are usually reflected in consumption levels. Consequently, consumption tends to be more evenly distributed than income in most countries, and studies that use consumption as a welfare measure tend to find that overall taxation, and consumption-based taxes in particular, are more progressive than studies that use current income (Fullerton and Rogers, 1993). This is indeed what is found for El Salvador, Nicaragua, Panama (Appendix Table A.4), Guatemala (Auguste and Artana, 2005), and Honduras (Gillingham, Newhouse, and Yakovlev, 2008).
But the use of consumption is not without problems. Conceptually, consumption may be a deficient measure of permanent income in the presence of bequest motives or precautionary savings, so that present savings cannot be clearly interpreted as future consumption. Indeed, richer households are empirically found to permanently consume a lower share of their income than poorer households, even at later stages of their life cycles. More importantly, many household surveys do not measure consumption. Therefore, data availability, especially for cross-country comparisons, constrains the analyst to use current income. The use of income in this paper was forced by that constraint. ________________ 1This appendix is based mainly on Barreix, Roca, and Villela (2006) and Auguste and Artana (2005). 2Another problem with current income is that it does not consider the number and age of members in a household, which clearly affect the household’s welfare and capacity to pay for a given income. 3See, for instance, Poterba (1989), Fullerton and Rogers (1993), Barthold (1993), and Metcalf (1994).

36
Total 1/
2003 2008 2003 2008 2003 2008 2003 2008 2003 2008 2003 2008
Costa Rica 13.9 15.9 13.6 15.7 4.0 5.1 4.7 6.0 2.7 2.6 1.5 1.9Dominican Republic 13.0 15.6 12.1 15.0 3.4 3.8 3.1 4.7 2.6 4.1 2.8 1.6El Salvador 12.5 14.5 12.0 14.0 3.5 4.8 6.4 7.3 0.4 0.4 1.2 0.8Guatemala 12.5 12.1 11.7 11.3 1.5 2.5 5.3 5.5 1.2 0.9 1.4 0.8Honduras 15.5 17.8 13.7 16.1 3.0 4.7 5.0 6.2 1.2 0.8 1.3 1.1Nicaragua 16.4 19.0 15.9 17.6 4.0 5.7 2.6 2.5 3.5 2.7 4.6 5.7Panama 15.7 19.7 8.7 10.6 3.4 4.9 1.5 2.3 1.2 0.4 1.5 1.8
Central America, Panama, and DR Average 14.2 16.4 12.5 14.3 3.2 4.5 4.1 4.9 1.8 1.7 2.1 2.0
Source: Fund staff calculations, based on data from the authorities.
1/ Other taxes are excluded from the table, so the sum of income, VAT, excise and trade taxes is not equal to total tax revenue.
Trade Taxes
Table A1. Central America: Evolution and Structure of Tax Revenue
Total Revenue
Total Tax Revenue
VAT/SalesIncome Taxes Excises
In percent of GDP

37
1st 2nd 3rd 4th 5th
Income TaxesCosta Rica (2000) 88.0 92.8 91.3 92.2 106.6El Salvador (2000) 40.5 71.6 68.3 96.3 115.8Guatemala (2004) 95.8 88.5 86.7 81.7 111.2Honduras (2004) 40.6 49.6 57.2 70.9 131.0Nicaragua (2004) 62.5 69.8 76.1 85.7 113.3Panama (2003) 70.1 15.1 11.6 26.7 146.7
US (Fed, 2004, with Social Sec) 12.1 45.7 67.8 86.2 129.3US (Fed, 2004, w/o Social Sec) -53.1 -3.6 31.5 60.2 161.9
VAT/Sales TaxCosta Rica (2000) 104.6 109.5 105.5 104.7 95.1El Salvador (2000) 320.4 183.9 136.0 106.6 66.0Guatemala (2004) 145.6 122.1 114.9 108.4 87.4Honduras (2004) 272.1 144.6 125.4 104.4 76.5Nicaragua (2004) 255.6 189.8 158.2 129.9 63.5Panama (2003) 144.3 121.6 109.8 96.3 96.2
Bolivia (2000) 86.0 109.9 105.8 99.9 98.5
Excise TaxesCosta Rica (2000) 70.8 83.9 90.0 105.9 104.7El Salvador (2000) 188.8 127.0 129.7 98.8 85.2Guatemala (2004) 104.1 95.5 87.5 97.0 104.1Honduras (2004) 192.2 178.2 181.0 131.1 53.7Nicaragua (2004) 269.9 198.2 158.7 112.1 66.4Panama (2003) 120.3 121.1 102.3 96.5 98.1
Bolivia (2000) 86.0 109.9 105.8 99.9 98.5US (Federal, 2004) 274.4 169.9 130.7 104.6 65.3
Trade TaxesCosta Rica (2000) 129.8 140.5 131.2 118.5 77.6El Salvador (2000) 258.6 157.8 124.9 105.5 75.8Guatemala (2004) 53.6 54.7 65.0 84.5 122.8Honduras (2004) 282.8 164.1 133.9 109.6 69.3Nicaragua (2004) 172.9 144.6 131.2 116.5 81.3Panama (2003) 216.0 161.4 135.0 108.6 82.2
Sources: Acevedo and González Orellana (2005); Auguste and Artana (2005); Barreix et al. (2006); Bolaños (2002); Gillingham et al. (2007); Gómez Sabaini (2005b); Cossío Muñoz (2006); Rodríguez Arosemena (2007); U.S. Congressional Budget Office (2006); EUROMOD.
1/ Effective tax/income ratio relative to the average ratio; a value greater than 100 indicates that the income group pays a higher percentage of its income relative to the average.
Table A2. Progression of Taxes in Central America and Comparator CountriesRelative Tax Burden by Income Quintile 1/

38
Gini pre-tax Quasi-Gini Kakwani Tax Quasi-Gini RS income for taxes Index pressure 1/ post-tax Index 2/
(A) (B) (C = B - A) (D) (E = A - D)
Income TaxesCosta Rica (2000) 45.1 48.1 3.0 9.6 44.8 0.3El Salvador (2000) 47.4 56.3 8.9 1.3 47.3 0.1Guatemala (2004) 46.3 50.4 4.1 3.7 46.2 0.2Honduras (2004) 47.2 61.6 14.4 4.9 46.4 0.7Nicaragua (2000) 51.0 58.6 7.6 4.5 50.7 0.4Panama (2003) 53.8 73.9 20.1 2.1 53.4 0.4
Colombia (2003) 53.7 89.4 35.7 1.4 51.3 2.4Ecuador (2003) 40.8 83.1 42.3 0.7 40.3 0.5Peru (2000) 53.5 58.2 4.7 1.4 53.5 0.0Venezuela (2003) 42.3 84.0 41.7 0.4 42.1 0.2US (Federal, 2004) 3/ 43.8 59.9 16.1 19.0 40.0 3.8US (Federal, 2004) 4/ 43.8 75.5 31.7 11.1 39.8 4.0
VAT/Sales TaxesCosta Rica (2000) 45.1 42.9 -2.2 5.1 45.3 -0.2El Salvador (2000) 47.4 25.3 -22.1 5.4 48.7 -1.3Guatemala (2004) 46.3 39.1 -7.2 8.2 47.0 -0.6Honduras (2004) 47.2 31.3 -15.9 7.0 48.4 -1.2Nicaragua (2000) 51.0 27.8 -23.2 11.1 53.9 -2.9Panama (2003) 53.8 50.5 -3.3 1.9 53.9 -0.1
Bolivia (2000) 55.6 54.7 -0.9 5.6 55.7 -0.1Colombia (2003) 53.7 46.9 -6.8 6.3 54.1 -0.4Ecuador (2003) 40.8 44.5 3.7 6.4 40.6 0.2Peru (2000) 53.5 35.8 -17.7 4.9 54.7 -1.2Venezuela (2003) 42.3 47.3 5.0 4.7 42.7 -0.4
Excise TaxesCosta Rica (2000) 45.1 49.3 4.2 2.6 45.0 0.1El Salvador (2000) 47.4 37.9 -9.5 0.5 47.5 0.0Guatemala (2004) 46.3 47.9 1.6 2.0 46.3 0.0Honduras (2004) 47.2 24.4 -22.8 0.8 47.4 -0.2Nicaragua (2000) 51.0 27.5 -23.6 7.3 52.9 -1.9Panama (2003) 53.8 51.8 -2.0 1.3 53.8 0.0
Bolivia (2000) 55.6 85.3 29.7 1.8 55.5 0.1US (Federal, 2004) 43.8 21.3 -22.5 0.8 44.0 -0.2
Trade TaxesCosta Rica (2000) 45.1 34.4 -10.7 1.1 45.3 -0.2El Salvador (2000) 47.4 31.8 -15.7 0.9 47.6 -0.2Guatemala (2004) 46.3 58.3 12.0 3.2 45.9 0.4Honduras (2004) 47.2 27.7 -19.5 1.8 47.5 -0.4Nicaragua (2000) 51.0 39.5 -11.6 2.4 51.3 -0.3Panama (2003) 53.8 42.6 -11.2 1.1 53.9 -0.1
Sources: Acevedo and González Orellana (2005); Auguste and Artana (2005); Barreix et al. (2006); Bolaños (2002); Gillingham et al. (2007); Gómez Sabaini (2005b); Cossío Muñoz (2006); Rodríguez Arosemena (2007); U.S. Congressional Budget Office (2006); EUROMOD.
1/ Tax pressure is the ratio of total taxes paid to total income before taxes.2/ RS is the Reynolds-Smolensky Index.3/ Including social security taxes.4/ Excluding social security taxes.
Table A3. Redistributive Impact of Taxation in Central America and Comparator Countries
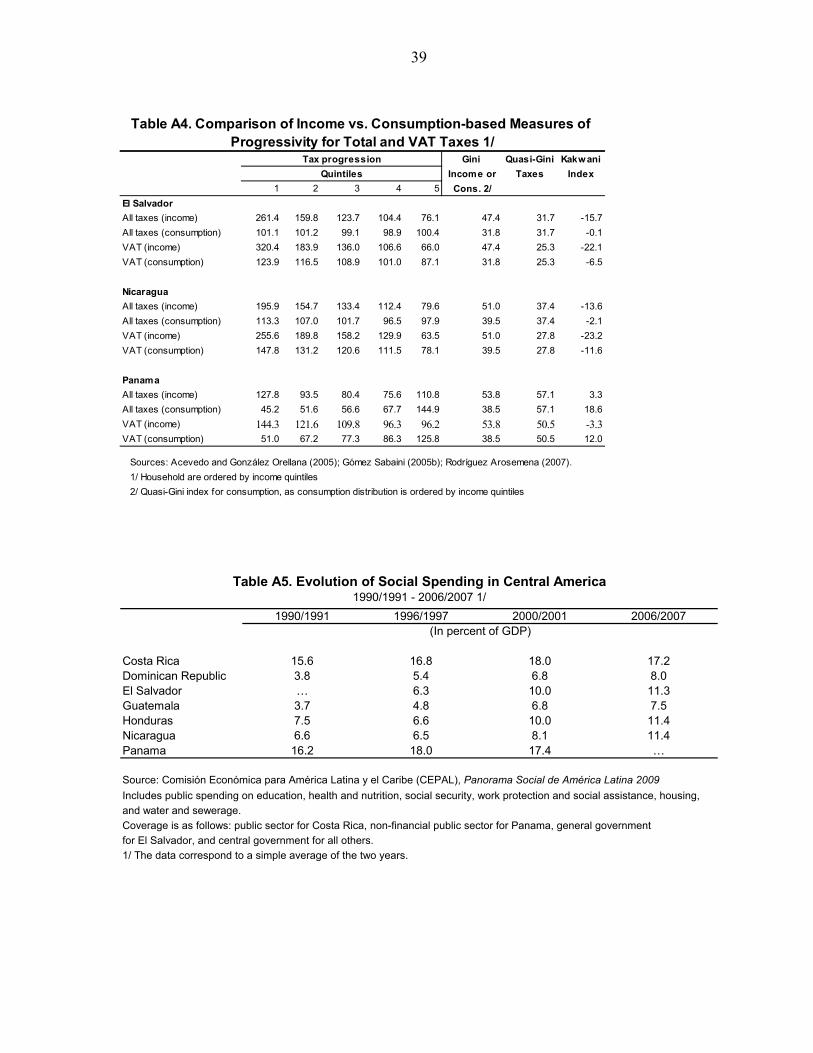
39
Gini Quasi-Gini Kakwani
Income or Taxes Index
1 2 3 4 5 Cons. 2/
El Salvador
All taxes (income) 261.4 159.8 123.7 104.4 76.1 47.4 31.7 -15.7
All taxes (consumption) 101.1 101.2 99.1 98.9 100.4 31.8 31.7 -0.1
VAT (income) 320.4 183.9 136.0 106.6 66.0 47.4 25.3 -22.1
VAT (consumption) 123.9 116.5 108.9 101.0 87.1 31.8 25.3 -6.5
Nicaragua
All taxes (income) 195.9 154.7 133.4 112.4 79.6 51.0 37.4 -13.6
All taxes (consumption) 113.3 107.0 101.7 96.5 97.9 39.5 37.4 -2.1
VAT (income) 255.6 189.8 158.2 129.9 63.5 51.0 27.8 -23.2
VAT (consumption) 147.8 131.2 120.6 111.5 78.1 39.5 27.8 -11.6
Panama
All taxes (income) 127.8 93.5 80.4 75.6 110.8 53.8 57.1 3.3
All taxes (consumption) 45.2 51.6 56.6 67.7 144.9 38.5 57.1 18.6
VAT (income) 144.3 121.6 109.8 96.3 96.2 53.8 50.5 -3.3VAT (consumption) 51.0 67.2 77.3 86.3 125.8 38.5 50.5 12.0
Sources: Acevedo and González Orellana (2005); Gómez Sabaini (2005b); Rodríguez Arosemena (2007).
1/ Household are ordered by income quintiles
2/ Quasi-Gini index for consumption, as consumption distribution is ordered by income quintiles
Tax progression
Quintiles
Table A4. Comparison of Income vs. Consumption-based Measures of Progressivity for Total and VAT Taxes 1/
1990/1991 1996/1997 2000/2001 2006/2007
Costa Rica 15.6 16.8 18.0 17.2Dominican Republic 3.8 5.4 6.8 8.0El Salvador … 6.3 10.0 11.3Guatemala 3.7 4.8 6.8 7.5Honduras 7.5 6.6 10.0 11.4Nicaragua 6.6 6.5 8.1 11.4Panama 16.2 18.0 17.4 …
Source: Comisión Económica para América Latina y el Caribe (CEPAL), Panorama Social de América Latina 2009
Includes public spending on education, health and nutrition, social security, work protection and social assistance, housing,
and water and sewerage.
Coverage is as follows: public sector for Costa Rica, non-financial public sector for Panama, general government
for El Salvador, and central government for all others.
1/ The data correspond to a simple average of the two years.
(In percent of GDP)
Table A5. Evolution of Social Spending in Central America1990/1991 - 2006/2007 1/

40
References Acevedo, Carlos, and Mauricio González Orellana, 2005, “El Salvador: Diagnóstico del
Sistema Tributario y Recomendaciones de Política,” in Recaudar Para Crecer: Bases para la Reforma Tributaria en Centroamérica, ed. by Manuel Agosin, Alberto Barreix y Roberto Machado (Washington: Inter-American Development Bank).
Auguste, Sebastián, and Daniel Artana, 2005, “Guatemala: Impacto Distributivo de la Reforma Fiscal 2004 y de Algunas Propuestas Recientes” (unpublished; Guatemala: Centro de Investigaciones Económicas Nacionales).
Barreix, Alberto, Jerónimo Roca, and Luiz Villela, 2006, “La Equidad Fiscal en los Países Andinos” (Washington: Inter-American Development Bank).
Barthold, Thomas, 1993, “How Should We Measure Distribution?” National Tax Journal, Vol. 46 (September), pp. 291–99.
Bird, Richard, 2003, “Taxation in Latin America: Reflections on Sustainability and the Balance between Equity and Efficiency,” ITP Paper No. 0306 (Toronto, Canada: University of Toronto, Rotman School of Management, International Tax Program). Available via the Internet: www.rotman.utoronto.ca/iib/ITP0306.pdf
Bolaños, Rodrigo, 2002, “Eficiencia y Equidad en el Sistema Tributario Costarricense,” in El Sistema Tributario Costarricense: Contribuciones al Debate Nacional (San José, Costa Rica: Contraloría General de la República).
Chu, Ke-young, Hamid Davoodi, and Sanjeev Gupta, 2000, “Income Distribution and Tax and Government Social Spending Policies in Developing Countries,” IMF Working Paper 00/62 (Washington: International Monetary Fund).
Cossío Muñoz, Fernando, 2006, “Informe de Equidad Fiscal de Bolivia: Incidencia Distributiva de la Política Fiscal”, in La Equidad Fiscal en los Países Andinos, ed. by Alberto Barreix, Jerónimo Roca and Luiz Villela (Lima: DFID-BID-CAN).
Cubero, Rodrigo, and Ivanna Vladkova Hollar, 2008, “Equity and Fiscal Policy: Income Distribution Effects of Taxation and Social Spending in Central America”, in Central America: Economic Progress and Reforms, ed. by Dominique Desruelle and Alfred Schipke (Washington: International Monetary Fund).
Cullis, John, and Philip Jones, 1998, Public Finance and Public Choice (Oxford: Oxford University Press, 2nd ed.).
Economic Commission for Latin America and the Caribbean (ECLAC), 2006, “Social Spending in Latin America and the Caribbean: Recent Trends, Orientation, and Redistributive Impact,” in Social Panorama of Latin America 2005 (New York: United Nations).
Engel, Eduardo, Alexander Galetovic, and Claudio Raddatz, 1999, “Taxes and Income Distribution in Chile: Some Unpleasant Redistributive Arithmetic,” Journal of Development Economics, Vol. 59 (June), pp. 155–92.

41
EUROMOD, “Statistics on Distribution and Decomposition of Disposable Income,” accessed at www.econ.cam.ac.uk/dae/mu/emodstats/ on April 30, 2007 using EUROMOD Version No. 31A.
Fullerton, D., and D.L. Rogers, 1993, “Who Bears the Lifetime Tax Burden?” (Washington: Brookings Institution Press).
Gasparini, Leonardo, and Daniel Artana, 2003, “La Incidencia Distributiva de la Ley de Equidad Fiscal de Nicaragua” (Washington: World Bank).
Gemmell, Norman, and Oliver Morrissey, 2002, “The Impact of Taxation on Inequality and Poverty: A Review of Empirical Methods and Evidence,” paper presented at the World Bank/Department for International Development conference on “Taxation, Accountability and the Poor,” University of Sussex, Brighton, United Kingdom, October–November.
———, 2005, “Distribution and Poverty Impacts of Tax Structure Reform in Developing Countries: How Little We Know,” Development Policy Review, Vol. 23 (March), pp. 131–44.
Gillingham, Robert, David Newhouse, and Irene Yakovlev (2008), “The Distributional Impact of Fiscal Policy in Honduras,” IMF Working Paper No. 08/168 (Washington: International Monetary Fund).
Gómez Sabaini, Juan Carlos, 2005a, “Honduras: Hacia un Sistema Tributario Más Transparente y Diversificado,” in Recaudar Para Crecer: Bases para la Reforma Tributaria en Centroamérica, ed. by Manuel Agosin, Alberto Barreix y Roberto Machado (Washington: Inter-American Development Bank).
———, 2005b, “Nicaragua: Desafíos para la Modernización del Sistema Tributario,” in Recaudar Para Crecer: Bases para la Reforma Tributaria en Centroamérica, ed. by Manuel Agosín Alberto Barreix y Roberto Machado (Washington: Inter-American Development Bank).
Harberger, Arnold C., 2003, “Reflections on Distributional Considerations and the Public Finances,” paper prepared for a course on “Practical Issues of Tax Policy in Developing Countries,” World Bank, Washington, April. Available via the Internet: http://isp-aysps.gsu.edu/academics/conferences/conf2004/Harberger.pdf
Inter-American Development Bank (IDB), 1998, Facing Up to Inequality in Latin America, Report on Economic and Social Progress in Latin America, 1998–1999 (Washington).
Jenkins, Glenn, Hatice Jenkins, and Chun-Yan Kuo, 2006, “Is the Value Added Tax Naturally Progressive?” Queens Department of Economics Working Paper No. 1059 (Kingston, Canada: Queen’s University).
Lindert, Kathy, Emmanuel Skoufias, and Joseph Shapiro, 2006, “Redistributing Income to the Poor and the Rich: Public Transfers in Latin America and the Caribbean,” Social Protection Discussion Paper No. 0605, Social Safety Net Primer Series (Washington: World Bank).
Lora, Eduardo, 2007, “Trends and Outcomes of Tax Reform,” in The State of State Reform in Latin America, ed. by E. Lora (Washington: Inter-American Development Bank).

42
Mann, Arthur J., 2002, “Guatemala: La Incidencia del Sistema Tributario en el Año 2001,” a report for USAID/DAI, November.
Metcalf, G., 1994, “Life Cycle Versus Annual Perspectives on the Incidence of a Value-Added Tax,” in Tax Policy and the Economy, ed. by James Poterba (Boston: MIT Press).
Mintz, Jack, 1996, “The Corporation Tax,” in The Economics of Tax Policy, ed. by Michael P. Devereux (Oxford: Oxford University Press).
Muñoz, Sònia, and Stanley Sang-Wook Cho, 2004, “Social Impact of a Tax Reform: The Case of Ethiopia,” in Helping Countries Develop: The Role of Fiscal Policy, ed. by Sanjeev Gupta, Benedict Clements, and Gabriela Inchauste (Washington: International Monetary Fund).
Pechman, J.A., 1985, Who Paid the Taxes, 1966–1985? (Washington: Brookings Institution).
Petrei, Humberto, and Nicolás Rodríguez Arosemena, 2006, “Panamá: Creación de Capital Social por Medio de la Reforma Fiscal” (Washington: Inter-American Development Bank).
Poterba, J., 1989, “Lifetime Incidence and the Distributional Burden of Excise Taxes,” American Economic Review, Papers and Proceedings, Vol. 79 (May), pp. 325–30.
Rodríguez Arosemena, Nicolás, 2008, “Incidencia de la Política Fiscal en Panamá” (Washington: Inter-American Development Bank, forthcoming).
Sahn, David, and Stephen Younger, 1999, “Fiscal Incidence in Africa: Microeconomic Evidence,” CFNPP Working Paper No. 91 (Ithaca, New York: Cornell University, Cornell Food and Nutrition Policy Program). Available via the Internet: www.cfnpp.cornell.edu/images/wp91.pdf
Santana, Isidoro, and Magdalena Rathe, 1993, “The Distributive Impact of Fiscal Policy in the Dominican Republic,” in Government Spending and Income Distribution in Latin America, ed. by Ricardo Hausmann and Roberto Rigobón (Washington: Inter-American Development Bank).
Schenone, Osvaldo, and Carlos de la Torre, 2003, “Guatemala: Fortalecimiento de la Estructura Tributaria” (Washington: Inter-American Development Bank)
Shah, A., and J. Whalley, 1991, “The Redistributive Impact of Taxation in Developing Countries,” in Tax Policy in Developing Countries, ed. by J. Khalilzadeh-Shirazi and A. Shah (Washington: World Bank).
U.S. Congressional Budget Office, 2006, “Historical Effective Federal Tax Rates: 1979 to 2004” (Washington). Available via the Internet: www.cbo.gov/ftpdocs/77xx/doc7718/EffectiveTaxRates.pdf
World Bank, 2003, “Guatemala: Poverty Assessment,” Report No. 24221-GU (Washington).