epoxy composite reinforced with nano and micro sic particles: curing kinetics and mechanical...
TRANSCRIPT

This article was downloaded by: [Mount Allison University 0Libraries]On: 23 August 2014, At: 02:13Publisher: Taylor & FrancisInforma Ltd Registered in England and Wales Registered Number: 1072954 Registeredoffice: Mortimer House, 37-41 Mortimer Street, London W1T 3JH, UK
The Journal of AdhesionPublication details, including instructions for authors andsubscription information:http://www.tandfonline.com/loi/gadh20
Epoxy Composite Reinforced with Nanoand Micro SiC Particles: Curing Kineticsand Mechanical PropertiesJ. Abenojar a , M. A. Martínez a , M. Pantoja a , F. Velasco a & J. C.Del Real ba Materials Science and Engineering Department , Universidad CarlosIII de Madrid , Leganés , Spainb Mechanics Engineering Department , Universidad PontificiaComillas , Madrid , SpainPublished online: 25 Apr 2012.
To cite this article: J. Abenojar , M. A. Martínez , M. Pantoja , F. Velasco & J. C. Del Real (2012)Epoxy Composite Reinforced with Nano and Micro SiC Particles: Curing Kinetics and MechanicalProperties, The Journal of Adhesion, 88:4-6, 418-434, DOI: 10.1080/00218464.2012.660396
To link to this article: http://dx.doi.org/10.1080/00218464.2012.660396
PLEASE SCROLL DOWN FOR ARTICLE
Taylor & Francis makes every effort to ensure the accuracy of all the information (the“Content”) contained in the publications on our platform. However, Taylor & Francis,our agents, and our licensors make no representations or warranties whatsoever as tothe accuracy, completeness, or suitability for any purpose of the Content. Any opinionsand views expressed in this publication are the opinions and views of the authors,and are not the views of or endorsed by Taylor & Francis. The accuracy of the Contentshould not be relied upon and should be independently verified with primary sourcesof information. Taylor and Francis shall not be liable for any losses, actions, claims,proceedings, demands, costs, expenses, damages, and other liabilities whatsoever orhowsoever caused arising directly or indirectly in connection with, in relation to or arisingout of the use of the Content.
This article may be used for research, teaching, and private study purposes. Anysubstantial or systematic reproduction, redistribution, reselling, loan, sub-licensing,systematic supply, or distribution in any form to anyone is expressly forbidden. Terms &Conditions of access and use can be found at http://www.tandfonline.com/page/terms-and-conditions

Epoxy Composite Reinforced with Nanoand Micro SiC Particles: Curing Kinetics
and Mechanical Properties
J. ABENOJAR1, M. A. MARTINEZ1, M. PANTOJA1,F. VELASCO1, and J. C. DEL REAL2
1Materials Science and Engineering Department,
Universidad Carlos III de Madrid, Leganes, Spain2Mechanics Engineering Department, Universidad Pontificia Comillas,
Madrid, Spain
Epoxy-based composite materials reinforced with hard particlescan be used as anti-wear coatings. In this study, a commercialbicomponent resin was used, with 6 and 12% SiC particles intwo different particle sizes (nano and 10 mm). The epoxy curingprocess was studied by Fourier transform infrared spectroscopy(FTIR), differential scanning calorimetry (DSC) and confocalmicroscopy. Dynamic mechanical thermal analysis (DMTA) testsevaluated the influence of particle additions on the glass transitiontemperature (Tg). In addition, mechanical properties (hardnessand bending strength) and wear resistance were evaluated. Theaddition of nanometric particles reduced the reaction order. Ahigher amount of particles decreased Tg due to the lower numberof crosslinking points. The agglomeration of nano particles led tonon-uniform mechanical properties. 6% nano particle additiondramatically improved wear resistance and decreased the frictioncoefficient.
KEYWORDS Cure behavior; Mechanical properties; Siliconcarbide; Thermosetting resin
Received 7 July 2011; in final form 17 November 2011.Presented in part at the 1st International Conference on Structural Adhesive Bonding
(AB2011), Porto, Portugal, 7–8 July 2011.Address correspondence to J. Abenojar, Materials Science and Engineering Department,
Universidad Carlos III de Madrid, 28911 Leganes, Spain. E-mail: [email protected]
The Journal of Adhesion, 88:418–434, 2012
Copyright # Taylor & Francis Group, LLC
ISSN: 0021-8464 print=1545-5823 online
DOI: 10.1080/00218464.2012.660396
418
Dow
nloa
ded
by [
Mou
nt A
lliso
n U
nive
rsity
0L
ibra
ries
] at
02:
13 2
3 A
ugus
t 201
4

1. INTRODUCTION
Epoxy resins reinforced with nanoparticles are under study. They can be usedas adhesives and coatings. Resin properties can be altered through theaddition of different types of fillers. The ’s electromagnetic properties [1]. Silicananoparticle addition increases impact resistance and Young’s modulus, andmodifies the curing process. Those properties strongly relate to curing-process development [2–4], and provide thixotropy and pseudoplasticity[5,6]. Silicates [7,8] or nanoclays [9] have also been evaluated, but carbonnanotubes stand out [10].
The influence of curing conditions (time and temperature) on epoxyresins shows that most in-service problems in these systems are related toincomplete resin curing, which increases resin sensibility to different chemicalagents and the ultraviolet light [11].
Silicon carbide is one of the most widely used materials for wear applica-tions. SiC is used to manufacture wear-bearing composite materials in somecompanies such as Commodore Environmental Services (New York, NY,USA) and Improved Materials Strategies Inc. (Houston, TX, USA) [12,13]. NoSiC particle size is specified and no scientific or technical documentation onthe mechanical and physical properties and service behaviour is provided.However, similar materials have been used as structural components.Nanosized SiC particles (usually, up to 3% by wt.) have been introduced into epoxy matrixes to improve their mechanical properties [14,15], wear behav-iour [16,17], or thermal properties [18,19]. Whiskers [20,21] or nanowires [22]have also been used with the same aims. In any of those researches, a com-parison between nano and micro particles is found. All those aspects justifythe present work. This study is aimed at analyzing the effects of the additionof two different SiC particles with different particle size (micro and nano) to anepoxy resin and their impact on the composite’s curing process (carried outby infrared spectroscopy, differential scanning calorimetry, and confocalmicroscopy). Moreover, the mechanical properties (dynamic mechanicalthermal analysis, hardness, three-point bending) and wear resistance ofmanufactured materials were studied.
2. EXPERIMENTAL
2.1. Materials
The epoxy resin used was a standard diglycidyl ether of bisphenol A, EpoferEX 401, and the hardener was Epofer 432, both provided by Feroca Compo-sites (Madrid, Spain). This resin is a two-component epoxy which cures atroom temperature—between 25 and 30�C. Silicon carbide comes from differ-ent companies depending on particle size. 10-mm particles were providedby Carburos Navarro S.A. (Cuenca, Spain). Figure 1 (left) shows the polygonal
Nano and Micro SiC Particles Reinforced Composites 419
Dow
nloa
ded
by [
Mou
nt A
lliso
n U
nive
rsity
0L
ibra
ries
] at
02:
13 2
3 A
ugus
t 201
4

morphology of the 10-mm particles. Nanometric SiC was provided by BiokerResearch S.L. (Oviedo, Spain). The micrograph at the right side (Fig. 1) showsa rather variable distribution (particles up to 50 nm and particles of approx.150 nm).
The composite was obtained by mixing the resin and the carbide with amechanical stirrer (Turbotest, vmi Rayneri, Montaigu Cedex, France) for 5minat 3000 rpm, as the use of ultrasonic does not promote adequate homogeneityin the mix. The hardener was subsequently added in a 100=32wt. ratio andstirred for 1min.
2.2. Experimental Techniques
2.2.1. INFRARED SPECTROSCOPY (IR)
The materials’ curing kinetics and degree of conversion were monitored witha Bruker Vector 22 (Ettlingen, Germany) infrared spectrometer equippedwith Fourier transfor analysis. The FTIR spectra of the composites used in thisstudy were obtained by means of ‘‘transmission in film,’’ depositing a smalldrop of the materials on a potassium bromide (KBr) window and carefullyspreading it with a spatula so as to obtain a thin film. They were then placedon the sample holder of the spectrometer in such a way that the IR beamcrossed it perpendicularly. A total number of 60 scans were carried out foreach measurement with 4 cm�1 resolution.
Consecutive infrared spectroscopy spectra were measured to monitorthe curing kinetics of the epoxy resin-hardener mixture. Measurements werecarried out every 15min for 15 h. To quantify the curing kinetics and degree ofconversion (a) of the filled epoxy according to time (t), the ratio of the areas ofthe bands at 1035 cm�1 (characteristic of C-H stretching in the aromatic ringof the bisphenol, Abs 1035 cm�1) and 915 cm�1 (characteristic of the oxiranegroup in the epoxy ring, Abs 915 cm�1) were chosen [Eq. (1)]. The curingprocess resulted in the disappearance of oxirane at 915 cm�1, so it was used
FIGURE 1 Micrographs of SiC particles, 10mm (left) and nanometric particles (right).
420 J. Abenojar et al.
Dow
nloa
ded
by [
Mou
nt A
lliso
n U
nive
rsity
0L
ibra
ries
] at
02:
13 2
3 A
ugus
t 201
4

to quantify the degree of conversion. The band of the aromatic ring of thebisphenol at 1035 cm�1 was not affected by the curing reaction and was usedas a reference.
a ¼ 1�
Abs915 cm�1
Abs1035 cm�1
� �t
Abs915 cm�1
Abs1035 cm�1
� �t¼0
ð1Þ
2.2.2. DIFFERENTIAL SCANNING CALORIMETRY (DSC)
DSC was used to evaluate the degree of conversion in all materials. Anisothermal cycle at 25�C for 3 h was carried out, followed with a dynamiccycle between 25 and 200�C at a heating rate of 5�C=min to obtain the totalenthalpy required for adhesive polymerization (DHtotal). The equipmentused was a DSC822 Mettler Toledo (L’Hospitalet de Llobregat, Spain), usingnitrogen (80ml=min) as a purge gas.
The degree of polymerization can be calculated for a time t, accordingto Eq. (2):
a ¼ DHt
DHtotal: ð2Þ
The Kamal method [23] [Eq. (3)], which includes the influence of bothreaction products on the reaction rate and the non-autocatalytic polymeriza-tion process, was followed for reaction-kinetics calculation [24]:
dadt
¼ ðk1 þ k2amÞð1� aÞn; ð3Þ
where k1 and k2 are rate constants (corresponding to an n-order reaction andthe autocatalytic reaction, respectively), and m and n stand for the adjustableparameters which represent reaction orders.
2.2.3. CONFOCAL MICROSCOPY
Composite curing was also monitored by confocal microscopy. The confocallaser microscope used was a DM IRBE2 microscope (LEICA, Deerfield, IL,USA). To follow the curing process of the epoxy in the composite, fluor-escein was added to render fluorescence. Pictures were taken every 3minfor an 30min and every 15min for additional 60min.
2.2.4. DYNAMIC MECHANICAL THERMAL ANALYSIS (DMTA)
Dynamic mechanical measurements are aimed at determining the variation ofcertain properties such as glass transition temperature, crystallinity, polymer
Nano and Micro SiC Particles Reinforced Composites 421
Dow
nloa
ded
by [
Mou
nt A
lliso
n U
nive
rsity
0L
ibra
ries
] at
02:
13 2
3 A
ugus
t 201
4

crosslinking degree and the storage modulus. Storage modulus (E 0) measuresthe energy stored during a sinusoidal cycle. The loss factor [tan d, Eq. (4)] isdefined as the ratio between the loss modulus (E00) and the storage modulusper cycle, and corresponds to the tangent of the phase angle:
tan d ¼ E 0=E 0 ð4Þ
Dynamic mechanical measurements were carried out with RheometricScientific DMTA Mk III equipment (TA Instruments, New Castle, Delaware,USA) using a 0–140�C temperature range at a frequency of 1Hz and a heatingrate of 5�C=min. Rectangular test samples of approx. 30� 12.5� 2mm3 wereused. A pre-established displacement of� 32mm was used in all samplesusing a bending mode in simple cantilever. The apparatus included a 2-mmfree-length frame in which the sample was clamped while subjected to sinus-oidal movement. The clamping method was always the same: tightening thebolts with a coupling torque of 10N �m. All tests were completed with drynitrogen to ensure that no moisture remained inside the apparatus.
2.2.5. MECHANICAL PROPERTIES
Dry wear tests were carried out at room temperature using a pin-on-disktribometer (Microtest, Madrid, Spain). A 6-mm diameter alumina ball was usedfor the pin. Test conditions were 180 rpm, with an applied load of 15N, andrelative humidity below 30%. The sliding distance was 1000m.Wear was eval-uated by volume loss. Mechanical strength of materials was evaluatedby means of three-point bending tests using a universal testing machine(Microtest, Madrid, Spain) with 1mm=min load rate. Hardness was assessedwith Shore D measurements (Baxlo, Polinya, Barcelona, Spain). Afterwards,specimen fracture surfaces were studied by SEM (Philips X-30, PhilipsElectronic Instruments, Mahwah, NJ, USA) and transmission electronicmicroscopy (TEM) (model JEM-2010, Jeol Europe, Croissy-sur-Seine, France).
3. RESULTS AND ANALYSIS
3.1. Infrared Spectroscopy (IR)
Figure 2a shows the IR spectrum corresponding to the epoxy resin beforecuring. The assignment of bands is shown in Table 1, being consistent withthe structure: bands corresponding to the absorbance of aromatic groupsand aliphatic chains were observed [25]. Hence, it is a diglycidyl ether ofbisphenol A (DGEBA)-based epoxy resin.
The hardener (Epofer 432) was also characterized with IR spectroscopyin the transmission mode. The obtained spectra can be observed in Fig. 2band Table 1 shows the assignment of the most relevant bands. The spectrum
422 J. Abenojar et al.
Dow
nloa
ded
by [
Mou
nt A
lliso
n U
nive
rsity
0L
ibra
ries
] at
02:
13 2
3 A
ugus
t 201
4
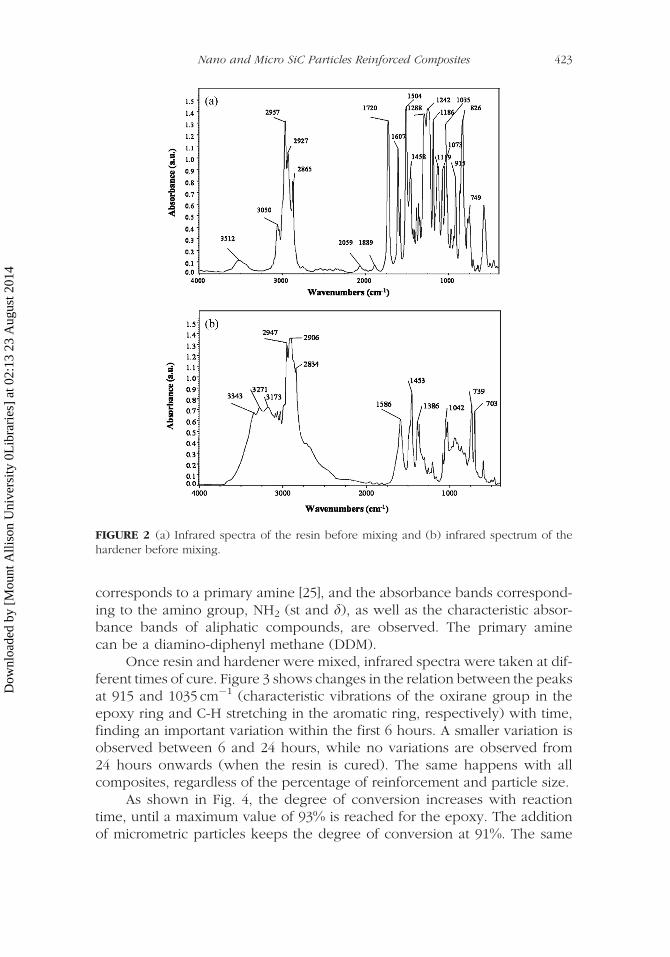
corresponds to a primary amine [25], and the absorbance bands correspond-ing to the amino group, NH2 (st and d), as well as the characteristic absor-bance bands of aliphatic compounds, are observed. The primary aminecan be a diamino-diphenyl methane (DDM).
Once resin and hardener were mixed, infrared spectra were taken at dif-ferent times of cure. Figure 3 shows changes in the relation between the peaksat 915 and 1035 cm�1 (characteristic vibrations of the oxirane group in theepoxy ring and C-H stretching in the aromatic ring, respectively) with time,finding an important variation within the first 6 hours. A smaller variation isobserved between 6 and 24 hours, while no variations are observed from24 hours onwards (when the resin is cured). The same happens with allcomposites, regardless of the percentage of reinforcement and particle size.
As shown in Fig. 4, the degree of conversion increases with reactiontime, until a maximum value of 93% is reached for the epoxy. The additionof micrometric particles keeps the degree of conversion at 91%. The same
FIGURE 2 (a) Infrared spectra of the resin before mixing and (b) infrared spectrum of thehardener before mixing.
Nano and Micro SiC Particles Reinforced Composites 423
Dow
nloa
ded
by [
Mou
nt A
lliso
n U
nive
rsity
0L
ibra
ries
] at
02:
13 2
3 A
ugus
t 201
4

FIGURE 3 IR spectra time evolution for the studied adhesive. (Color figure available online.)
TABLE 1 Characteristic Bands of the Studied Resin and Hardener [17]
Wavenumbers (cm�1) Assignation
Resin 3512 -OH st3050 ArC-H st, C-H st oxirane2957–2927–2865 -CH3, -CH2- st2059–1889 ArC-C armonics1720 C=O st1607 ArC-C1504 ArC-C1458 -CH3 d as, -CH2- d1288 C-O-C st as, oxirane1242 ArC-O-C-al st as1186 ArC-H d ip1119 C-OH st1073 ArC-H d ip1035 ArC-O-C-al st s915 C-O-C st s, oxirane826 ArC-H d oop749 -CH2 c, for C-(CH2)n-C n< 4
Hardener 3343–3271 NH2 st3173 Fermi resonance N-H group2947–2906–2834 -CH3, -CH2- st1586 NH2 d1453 -CH3 d as, -CH2- d1386 -CH3 d s1042 C-N st739–703 NH2 d
st: stretching, Ar: aromatic, d: bending, s: symmetric, as: asymmetric, al: aliphatic, ip:
in plane, oop: out of plane bending, c: skeleton vibrations, n: number of CH2 groups.
424 J. Abenojar et al.
Dow
nloa
ded
by [
Mou
nt A
lliso
n U
nive
rsity
0L
ibra
ries
] at
02:
13 2
3 A
ugus
t 201
4

behaviour is found for 6% nanometric particles. Therefore, properties of thecomposites are more similar to those of the epoxy resin. However, for 12%nanometric additions, this degree of conversion decreases to 77%.
Although the degrees of conversion are equal for almost all materials,the beginning of the reaction is not identical. The beginning of cure is fasterwhen SiC is added in any ratio and particle size. The neat-resin curing pro-cess begins approximately between the 15 and 20min, whereas compositesbegin to cure in less than 5min, thus diminishing pot life considerably.
As nano-particles have high surface area, the addition of 12% of nano-particles prevents crosslinking (due to a steric effect) and reduces the curingprocess. Somewhat of a similar phenomen on occurs with 12% micrometricSiC, although a slight increase (from 85 to 91%) is observed in this case dueto lower specific volume (see Fig. 4). 6% micrometric initially increasesthe reaction rate, as these particles may catalyze the reaction. This could berelated to a closer packing of monomers, hence, favouring the opening ofthe oxirane ring. Afterwards follows a similar behaviour to the neat resin. Inthis case, when the catalytic effect of the particles disappears, the increasein the conversion degree is similar to the epoxy resin. However, the com-posite with 6% nanometric particles reaches 90% after 7 h and, from thismoment onwards, the polymerization reaction does not advance. This curingprocess is the fastest in all studied composites.
3.2. Differential Scanning Calorimetry (DSC)
Figure 5 shows the variation in the degree of conversion (through DSC andFTIR) after 3 h at 25�C. As previously explained, SiC addition affects the curing
FIGURE 4 Evolution of the degree of conversion for the studied materials by FTIR as a func-tion of time until 24 h.
Nano and Micro SiC Particles Reinforced Composites 425
Dow
nloa
ded
by [
Mou
nt A
lliso
n U
nive
rsity
0L
ibra
ries
] at
02:
13 2
3 A
ugus
t 201
4

degree, particle size producing opposite effects within the test time. Thisvariation is also related to particle percentage. The value of the degree of con-version for both methods is the same when the neat resin or the microparticle-filled resin are considered. The addition of microparticles increases theconversion degree and higher amounts of particles stimulate and increasethe curing reaction rate. DSC and FTIR results disagree for nanoparticle addi-tions. According to the FTIR results, these particles seem to present a catalyticeffect in crosslinking, as the degree of conversion (during the first 3 h) ishigher than in the neat resin. However, they interfere with the completecuring of the resin at longer times (24 h, Fig. 4). This catalytic effect will bechecked with the reaction kinetics (Table 2). DSC conversion degree resultswithin these 3 h are lower than with FTIR because they are calculated usingthe heat signal. As nanoparticles have a high surface to volume ratio, theamount of resin tested is lower than in microparticle-filled resin, and, hence,the heat signal presents a higher error.
To calculate the kinetic parameters, the Kamal equation [Eq. (3)] wasapplied. The obtained data are shown in Table 2 for all materials. When thesedata are analyzed, the reaction order is similar for all materials except 6%nanoparticles, where a dramatic increase is found. The correlation (R2) issimilar in all curves, except for the epoxy filled with 6% nanometric particles,where R2 is lower. Additionally, k2 is larger than k1. Hence, the autocatalyticreaction is faster than the n-order one. The reaction order is approximatelybetween 2 and 3 in all mateials.
The application of the autocatalytic part of the equation alone is alsoshown in Table 2. The R2 of the autocatalytic process of microparticle-filledresins is rather low. Therefore, a meaningful contribution of the n-order part
FIGURE 5 Variation of the degree of conversion related to the percentage and SiC addition,obtained by DSC and FTIR at 180min.
426 J. Abenojar et al.
Dow
nloa
ded
by [
Mou
nt A
lliso
n U
nive
rsity
0L
ibra
ries
] at
02:
13 2
3 A
ugus
t 201
4

of the reaction can be expected. However, the contribution of the n-orderpart to the reaction rate in case of nanoparticle-filled materials is not soimportant, especially for 6% additions, where they contribute to the autoca-talytic process (together with OH groups).
3.3. Confocal Microscopy
Confocal microscopy results are shown in Fig. 6. The neat resin shows somesort of agglomerates that must be fillers used by the manufacturer to improveresin properties (Fig. 6a). When nanometric particles are added, uniform par-ticle distribution can be observed at the beginning (Fig. 6b and c). However,particles progressively agglomerate and settle with time. This effect deter-mines composite mechanical properties. This non-uniform particle distri-bution in the resin could lead to non-homogeneous composite properties.When micrometric particles are added, a certain movement is also observed,but—since particles are bigger—decantation is not relevant and particledistribution is more uniform (Fig. 6d and e).
3.4. Dynamic Mechanical Thermal Analysis (DMTA)
The Tg can be clearly distinguished in the charts in Fig. 7 with highlightedpeaks in the curves corresponding to tan d and E’’, apart from a sudden dropin the value of storage modulus (E 0). The Tg can be considered as the middlepoint in the transition in log E’ (Fig. 7a) or the maximum point in E00 or tan d(Figs. 7b and 7c). Obtaining the Tg from the tan d curve is the most widelyused method [26]. The E00 peak is also frequently used, although the Tg thentends to be 20–30�C lower than when taken from tan d [27]. If the peak of theloss modulus is used (Fig. 7b), Tg values are slightly lower than those with
TABLE 2 Kinetic Parameters from Kamal and Auto-Catalytic Equations Applied to the Curingof Studied Materials
Kinetics data (Kamal) K1 K2 n m nþm R2
Epoxy 0.00241 0.00517 2.41 0.16 2.57 0.92261Epoxy þ6% SiC nano 0.00175 0.00740 2.84 0.43 3.27 0.73705Epoxy þ12% SiC nano 0.00145 0.00455 2.37 0.28 2.65 0.91442Epoxy þ6% SiC10 mm 0.00445 0.0158 1.66 0.95 2.61 0.93526Epoxy þ12% SiC10 mm 0.00445 0.0162 1.56 0.86 2.42 0.93967
Kinetics data (Autocatalytic) K2 n m nþm R2
Epoxy 0.00975 2.20 0.21 2.41 0.87216Epoxy þ6% SiC nano 0.00995 2.11 0.32 2.43 0.87557Epoxy þ12% SiC nano 0.00270 1.46 0.03 1.49 0.90493Epoxy þ6% SiC10 mm 0.01702 2.63 0.31 2.94 0.54638Epoxy þ12% SiC10 mm 0.01611 2.00 0.29 2.29 0.56022
Nano and Micro SiC Particles Reinforced Composites 427
Dow
nloa
ded
by [
Mou
nt A
lliso
n U
nive
rsity
0L
ibra
ries
] at
02:
13 2
3 A
ugus
t 201
4

tan d (Fig. 7 and Table 3). The difference in the neat resin is 15�C, while dif-ferences are around 10–11�C for the remaining materials. 39�C (Fig. 7b) wasobtained for neat resin by using the loss modulus and 54.2�C using tan d(Table 3).
The storage modulus (Fig. 7a) in the glassy region is slightly higher forfilled epoxy materials, though it decreases abruptly afterwards, except for thecomposite with 6% nanoparticles, which always remains low. Storage modu-lus data do not fully agree with the values corresponding to the degree ofcuring observed by FTIR spectroscopy and DSC: slightly better or similardegrees of curing were found in composites. This may be related to the stressaccumulation created by SiC particles in the composite. In the rubberyregion, only the composite with 6% nanoparticles remains below the neatresin. If the loss modulus is analyzed (Fig. 7b), all the composite materialsalso have a modulus which remains higher than the unfilled epoxy, except
FIGURE 6 Confocal microscope study of the studied materials. (a) Epoxy, (b) Epoxy þ6% SiCnano (1min), (c) Epoxy þ6% SiC nano (15min), (d) Epoxy þ6% SiC 10mm (1min), (e) Epoxyþ6% SiC 10mm (15min). (Color figure available online.)
428 J. Abenojar et al.
Dow
nloa
ded
by [
Mou
nt A
lliso
n U
nive
rsity
0L
ibra
ries
] at
02:
13 2
3 A
ugus
t 201
4

the composite with 12% nanoparticles, and the peak of the curve appears atlower temperatures.
According to Fig. 7c and Table 3, the Tg values of the composites arelower than for the neat resin. The addition of micrometric particles leadsto a greater decrease. Besides, a slight decrease of the Tg value is observedwhen particle content is increased Although no substantial differences inglobal Tg values were observed, SiC particles clearly hinder polymer-chaingrowth and crosslinking. Epoxy-resin crosslinking takes place during thecuring reaction, forming a 3D network bonding molecular chains throughcovalent links. The more crosslinked the polymer is, the lower its molecularmass between crosslinking points is and the greater its crosslinking densitybecomes. As the number of crosslinking points increases, chain mobilitydecreases [28], losing a certain amount of free volume, and Tg increases.The greater transition-associated molecular movements are, the greater thetan d peak intensity is [29]. The composite with nanoparticles present a nar-row tan d peak as a consequence of the restricted molecular movements. SiCreduces the energy necessary to cause rotations around molecular bonds,thus shifting the glass transition to lower temperatures. The same effectwas found with diluents [30]: the Tg and tan d signal decreased as the diluentcontent increased. However, an unexpected increase of the area under thetan d peak (tan d vs. temperature plot, Fig. 7c) is observed with SiC additions(Table 3). This is related to unreacted epoxy groups due to the presence of
FIGURE 7 Variation of (a) storage modulus; (b) loss modulus and; (c) Tan d as a function ofparticle size and SiC percentage. (Color figure available online.)
Nano and Micro SiC Particles Reinforced Composites 429
Dow
nloa
ded
by [
Mou
nt A
lliso
n U
nive
rsity
0L
ibra
ries
] at
02:
13 2
3 A
ugus
t 201
4

the filler. Those unreacted groups have no restricted molecular movementsand the peak area increases. On the other hand, the height of the tan d peakis very close to 1 in all composites with SiC micro, as the values of E 0 and E00
are very similar [Eq. (4)]. This may be related to short-length chains in theepoxy due to high SiC particle size.
Measured Log E 0 value at 60�C is compatible with the surpassing of Tg.The variations of the modulus within the 60-100�C range are very short.
3.5. Mechanical Properties
Table 4 reports the physical (density) and mechanical properties (bendingstrength, elongation, and hardness) and wear resistance of materials. Arelation between the physical and mechanical properties and the degree ofconversion of the resin is generally observed. A greater degree of conversionprovides greater structural stiffness and, therefore, higher bending strengthand lower elongation. The 12% SiC-nano composite, with lower degree ofcuring, shows lower strength and greater elongation. In general, the additionof particles leads to porosity and, therefore, to lower densities (Table 4) due towetting and mixing problems. Nanoparticles also decrease the bendingstrength and hardness. The manufacturing method is not able to provide100% density materials. Methods like extrusion could give better propertiesfor materials with nanoparticles.
The high elongation produced in the composite with 12% nanometricparticles is very interesting. This value is logical if very short polymer chainsand a low degree of conversion are assumed. In this case, the specimens
TABLE 3 Variation of the Viscoelastic Properties and Tg Obtained by the DMTA
Log E 0
(25�C) [Pa]Log E 0
(60�C) [Pa]Area
(Tan d) [a.u.]h (Tan d)
[a.u.]Tg
[�C]Log E 0
(100�C) [Pa]
Epoxy 8.41 6.49 19.52 0.80 54.20 6.31þ6% SiC nano 8.32 6.39 22.40 0.74 43.55 6.25þ12% SiC nano 8.17 6.24 22.52 0.64 43.34 6.02þ6% SiC 10mm 8.06 6.38 24.11 0.84 41.65 6.23þ12% SiC 10mm 8.43 6.43 25.16 0.96 40.84 6.35
TABLE 4 Physical, Mechanical Properties, and Wear Resistance of the Composites
Relativedensity(%)
BendingStrength(MPa)
Elongation(%)
Hardness(Shore D)
Wear(m3=Nm 10�4)
Averagefriction
coefficient
Epoxy 97 78 6 73 3.69 0.44þ6% SiC nano 94 59 11 71 0,17 0.15þ12% SiC nano 94 22 38 62 64.44 0.59þ6% SiC 10mm 95 97 5 75 10.61 0.48þ12% SiC 10mm 94 87 5 76 9.03 0.53
430 J. Abenojar et al.
Dow
nloa
ded
by [
Mou
nt A
lliso
n U
nive
rsity
0L
ibra
ries
] at
02:
13 2
3 A
ugus
t 201
4

have a fully plastic mechanical behaviour—some of them did not even breakduring the test.
According to the literature, the addition of abrasion-resistant fillers leadsto significantly increased composite hardness. Hardness increases with particlesize; hence, the wear ratemust be lower [31,32]. This affirmation disagrees withthe results obtained in this work (Table 4). Slightly increased hardness isobserved with the largest additions of micrometric SiC. In the nanoparticle-containng materials, their lower density and degree of conversion leads toreduced hardness, due to uncured material. The degree of curing has alsoan important effect on wear resistance: higher wear was observed in materialswith a lower degree of conversion (composite with 12% nanometric SiC). Incomposites with 6% nano SiC, the adhesive wear is the dominating wearmechanism. 12% additions lead to terrible wear, since they produce greatspecimen deformation. Thus, specimens lose their original shape.
Another fact must be taken into account in the case of composites withmicrometric particles: the existence of the third body (detached SiC parti-cles), which favours abrasive wear. In all composite tests, counter-material(pin) wear takes place, and in all cases the friction coefficient remains below0.6, which is the characteristic value for this type of materials.
Figure 8 shows the fracture surface of materials. SEM micrographs of thefracture plane in the neat resin (Fig. 8a) show hackle markings in the direc-tion of crack propagation, characteristic of cleavage brittle fractures. How-ever, more granular fractures are apparentl in SiC-added materials (Fig. 8b).The presence of particles results in smaller fracture planes showing variedorientations.
The specific volume of nanoparticles is so high that fracture cracksadvance a short distance before intercepting a particle. Therefore, fractureplanes are rather short (see Fig. 8b). This crack growth makes the fractureappear as fully granular. Moreover, short polymer chains and low degreeof conversion favour this type of fracture. Figures 8c and 8d show agglomer-ated particles and nanoporosity.
With the addition of microparticles (Fig. 8e), the general appearance ofthe material is very similar to that with nano additions. When greater magni-fication is used, composites show a different aspect due to cleavage planes.The specific particle volume is considerably lower, thus leading to greater freecrack growth. The lack of bonding between particles and the epoxy resinseems to have an important impact on composite mechanical properties(Table 4). Unbonded particles can act as a third-body agent (Fig. 8f) andas centres of stress accumulation. In addition, all composites show highporosity (5–6%), which also has a significant impact on composite mechanicalproperties.
Figure 9 shows TEM micrographs of the nano SiC specimens. In thesemicrographs agglomerated particles and nanoporosity can be seen, confirm-ing the SEM study.
Nano and Micro SiC Particles Reinforced Composites 431
Dow
nloa
ded
by [
Mou
nt A
lliso
n U
nive
rsity
0L
ibra
ries
] at
02:
13 2
3 A
ugus
t 201
4

FIGURE 8 Fracture surface by SEM: (a) epoxy, (b) epoxy þ6% SiC nano, (c) epoxy þ6% SiCnano, (d) epoxyþ12% SiC nano, (e) epoxyþ6% SiC 10mm, and (f) detail epoxyþ12% SiC 10mm.
FIGURE 9 Fracture surface by TEM: a) epoxy þ6% SiC nano, and b) epoxy þ12% SiC nano.
432 J. Abenojar et al.
Dow
nloa
ded
by [
Mou
nt A
lliso
n U
nive
rsity
0L
ibra
ries
] at
02:
13 2
3 A
ugus
t 201
4

4. CONCLUSIONS
Epoxy based composites, reinforced with SiC micro and nanoparticles, havebeen manufactured. The study of the curing process and the properties of thebulk materials lead to the following conclusions.
The degree of conversion of the epoxy reinforced with micro SiC and6% nano SiC is the same as that of the plain matrix. Additions of 12% nanoparticles produce a very low degree of conversion. All the particles alsoincrease the initial reaction rate.
Micro and 6% nano SiC give autocatalytic kinetics. The addition ofmicrometric particles leads to increased total reaction, while the additionof nanometric particles leads to a reduced total reaction order.
The addition of particles reduces Tg due to the reduced number of cross-linking points. The effect is lower for nano SiC particles.
The agglomeration of nano particles leads to non-homogeneous com-posite distributions and non-uniform mechanical properties.
Nanoparticles enhance material ductility, measured as elongation inbending tests. Moreover, 6% nano SiC highly reduces (one order of magni-tude) the wear of the matrix, being the only addition promoting this effect.Micro particles are good additions to increase composite strength but theyreduce wear resistance.
The addition of nanoparticles shows wetting problems during mixing,provoking porosity in bulk materials.
ACKNOWLEDGEMENTS
Authors wish to acknowledge the support of the Adhesion and AdhesivesLaboratory at the University of Alicante (Spain).
REFERENCES
[1] Aal, N. A., El-Tantawy, F., Al-Hajry, A., and Bououdina, M. I., Polymer Compos.29, 125–132 (2008).
[2] Zheng, Y. P., Zheng, Y., and Ning, R. C., Mater Lett. 57, 2940–2944 (2003).[3] Huang, G. C. and Lee, J. K., Compos. Pt. A-Appl. Sci. Manuf. 41, 473–479 (2010).[4] Ghaemy, M., Nasab, S. M. A., and Barghamadi, M., Polymer Compos. 29, 165–
172 (2008).[5] Wang, Z., Massam, J., and Pinnavaia, T. J., ‘‘Epoxy-clay nanocomposites,’’ in
Polymer-clay nanocomposites, T. J. Pinnavaia and W. Beall (Eds.), (John Wiley,New York, 2001) Ch. 7.
[6] Kornmann, X., Lindberg, H., and Berglund, L. A., Polymer 42, 4493–4499 (2001).[7] Hackman, I. and Hollaway, L., Compos. Pt. A-Appl. Sci. Manuf. 37, 1161–1170
(2006).
Nano and Micro SiC Particles Reinforced Composites 433
Dow
nloa
ded
by [
Mou
nt A
lliso
n U
nive
rsity
0L
ibra
ries
] at
02:
13 2
3 A
ugus
t 201
4

[8] Le Pluart, L., Duchet, J., Sautereau, H., and Gerard, J. F., J. Adhes. 78, 645–662(2002).
[9] Kornmann, X., Lindberg, H., and Berglund, L. A., Polymer 42, 1303–1310 (2001).[10] Geraon, A. L., Bruck, H. A., Hopkins, A. R., and Segal, K. N., Compos. Pt. A-Appl.
Sci. Manuf. 41, 729–736 (2010).[11] Musto, P., Martuscelli, E., Racosta, G., Russo, P., and Villano, P., J. Appl. Polym.
Sci. 74, 532–540 (1999).[12] Improved Materials Strategies Inc (IMS) of Houston, TX. Additives for Polymers
2003 (6), 4 (2003).[13] Commodore Environmental Services. Adhes. Age 41, 45, (1998).[14] Chisholm, N., Mahfuz, H., Rangari, V. K., Ashfaq, A., and Jeelani, S., Compos.
Struct. 67, 115–124 (2005).[15] Karapappas, P., Baltopoulos, A., Vavouliotis, A., Fiamegkou, E.,
Athanasopoulos, N., Fotiou, I., Kostopoulos, V., Borsella, E., and Fabbri, F.,Proc. SPIE 7493, 74933S (2009). doi:10.1117=12.845614.
[16] Mouritz, A. P. and St. John, D. H., Mater. Sci. Forum. 16, 9–18 (1992).[17] Khashaba, M. I. and Ali, W. Y., Metall. 53, 698–701 (1999).[18] Rodgers, R. M., Mahfuz, H., Rangari, V. K., Chisholm, N., and Jeelani, S., Macro-
mol. Mater. Eng. 290, 423–429 (2005).[19] Luo, Y. J., Dang, J., Qi, H. Y., and Li, H. R., Polym.-Plast. Technol. Eng. 48,
877–881 (2009).[20] Zhang, Y., Pickles, C. A., and Cameron, J., J. Reinf. Plast. Compos. 11, 1176–
1186 (1992).[21] Avella, M., Dell’Erba, R., Martuscelli, E., and Partch, R., J. Polym. Mater. 17, 445–
458 (2000).[22] Meng, S. A., Jin, G. Q., Wang, Y. Y., and Guo, X. Y., Mater. Sci. Eng. A 527,
5761–5765 (2010).[23] Kamal, M. R., Polym. Eng. Sci. 14, 231–239 (1974).[24] Sourour, S. and Kamal, M. R., Thermochim Acta 14, 41–59 (1976).[25] Pretsch, E., Buhlmann, P., and Affolter, C., Structure determination of organic
compounds: Tables of Spectral Data, (Springer-Verlag, Berlin, 2001) 3rd ed.[26] Ellis, B., Chemistry and Technology of Epoxy Resins, (Chapman and Hall,
London, 1993).[27] Hale, A., Macosko, C. W., and Bair, H. E., Macromolecules 24, 2610–2621
(1991).[28] Matsuoka, S., Relazation Phenomena in Polymers, (Carl Hanser Verlag, Munich,
1992).[29] Miller, D. R. and Macosko, C. W., Macromolecules 9, 206–211 (1976).[30] Nu~nnez-Regueira, L., Villanueva, M., and Fraga-Rivas, I., J. Therm. Anal. Calorim.
86, 463–468 (2006).[31] Axen, N. and Jacobson, S., Wear 174, 187–199 (1994).[32] Durand, J. M., Vardavoulias, M., and Jeandin, M., Wear 181–183, 833–839
(1995).
434 J. Abenojar et al.
Dow
nloa
ded
by [
Mou
nt A
lliso
n U
nive
rsity
0L
ibra
ries
] at
02:
13 2
3 A
ugus
t 201
4