epic user manual
TRANSCRIPT

EPiC USER MANUAL
Powered by United Nations Economic Commission for Africa

Page | ii
Table of Contents
Table of Contents .................................................................................................................................................. ii
List of Figures ......................................................................................................................................................... iii
Glossary .................................................................................................................................................................... vi
1. Introduction ................................................................................................................................................... 1
2. How to Login ................................................................................................................................................ 1
3. General Overview ........................................................................................................................................ 2
3.1 EPiC User roles ................................................................................................................................ 2
4. Components .................................................................................................................................................. 3
4.1. About Profile .................................................................................................................................... 4
4.1.1 How to update profile information ........................................................................... 4
4.1.2 How to Change your password .................................................................................. 5
4.1.3 How to upload/change profile picture .................................................................... 6
4.2. Dashboard Menu ........................................................................................................................... 7
5. Indicator Frameworks ................................................................................................................................ 9
5.1. How to Create Indicator Framework .................................................................................... 11
5.2. How to Create Indicators .......................................................................................................... 12
5.3. How to Download & Import Templates .............................................................................. 13
5.3.1 How to download templates .................................................................................... 13
5.3.2 How to edit templates ................................................................................................. 13
5.3.3 How to Import Templates .......................................................................................... 15
6. Core Concepts ............................................................................................................................................ 18
6.1. How to Add National Core Concepts ................................................................................... 18
7. Reports .......................................................................................................................................................... 20
7.1 How to Generate Progress Report ........................................................................................ 20
8. Administrations .......................................................................................................................................... 21
8.1. Users & Roles ................................................................................................................................ 21
8.2. Countries ......................................................................................................................................... 23
9. Policies ........................................................................................................................................................... 24
9.1. Accessing a Policy ........................................................................................................................ 24
9.2. How to start analyzing a new policy ..................................................................................... 26
9.2.1 Policy Overview and Dashboard ............................................................................................ 28
9.2.2 Phase I: Preparation work for the Policy Review ............................................... 30
9.2.3 Phase II: Data entry of the Policy ............................................................................. 37
9.2.4 Phase III: Review of Policy Coverage ...................................................................... 47
9.2.5 Phase IV: Review of Indicator Framework ............................................................ 52
9.3. How to Move a policy to the next phase ............................................................................ 56
9.4. How to Generate Output Report for a Policy .................................................................... 57

Page | iii
List of Figures
Figure 1: EPiC tool login page ......................................................................................................................... 1
Figure 2: EPiC landing page .............................................................................................................................. 1
Figure 3: EPiC landing page - List of policies for the country context ............................................. 3
Figure 4: Description for section 4.1 of the Policies page ..................................................................... 3
Figure 5: Description for section 4.2 of Policies page ............................................................................ 4
Figure 6: Account Profile page - Edit profile settings ............................................................................. 4
Figure 7: Updating/editing your profile information .............................................................................. 5
Figure 8: Account profile page - Change Password ................................................................................ 5
Figure 9: Change password page ................................................................................................................... 6
Figure 10: Account profile page - Edit Profile Settings .......................................................................... 6
Figure 11: Uploading a profile picture.......................................................................................................... 7
Figure 12: Dashboard menu ............................................................................................................................. 7
Figure 13: Theme-Customizer pop up .......................................................................................................... 8
Figure 14: Indicator Framework menu ......................................................................................................... 9
Figure 15: List of the Global Indicator Frameworks ................................................................................. 9
Figure 16: List of the Regional Indicator Frameworks ............................................................................ 9
Figure 17: List of the National Indicator Framework ............................................................................. 10
Figure 18: List of the policy indicator frameworks for a country context ..................................... 10
Figure 19: List of indicators created under an indicator framework ............................................... 10
Figure 20: Creating an Indicator framework............................................................................................. 11
Figure 21: New framework created and adding indicators ................................................................ 11
Figure 22: National Indicator Framework list ........................................................................................... 12
Figure 23: Indicators list for a specific indicator framework .............................................................. 12
Figure 24: Creating an indicator ................................................................................................................... 13
Figure 25: Downloading a template ............................................................................................................ 13
Figure 26: Excel file of the Indicator template when downloaded .................................................. 14
Figure 27: Enable Content and Go to Indicators .................................................................................... 14
Figure 28: Indicators Data Entry Excel sheet ............................................................................................ 15
Figure 29: Confirmation the indicators are saved and validated...................................................... 15
Figure 30: Importing a template ................................................................................................................... 15
Figure 31: Importing Wizard window ......................................................................................................... 16
Figure 32: Uploading the indicator template ........................................................................................... 16
Figure 33: Summary of the template content.......................................................................................... 16
Figure 34: Indicator template imported ..................................................................................................... 17
Figure 35: List of Global and National Core Concepts ......................................................................... 18
Figure 36: Creating a National Core Concept .......................................................................................... 18
Figure 37: New national Core Concept added ........................................................................................ 19
Figure 38: Creating an overall Progress Report ...................................................................................... 20
Figure 39: EPiC Progress Report ................................................................................................................... 20

Page | iv
Figure 40: Administration sub-menus ........................................................................................................ 21
Figure 41: User's List .......................................................................................................................................... 21
Figure 42: Creating a new user ...................................................................................................................... 22
Figure 43: User’s Basic Details page ............................................................................................................ 22
Figure 44: Administrator - Edit Profile Settings ...................................................................................... 23
Figure 45: List of countries visible to the Administrator ...................................................................... 23
Figure 46: Policies menu .................................................................................................................................. 24
Figure 47: The Create New Policy button .................................................................................................. 24
Figure 48: Main sections view of a policy at each phase ..................................................................... 25
Figure 49: Changing policy phase to review ............................................................................................ 25
Figure 50: Phase names coloring description .......................................................................................... 25
Figure 51: Help icon available at each phase ........................................................................................... 26
Figure 52: The Create New Policy button .................................................................................................. 26
Figure 53: Creating a new policy to be analyzed ................................................................................... 26
Figure 54: Detail view of newly created policy ........................................................................................ 27
Figure 55: New policy created ....................................................................................................................... 27
Figure 56: Accessing the policy overview and dashboard pages ..................................................... 28
Figure 57: The dashboard pages for each of the four phases ........................................................... 29
Figure 58: Phase I - Assigning relevance of CC with respect to the policy .................................. 30
Figure 59: Phase I - Relevance assigned to core concepts ................................................................. 31
Figure 60: Policy Indicator Window ............................................................................................................. 31
Figure 61: Phase I – Creating a policy Indicator ...................................................................................... 32
Figure 62: List of policy indicators created ............................................................................................... 32
Figure 63: Relevant Indicator Frameworks window ............................................................................... 33
Figure 64: Adding Relevant Indicator Framework .................................................................................. 33
Figure 65: Newly added relevant indicator frameworks ...................................................................... 34
Figure 66: List of all relevant indicator frameworks added ................................................................ 34
Figure 67: Policy Structure window ............................................................................................................. 35
Figure 68: Creating a policy structure ......................................................................................................... 35
Figure 69: List of policy structures ............................................................................................................... 35
Figure 70: Outcomes window ........................................................................................................................ 36
Figure 71: Creating an Outcome .................................................................................................................. 36
Figure 72: List of outcomes created for the policy structures ........................................................... 37
Figure 73: Initial IAs window .......................................................................................................................... 37
Figure 74: Adding Initial Issues for Action ................................................................................................ 38
Figure 75: List of all the initial IAs added .................................................................................................. 38
Figure 76: Consolidate IA Window .............................................................................................................. 39
Figure 77: List of Unconsolidated IAs ......................................................................................................... 39
Figure 78: Adding additional meta data to the consolidated IA ...................................................... 40
Figure 79: Adding Target Groups in Doc and/or Recommended Target Group ........................ 40
Figure 80: Save a consolidated IA after adding description............................................................... 41
Page | v
Figure 81: List of all consolidated IAs ......................................................................................................... 41
Figure 82: IA/CC Mapping Window ............................................................................................................. 42
Figure 83: Adding Core Concepts to be mapped to the IAs .............................................................. 42
Figure 84: Select Core Concepts Window ................................................................................................. 43
Figure 85: List of all mapped core concepts ............................................................................................ 43
Figure 86: Consolidated IAs mapped with and without Core Concepts........................................ 44
Figure 87: IA/CC combination window....................................................................................................... 45
Figure 88: IA/CC combination Adding Indicators .................................................................................. 45
Figure 89: Select Indicator window .............................................................................................................. 45
Figure 90: Add a reason for not having indicators ................................................................................ 46
Figure 91: List of added indicators to IA/CC combination grouped according to their
framework .................................................................................................................................................... 46
Figure 92: List of the IA/CC combinations after indicator have been added .............................. 47
Figure 93: Core Concept Coverage Review window ............................................................................. 48
Figure 94: List of IAs .......................................................................................................................................... 48
Figure 95: Review Indicator Frameworks window .................................................................................. 49
Figure 96: Viewing and Reviewing list of indicators with/without associated IAs ..................... 49
Figure 97: Creating a new IA on phase III ................................................................................................. 50
Figure 98: IAs created on Phase III will display as PROPOSED .......................................................... 50
Figure 99: Review Outcomes window ......................................................................................................... 51
Figure 100: List of IAs with no outcome .................................................................................................... 51
Figure 101: Viewing the list of outcomes and mapped IAs ................................................................ 51
Figure 102: Review IA/CC combination window ..................................................................................... 52
Figure 103: Description of the columns on phase IV ............................................................................ 53
Figure 104: Reviewing an IA/CC combination with status PENDING ............................................. 54
Figure 105: Reviewing an IA/CC combination with status NO INDICATOR ................................. 54
Figure 106: Select Indicator window ........................................................................................................... 55
Figure 107: Create Indicator window .......................................................................................................... 55
Figure 108: List of added Indicators added to IA/CC combinations the were not associated
.......................................................................................................................................................................... 55
Figure 109: Options to add target groups to the final target group .............................................. 56
Figure 110: Confirmation prompt window for Approve or Hold IA/CC combination ............ 56
Figure 111: Policy reference number .......................................................................................................... 56
Figure 112: Edit policy page ........................................................................................................................... 57
Figure 113: Confirmation window for moving a policy to the next or previous phase ........... 57
Figure 114: Report sub-menus available for each phase .................................................................... 57
Figure 115: Phase I, Phase II, Phase III output reports that can be generated ............................ 58
Figure 116: Phase Report for Individual Outputs ................................................................................... 58
Figure 117: Phase IV - Final report generated for a policy ................................................................. 59
Figure 118: Saving Phase IV generated report as pdf .......................................................................... 61
Figure 119: Options available for a particular graphical representation ....................................... 61

Page | vi
Glossary
Issues for Action (IA) Priority issues that the plan or policy is aiming to address. IAs can
denote either a problem that requires action or a condition that
needs to be maintained. IAs can generally be extrapolated from
the narrative or the logframe of the policy document.
e.g. Insufficient primary school teachers with proper qualifications
Identifying IAs is a key starting point in identifying the objectives
of the policy, which in turn will lead to a more relevant monitoring
framework.
Core Concepts (CC) A set of 29 concepts extracted from international development
principles which help assess four dimensions of development –
economic, environmental, institutional and social – in the policy.
e.g. Ecosystem impacts, cultural responsiveness, human resources
These core concepts help assess whether the coverage of the
policy document is adequate.
IA/CC Combination An output from mapping IAs to relevant CCs. Each IA identified in
the document may be considered highly relevant to one or more
CCs. Each combination is thus referred to as a IA/CC Combination.
Reference
Population (RP)
Overall population or object that is being addressed or impacted
upon by the issue requiring action.
e.g. All citizens, primary schools, health care facilities, ecosystem
Target Group (TG) Subsets of the reference population which may require specific
focus due to their vulnerability or importance to the issue at hand.
Target groups may be explicitly specified or implied in the policy.
e.g. Rural population, children with disabilities, migrant workers
Outcome A description of the desired result and target of the policy, which
often includes a measure and a specified period of achievement.
e.g. Implement social protection systems and measures by 2030
Indicator A measure that provides meaningful evidence to help monitor
progress against key national issues for which the desired
outcomes are sought. Indicators are often found in an outcome
table (i.e., logframe) or in an Appendix towards the end of the
policy document.
e.g. Proportion of population that has access to public transport

Page | 1
1. Introduction
EPiC – Every Policy is Connected
EPiC (Every Policy is Connected) is a tool that facilitates policy-data dialogue aiming to identify
policy priorities as well as data needs. The tool integrates the four dimensions of development
(Economic, Environmental, Institutional and Social) in every policy plan and develops a
comprehensive indicator framework for policy monitoring.
2. How to Login
Step 1. On your preferred browser type in the URL https://epic.unescap.org. You will be
redirected to Figure 1 below. (Note: EPiC works better with Chrome & Firefox)
Step 2. Please type in your email address and password and click Login to access the
system.
Step 3. After login, you will be redirected to the landing page in Figure 2, which lists all
policies for the country in review
Figure 1: EPiC tool login page
Figure 2: EPiC landing page

Page | 2
3. General Overview
This tool aims to enhance policies and their associated monitoring and evaluation framework.
Policy structure is first defined by its sections and sub-sections where policies Issues for actions
(IAs) are identified. These Issues for Action get linked to one or more Core Concepts (CCs) which
forms IA/CC combinations. For each IA/CC combination relevant Global, Regional, National and
Policy Indicators get identified to track the progress of that IA/CC combination.
The tool has four phases after a policy has been created. Under each phase there are additional
steps users must go through before proceeding to the next phase.
Users will be able to read any of the policies and its details in the country context the user has
access to. The users who will be working at each phase of the policy should be given permission
to work at that phase. The permission can be given at any phase or stage. The assigned users can
edit only the phase they have permission for. Each of the phases and their detailed steps are
described further below.
3.1 EPiC User roles
In the EPiC system there are five main different roles.
• FRAMEWORK_MANAGER: users assigned with this role are responsible for creating and
managing the indicator frameworks at the Global and Regional level.
• NATIONAL_FRAMEWORK_MANAGER: users assigned with this role are responsible for
creating and managing an indicator framework that will only be available at the National
level for their assigned country context.
• POLICY_CREATOR: users assigned this role are responsible for creating a policy that will
be analyzed and go through the four phases of the tool for the assigned country context.
• POLICY_USER_MANAGER: users assigned with this role are responsible for managing
and assigning roles to users who will work at each phase of a policy within the given
country context
• ADMINISTRATOR: users assigned with this role are responsible for the overall managing
and administration of the EPiC tool.

Page | 3
4. Components
The main components of the EPiC tool are described below. When you have successfully logged
in, you are first redirected to the Policies list page. In this page you have the main navigation
menus and the policies within the country context, as indicated in Figure 3 below. The different
sections are described below.
Section 4.1. This section contains icons that redirect you to other pages of the EPiC tool.
Section 4.2. This section in Figure 5 below allows users to perform different actions.
This will redirect you to view your
User Profile page
This will open the
EPiC tool user
manual
This will redirect you to the National
Indicator Framework page
This will redirect you to the
Global Indicators page
This will redirect
you to the Policies
page
This will
change the
menus visible
on Section
4.3 of the
Dashboard
page to icons
Figure 4: Description for section 4.1 of the Policies page
Section 4.2
Section 4.1
Section 4.4
Section 4.3
Sectio
n 4
.5
Figure 3: EPiC landing page - List of policies for the country context

Page | 4
4.1. About Profile
In this section, you have the option to edit your profile, change your password or upload a
profile picture.
4.1.1 How to update profile information
Step 1. To update your profile information, go to Profile to open account profile page.
Step 2. From the account profile page, please click Edit Profile settings as indicated in Figure
6 below.
Figure 6: Account Profile page - Edit profile settings
Profile – Takes you to your user
profile page
Activity- Shows you all the
activities you have done so far on
the EPiC tool
Help- Opens the EPiC tool user
manual
About – redirects you to a
description about EPiC portal
Logout- Signs you out of the
EPiC tool
Click here to change the
page language between
English and French
Click here to change the page view
to full screen mode
This shows you unread notifications on all policy
activities. You can read each notification one by
one and choose to select Mark all as read
which will remove all notifications at once.
Figure 5: Description for section 4.2 of Policies page

Page | 5
Step 3. You will be redirected to the edit profile settings page. As indicated in Figure 7 below,
you edit general information.
Step 4. You can also see the country of scope and the roles that have been assigned to you.
4.1.2 How to Change your password
Step 1. To change your password, go to Profile, as seen above in Figure 5.
Step 2. You will be redirected to your Account profile page in Figure 8 below. From here
click Change Password as indicated below.
Figure 8: Account profile page - Change Password
Figure 7: Updating/editing your profile information

Page | 6
Step 3. You will be redirected to the change password page seen in Figure 9 below. As
required type in your current password and new password and confirmation in the
space provided. When you are done click Update Password.
Step 4. A message at the top of your window will be displayed to confirm you have
successfully changed your password.
4.1.3 How to upload/change profile picture
Step 5. To upload or edit a profile picture go to Profile to open account profile page.
Step 6. From the account profile page, please click Edit Profile settings as indicated in
Figure 10 below.
Step 7. You will be redirected to the edit profile settings page. As indicated in Figure 11
below, click Upload New Picture.
Step 8. You will be redirected to search and select your preferred picture.
Figure 9: Change password page
Figure 10: Account profile page - Edit Profile Settings

Page | 7
Step 9. Once it is uploaded click Update Profile Settings and the newly added profile
picture will be displayed.
Section 4.3. This section contains the main navigation menu. Position your mouse over each
menu and check the submenu available under any of the menus.
✓ The Dashboard menu is described below, and details of the remaining
navigation menus are described further in this user guide
4.2. Dashboard Menu
When the dashboard menu is clicked, you will be redirected to Figure 12 below. The dashboard
page mainly displays an overview of the current country’s context policies, indicator frameworks
and latest updates.
Figure 12: Dashboard menu
This section
shows the total
number of
policies,
indicator
frameworks,
core concepts
and the current
users who have
been given
access to read
any of the This section shows the breakdowns of
the policies by phases and tallies
indicators at global, regional and
national levels.
This section shows latest changes
and updates that have been made
on the policies, such as IAs, IA/CC
combinations.
Figure 11: Uploading a profile picture

Page | 8
Section 4.4. This section displays a list of the policies that have been created for the country
context. From this section you can create a new policy or click one of the
policies to view. Please refer to Section 9 for further details.
Section 4.5. This settings gear icon (identified as Section 4.5 in Figure 3) opens a side menu
of a Theme Customizer that will allow the user to customize the look of the EPiC
tool as indicated in Figure 13 below.
Figure 13: Theme-Customizer pop up
Theme Layout – allows you to change the EPiC page
theme.
Icon Animation- you can enable or disable the icon
animations you see next to the menus
Collapse Menu- Can choose to collapse the main menu
Navbar Colors – allow you to change the color of the
navbar
Navbar Type- allows you to fix the position of the navbar
Footer Type- allows you to fix the position of the footer.

Page | 9
5. Indicator Frameworks
Indicator frameworks are the basic structure that define the indicators. In the indicator framework
section, we can view the list of available indicator frameworks. As indicated in Figure 14 below
we can choose to view the Global, Regional, National and Policy indicators.
Global Indicator Framework
These indicator frameworks are from global initiatives (eg SDGs) and contain indicators and can
be thus mapped to the key issues in the document.
Regional Indicator Framework
These indicator frameworks are those identified regional initiatives, of relevance, which contain
indicators and can be thus mapped to the key issues in the document.
Figure 14: Indicator Framework menu
Figure 15: List of the Global Indicator Frameworks
Figure 16: List of the Regional Indicator Frameworks

Page | 10
National Indicator Framework
These indicator frameworks are those which exist in other policies at the national level, which
hold relevance to the country context policy being reviewed.
Policy Indicator Framework
These policy indicator frameworks are those contained and proposed in each of the policy to be
analyzed for a particular country context.
• If you select one of the policy indicator frameworks from the above list, as indicated in
Figure 19 below the list of policy indicators created for that policy indicator framework
will be displayed.
• Note that this is a read only view of the policies and the indicators. To create policy
indicators, please refer to step 2 in section 9.2.1.
Figure 17: List of the National Indicator Framework
Figure 18: List of the policy indicator frameworks for a country context
Figure 19: List of indicators created under an indicator framework

Page | 11
5.1. How to Create Indicator Framework
To create indicators, we need to have an indicator framework first, which can be created following
the steps below.
Step 1. To create an indicator framework, choose either the Global or Regional or National
from the Indicator Framework menu displayed in Figure 14.
Step 2. Depending on your selection, you will be redirected to the corresponding page with a
Create New button at the top-right corner.
✓ The Create New button for Global and Regional indicator framework will only
be visible to users who are assigned the FRAMEWORK_MANAGER role.
✓ The Create New button for National indicator framework will only be visible to
users who are assigned the NATIONAL_FRAMEWORK_MANAGER role.
Step 3. As indicated in Figure 20 below, the Framework Type field will be different based on
what you selected. The Country field is only available when National framework type
is selected.
Step 4. Please type in the Name and Description of the indicator framework you are creating
and click Save.
Step 5. When the indicator framework is created it will be added to the list of indicator
frameworks window.
Step 6. As indicated in Figure 21 below, you can use the icons available to see the number of
indicators associated with this framework, to download and import indicator (Refer to
How to Download & Import templates), to edit the indicator framework and delete.
Figure 20: Creating an Indicator framework
Framework Type
Figure 21: New framework created and adding indicators
To delete an indicator
framework, you must first
delete the indicators created
in the specific framework

Page | 12
5.2. How to Create Indicators
Once we have an indicator framework, we can create the indicators, following the steps below.
Step 1. To create an indicator, choose Global, Regional or National from Figure 14 above.
Step 2. Depending on your selection, you will be redirected to a list of indicator frameworks
as seen in Figure 22 below. In this figure, we have chosen the National Indicator
Framework
Step 3. From the available lists in Figure 22 above, select one of the national indicator
frameworks.
Step 4. You will be redirected to the Indicators list page for the selected indicator framework.
Step 5. As indicated in Figure 23 below, you can manually add indicators in the system or
download a template and import the indicators.
✓ To download and import the indicators, please refer to How to Download &
Import templates.
Step 6. To continue creating the indicator, click Create New button as indicated in Figure 23
below
Figure 22: National Indicator Framework list
Figure 23: Indicators list for a specific indicator framework

Page | 13
Step 7. As indicated in Figure 24 below, you will be redirected to the Create Indicator page.
Step 8. Type in the Code and Name of the indicator in the space provided and click Save
5.3. How to Download & Import Templates
5.3.1 How to download templates
Step 1. To download the indicator template, click the download template icon as shown in
Figure 25 below.
Step 2. When download template is selected an Excel document will be downloaded.
Step 3. Once download is complete, please go to your download folder and open the template
in an Excel file.
5.3.2 How to edit templates
Step 1. The downloaded Excel template should be opened as shown in Figure 26.
Note: The Excel file is unique to each indicator framework or policy indicator that has
been selected. Make sure to import the template to the relevant indicator framework.
Figure 25: Downloading a template
Figure 24: Creating an indicator
Page | 14
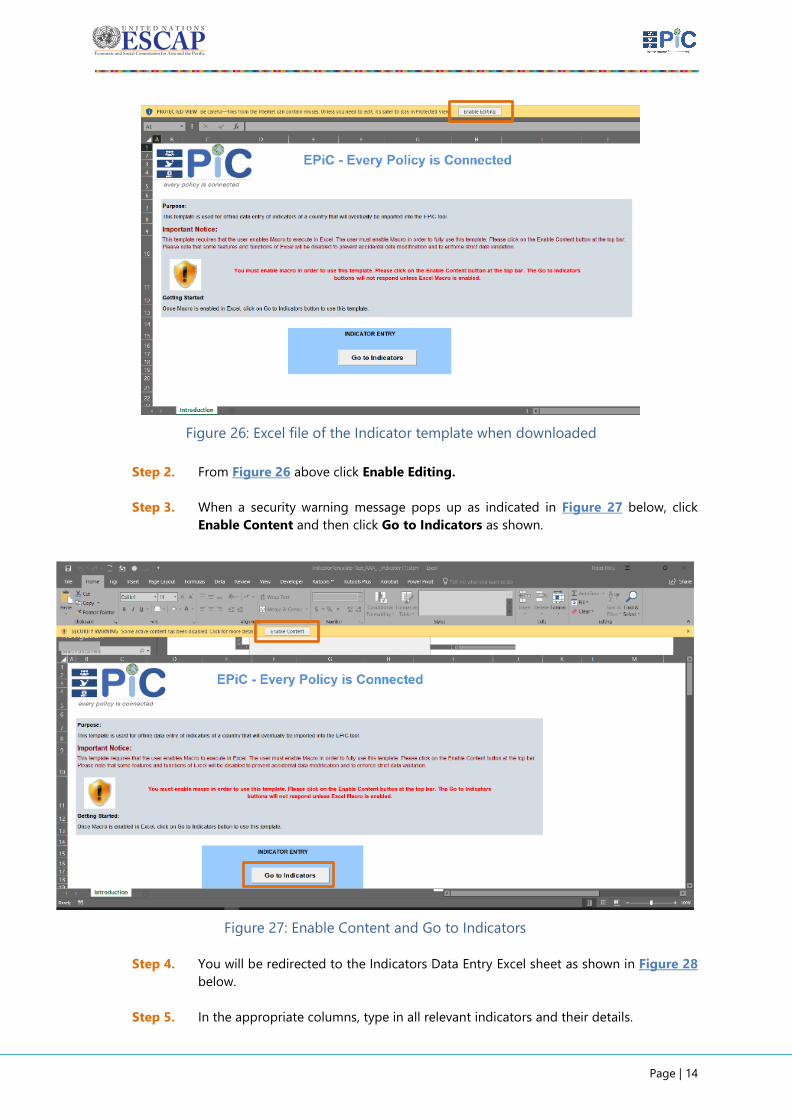
Step 2. From Figure 26 above click Enable Editing.
Step 3. When a security warning message pops up as indicated in Figure 27 below, click
Enable Content and then click Go to Indicators as shown.
Step 4. You will be redirected to the Indicators Data Entry Excel sheet as shown in Figure 28
below.
Step 5. In the appropriate columns, type in all relevant indicators and their details.
Figure 27: Enable Content and Go to Indicators
Figure 26: Excel file of the Indicator template when downloaded

Page | 15
Step 6. After you have added the indicator click Validate as highlighted in Figure 28 to make
sure there are no errors and save the Excel file.
Step 7. You will be redirected to the General Excel sheet. You can see the confirmation that
there are no errors. To add more indictors, select the Go to Indicators link.
5.3.3 How to Import Templates
Step 1. To start the importing process, click Import indicator icon as indicted in Figure 30
below.
Figure 30: Importing a template
Figure 28: Indicators Data Entry Excel sheet
Figure 29: Confirmation the indicators are saved and validated

Page | 16
Step 2. As shown in Figure 31 below the Import wizard will be opened. Click on Next to start
importing.
Step 3. Browse and search for the indicator template Excel file to import the indicators.
Step 4. When you upload and click next, a summary of the edited template content will be
shown.
Step 5. Review the summary and click Next.
Figure 31: Importing Wizard window
Figure 32: Uploading the indicator template
Figure 33: Summary of the template content

Page | 17
Step 6. If the import was successful with no errors a message will be displayed at the top as in
Figure 34.
Step 7. Click Finish and close to finalize the import. The indicators will be added accordingly.
Figure 34: Indicator template imported

Page | 18
6. Core Concepts
Core concepts refer to the social, economic, environmental and institutional principles that guide
national policy priority setting. There are 29 Global core concepts in the EPiC tool that all users
can refer to.
✓ The Global Core Concepts are available for every country and they cannot be changed
or edited.
✓ National Core Concepts can be created or edited by a user who has the role of
National_Framework_Manager for the country.
6.1. How to Add National Core Concepts
Step 1. To add a national core concept, click Core Concepts menu as indicated in Figure 35
above.
Step 2. When the list of core concepts is displayed, click Create New button located at the
top-left corner. This menu will only be visible to users with permission.
Step 3. You will be redirected to the Create New Core Concept window as indicated in Figure
36 below.
Figure 35: List of Global and National Core Concepts
Figure 36: Creating a National Core Concept

Page | 19
Step 4. Please type in the Title, Code and Description of the Core Concept and click Save.
Step 5. The new Core Concept will be added to the list, which will be arranged according to
the given code. You can click Edit icon to edit the Core Concept created.
Figure 37: New national Core Concept added

Page | 20
7. Reports
Once the inputs have been added, you can create an overall Progress Report on all available
policies from the Reports menu. You can also go to a particular policy and generate the reports
by phases, with Phase IV report being the Final Report (Refer to Policy report in Sections 9.3
and 9.4).
7.1 How to Generate Progress Report
Step 1. To generate a progress report, click Reports then Progress Report as shown in Figure
38 below.
Step 2. When you click Progress Report you will be redirected to the Report that is divided
into three sections, as seen in Figure 39 below. You can Download, Print or Bookmark
the report using action menus.
Figure 39: EPiC Progress Report
Figure 38: Creating an overall Progress Report

Page | 21
8. Administrations
Administration menu is only visible to users who have Administrator roles. The Administrator can
go to Users & Roles or Countries.
8.1. Users & Roles
From the Users & Roles menu, the administrator can create new users and assign roles as
appropriate.
Step 1. When Users & Roles is clicked, you will be redirected to the User’s List as indicated in
Figure 41 below.
Step 2. The Administrator can see all users who currently have access to the system. The
Administrator can also add a new user by clicking the Create New User button.
Step 3. When the Create New User is clicked, you will be redirected to the Create Profile page
as in Figure 42.
Figure 40: Administration sub-menus
Figure 41: User's List

Page | 22
Step 4. In the Create Profile page, provide the new user’s detail. You can also set the Country
of Scope the user is allowed to view.
Step 5. To edit user’s information, please click the name of the user from the screen shown in
Figure 41 above.
Step 6. From the Basic Details page for the selected user, you can reset password, lock user,
edit profile settings or delete user as shown in Figure 43.
Step 7. To set and/or change access level for the Country of Scope and assign roles to the user,
click Edit Profile Settings. You will be redirected to the Edit profile page displayed in
Figure 44 below.
✓ Country of Scope sets the country which the user is allowed to access and
can view the list of policies, the national and policy indicator frameworks and
generate reports. The user cannot be assigned to more than one country of
scope
Figure 43: User’s Basic Details page
Figure 42: Creating a new user

Page | 23
8.2. Countries
From the Countries menu, the Administrator can view and change the context of the country
information being shown. The Administrator can also view which users with access to the country.
✓ A user with the administrator role can change the country of scope from here and view
the details within that country of context.
✓ The four icons available at the last column gives the administrator differnet options to
directly go to the countries specific view as indicated in the figure.
Figure 44: Administrator - Edit Profile Settings
Figure 45: List of countries visible to the Administrator

Page | 24
9. Policies
From the Policies menu, a policy can be added to the system. After the policy is created, it goes
through four phases. Only users assigned to the phase will have access to the edit functions within
the corresponding phase.
9.1. Accessing a Policy
Step 1. From the top menu bar, select the Policies drop-down and click All, as indicated in
the Figure 46 below. From the sub menu, you can select a phase to view the policies
in the corresponding phase (click Phase I to view all policies in Phase I).
Step 2. Selecting All from the drop-down list, you will be redirected to the policies
page displayed in Figure 47 below. The page shows a list of all policies for the
country of context and their status. Instructions on creating new policies can be
found in How to start analyzing a new policy.
Step 3. If you select and open one of the policies, you will be redirected to Figure 48 below.
Figure 47: The Create New Policy button
Figure 46: Policies menu

Page | 25
Section 9.1. This section allows the user to navigate between the four phases within the
policy. You can go to a previous policy to view and read the details.
✓ As indicated in Figure 49 below, the arrows allow you to either move
to the next or previous phase depending on which phase you are at.
✓ When the phase name is displayed green, the policy you are viewing
is synced to the actual phase. If the phase is in red, you are viewing
other phases of the policy, and not the actual phase it is currently set
at.
✓ As indicated in Figure 50 above, you can click the reset icon any time
to return to the actual phase of the policy
Section 9.2. This section shows the particular policy reference number and policy title.
Section 9.3. This section shows which the country of scope you are currently viewing
and its details.
✓ The help icon below the country name is available at each stage of
the phases.
Figure 49: Changing policy phase to review
Figure 50: Phase names coloring description
Section 9.1
Section 9.4
Section 9.2
Section 9.3
Section 9.5
Figure 48: Main sections view of a policy at each phase

Page | 26
✓ When you click the help icon, it displays a window with details of
steps you will be undertaking at the corresponding phase.
Section 9.4. This section indicates the overall progress of the completed steps in the
policy.
Section 9.5. This section will display quick icons of the sub-menus associated with the
phases that allow users to move from one step to the next
9.2. How to start analyzing a new policy
Step 1. To initiate applying EPiC on a new policy, click Create New Policy menu from the
policies page. Note that the Create New policy menu is only available to users with
authorization.
Step 2. You will be redirected to the create policy page as indicated in Figure 53 below. Please
type in the Title and Description of the policy in the space provided click Save.
Step 3. Once a policy is created and saved, you will be redirected to Figure 54 below.
Figure 53: Creating a new policy to be analyzed
Figure 52: The Create New Policy button
Figure 51: Help icon available at each phase

Page | 27
Step 4. As indicated in Figure 54 above you can complete different actions detailed
below.
✓ You have the option to move the phases of the policy.
✓ At the bottom section, you can view the users who are given permission
to work on each phase. Users assigned the Policy_User_ Manager or
Administrator role can give permissions to other users to work at
specific phases by clicking Add User.
Step 5. When you have completed the actions, click Save to continue.
Step 6. A new policy will be added to the policies list as indicated in Figure 55 below.
Step 7. As indicated in Figure 55, there are edit options for each of the listed policies at the
end of the column.
Figure 55: New policy created
Figure 54: Detail view of newly created policy

Page | 28
Step 8. You can view the policy dashboard, edit or delete the policy. You can also view relevant
Indicators, outcomes, structures and IAs by clicking on the vertical ellipsis icon on the
right side of the screen.
Step 9. To start working on the policy you created, click on the reference number to open and
see the details.
Step 10. Every new policy will start at phase I. The phases every policy go through and each
associated steps.
9.2.1 Policy Overview and Dashboard
Step 1. At every phase of a policy, users can view/open the policy overview and the dashboard
pages.
Step 2. As indicated in Figure 56 below, users can access the policy overview on the left side
of the menu.
Step 3. When the dropdown icon is clicked it will display menus for the policy overview and
the dashboard of four phases.
Step 4. When the policy overview is clicked, it will open the detailed overview of a specific
policy
Step 5. If you open any of the four phase dashboards, a summarized graphical representation
will be shown for the completed steps in that specific phase. Figure 57 below shows
an example of what the phase dashboards will look depending on the phase selected.
Figure 56: Accessing the policy overview and dashboard pages

Page | 29
Phase I Dashboard
Phase II
Dashboard
Phase III
Dashboard
Phase IV
Dashboard
Figure 57: The dashboard pages for each of the four phases

Page | 30
9.2.2 Phase I: Preparation work for the Policy Review
The first phase of the EPiC tool focuses on understanding the policy/planning document and
identifying relevant components to be entered into the system, such as sections and sub-
sections, indicator framework and outcomes. Other information include relevant Global,
Regional and National indicator frameworks. This phase also requires a review of Core Concepts.
Step 1: Review Core Concepts
Here you will assign relevance criterion to all the Core Concepts in the EPiC tool to assess how
important they are to the planning/policy document. A universal list of Core Concepts will be
available for all users, and users may also add their own Core Concepts to best reflect the country
context. Follow the steps detailed below to review the core concepts.
Important: Users are required to use key questions associated to each CC and discuss in group
to fully understand the purpose of each CC prior to assigning relevance to them.
Step 1. To start, click Edit CC Relevance to review and select the relevance.
Step 2. From the list of core concepts, assign one of the four categories from the drop-down
to each Core Concept (Highly relevant, Relevant, A little relevant, Not relevant at
all) as in Figure 58 below.
Step 3. After assigning relevance, click Save on the right side of the window.
Step 4. A confirmation message will be displayed at the top of your screen.
Step 5. As indicated in Figure 59 below, a selected relevance level will be displayed with each
core concept.
Step 6. The number of core concepts with and without an assigned relevance value will be
displayed and updated on the panel. For instance, in Figure 59, 7 core concepts out
of 30 have been reviewed.
Figure 58: Phase I - Assigning relevance of CC with respect to the policy

Page | 31
Step 2: Policy Indicators
At this step the user can insert relevant policy indicators. Policy indicators are often provided in
outcome table or as a separate table in the annex of the policy document. The best place to find
policy indicators is the monitoring and evaluation (M&E) framework associated to the policy.
Step 1. To insert policy indicators in the policy, click Policy Indicator from the menus under
Phase I as indicated in Figure 60 below.
Step 2. Policy indicators can be manually added in this window or you can download and
import indicators using a template. (Refer to: How to download & Import templates).
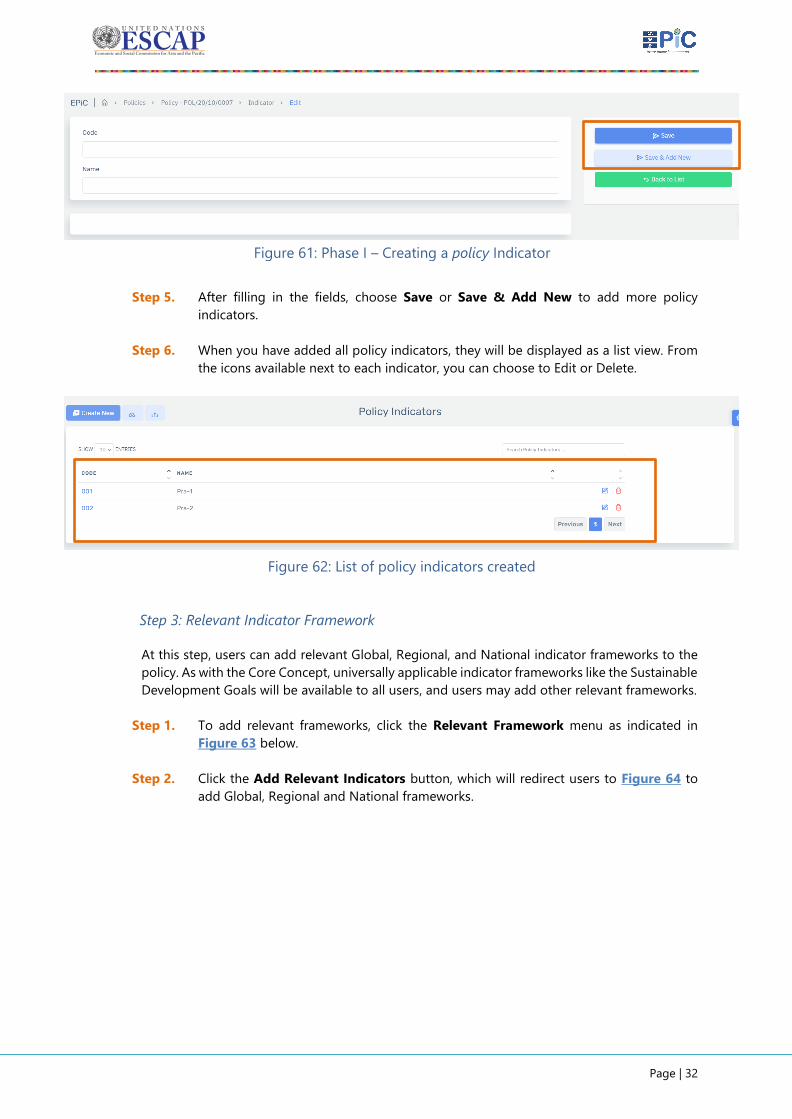
Step 3. As indicated in Figure 60 above, Create New button will redirect users to Figure 61
below.
Step 4. As required, type in the Code and Name of the policy indicator in the space provided.
Figure 60: Policy Indicator Window
Figure 59: Phase I - Relevance assigned to core concepts
Page | 32
Step 5. After filling in the fields, choose Save or Save & Add New to add more policy
indicators.
Step 6. When you have added all policy indicators, they will be displayed as a list view. From
the icons available next to each indicator, you can choose to Edit or Delete.
Step 3: Relevant Indicator Framework
At this step, users can add relevant Global, Regional, and National indicator frameworks to the
policy. As with the Core Concept, universally applicable indicator frameworks like the Sustainable
Development Goals will be available to all users, and users may add other relevant frameworks.
Step 1. To add relevant frameworks, click the Relevant Framework menu as indicated in
Figure 63 below.
Step 2. Click the Add Relevant Indicators button, which will redirect users to Figure 64 to
add Global, Regional and National frameworks.
Figure 62: List of policy indicators created
Figure 61: Phase I – Creating a policy Indicator

Page | 33
Step 3. You can choose to add a combination of frameworks by clicking the Global, Regional,
and National menus one by one and selecting check box next to the indicator code
under each framework. Users can also search relevant indicators by typing keywords
of indicator descriptions.
Step 4. After selecting all relevant indicators, please click the OK button.
Step 5. The selected indicators will be displayed as shown in Figure 65 below. To save and
continue to the next step, click Save.
Step 6. To add more indicators, click Add Indicator at the top-right corner as indicated in the
figure below.
Figure 64: Adding Relevant Indicator Framework
Figure 63: Relevant Indicator Frameworks window

Page | 34
Step 7. After adding and saving all the relevant indicators as shown in Figure 66 below,
indicators will be listed, based on their indicator framework category (i.e., Global,
Regional or National).
Step 4: Policy Structure
At this step the user may add a policy structure to trace the sources of policy information in the
document. The policy structure can contain just sections or could be more detailed and consist
of both sections and sub-sections. These navigational guides can help users to match entries in
the EPiC tool to the original policy document and closely assess the overall policy.
Step 1. To create the policy structure, click Policy Structure menu under Phase I as indicted
in Figure 67 below. Then click Create New button, which will redirect users to Figure
68.
Figure 65: Newly added relevant indicator frameworks
Figure 66: List of all relevant indicator frameworks added

Page | 35
Step 2. As shown in Figure 68, users are required to define the input as either a section or sub
section and type in the Title. To add a sub-section to the policy structure, you first
need to create the section.
Step 3. After typing the title and selecting the section you can choose Save or Save & Add
New to continue adding more policy structures.
Step 4. When you save you will be redirected to Figure 69 below. The policy structure created
will be displayed as a list view.
Step 5. As indicated in Figure 69, you can choose to add a sub-section for any of the policy
section by clicking the + plus icon.
Figure 67: Policy Structure window
Figure 68: Creating a policy structure
Figure 69: List of policy structures

Page | 36
Step 5: Outcomes
This is the last step of Phase I. At this step the users can add outcomes of the policy document.
Outcomes refer to descriptions of what the policy is trying to achieve and often include a
measure of achievement. All outcome entries can be added to the section or sub-section of the
policy. When the policy has several levels of desirable achievements (such as outcomes, sub-
outcomes, etc), only the last and most detailed level needs to be entered as “outcomes.”
Step 1. To add outcomes, click Outcome menu under Phase I as indicated in Figure 70 below.
You can add the outcomes by clicking Create New button or the + icon next to each
section or sub-section of the policy structure.
Step 2. When Create New/Add Outcome is clicked, you will be redirected to Figure 71 below.
Type the outcome in the space provided and check that it is under the correct policy
section or sub-section.
Step 3. Once you filled in the Name field of the outcome, click Save or click Save & Add to
continue. ‘
Step 4. All outcome entries will be displayed as shown in Figure 72 below.
Figure 70: Outcomes window
Figure 71: Creating an Outcome

Page | 37
Step 5. Now that you have completed the last step for Phase I, you will need to move the
policy to Phase II. A notification will appear on top of the window when the phase is
successfully moved and changed. Please refer to How to Move a policy to the next
phase for more details.
9.2.3 Phase II: Data entry of the Policy
The second Phase of the EPiC is designed for users to capture the key issues (or, Issues for Action:
IA) in the document: priority issues which the policy is aiming to address, that require action. These
IAs are generally located in the narrative of the document under a heading such as “Sector
Constraints”, “Key Development Issues”, etc, but aren’t always easy to identify. To tackle this
situation, the EPiC user is initially asked to enter as best as possible each Issue for Action within
each broad section of the policy document.
Important: The IAs can also be identified in the logframe of the policy document, so be sure to
check this part of the document as well when undertaking this step.
Step 1: Initial IA
At this step the user identifies the key issues in the Policy referred to as Issues for Action, which
form the basis for developing a strong indicator framework to monitor the policy. IAs can be
extracted from the policy narrative and/or log frame (results matrix) of a given plan or strategy
and added to EPiC as initial IAs.
Step 1. To enter the Initial IA, click the Initial IA menu under Phase II as indicated in Figure
73 below. Then click Create New button, which will redirect the users to Figure 74.
Figure 72: List of outcomes created for the policy structures
Figure 73: Initial IAs window

Page | 38
Step 2. Users only need to provide the Title of the IA. To add more IAs, click Save & Add
New. When you have added all the IAs click Save.
Step 3. Once the IAs have been added they will be displayed as shown in Figure75 below.
Step 2: Consolidated IA
The second step of Phase 2 asks the EPiC user to simplify the list of initial IAs by consolidating
them. The consolidation process removes duplication and reformulates the language to sharpen
the description of the final set of IAs addressed by the policy. For each consolidated IA, users
specify the corresponding reference population and target groups from the document, for which
suggestions are also provided in the system.
A number of outcomes can occur at this step which include:
1. Merging 2 or more initial IAs into one consolidated IA if it is felt they are addressing a
similar issue
2. Modifying the language of the initial IA to better describe the issue being addressed
3. Leave the initial IA as is, and convert to a consolidated IA
Important: all initial IAs need to be converted to consolidated IAs, so one of the three options
above must be applied to each.
Another important part of the consolidation process is to identify for each consolidated IA, a
reference population and target group(s). Identifying these groups can improve the
inclusiveness of a policy and create demand for disaggregated statistics. The reference
population refers to the overall population being addressed or impacted upon by the issue
requiring action, and could include “All persons in the country”, “Primary schools”, “Health Care
Facilities”, and so forth.
Figure 75: List of all the initial IAs added
Figure 74: Adding Initial Issues for Action

Page | 39
Target groups on the other hand, are subsets of the reference population which may require
specific focus due to their vulnerability or general importance to the issue at hand. These target
groups may be explicitly specified or implied in the policy document. The EPiC user is also given
the opportunity to make a recommendation for additional target groups (i.e., if it is not
referenced in the policy document).
While it is generally preferable to enter each reference population and all relevant target groups,
users can enter “N/A” in the fields when a reference population or level of disaggregation is
irrelevant or not applicable to the issue.
Step 1. To start consolidating, click Consolidate IA menu under Phase II as indicated in Figure
76 below. Then click IAs Still to be Consolidated menu.
Step 2. To start consolidation, click IAs Still to be Consolidated button.
Step 3. As indicated in Figure 77 below the list of unconsolidated Initial IAs will be displayed.
Step 4. From the list of unconsolidated IAs, please select and click the check boxes next to the
IAs that are related and can be consolidated.
Step 5. After selecting the IAs to be consolidated, click Create Consolidate IA as indicated in
Figure 77.
Step 6. You will be redirected to Figure 78 below to provide a description for the
consolidated IAs.
Figure 77: List of Unconsolidated IAs
Figure 76: Consolidate IA Window

Page | 40
Step 7. As in Figure 78, you can Add Target Groups in Doc (document) and/or
Recommended Target Group by clicking the Add menu next to each field.
Step 8. The Select Target Group window shown in Figure 79 below will be displayed. From
the displayed list choose all applicable target groups and click OK
Step 9. As shown in Figure 80 below, selected target groups will be displayed. At this point
you can also match the Outcome and Reference Population to the Consolidated IA.
Step 10. To add more Initial IAs to this consolidation, click Add Initial IA button as in Figure 80
below.
Step 11. When you have finished providing entries for this Consolidated IA, click on Save to
continue.
Figure 78: Adding additional meta data to the consolidated IA
Figure 79: Adding Target Groups in Doc and/or Recommended Target Group

Page | 41
Step 12. After all IAs have been consolidated, the final displayed view will be as shown in Figure
81 below. Users can quickly assess the status of consolidated IAs with icons and choose
edit or delete options.
Step 13. In the OUTCOME column
✓ The green check mark indicates that IAs are consolidated with a corresponding
outcome.
✓ The yellow cross mark indicates that IAs are consolidated, without any
associated outcomes.
Step 14. In the # IAs column, users can track how many initial IAs has been associated and
added to a given consolidated IA
Step 15. In the STATUS column, three dots represent Reference Population, Target Group in
Doc and Recommended Target, respectively.
✓ If you have added Reference Population, Target Group in Doc and
Recommended Target Group when consolidating IAs, the icon will be displayed
as green. If no entries have been made, the icon will be displayed as grey.
Step 16. To add more consolidated IAs and add descriptions, please repeat steps 3 to 11.
Figure 80: Save a consolidated IA after adding description
Figure 81: List of all consolidated IAs

Page | 42
Step 3: IA/CC Mapping
At this step users are expected to revisit core concepts and map them to the consolidated IAs
identified in the policy document. This is to delineate which principles are of most relevance to
the issue at hand and the resulting outcome is what the EPiC Tool refers to as an “IA/CC
Combination.”
The user is required to tackle each consolidated IA one at a time, reviewing each of the 29 CCs
against it to ascertain whether the CC is significantly applicable to that IA – those of relevance
are selected.
Whilst more than one CC could be relevant to each consolidated IA, users should refrain from
selecting too many CCs. It is not expected that more than 3 or 4 CCs should be selected for any
consolidated IA.
Step 1. To start mapping IAs to CCs, click IA/CC Mapping menu under Phase II as in Figure
82 below.
Step 2. The list all consolidated IA’s and CC combinations will be displayed. If users have not
completed this step, the list will display the status in red, as NOT MAPPED YET.
Step 3. To start mapping, click the Edit IA Mapping icon.
Step 4. When Edit IA Mapping is clicked for each consolidated IA, you will be redirected to
Figure 83 below. Click Add Core Concept.
Step 5. The Select Core Concept window will be displayed as shown in Figure 84 below.
Figure 82: IA/CC Mapping Window
Figure 83: Adding Core Concepts to be mapped to the IAs
Page | 43
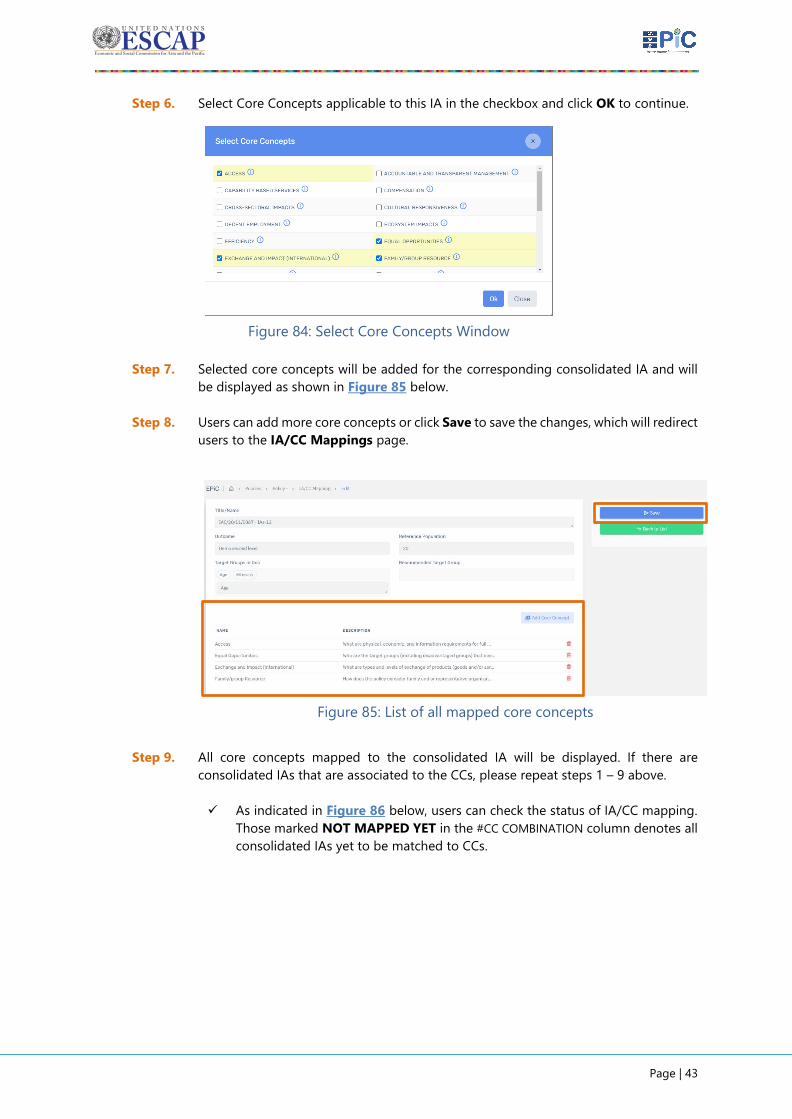
Step 6. Select Core Concepts applicable to this IA in the checkbox and click OK to continue.
Step 7. Selected core concepts will be added for the corresponding consolidated IA and will
be displayed as shown in Figure 85 below.
Step 8. Users can add more core concepts or click Save to save the changes, which will redirect
users to the IA/CC Mappings page.
Step 9. All core concepts mapped to the consolidated IA will be displayed. If there are
consolidated IAs that are associated to the CCs, please repeat steps 1 – 9 above.
✓ As indicated in Figure 86 below, users can check the status of IA/CC mapping.
Those marked NOT MAPPED YET in the #CC COMBINATION column denotes all
consolidated IAs yet to be matched to CCs.
Figure 84: Select Core Concepts Window
Figure 85: List of all mapped core concepts

Page | 44
Step 4: IA/CC Combination
At this step users can add indicators to the IA/CC combination. For each IA/CC Combination, the
user is required to review the indicator lists considered relevant to the policy document; ) Those
entered from the policy document itself and ii) Additional National, Regional and Global
indicator frameworks considered relevant. The user then selects all those indicators on these
lists which could be appropriate in monitoring progress against each IA/CC Combination.
If an indicator is not necessary for monitoring progress against an IA/CC Combination, the user
will have the option to indicate this, and provide a reason. There will be instances where no
indicator can be identified from the indicator lists being reviewed – this is fine – it just means
more thought needs to be given to potential indicators which could monitor that issue in Phase
4.
At this step, users can still add details to (or edit) the Reference Population and Target Groups
associated with the consolidated IA. In particular, it may be the case that after adopting
indicators for IA/CC combination, new target groups appear to be necessary. This will enhance
the disaggregation requirements for indicators.
Step 1. To review and develop the IA/CC combination, click IA/CC combination menu under
Phase II
Step 2. As shown in Figure 87, you can choose to view the IA/CC combination list By IA/ By
Core Concept.
Step 3. Click Add/Created Indicator icon indicated in Figure 87 to map indicators to the
IA/CC combination.
Figure 86: Consolidated IAs mapped with and without Core Concepts

Page | 45
Step 4. When the IA/CC combination window is displayed as shown in Figure 88 below, select
Yes or No for Is Indicator Necessary to proceed to associated steps:
Step 4.1. If you selected Yes, you will be redirected to the Select Indicator
Window in Figure 89.
Figure 87: IA/CC combination window
Figure 88: IA/CC combination Adding Indicators
Figure 89: Select Indicator window

Page | 46
Step 4.1.1. Choose Regional, Global, National or Policy to browse and select
relevant indicators.
Step 4.1.2. You can check the box and add indicators from a combination of
frameworks. Click OK after selecting all relevant indicators.
Step 4.2. If you have selected No, add a reason for not having an indicator as
indicated in Figure 90.
Step 5. After adding all indicators and clicking the Ok button, indicators will be displayed as
in Figure 91.
Step 6. To add more indicators click Add indicator or click Save to change the changes.
Step 7. In Figure 92 below you can see the list of IA/CC combinations mapped to the indicator
frameworks. The IA/CC combinations not yet mapped will have a warning display icon
and a message in the tooltip.
Step 8. As shown in Figure 92 below, columns G, R, N, P distinguish the number of indicators
added from Global, Regional, National and Policy indicator frameworks, respectively.
Step 9. Before moving on to the next step, make sure to map at least one indicator to each
IA/CC combination.
Figure 90: Add a reason for not having indicators
Figure 91: List of added indicators to IA/CC combination grouped according to their framework

Page | 47
Step 10. Now that you have completed the last step for Phase II, you can move the policy to
Phase III. Please refer to How to Move a policy to the next phase for more details.
9.2.4 Phase III: Review of Policy Coverage
The third Phase of the EPiC tool will review the outcomes of Phase 1 and Phase 2 from a policy
coverage perspective, which will allow users to assess how well the issues are aligned to
outcomes and core concepts. From this assessment, users will be able to refine the coverage of
the policy document and add new Issues for Action and their corresponding Target Groups that
may have been overlooked.
Step 1: CC Coverage Review
At this step, users can assess the coverage of Core Concepts by reviewing their association with
and alignment to the consolidated IAs. Users can check the frequency count of “Core Concepts”
mapped to “Issues for Action” and assess if the frequency distribution is in line with the
relevance. For instance, highly relevant CCs can be expected to have more IAs than those with
lower or no relevance.
If a “highly relevant” or “relevant” CCs has not been mapped to many (or even any) of the IA/CC
combinations identified in the policy document, it raises a flag that policy issues relevant to that
Core Concept may have been overlooked in the document. The user is then required to consider
if new key policy issues associated with that Core Concept should be addressed in the document
and enter these as a new IA in the EPiC Tool.
Step 1. To start reviewing the core concept coverage, click CC Coverage Review menu under
Phase III as indicated in Figure 93 below. A list will display core concepts and
associated IAs.
Figure 92: List of the IA/CC combinations after indicator have been added

Page | 48
Step 2. As indicated in Figure 93 above, you check the relevance of CCs and number of
associated IAs.
Step 3. When ‘view the list of IAs’ is clicked, the list of IAs will be displayed as shown in Figure
94 below.
Step 2: Review Indicators
In this step, users review the indicators which have and have not been mapped to IA/CC
combinations. If we recall in Phase 1 we firstly uploaded the indicators presented in the Policy
Document and secondly identified relevant indicators from other indicator frameworks. Now,
we would expect that those indicators are most likely mapped to the consolidated IAs identified
in the policy document.
When this does not occur, it raises a flag that policy issues associated with those indicators may
have been overlooked. The user is then required to consider if new key policy issues associated
with that Indicator should be addressed in the document and enter these as a new IA in the EPiC
Tool.
Figure 93: Core Concept Coverage Review window
Figure 94: List of IAs

Page | 49
Step 1. To review indicator coverage, click Review Indicators menu under Phase III as in
Figure 95.
Step 2. You can review indicators from All indicator frameworks or select appropriate levels.
Step 3. As in Figure 96 below, red icons denote indicators not associated with any IA/CC
combination and green icons will denote indicators with associated IAs and redirect
users to the list of IAs.
Step 4. For indicators not associated to any IA/CC combination, you can Create New IA as in
Figure 96.
Step 5. When create new IA is clicked for a specific indicator, as in previous steps you have to
Create the IA then Add Core Concept and Add the indicators to the IA/CC
combination.
Figure 96: Viewing and Reviewing list of indicators with/without associated IAs
Figure 95: Review Indicator Frameworks window

Page | 50
Step 6. IAs added at this review phase will be categorized as PROPOSED.
Step 3: Review Outcomes
In the final step, users are required to assess the coverage of the policy document by reviewing
the list of outcomes presented in the policy document and address those which have not been
mapped to any consolidated IA. All outcomes specified in the policy document, should be
addressing some key policy issue (IA). So, if some outcomes aren’t mapped to an existing
consolidated IA then the user is required to develop an IA description for that outcome and add
it to the EPiC Tool.
Similarly, every consolidated IA should ideally have an outcome associated with it. If not, user is
required to enter an outcome into the EPiC Tool, and have this mapped back to the consolidated
IA without outcome.
Step 1. To review an outcome, click Review Outcome menu under Phase III as indicted in
Figure 99 below.
Step 2. For Outcomes without any IAs, an instruction to Add IA To This Outcome will appear,
and when clicked, a message in a red pop-up window will further indicate that IAs are
not associated with an outcome, as below.
Figure 98: IAs created on Phase III will display as PROPOSED
Figure 97: Creating a new IA on phase III

Page | 51
Step 3. For Outcomes missing IAs, you can propose a new IA by clicking the Create New IA
icon in Figure 99. As in the previous phase, Add Core Concept and Add Indicators
to the IA/CC Combination.
Step 4. When you have reviewed all outcomes, you can view each outcome in a
comprehensive list, with an option to view which corresponding IAs are mapped, as
indicated in Figure 101 below.
Step 5. Now that you have completed the last step for Phase III, you can move the policy to
Phase IV. Please refer to How to Move a policy to the next phase for more details.
Figure 99: Review Outcomes window
Figure 100: List of IAs with no outcome
Figure 101: Viewing the list of outcomes and mapped IAs

Page | 52
9.2.5 Phase IV: Review of Indicator Framework
The fourth and final phase of the EPiC process focuses on fine tuning and thus finalizing the
indicator framework which will monitor the progress of all key issues addressed in the
policy/strategy document.
Step 1: Review IA/CC combination
The fourth and final phase of EPiC will allow users to fine-tune the indicator framework by
reviewing and refining the choice of indicators and target groups for each IA/CC Combination.
Users will also be required to review, and revise where necessary, the target groups for
disaggregation. When finalizing the choice of indicators, a couple of key scenarios exists for
those cases where an indicator is required:
1) The IA/CC Combination has a suitable indicator suggestion from the mapping already
identified, in which case this indicator may be adopted
2) The IA/CC Combination has either no indicator suggestions from the mapping, or the
suggestions are not considered satisfactory, in which case a newly proposed indicator
needs to be suggested or reasons for its absence can be provided.
The second part of the step is finalizing the target groups, which will in turn become the “levels
of disaggregation” required for the final selected indicators. The user will need to review what
has been suggested already in Phases 2 and 3 and make a final decision of what target groups
should be adopted. This will entail selecting from the proposed target groups already suggested
but could also involve adding a further target group if felt necessary. When the review is
complete with inputs from relevant stakeholders, users can approve the IA/CC Combination and
finalize the indicator framework.
Step 1. To Review IA/CC combination in Phase IV, you will be automatically redirected to
Figure 102 below. You can choose to view the comprehensive IA/CC combination list
either By IA or By Core Concept.
Figure 102: Review IA/CC combination window
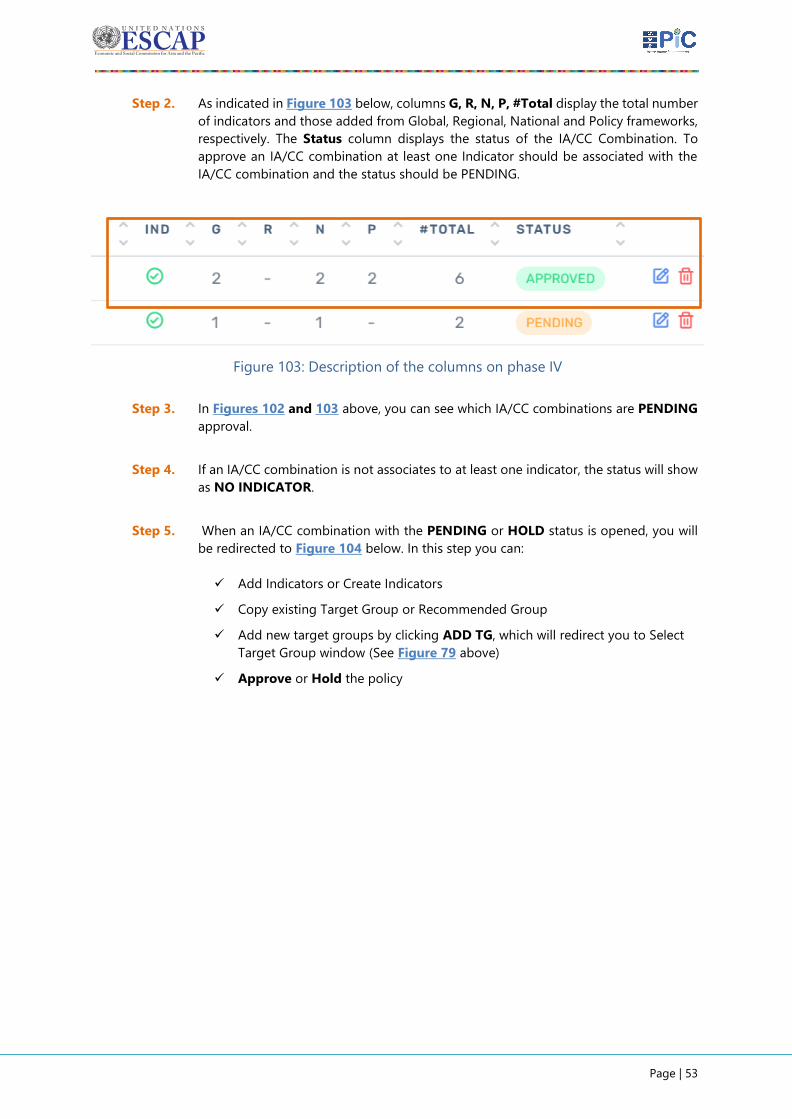
Page | 53
Step 2. As indicated in Figure 103 below, columns G, R, N, P, #Total display the total number
of indicators and those added from Global, Regional, National and Policy frameworks,
respectively. The Status column displays the status of the IA/CC Combination. To
approve an IA/CC combination at least one Indicator should be associated with the
IA/CC combination and the status should be PENDING.
Step 3. In Figures 102 and 103 above, you can see which IA/CC combinations are PENDING
approval.
Step 4. If an IA/CC combination is not associates to at least one indicator, the status will show
as NO INDICATOR.
Step 5. When an IA/CC combination with the PENDING or HOLD status is opened, you will
be redirected to Figure 104 below. In this step you can:
✓ Add Indicators or Create Indicators
✓ Copy existing Target Group or Recommended Group
✓ Add new target groups by clicking ADD TG, which will redirect you to Select
Target Group window (See Figure 79 above)
✓ Approve or Hold the policy
Figure 103: Description of the columns on phase IV

Page | 54
Step 6. When an IA/CC combination with the NO INDICATOR status is opened, you will be
redirected to Figure105 below.
Step 7. You can select Yes or No to the field ‘Is Indicator Necessary’ for a given IA/CC
combination. if you select Yes, you will need to Add Indicators or Create Indicator
Step 7.1. When Add Indicators is selected, the Select Indicator window will open, as
in Figure 106.
Figure 104: Reviewing an IA/CC combination with status PENDING
Figure 105: Reviewing an IA/CC combination with status NO INDICATOR
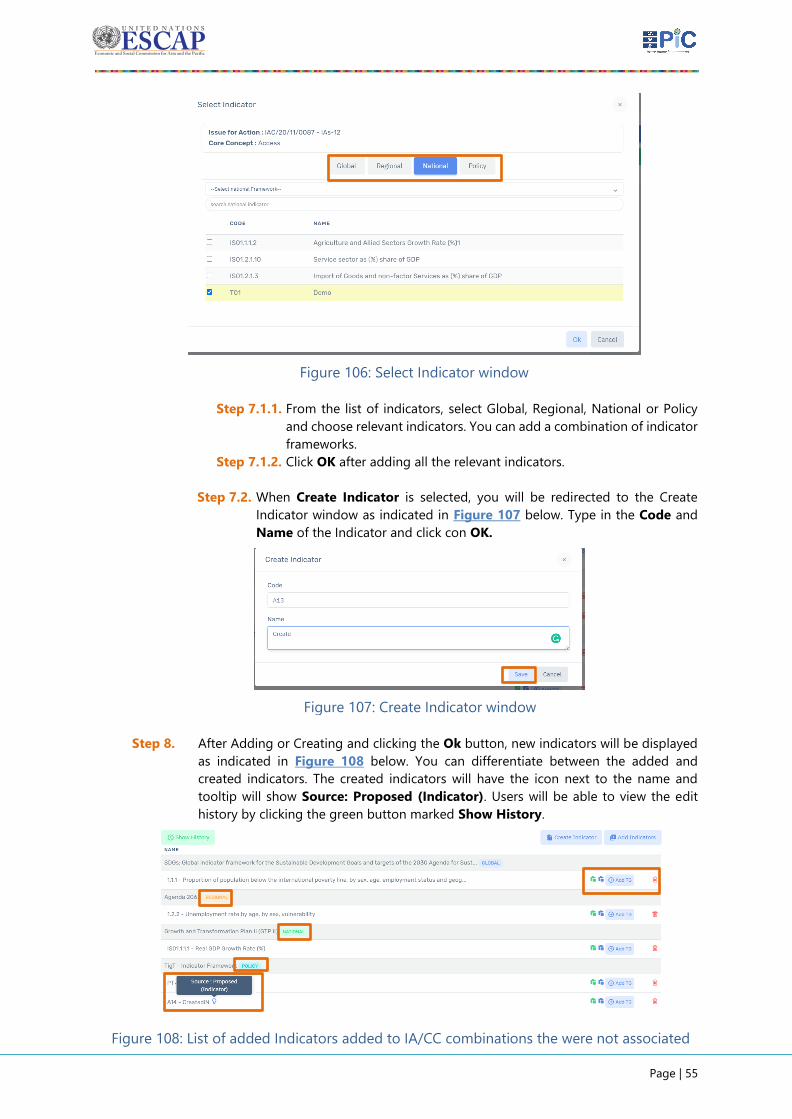
Page | 55
Step 7.1.1. From the list of indicators, select Global, Regional, National or Policy
and choose relevant indicators. You can add a combination of indicator
frameworks.
Step 7.1.2. Click OK after adding all the relevant indicators.
Step 7.2. When Create Indicator is selected, you will be redirected to the Create
Indicator window as indicated in Figure 107 below. Type in the Code and
Name of the Indicator and click con OK.
Step 8. After Adding or Creating and clicking the Ok button, new indicators will be displayed
as indicated in Figure 108 below. You can differentiate between the added and
created indicators. The created indicators will have the icon next to the name and
tooltip will show Source: Proposed (Indicator). Users will be able to view the edit
history by clicking the green button marked Show History.
Figure 107: Create Indicator window
Figure 106: Select Indicator window
Figure 108: List of added Indicators added to IA/CC combinations the were not associated

Page | 56
Step 9. In Figure 108 above, icons next to each indicator will allow users to add target groups.
As shown in Figure 109, users edit Target Groups
Step 9.1. The green icon will copy and add all Target groups entered in previous
phases to the final target group.
Step 9.2. The blue icon will copy and add all Recommended target groups entered
in previous phases to the final target group.
Step 9.3. You can also click ADD TG, to add to the final target group.
Step 10. To save the changes, click Save from the screen shown in Figure 105 above. The status
will change to PENIDNG.
Step 11. If the review on a given IA/CC combination is complete, you can choose to Hold or
Approve the combination. When either option is selected, you will be prompted with
a confirmation window. Click OK to continue.
Step 12. Repeat the steps above to review and finish for each IA/CC combination.
9.3. How to Move a policy to the next phase
Step 1. To move the phases, click on the policy reference number found at the top as in Figure
111 below.
Figure 109: Options to add target groups to the final target group
Figure 110: Confirmation prompt window for Approve or Hold IA/CC combination
Figure 111: Policy reference number

Page | 57
Step 2. When the policy reference number is clicked, you will be redirected to the policy edit
page.
Step 3. As indicated in Figure 112 below, you can choose the Phase in the Move Policy To
section. Depending on the current phase, you can move the policy to the previous or
next phase.
Step 4. When you move the phase, you will be prompted to confirm the change. Click Ok to
continue.
9.4. How to Generate Output Report for a Policy
Step 1. To generate an output report at the policy level, go to the Policies menu and select a
policy to generate the report for.
Step 2. After you have opened the policy, click on the Reports menu. As indicated below,
additional report sub-menus for each phase will be displayed. Choose the phase you
wish to create a report for.
Figure 112: Edit policy page
Figure 113: Confirmation window for moving a policy to the next or previous phase
Figure 114: Report sub-menus available for each phase

Page | 58
Step 3. If you select reports for Phase I/ Phase II/Phase III, each phase option will generate
a unique phase output report. As indicated in Figure 115 below, users can access
output reports of each phase. Outputs associated with the phase can be viewed
separately or downloaded all in one-go.
Step 4. Users can select individual outputs (e.g., 1.0, 2.0 and 3.0). For instance, Figure 116
below displays the report generated when 1.2 from Phase I Output Reports is clicked.
Figure 115: Phase I, Phase II, Phase III output reports that can be generated
Figure 116: Phase Report for Individual Outputs

Page | 59
Step 5. When Phase VI (Final Report) sub-menu is selected, a final comprehensive summary
report for the policy will be generated. The report includes graphical representation
and table summary of the outcomes of all four phases. All elements of the table are
interactive.
Figure 117: Phase IV - Final report generated for a policy

Page | 60
Step 6. To save the report as a PDF file, click Save PDF located at the top-right corner in Figure
116.
Step 7. You will be redirected to Figure 118 below.
Step 8. Before you save please make sure the Destination field is set to Save as PDF by clikcing
the drop-down, as it might be set to the default printer name you commonly use.
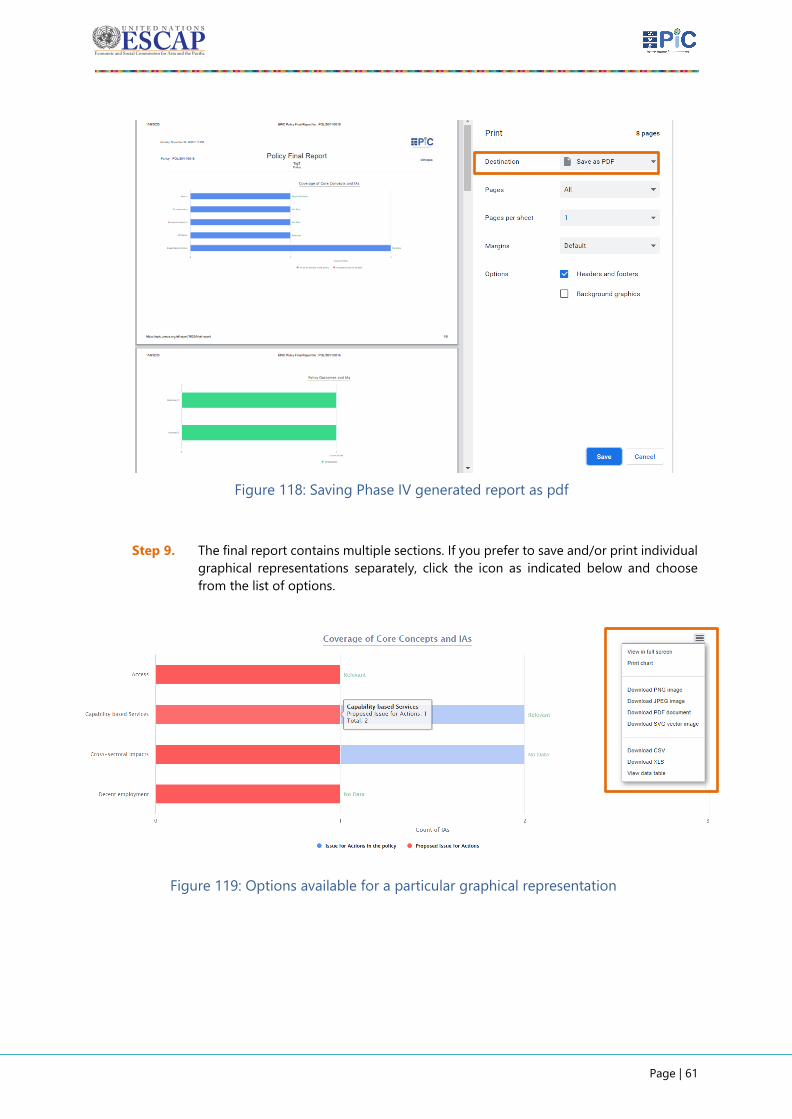
Page | 61
Step 9. The final report contains multiple sections. If you prefer to save and/or print individual
graphical representations separately, click the icon as indicated below and choose
from the list of options.
Figure 118: Saving Phase IV generated report as pdf
Figure 119: Options available for a particular graphical representation