eoslt consortium biomass co-firing - ecn · eoslt consortium biomass co-firing. wp 4 - biomass...
TRANSCRIPT

EOSLT Consortium Biomass Co-firingWP 4 - Biomass co-firing in oxy-fuel combustion
Part II: Ash deposition modelling of coal and biomass blends under air and oxygen combustion
conditions M. Glazer
C.I. Bertrand L. Fryda
W. de Jong
ECN-E--10-077 JULY 2010

Acknowledgement/Preface The research work reported in this report was carried out in the frame of EOSLT Consortium Biomass Co-firing with partial financial support from the two RFCS projects: RFCR – CT – 2006 – 00010 (BOFCOM) and RFCR-CT-2007-00009 (ECOSCRUB). Abstract An ash deposition modelling study based on the experimental results presented in Part I of this report is presented using the Ash Deposition Predictor (ADP) developed and implemented jointly by TUDelft and ECN. The numerical simulations were performed to answer open questions related to the deposition phenomena for coal and biomass blends and to illustrate any differences between atmospheric combustion conditions and the oxy-fuel combustion. The input data for the model were the series of deposition tests performed under atmospheric and oxyfuel conditions carried out at ECN, described in Part I. During the code validation step, the ADP tool predicted higher deposition ratios for higher viscosity values, in line with literature findings. In addition, the higher calculated fouling index for the lignite coal and blends and as a result the higher fouling propensity are in agreement with the simulation results and the experimental findings for these fuels. A sensitivity analysis on selected code parameters revealed the influence of the PSD on the results generated by the code and in specific on the deposition ratios. The calculations are sensitive to the particle size (PSD) of the collected ashes. In was finally concluded that increased deposition ratios were predicted by the ADP under oxyfuel conditions in comparison to the standard air combustion conditions, while all the other parameters (PSD, viscosity) were kept constant. This result is in agreement with the observed experimental results. However further research is still needed in this respect in (1) further developing the code and (2) the validation of the code.
2 ECN-E--10-077

Contents
List of tables 4
List of figures 4
Nomenclature 5
Summary 6
1. Introduction 8 1.1 Scope of the work 8 1.2 The Ash Deposition Predictor (ADP) 8 1.3 Lab Scale Combustor Simulator (LCS) 9
2. Numerical simulations and settings 11 2.1 Modelling with CFD - key settings – CINAR 12
2.1.1 Calculation domain 12 2.1.2 Input parameters for CINAR 12 2.1.3 Oxy-fuel and Air flows per ports 13 2.1.4 Temperature profile 13
2.2 ADP 14 2.2.1 Simulation programme 14 2.2.2 Particle trajectory and the deposition process 14 2.2.3 Fuels 16
3. Results and discussion 18
4. Sensitivity analysis 22 4.1 Sensitivity analysis on the influence of the Particle Size Distribution 22 4.2 Sensitivity analysis on the influence of the OXY/AIR conditions for a
selected fuel 23
5. Conclusions and recommendations 25
References 26
Appendix A Other CINAR settings OXY-FUEL 28
Appendix B Temperature profiles CINAR 29
Appendix C ADP – parameters 30
Appendix D Other settings ADP 31
Appendix E Ash properties 32
ECN-E--10-077 3

List of tables
Table 2.1 Simulation CFD CINAR – input for ADP, two environment conditions have been simulated as input for ADP ....................................................................................... 12
Table 2.2 Gaseous feed composition - oxyfuel (methane, oxygen and carbon dioxide flows) . 13 Table 2.3 Gaseous feed composition - air (methane, oxygen and nitrogen flows) ................... 13 Table 2.4 Simulation cases for the Ash Deposition Predictor ................................................... 14 Table 2.5 Proximate and ultimate analysis of Russian coal, cocoa, lignite and olive residues 17 Table 3.1 Deposition ratios for certain viscous elastic properties NBO/T of the deposited
ash and the PSD ....................................................................................................... 18 Table 3.2 Particle Size Distribution and the basic to acidic oxides ratio together with the
NBO/T and the deposition ratio for the Russian coal/Lignite and their blends ......... 20 Table 3.3 Fouling index and the deposit ratio for the Russian coal/Lignite and their blends.... 21 Table 4.1 Original and modified deposit ratios for the Russian coal and its blends ................. 22 Table 4.2 Deposition ratios for lignite tested under OXY/AIR conditions for cases 1 (upper
two rows) and 2 (lower two rows) ............................................................................. 23
List of figures
Figure 1.1 General structure of the Ash Deposition Predictor ..................................................... 9 Figure 1.2 Laboratory Combustion Simulator at ECN ................................................................ 10 Figure 2.1 Cases modelled ........................................................................................................ 11 Figure 2.2 Numerical mesh – CINAR – deposition probe opening ............................................ 12 Figure 2.3 The LCS axial temperature profile as function of the distance from the burner ....... 13 Figure 2.4 Ash Deposition Predictor – particle flow visualized by Tecplot, upper left corner –
the computational domain with the particles injected, upper right – the numerical mesh in vicinity of the probe, lower left - a particle approaching the probe, lower right – the deposit build-up and its thickness ............................................................ 16
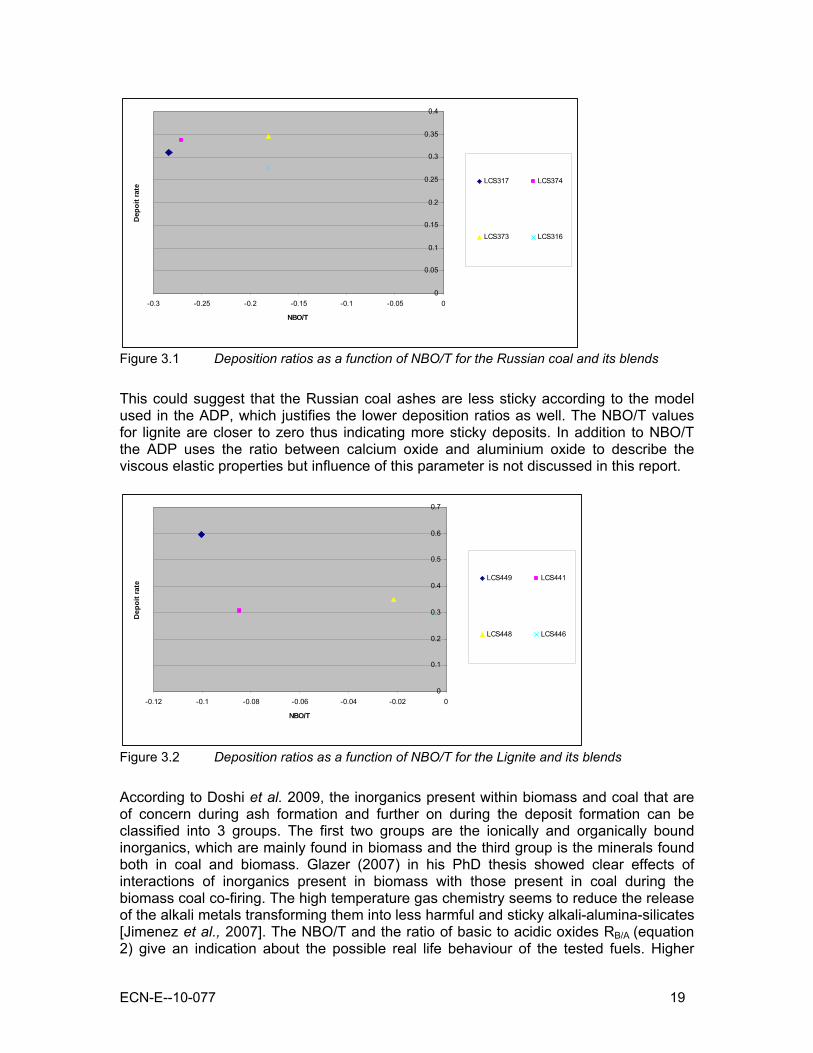
Figure 3.1 Deposition ratios as a function of NBO/T for the Russian coal and its blends ......... 19 Figure 3.2 Deposition ratios as a function of NBO/T for the Lignite and its blends ................... 19
4 ECN-E--10-077

Nomenclature
u v w P T ρ μ DR NBO/T PSD RB/A Ff
velocity x-axis (m/s) velocity y-axis velocity z-axis pressure (Pa / m−1·kg·s−2) temperature (K) density of a gas (kg/m3) viscosity of gas (1P = 1 g·cm−1·s−1) Deposition Ratio (-) parameter describing viscous elastic properties of particles (-) Particle Size Distribution Ratio of Basic to Acidic oxides Fouling factor (Km2)/W
ECN-E--10-077 5

Summary
The Carbon Capture and Sequestration technologies combining coal/biomass co-combustion under oxyfuel conditions are gaining attention in the last years. This is due to the high CO2 concentration flue gas streams achieved in this way and the sustainable aspect of biomass use. The produced CO2 can be sequestered and stored. The high O2/CO2 concentrations used for oxyfuel combustion raises questions on the combustion quality (flame, flows, char burnout, corrosion, ash formation and deposition) and heat transfer behaviour when applied to industrial installations. The deposit formation under atmospheric combustion conditions has been subject to numerous investigations and studies and experimental data have identified several chemical and physical processes that control the deposition process. These are inertial impaction, turbulent diffusion, thermophoretic attraction, vapour condensation and heterogeneous reaction between ash particles and deposition surfaces. Previous work on combustion of biomass fuels, especially straw, has revealed challenging issues linked to the formation of submicron aerosols particles, deposits, corrosion and emissions linked in most of the cases to the chemical composition but also to the boiler/combustion characteristics itself. An ash deposition modelling study has been carried out using the Ash Deposition Predictor (ADP) developed and implemented jointly by TUDelft and ECN. The numerical simulations were performed to answer questions related to the deposition phenomena for coal and biomass blends and to illustrate any differences between atmospheric combustion conditions and the oxy-fuel combustion giving insight into the reasons for the observed differences. In order to provide input data for the model, a series of deposition tests performed under atmospheric and oxyfuel conditions were carried out at ECN, described in Part I of this report. The ADP is a numerical tool which post-processes the data originating from the CFD based modelling of the boiler. The post-processor is an independent particle tracking code which includes inertial impaction, thermophoretic attraction and dynamic reaction of particles on surfaces in order to predict the location of the deposited ash, the growth of the deposit, its characteristics and the impact on heat transfer performance for a given combination of fuel and operating conditions. During the validation stage of the modelling tool, the ADP predicted more ash deposited for the lower NBO/T (higher viscosity) values which is in agreement with the literature. The higher fouling index for the lignite coal and blends and as a result higher fouling propensity is in agreement with the simulation results and the experimental findings for these fuels. The calculations seem to be sensitive to the particle size (PSD) of the collected ashes as the results reveal. A sensitivity analysis of selected code parameters revealed the influence of the PSD on the results generated by the code and in specific, on the deposition ratios. As final conclusions, increased deposition ratios were predicted by the ADP under oxyfuel conditions in comparison to the standard air combustion conditions, while all the other parameters were kept constant. This result is in agreement with the observed experimental results. However, more work is needed in this respect in (1) further developing the code and (2) the validation of the code.
6 ECN-E--10-077

ECN-E--10-077 7

1. Introduction
The Carbon Capture and Sequestration technologies and in specific, coal/biomass co-combustion under oxyfuel conditions is gaining more and more attention in the last years. This is due to the high CO2 concentration flue gas streams achieved in this way. The produced CO2 can be sequestered and stored [Jordal et al., 2005]. The high O2/CO2 concentrations used for oxyfuel combustion raises questions on the combustion quality (flame, flows, char burnout, corrosion, ash formation and deposition) and heat transfer behaviour, when applied to industrial installations. Especially the coal biomass co-firing under oxy-fuel conditions and subsequent deposit formation is not yet well understood. The deposit formation under atmospheric combustion conditions has been subject to numerous investigations [Joller et al., 2007; Hindiyarti et al., 2007, Zheng et al., 2006, Fryda et al., 2009]. Theoretical studies and experimental data have identified several chemical and physical processes that control the deposition process. These are inertial impaction, turbulent diffusion, thermophoretic attraction, vapour condensation and heterogeneous reaction between ash particles and deposition surfaces [Joller et al., 2007]. Previous investigations on combustion of biomass fuels, especially straw, has revealed problems linked to the formation of submicron aerosols particles, deposits, corrosion and emissions linked in most of the cases to the chemical composition but also to the boiler/combustion characteristics itself.
1.1 Scope of the work An ash deposition modelling study has been prepared using the Ash Deposition Predictor (ADP) developed and implemented jointly by TUDelft and ECN [Losurdo, 2009]. The numerical simulations were performed to answer open questions related to the deposition phenomena for coal and biomass blends and to illustrate any differences between atmospheric combustion conditions and the oxy-fuel combustion. In order to provide input data for the model, a series of deposition tests performed under atmospheric and oxyfuel conditions were carried out at ECN, described in Part I and also published [Fryda et al., 2009]. The next paragraphs provide a short description of the ADP together with the experimental equipment (LCS) as present in ECN.
1.2 The Ash Deposition Predictor (ADP) The ADP is a numerical tool which post-processes the data originating from the CFD based modelling of the boiler. The post-processor is an independent particle tracking code which includes inertial impaction, thermophoretic attraction and dynamic reaction of particles on surfaces in order to predict the location of the deposited ash, the growth of the deposit, its characteristics and the impact on heat transfer performance for a given combination of fuel and operating conditions. The structure of the Ash Deposition Predictor (ADP) is depicted in Figure 1.1.
8 ECN-E--10-077

CFD Simulation Results
Permanent or transient regime Nodes and cell No,
shape (hexa., tetra., …), connectivity and type (inlet, outlet, wall, sym.).
ADP input Whole or extracted Particle tracking
Figure 1.1 General structure of the Ash Deposition Predictor
The ADP encompasses the following steps [Bertrand et al., 2007; Losurdo et al., 2005]: • The ADP reads and reconstructs hybrid unstructured CFD meshes based on
topological node information and associates the values of the gas phase variables (for example: u, v, w, P, T, ρ) together with the position of the inlet(s), outlet(s), wall and potential symmetries in the domain.
• The modeller can select the particles injection point(s) or, simply, particles are randomly injected through the inlet ports and tracked in a steady or unsteady manner according to a Lagrangian Frame through the complete and/or a reduced computational domain.
• A Real Time Deposit Evaluation (RTDE) algorithm allows deposit properties like thickness, temperature, viscosity, composition and thermal resistance to be evaluated during the course of the tracking process and updated in real time to predict the changes that may occur on the deposit surface when tracking is in progress in a transient regime.
1.3 Lab Scale Combustor Simulator (LCS) The numerical calculations using the ADP were performed in order to evaluate the experimental data obtained from a series of ash deposition experiments in the Lab-scale Combustion Simulator (LCS) shown in Figure 1.2, using a special deposition probe, and to further develop and validate the code itself with new experimental data.
Nodes co-ordinates (x, y, z) Node gas Phase Variables (u, v, w, P, T, ρ, μl, k, ε)
Ash composition, size, density
ASH DEPOSITION ? Deposit properties
Inertial Impaction
Themophoresis
Work of adhesion
ECN-E--10-077 9

Figure 1.2 Laboratory Combustion Simulator at ECN
The ECN LCS consists of a drop tube reactor with an integrated, premixed and multi-stage flat flame gas burner. The staged gas burner accommodates high initial heating rates and temperatures and provides the possibility to simulate air staging as in low-NOx burners and also the presence of specific combustion products such as, e.g., SO2. Fuel particles (or in specific cases, glass particles) are fed through the inner burner and are rapidly heated (>105 °C/s) to the high temperature level of, e.g., a coal flame (1400-1600°C). The particles travel down with the gas through an alumina reactor tube whilst combusting. The reactor tube is externally heated by a two/three staged ceramic furnace. An oil cooled probe is used for sampling char and ash at several locations along the reactor vertical axis and a thermally controlled probe simulating a boiler super heater tube is inserted horizontally at the base of the system. The LCS setup is described in detail elsewhere [Korbee et al., 2003].
10 ECN-E--10-077

2. Numerical simulations and settings
The scope of the work was the ash deposition simulation of two fuels (Russian coal and Greek lignite and their blends with cocoa and olive residues respectively (Figure 2.1). A CFD modelling tool called CINAR® has been used in order to perform the CFD calculations. CINAR is a commercial code developed by the group of F. Lockwood at Imperial College (London) and has been used to numerically model industrial combustion boilers [Lockwood et al., 2002]. A numerical mesh was built using the mesh generator which is part of the CINAR code. The mesh reconstructs the geometry of the LCS. Special attention has been paid to the deposition probe where the mesh has been defined in more detail (see Figure 2.1).
Russianc
Figure 2.1 Cases modelled (based on the experimental work – Part I).
The CFD calculations have been performed for two different operational conditions, namely air combustion and oxy-fuel combustion environment. For each of these settings the flows and concentrations of the process (flue) gases, the reactor temperature profiles and the physical properties of the gas have been specified so as to reflect the conditions used during the LCS experiments. As a result of the CFD simulations a flow field has been calculated. For this flow field a set of characteristic parameters has been obtained, namely velocities, pressure, temperature distribution, etc. within the numerical domain. This flow field has been used as input for the ADP to perform the deposition calculations.
AIR
OXY
oal
Lignite
Russian+ cocoa
Lignite+ olivestone
Russiancoal
Lignite
Russian cocoa
Lignite+ olive tones
Russian coal
LigniteAIR
Russian C. / cocoa
OXY
Lignite/ olive residue
Russian coal
Lignite
Russian C. /cocoa
Lignite+ olive residue
ECN-E--10-077 11

2.1 Modelling with CFD - key settings – CINAR
2.1.1 Calculation domain The numerical mesh has been built in three dimensions and consists of 52332 nodes and 46720 cell elements representing the real scale LCS. The numerical mesh applied allows applying accurately numerical calculations with a reasonable trade off between the calculation accuracy (numerical convergence) and the time of calculation. In the vicinity of the probe an opening in the numerical mesh has been refined (see Figure 2.2).
Figure 2.2 Numerical mesh – CINAR – deposition probe opening
2.1.2 Input parameters for CINAR The CFD calculations with the CINAR code have been performed for two different combustion regimes. Namely, the oxy-fuel combustion regime and the standard (or reference) atmospheric combustion conditions (see Tables 2.1-2.3) have been applied. These conditions were used during the experiments at LCS, comparing modelling and experimental results. This will help, first, to interpret and evaluate the observed experimental findings, based on the physical phenomena included in the model and second, after having acquired a solid background on the phenomena simulated in the ADP and possibly improve further the code, the validation of the ADP tool can take place. In its final form, the model will be a tool for predicting the ash deposition phenomena in large scale combustors for designing or facility modification purposes.
Table 2.1 Simulation CFD CINAR – input for ADP, two environment conditions have been simulated as input for ADP
CFD – code ENVIRONMENT CINAR AIR CINAR OXY
12 ECN-E--10-077

2.1.3 Oxy-fuel and Air flows per ports The combustion gases (CH4, O2 and CO2) for the inner and the outer burner as well as the ring for the oxyfuel case were specified as follows, in order to achieve standard combustion conditions – 3-4% of O2 in the flue gas exit (Table 2.2 and 2.3):
Table 2.2 Gaseous feed composition - oxyfuel (methane, oxygen and carbon dioxide flows) Port Port Port Total Flow Total Flow Total Flow
The methane, oxygen and nitrogen streams for the inner, outer burner and the ring in the air case have been specified as follows:
Table 2.3 Gaseous feed composition - air (methane, oxygen and nitrogen flows)
The above presented flows reflect the conditions used during the experiments.
2.1.4 Temperature profile The reactor wall temperature profile was determined iteratively so that the modelled axial temperature profile matches the temperature profile measured with a thermocouple on the axis of the LCS combustor during the experiments for the oxy-fuel and air combustion conditions (Figure 2.3).
400
600
800
1000
1200
1400
1600
1800
2000
0 200 400 600 800 1000
Distance to the burner (mm)
Tem
pera
ture
( °C
)
Air Oxyfuel 1
Figure 2.3 The LCS axial temperature profile as function of the distance from the burner
OXY-FUEL inner(l/min) outer(l/min) ring(l/min) l/min g/min moles/min0.300 3.220 2.513 CH4 0.000 3.520 0.1570.550 8.000 O2 0.000 8.550 12.207 0.3811.200 CO2 18.000 1.670 20.870 40.969 0.931
SUM 32.940 55.688
Port Port Port Total Flow Total Flow Total FlowAIR inner(l/min) outer(l/min) ring(l/min) l/min g/min moles/min
0.180 2.350 1.806 CH4 0.000 2.530 0.1130.300 5.600 8.423 O2 0.000 5.900 0.2631.100 N2 21.000 1.670 23.770 29.694 1.060
SUM 32.200 39.923
ECN-E--10-077 13

The methodology to determine the wall temperature as input for the CFD was as follows: a set of wall temperatures was assumed as a boundary condition and iterations were performed in the CINAR code until it resulted in the same modelled and measured axial temperatures. Those profiles were continuously compared and if necessary, corrections were applied until for a given set of wall temperatures a matching with the experimentally obtained axial profile was obtained.
2.2 ADP
2.2.1 Simulation programme The simulation case matrix follows the LCS experimental data available for the selected coals, biomass and blends. The fuels used were • Russian coal • Lignite and their blends with biomass • Russian coal / cocoa • Lignite /olive residues The simulations were performed for the “reference” air combustion conditions and for the oxy-fuel conditions, aiming to observe the differences in deposition phenomena for these two combustion conditions. The simulation cases are summarized in Table 2.4.
Table 2.4 Simulation cases for the Ash Deposition Predictor
Experiment number/ADP number Fuel Environment
LCS373 Russian coal AIRLCS316 Russian coal OXY
LCS374 AIR Russian coal/cocoaLCS317 OXY Russian coal/cocoa
LCS441 Lignite AIRLCS449 Lignite OXY
LCS446 AIR Lignite/olive residueLCS448 OXY Lignite/olive residue
2.2.2 Particle trajectory and the deposition process The particles are introduced in the ADP model. In total, the flow and the deposition of 10000 particles have been simulated. The calculation process is a trade-off between the deposition accuracy (more particles involved) and the computation time. At this moment for 10000 particles injected the calculation time for one test equals approx. 2 weeks. For the ADP certain physical properties of the particles were specified (for more details see Appendix 3).
14 ECN-E--10-077

Key parameters are: • particle size distribution (PSD) with the mean diameter • particle density • particle composition based on SiO2 molar fraction • particle viscous elastic properties NBO/T (ratio of non-bridging oxides to tetrahedral
oxygen) • Young module The viscous elastic properties of the ash particles have been specified based on the NBO/T formula proposed by [Senior et al., 1994]. The NBO/T is the ratio between the non bridging oxygen and the tetrahedral oxygen [Senior et al., 1995] and is given by the general formula (equation 1):
33
3
2/)(/
OFe+OAl+TiO+SiOFeOOAlONa+OK+MgO+CaO+FeO
=TNBO2222
3222 −−
Equation 1 - NBO/T formula
The NBO/T is a parameter developed to predict the viscosity of individual coal ash particles at the temperatures and velocities typically found in coal-fired utility boilers and in comparison to the other models accurately predicts the viscous elastic properties within the higher viscosity ranges. In addition, the model for NBO/T predicts better the viscosity for certain compositions which are commonly found in ash particles [Senior et al., 1995; Srinivasachar et al., 1992]. Some of the parameters have been assumed to be constant for all the calculations (for example Young module) while some others were assumed particle specific (PSD, NBO/T) and defined specifically for each of the modelling runs. The importance and the influence of NBO/T are discussed in relation to other results further on. In order to characterize the deposition propensity of the fly ash the ash composition as collected on the filter and on the deposition probe was taken into account. The composition of the filter ash and the ash deposited on the deposition probe were thought to better represent the state of the particles at the moment of deposition and is origination directly from the corresponding experiments. The exact composition of the filter/deposition probe ashes can be found in Appendix 5. Particle density was kept constant for all tests and assumed to be 1900 kg/m3. The visualization of the particle injection process together with the particle flow and the deposition on the probe is presented in Figure 2.4.
ECN-E--10-077 15

X Y
Z
PRes_time
6.565.554.543.532.521.51
Figure 2.4 Ash Deposition Predictor – particle flow visualized by Tecplot, upper left corner – the computational domain with the particles injected, upper right – the numerical mesh in vicinity of the probe, lower left - a particle approaching the probe, lower right – the deposit build-up and its thickness
2.2.3 Fuels The numerical study of ash deposition was carried out for two coals (Russian and Lignite) and their blends with cocoa and olive residues (ground). The proximate and ultimate analyses together with the analysis of the inorganic matter are presented in Table 2.5. Lignite is characterised by high ash content at the level of 42%. The ash content for the Russian coal is much lower at 14.9%. The concentration of the fouling elements like potassium in lignite is 4 times higher than in the Russian coal. Silica content is also much higher for the lignite than for the Russian coal. Based on these concentrations much more deposit formation relative to the thermal conversion of lignite can be expected. This fact was observed during the experiments with lignite. Also the cocoa is characterized by very high potassium content but opposite to the Russian coal the silica content is much lower. The potassium content in the olive residue is also relatively high.
16 ECN-E--10-077

Table 2.5 Proximate and ultimate analysis of Russian coal, cocoa, lignite and olive residues Fuel Russian coal Cocoa Lignite Olive residue
Moisture 3.4 11.1 35.8 5.8
Proximate analysis (% mass, dry fuel basis) ash @ 815°C 15 5 43 6 Volatile matter 29 62 38 72 HHV (KJ/kg) 27800 19410 13700 20000 Initial Deformation (°C) 1250 1140 Hemisph. Temperature (°C) 1360 1310 Flow Temperature (°C) 1410 1330
Ultimate analysis (% mass, dry fuel basis) C 68 49.4 33 48 H 4.0 5.3 2.7 5.7 N 0.9 2.6 0.6 1.1 S 0.3 0.3 0.8 0.1 O by diff. 11.6 40.1 18.8 38
Ash composition (mg/kg fuel, dry basis) Na (± 7)* 405 179 1600 1300 Mg (± 1) 1277 1937 5500 1800 Al (± 4) 16583 772 34000 1200 Si (± 90) 34841 1861 64000 6200 P (± 15) 386 1684 110 620 K (± 20) 2390 20790 6600 8900 Ca (± 20) 2750 2140 7100 13000 Ti (± 8) 622 47 1400 76 Mn (± 6) 89 24 200 35 Fe (± 4) 6077 1095 15000 1800 Zn (± 1) 21 4 50 12 Pb (± 20) 10 0 25 25 Sr (± 5) 183 18 59 15 Ba (± 5) 260 22 150 11 Cl (± 20) 100 800 47 2000
ECN-E--10-077 17

3. Results and discussion
The deposition ratios have been defined as the ratio between the ash deposited to the ash fed in the reactor via the fuel: DR = (kg ash deposited)/(kg ash fed) The deposition ratio (= capture efficiency) together with the number of particles which actually have deposited for the calculated sets of NBO/T parameters are presented in Table 3.1 and Figures 3.1 and 3.2. In general the deposition ratios are lower for the Russian coal and its blends than for the Lignite blends. The reason for it maybe the lower content of silica, potassium and calcium. One has to remember that the numerical modelling predicts the behaviour in this case of coal ashes under certain assumptions and according to the defined parameters. In case of the Ash Deposition Predictor the viscous elastic properties are evaluated based on the NBO/T parameter.
Table 3.1 Deposition ratios for certain viscous elastic properties NBO/T of the deposited ash and the PSD
Test Environment Fuel NBO/T Deposition ratio PSD (m)
LCS373 AIR Russian coal -0.1810 0.3462 4.651E-05 LCS316 OXY Russian coal -0.18067 0.2774 2.776E-05
LCS374 AIR
Russian coal/cocoa
-0.27077
0.3384
4.380E-05
LCS317 OXY Russian coal/cocoa
-0.28346
0.311
3.300E-05
LCS441 AIR Lignite -0.08448 0.3081 3.860E-05
LCS449 OXY Lignite -0.1004
0.5965
8.600E-05
LCS446 AIR Lignite/olive residue -0.0058 0.2972 3.994E-05
LCS448 OXY Lignite/olive residues -0.02133 0.3506 4.863E-05
The NBO/T parameter can take either positive or negative values. A strongly negative value indicates lower viscosities (ash less sticky). As reported in the literature, in silicate melts of geologic interest and bulk coal ash compositions the NBO/T is positive. However, in many individual coal ash particles, particularly in those with high content of aluminosilicate clays, the NBO/T is negative (less sticky). Thus the NBO/T values are coal-specific and the negative values indicate a high alumina content. The composition of the ashes after the fuel combustion has been taken for each experiment respectively. The NBO/T for the Russian coals is strongly negative. NBO/T can take values which are lower than zero which indicates “glasses” in which there is insufficient amount of modifier ions to stabilize Al3+ or Fe3+. Aluminium seems to behave as a network modifier modifying ions in such structures. According to [Senior et al., 1995] the viscosity measurements show that increasing the amount of aluminium where NBO/T is less than zero actually decreases the viscosity.
18 ECN-E--10-077
0
0.05
0.1
0.15
0.2
0.25
0.3
0.35
0.4
-0.3 -0.25 -0.2 -0.15 -0.1 -0.05 0
NBO/T
Dep
oit r
ate LCS317 LCS374
LCS373 LCS316
Figure 3.1 Deposition ratios as a function of NBO/T for the Russian coal and its blends
This could suggest that the Russian coal ashes are less sticky according to the model used in the ADP, which justifies the lower deposition ratios as well. The NBO/T values for lignite are closer to zero thus indicating more sticky deposits. In addition to NBO/T the ADP uses the ratio between calcium oxide and aluminium oxide to describe the viscous elastic properties but influence of this parameter is not discussed in this report.
0
0.1
0.2
0.3
0.4
0.5
0.6
0.7
-0.12 -0.1 -0.08 -0.06 -0.04 -0.02 0
NBO/T
Dep
oit r
ate LCS449 LCS441
LCS448 LCS446
Figure 3.2 Deposition ratios as a function of NBO/T for the Lignite and its blends
According to Doshi et al. 2009, the inorganics present within biomass and coal that are of concern during ash formation and further on during the deposit formation can be classified into 3 groups. The first two groups are the ionically and organically bound inorganics, which are mainly found in biomass and the third group is the minerals found both in coal and biomass. Glazer (2007) in his PhD thesis showed clear effects of interactions of inorganics present in biomass with those present in coal during the biomass coal co-firing. The high temperature gas chemistry seems to reduce the release of the alkali metals transforming them into less harmful and sticky alkali-alumina-silicates [Jimenez et al., 2007]. The NBO/T and the ratio of basic to acidic oxides RB/A (equation 2) give an indication about the possible real life behaviour of the tested fuels. Higher
ECN-E--10-077 19

values of RB/A together with the negative but close to zero NBO/T value, indicates strong fouling propensity. Ratio of basic to acidic oxides:
RB/ A=Fe2O3+CaO+MgO+K2 O+Na2 O
SiO2+Al2O3+TiO2
Equation 2 - Ratio of basic to acidic oxides
The RB/A ratios for the Russian coal and its blends are substantially lower indicating the higher share of the alumino-silicates within the system (Table 3.2). A low value also indicates low concentration of K/Na/Mg/Ca elements forming basic oxides.
Table 3.2 Particle Size Distribution and the basic to acidic oxides ratio together with the NBO/T and the deposition ratio for the Russian coal/Lignite and their blends
Test
Environment
Fuel
NBO/T R B/A PSD (m)
Deposition ratio
LCS373 AIR Russian coal -0.18107 0.14415 4.651E-05 0.3462
LCS316 OXY Russian coal -0.18067 0.13422 2.776E-05 0.2774
LCS374 AIR Russian coal/cocoa -0.27077 0.19173 4.380E-05 0.3384
LCS317 OXY Russian coal/cocoa -0.28346 0.18306 3.300E-05 0.311
LCS441 AIR lignite -0.08448 0.24622 3.860E-05 0.3081
LCS449 OXY lignite -0.1004 0.23778 8.600E-05 0.5965
LCS446 AIR Lignite/olive residue -0.0058 0.30386 3.994E-05 0.2972
LCS448 OXY Lignite/olive residue -0.02133 0.2871 4.863E-05 0.3506
Another index that describes the fouling behaviour of fuels is the Fouling Index (equation 3). The fouling index is defined as the ratio between potassium and sodium to chlorine and sulphur, as the main fouling responsible elements. The fouling index in this case has been calculated on basis of the composition of the collected ash deposits and not the fuel composition as is the case with the previously described ratios. Interesting findings are revealed when looking closer at the fouling index of the fuels and their blends. It can be seen that for the oxyfuel combustion conditions the fouling index is higher both for the Russian coal and the lignite, in comparison to the air combustion cases. On the other hand the direct relation between the fouling index and the deposition ratios is profound in the case of lignite and its blends. The results including the fouling index, together with all the previous parameters are shown for comparison in Table 3.3. In general for lignite and its blends the fouling index is much higher than for the Russian coal, which is related to the high content of potassium and sodium. Interesting is the observation that for the oxyfuel environment the fouling index is higher than for air combustion. This indicates that the ash composition varies with the combustion environment.
20 ECN-E--10-077

Ff =K+NaCl+2S
Equation 3 - Fouling index
The fouling index is not the last parameter that may help in describing the deposition phenomena but it is considered an important one [Wei et al., 2002]. The ADP code relies on the input data as provided by the experiments; the fouling factor as defined here does not form an input to ADP currently. According to [Lokare et al., 2006] ash impaction efficiency depends on particle density and size, whereas capture efficiency mainly depends on particle composition thus on elemental composition which in the end determines the viscous elastic properties. It has to be stressed that the ADP in it current form is a particle tracking tool with the extended full impaction and thermophoretic attraction functionalities based on the specified viscous elastic properties of the particles and does not take into account the chemical interactions neither in the gas phase nor in the gas-liquid-solid phase taking place in real cases [Korbee et al. 2007].
Table 3.3 Fouling index and the deposit rate for the Russian coal/Lignite and their blends
Test Environment Fuel NBO/T R B/A PSD (m) Deposition ratio
Fouling
index - Ff
LCS373 AIR Russian coal -0.18107 0.14415 4.651E-05 0.3462 0.874
LCS316
OXY
Russian coal -0.18067 0.13422 2.776E-05 0.2774 2.031
LCS374 AIR RC/cocoa -0.27077 0.19173 4.380E-05 0.3384 1.637
LCS317 OXY RC/cocoa -0.28346 0.18306 3.300E-05 0.311 2.603
LCS441 AIR Lignite -0.08448 0.24622 3.860E-05 0.3081 14.087
LCS449 OXY Lignite -0.1004 0.23778 8.600E-05 0.5965 21.198
LCS446 AIR Lignite/olive residue -0.0058 0.30386 3.994E-05 0.2972 15.634
LCS448 OXY Lignite/olive residue -0.02133 0.2871 4.863E-05 0.3506 42.7
The investigated deposition phenomena form a multi parameter system where many factors may influence the observed behaviour. On one hand the NBO/T ratio describing the viscous elastic properties indicates that all the coals and coals blends are rich in alumina but one the other hand does not give definitive explanation for the deposition phenomena. The PSD of the particles indicates a relation between the particle size and the deposition ratio (larger particles more deposits). In addition the analysis of the fouling indexes and the deposition ratios reveals strong relationship in the case of lignite. In order to differentiate between the influencing factors some sensitivity analysis was performed.
ECN-E--10-077 21

4. Sensitivity analysis
4.1 Sensitivity analysis on the influence of the Particle Size Distribution In order to test the sensitivity of the ADP to the ash particle sizes (PSD) of the collected ash samples, the original numerical calculations have been repeated with modified PSD values. In the modified case, the PSD of the lignite coal and blends has been used as the input parameter for all cases, replacing the PSD values for the Russian coal test cases. It means that for the Russian coal cases, all the other input parameters were the ones for the Russian coal and its blends but the PSD has been replaced by the lignite cases, rendering the PSD is homogeneous for all the runs. From these results it is clearly visible that the PSD has a profound influence on the results (Table 4.1).
Table 4.1 Original and modified deposit ratios for the Russian coal and its blends. The PSD of the lignite coal and blends has been used as the input parameters for ADP
Test
Environment
Fuel
DR
original
DR
modified
PSD
original
PSD
modified
NBO/T
LCS373
AIR
Russian coal
0.3462
0.3078
4.651E-05
3.860E-05
-0.18107
LCS316
OXY
Russian coal
0.2774
0.5950
2.776E-05
8.600E-05
-0.18067
LCS374
AIR
Russian coal/cocoa
0.3384
0.3247
4.380E-05
3.994E-05
-0.27077
LCS317
OXY
Russian coal/cocoa
0.311
0.3962
3.300E-05
4.863E-05
-0.28346
LCS441 AIR lignite 0.3081 0.3081 3.860E-05 3.860E-05 -0.08448
LCS449
OXY
lignite
0.5965
0.5965 8.600E-05 8.600E-05 -0.1004
LCS446 AIR Lignite/olive residues 0.2972 0.2972 3.994E-05 3.994E-05 -0.0058
LCS448 OXY Lignite/olive residues 0.3506 0.3506 4.863E-05 4.863E-05 -0.02133
With the PSD being replaced for the Russian coal the trend is different for both the Russian coal and its blends. In the case of the modified PSD the oxyfuel combustion seems to lead to more deposit production, in a similar trend as the lignite cases. This trend was also observed during the experiments where the oxyfuel tests resulted in larger deposition ratios. In addition, it can be observed that the modified deposition results are almost identical to the ones of lignite indicating again a strong PSD input influence in the deposition phenomena (impaction mechanism encompassed in the code). According to [Joller et al., 2007] inertial impaction on boiler tubes is relevant mainly for coarse particles, since aerosols will follow the gas flow. For the aerosols thermophoresis phenomena may play a role as well. This explains the strong influence of the PSD on the deposition behaviour. Larger particles are more prone to impact on the boiler tube; therefore, a direct link can be made, between larger particles and larger deposition ratios.
22 ECN-E--10-077

The proper PSD estimation is critical in order to define the relevant deposition formation mechanisms during the combustion of coal and biomass. In addition to particle formation and the deposit formation process, direct condensation of aerosols forming species on furnace walls and in this case on the deposition probe must be considered. The probe during the experiments was kept at 600oC. Unfortunately this phenomena was not modelled within this version of the ADP. In the newer version of the ADP, “equivalent condensation” phenomena could be modelled by considering very small aerosol particles that deposit to the surface by thermophoresis. However these aerosol particles have much different viscous-elastic properties than fly ash. It would mean that another set of viscous-elastic properties would need to be considered in the ADP.
4.2 Sensitivity analysis on the influence of the OXY/AIR conditions for a selected fuel
The lignite is characterised by a very high ash content which renders it suitable for the deposition tests and the numerical study. In order to test the sensitivity of deposition ratio within the code for the given OXY and AIR combustion conditions the following cases were considered: 1. PSD identical, but other parameters like NBO/T test specific 2. PSD as well as other parameters like NBO/T identical Especially the second case is expected to provide information how the different flow field for the oxyfuel conditions (temperature, pressure and gas distribution together with different velocity vectors) influence the deposition process for the same fuel chemical composition (reflected in NBO/T) and the same PSD. The results of the cases mentioned are shown in Table 4.2.
Table 4.2 Deposition ratios for lignite tested under OXY/AIR conditions for cases 1 (upper two rows) and 2 (lower two rows)
Test
Environment
Fuel
Deposition ratio
original
Deposition ratio
modified
PSD (m) original
PSD modified
NBO/T
LCS441
AIR lignite 0.3081 0.5497 3.860E-05 8.600E-05 -0.0845
LCS449 OXY lignite 0.5965 0.5965 8.600E-05 8.600E-05 -0.1004
LCS441 AIR lignite 0.3081 0.5548 3.860E-05 8.600E-05 -0.0924
LCS449 OXY lignite 0.5965 0.5944 8.600E-05 8.600E-05 -0.0924
The first case, (Table 4.2, first 2 lines), where the PSD are equal but all the other parameters including the NBO/T are test specific, reveals and confirms the relationship between the lower NBO/T and the increased deposition ratios. From the second case it is visible from table 4.2 that the deposition ratios are slightly higher for the oxyfuel conditions where all the other parameters are the same. A possible explanation for this is the altered flow fields, in other words, the gaseous flow lines and the physical properties of the gaseous environment in general, under the given temperature regime, which affects finally the deposition behaviour. This is in agreement with the experimental
ECN-E--10-077 23

findings [Fryda et al., 2009] and is the subject of other published works [PhD, Shrinivas S. Lokare, 2008]. The agreement between the tests and the code results is encouraging for the further development of the ADP code. The possible explanation for the systematic shift towards larger deposition ratios under oxyfuel conditions observed during the experiments could be due to (a) larger particle formed under oxyfuel, which promotes the inertial impaction of ash on a surface, and (b) the different viscosities of the gaseous environments: the N2/O2 in the air combustion and the CO2/O2 during the oxyfuel combustion. The viscosity of air is slightly larger than the viscosity of CO2 (μCO2 = 0.0001371 Poise against μair = 0.0001675 Poise), while the densities of the gases follow the opposite trend (CO2 is heavier, denser than air). These aerodynamics parameters affect the flow field and the way ash particles behave in that flow field and therefore seem to affect the impaction efficiency of the ash particles, as they influence the flow dynamics of the described phenomena. For the same particle sizes of the ash, the higher viscosity of air is probably the answer to the lower deposition ratios observed, as explained theoretically by Lokare [2009]. The particle size distribution plays a significant role as well, as very small particles will not easily impact the surfaces, because they will be carried away by the gas flow. Therefore, in this case, for the same gas (same viscous behaviour), and for the same gas velocity as well, larger particles are more prone to impact on the surfaces, as they will not follow the flow field around the deposition tube (deposition surface). Naturally, the chemical composition of particles must not be neglected, as it affects the final capture efficiency, in other words, the final amount of ash that will stick and remain on the probe. This is partly dependent on ash chemistry and partly dependent on the particle geometry and target surface characteristics. In the ADP, the target surface as well as the particle characteristics were not variable parameters, therefore their influence was not studied. The chemical characteristics of the ash have been taken into consideration of course, through the parameters described in the relevant paragraphs: NBO/T, fouling index, RA/B.
24 ECN-E--10-077

5. Conclusions and recommendations
A set of numerical calculations has been performed using the Ash Deposition Predictor in order to assess the deposition formation behaviour during the combustion of two types of coal and their blends under oxyfuel and standard air combustion atmospheres. The ADP tool predicted more ash deposited for the lower viscous elastic values (the ratio between the non bridging oxygen and the tetrahedral oxygen) which is in agreement with the literature. Furthermore, the formation of less sticky deposits indicates the positive influence of the alumina-silicates in the ash. The fouling index is much higher for the lignite coal and its blends giving an additional explanation to the numerical findings. The higher fouling index for the lignite coal and blends and as a result higher fouling propensity is in agreement with the simulation results and the experimental findings for these fuels. The calculations seem to be very sensitive to the particle size distribution (PSD) of the collected ashes, as the results presented reveal. However, more work is needed in this respect in, first, further developing the code and second, the validation of the code. The sensitivity analysis of selected code parameters revealed the influence of the PSD on the results generated by the code and in specific, on the deposition ratios. In addition, increased deposition ratios were predicted by the ADP under oxyfuel conditions in comparison to the standard air combustion conditions, while all the other parameters were kept constant. This result is in agreement with the observed experimental results. The ADP tool is still missing the ability to numerically model the condensation phenomena so at this moment the code represents a substantial simplification of the reality. The ADP is being further developed and equipped with additional functionalities and validated for different fuels and sets of conditions. Expanding the ADP with additional sub models able to simulate other physical phenomena would help the predictor to be a supplementary tool supporting any future experiments and measurements campaigns. More simulations creating particle groups with varying physical (PSD)and chemical (composition) properties would help to bring the predictor closer to the reality of industrial boilers. Especially the interactions of different particles sizes and densities and the influence of this on the deposition phenomena would be necessary to be investigated. Experimental campaigns are proposed to obtain deposition data over a wide range of Stokes number (combinations of particle sizes, various gaseous environments) to validate the theoretical results of the ADP and the other relevant studies as well. Combinations of particle size, particle velocity and target cylinder size constitute a test matrix for these experiments which should cover a wide Stokes number range.
ECN-E--10-077 25

References
Betrand C, Marco Losurdo, Rob Korbee, Mariusz Cieplik, Willem Van de Kamp “An Ash Deposition Post-processor for Biomass Co-Firing in Boilers or Furnaces”, American – Japanese Flame Research Committees International Symposium, Advances in Combustion Technologies: Improving the Environment and Energy Efficiency, Marriott Waikoloa, Hawaii – October 22-24, 2007
Doshi V., H.B. Vuthaluru, R. Korbee, J.H.A. Kiel “Development of a modeling approach
to predict ash formation during co-firing of coal and biomass” Fuel Processing Technology 90 (2009) 1148-1156
L. Fryda, C. Sobrino, M. Cieplik, W.L. van de Kamp, Study on ash deposition under
oxyfuel combustion of coal/biomass blends , Fuel, Volume 89, Issue 8, August 2010, Pages 1889-1902
Fryda L., C. Sorbino, M. Losurdo, M. Cieplik, W. de Jong., W.L. van de Kamp
“Comparison of Ash Release and deposition under air vs. oxyfuel combustion of solid fuels” 1st Oxyfuel Combustion Conference
Glazer M.P.“ Alkali metals in combustion of biomass with coal” PhD thesis, Delft
University of Technology, 2007 Hindiyarti L., F. Frandsen, H. Livbjerg, P. Glarborg, P. Marshall “An exploratory study of
alkali sulfate aerosols formation during biomass combustion” Fuel 87 (2008) 1591-1600
Jimenez S., J. Ballester “Formation of alkali sulphate in biomass combustion” Fuel 86
(2007) 486-493 Joller M., T. Brunner, I. Obernberger, “Modeling of aerosol formation during biomass
combustion for various furnace and boiler types”, Fuel Processing Technology 88 (2007) 1136-1147
Jordal K., Anheden M., Yan J. “Oxyfuel combustion of coal-fired power generation with
CO2 capture – opportunities and challenges” Greenhouse Gas Control Technology 2005; 7:201-9
Korbee R., Losudro M., Cieplik M.K., Verhoeff F. “Monitoring and modelling of gas –side
boiler fouling”, 2007 Lockwood F., Nasrullah M., Perrera S. “A computationally economical simulation of
small particle deposition in a turbulent duct flow” in Combustion Technologies for a clean Environment Conference, Lisabon, Portugal 2002
Lokare S.S., Dunaway J.D., Baxter L. “Investigation of ash deposition for a suite of
biomass fuels and fuel blends” Energy & Fuels 2006, 20, 1008-1014
26 ECN-E--10-077

Losurdo M. “Particle tracking and deposition from CFD simulations using a viscoelastic particle model” PhD Thesis, TUDelft, 2009
Losurdo M., R. Korbee, B. Venneker, J. Kiel, and H. Spliethoff, “Ash and fouling
deposition in pulverized co-firing biomass burners: CFD ash deposition modeling”, ECCOMAS, Lisbon, 2005.
Senior C.L., S. Srinivasachar “ Viscosity of ash particles in combustion systems for
prediction of particle sticking” Energy & Fuels 1995, 9, 277-283 Srinivasachar S., L. Senior, J.J. Helbe and J.W. Monroe, in Twenty-Fourth Symposium
(International) on Combustion, The Combustion Institute, Pittsburgh, 1179-1187 (1992).
Shrinivas S. Lokare, A Mechanistic Investigation Of Ash Deposition In Pulverized-Coal
And Biomass Combustion, PhD Thesis, Department of Chemical Engineering Brigham Young University, December 2008 Wei Xiaolin, Christian Lopez, Thore von Puttkamer, Uwe Schnell, Sven Unterberger, and
Klaus R. G. Hein „Assessment of Chlorine−Alkali−Mineral Interactions during Co-Combustion of Coal and Straw” Energy Fuels, 2002, 16 (5), pp 1095–1108
Zheng Y., P.A. Jensen, A. D. Jensen, B. Sander, H. Junker “Ash transformation during
co-firing coal and straw” Fuel 86 (2007) 1008-1020
ECN-E--10-077 27

Appendix A Other CINAR settings OXY-FUEL
28 ECN-E--10-077

Appendix B Temperature profiles CINAR
Teperature profile experiments versus nummerical modeling
1600
1620
1640
1660
1680
1700
1720
1740
1760
0 100 200 300 400 500 600 700 800
Length LCS [mm]
Tem
pera
ture
[K]
NEW LCS OXYcinar_3_oxy
Figuur B.1 Temperature profiles – atmospheric experiments (squares) and the fitting
for the numerical simulation (stars)
Teperature profile experiments versus nummerical modeling
1670
1680
1690
1700
1710
1720
1730
0 200 400 600 800 1000 1200 1400
Length LCS [mm]
Tem
pera
ture
[K]
NEW LCS AIR EXP.cinar_6_2
Figuur B.2 Temperature profiles – atmospheric experiments (squares) and the fitting
for the numerical simulation (stars)
ECN-E--10-077 29

Appendix C ADP – parameters
Particle Data File ==> PDF TGN: 1 PNPG: 10000 (Particle Number Per Group) @********************************************************** Particle Size (Diameter): (S) Mean: 27.76d-6 [m] SD: 0.0d0 (Standard Deviation ==> Variance) Particle Density: (D) Mean: 1900.d0 [kg/m3] SD: 0.0d0 (Standard Deviation ==> Variance) Particle Composition (Acid/Base Ratio): (C) Mean: 0.711d0 SD: 0.0d0 (Standard Deviation ==> Variance) Particle Specific Heat ==> PSH [J/(Kg*K)] Mean: 840.d0 [J/(Kg*K)] SD: 0.0d0 (Standard Deviation ==> Variance) Particle Thermal Conductivity ==> PTC [W/(m*K)] Mean: 0.14d0 [W/(m*K)] SD: 0.0d0 (Standard Deviation ==> Variance) Particle Young Modulus ==> PYM [Pa] Mean: 70.d9 [Pa] (at 300 K) SD: 0.0d0 (Standard Deviation ==> Variance) Particle Temperature ==> PTemp [K] Mean: 0.d0 [K] ==> Mean: 0.d0 ==> means particles get inlet cell's temperature SD: 0.0d0 (Standard Deviation ==> Variance) PCN: 1 (Particle Cluster Number) PCC: S (Particle Cluster Criteria ===> Please select S,D or C)
30 ECN-E--10-077

ECN-E--10-077 31
Appendix D Other settings ADP
Particle Injection Location - PIL ILN: 1 (Injection Location Number - integer number) @********************** xmin: -5.0d-4 (m) xmax: 5.0d-4 (m) ymin: -5.0d-4 (m) ymax: 5.0d-4 (m) zmin: 1.5d-1 (m) zmax: 2.0d-1 (m) Extracted Computational Domain Coordinates ECD_xmin= -4.0d-2 ECD_xmax= 4.0d-2 ECD_ymin= -4.0d-2 ECD_ymax= 4.0d-2 ECD_zmin= 5.0d-1 ECD_zmax= 1.1d0 @******************** Inlet Box Coordinates IBC_xmin= -4.0d-2 IBC_xmax= 4.0d-2 IBC_ymin= -4.0d-2 IBC_ymax= 4.0d-2 IBC_zmin= 5.0d-1 IBC_zmax= 5.1d-1 @******************** Outlet Box Coordinates OBC_xmin= -4.0d-2 OBC_xmax= 4.0d-2 OBC_ymin= -4.0d-2 OBC_ymax= 4.0d-2 OBC_zmin= 1.0d0 OBC_zmax= 1.1d0

Appendix E Ash properties LCS373
LCS373
LCS316
fa compositionw of element (g/mol) w of oxide (g/mol) density oxide (g/cm3) w of elementl (g) moles of element moles of oxide molar fraction oxide NBO/T
CaO 40.078 56.078 3.34 13 0.324367483 0.324367483 0.035084673 -0.19323MgO 20.305 36.305 3.7 6.6 0.325043093 0.325043093 0.035157749Na2O 22.99 61.98 2.27 3.1 0.134841235 0.067420618 0.00729244K2O 39.098 94.196 2.35 13 0.332497826 0.166248913 0.017982039Al2O3 26.982 101.964 3.247 87 3.224371803 1.612185902 0.174379424SiO2 28.086 60.086 2.648 180 6.40888699 6.40888699 0.693206671TiO2 47.867 79.867 4.23 3.9 0.081475756 0.081475756 0.00881269Fe2O3 55.845 159.69 5.25 29 0.519294476 0.259647238 0.028084314
335.6 9.245275992 1
fa+s weighted averagew of element (g/mol) w of oxide (g/mol) density oxide (g/cm3) w of elementl (g) moles of element moles of oxide molar fraction oxide NBO/T
CaO 40.078 56.078 3.34 14.54682152 0.362962761 0.362962761 0.036485798 -0.18107MgO 20.305 36.305 3.7 7.156855749 0.352467656 0.352467656 0.035430807Na2O 22.99 61.98 2.27 3.13093643 0.136186883 0.068093441 0.006844899K2O 39.098 94.196 2.35 13.61872861 0.348322897 0.174161448 0.017507084Al2O3 26.982 101.964 3.247 89.16555013 3.30463087 1.652315435 0.166094303SiO2 28.086 60.086 2.648 195.4682152 6.959631674 6.959631674 0.699597153TiO2 47.867 79.867 4.23 3.961872861 0.082768355 0.082768355 0.008320053Fe2O3 55.845 159.69 5.25 33.02173596 0.591310519 0.29565526 0.029719903
9.94805603 1
fa+s weighted averagew of element (g/mol) w of oxide (g/mol) density oxide (g/cm3) w of elementl (g) moles of element moles of oxide molar fraction oxide NBO/T
CaO 40.078 56.078 3.34 17.045 0.425295673 0.425295673 0.037151275 -0.17662MgO 20.305 36.305 3.7 7.73 0.38069441 0.38069441 0.033255177Na2O 22.99 61.98 2.27 3.289 0.143062201 0.0715311 0.006248527K2O 39.098 94.196 2.35 14.77 0.377768684 0.188884342 0.016499801Al2O3 26.982 101.964 3.247 99.668 3.693869987 1.846934994 0.161337145SiO2 28.086 60.086 2.648 227.91 8.114719077 8.114719077 0.708853109TiO2 47.867 79.867 4.23 4.37 0.091294629 0.091294629 0.00797495Fe2O3 55.845 159.69 5.25 36.67 0.656638911 0.328319456 0.028680015
11.44767368 1
ECN-E--10-077 32

LCS374
NBO/T-0.
LCS317NBO/T
-0.
LCS446NBO/T
-0.
w of element (g/mol) w of oxide (g/mol) density oxide (g/cm3) w of elementl (g) moles of element moles of oxide molar fraction oxideCaO 40.078 56.078 3.34 17.35 0.432905834 0.432905834 0.042187301 10582MgO 20.305 36.305 3.7 9.12 0.449150456 0.449150456 0.043770363Na2O 22.99 61.98 2.27 2.93 0.127446716 0.063723358 0.006209934K2O 39.098 94.196 2.35 32.19 0.823315771 0.411657885 0.040116657Al2O3 26.982 101.964 3.247 88.35 3.274405159 1.637202579 0.159547763SiO2 28.086 60.086 2.648 193.49 6.889197465 6.889197465 0.671362273TiO2 47.867 79.867 4.23 4.03 0.084191614 0.084191614 0.008204595Fe2O3 55.845 159.69 5.25 32.78 0.586981825 0.293490912 0.028601115
10.2615201 1
w of element (g/mol) w of oxide (g/mol) density oxide (g/cm3) w of elementl (g) moles of element moles of oxide molar fraction oxideCaO 40.078 56.078 3.34 19.63 0.4897949 0.4897949 0.04215481 10715MgO 20.305 36.305 3.7 10.39 0.511696626 0.511696626 0.044039809Na2O 22.99 61.98 2.27 3.06 0.133101348 0.066550674 0.005727767K2O 39.098 94.196 2.35 30.52 0.780602588 0.390301294 0.033591768Al2O3 26.982 101.964 3.247 95.87 3.55310948 1.77655474 0.152901403SiO2 28.086 60.086 2.648 223.51 7.958057395 7.958057395 0.684920151TiO2 47.867 79.867 4.23 4.14 0.086489648 0.086489648 0.00744384Fe2O3 55.845 159.69 5.25 37.92 0.679022294 0.339511147 0.029220451
11.61895643 1
w of element (g/mol) w of oxide (g/mol) density oxide (g/cm3) w of elementl (g) moles of element moles of oxide molar fraction oxideCaO 40.078 56.078 3.34 39.67 0.989819851 0.989819851 0.075561579 00580MgO 20.305 36.305 3.7 21 1.034228023 1.034228023 0.078951642Na2O 22.99 61.98 2.27 7.47 0.32492388 0.16246194 0.012402136K2O 39.098 94.196 2.35 29 0.741725919 0.37086296 0.028311203Al2O3 26.982 101.964 3.247 113.33 4.200207546 2.100103773 0.160319231SiO2 28.086 60.086 2.648 219.98 7.832372 7.832372 0.597913241TiO2 47.867 79.867 4.23 5.47 0.11427497 0.11427497 0.008723605Fe2O3 55.845 159.69 5.25 55.33 0.990778046 0.495389023 0.037817363
13.09951254 1
ECN-E--10-077 33

ECN-E--10-077 34
LCS374NBO/T
-0.
LCS317NBO/T
-0.
LCS446NBO/T
-0.
w of element (g/mol) w of oxide (g/mol) density oxide (g/cm3) w of elementl (g) moles of element moles of oxide molar fraction oxideCaO 40.078 56.078 3.34 17.35 0.432905834 0.432905834 0.042187301 10582MgO 20.305 36.305 3.7 9.12 0.449150456 0.449150456 0.043770363Na2O 22.99 61.98 2.27 2.93 0.127446716 0.063723358 0.006209934K2O 39.098 94.196 2.35 32.19 0.823315771 0.411657885 0.040116657Al2O3 26.982 101.964 3.247 88.35 3.274405159 1.637202579 0.159547763SiO2 28.086 60.086 2.648 193.49 6.889197465 6.889197465 0.671362273TiO2 47.867 79.867 4.23 4.03 0.084191614 0.084191614 0.008204595Fe2O3 55.845 159.69 5.25 32.78 0.586981825 0.293490912 0.028601115
10.2615201 1
w of element (g/mol) w of oxide (g/mol) density oxide (g/cm3) w of elementl (g) moles of element moles of oxide molar fraction oxideCaO 40.078 56.078 3.34 19.63 0.4897949 0.4897949 0.04215481 10715MgO 20.305 36.305 3.7 10.39 0.511696626 0.511696626 0.044039809Na2O 22.99 61.98 2.27 3.06 0.133101348 0.066550674 0.005727767K2O 39.098 94.196 2.35 30.52 0.780602588 0.390301294 0.033591768Al2O3 26.982 101.964 3.247 95.87 3.55310948 1.77655474 0.152901403SiO2 28.086 60.086 2.648 223.51 7.958057395 7.958057395 0.684920151TiO2 47.867 79.867 4.23 4.14 0.086489648 0.086489648 0.00744384Fe2O3 55.845 159.69 5.25 37.92 0.679022294 0.339511147 0.029220451
11.61895643 1
w of element (g/mol) w of oxide (g/mol) density oxide (g/cm3) w of elementl (g) moles of element moles of oxide molar fraction oxideCaO 40.078 56.078 3.34 39.67 0.989819851 0.989819851 0.075561579 00580MgO 20.305 36.305 3.7 21 1.034228023 1.034228023 0.078951642Na2O 22.99 61.98 2.27 7.47 0.32492388 0.16246194 0.012402136K2O 39.098 94.196 2.35 29 0.741725919 0.37086296 0.028311203Al2O3 26.982 101.964 3.247 113.33 4.200207546 2.100103773 0.160319231SiO2 28.086 60.086 2.648 219.98 7.832372 7.832372 0.597913241TiO2 47.867 79.867 4.23 5.47 0.11427497 0.11427497 0.008723605Fe2O3 55.845 159.69 5.25 55.33 0.990778046 0.495389023 0.037817363
13.09951254 1