environmental taxation in transportbookstore.teri.res.in/docs/journals/ijggd_vol 2 issue2...te...
TRANSCRIPT
The InTernaTIonal Journal on Green GrowTh and developmenT • 2:2 (2016) • 51--86
ArtIcle
Environmental Taxation in Transport
GUNNAR S ESKELAND1 AND HAAKON E LINDSTAD2
Abstract: For the purpose of providing public goods (e.g., air quality, congestion management, and greenhouse gas mitigation), the transportation sector employs—and should employ—imperfect policy instruments, such as fuel taxes, feebates, emission standards, and tolls. Then, policymakers need knowledge of the sector and how it can be more environment-friendly. With examples from cars to maritime shipping, common themes in environmental improvements beyond technology improvements—exploitation of scale economy, capacity utilization, and slower speeds—have been highlighted. Imperfect instruments ask for awareness of a broader set of environmental responses. Fuel taxes will, to some extent, succeed in eliciting responses, such as scale economy, capacity utilization, slowdown, and mode change from air to surface, from road to rail, and from rail to sea. Standards often work narrowly through technology and new acquisitions, such as individual vehicles or vessels.
Keywords: Congestion, Emission reduction, Environment, Greenhouse gases, Mitigation, Accidents, Public goods, Road pricing, Taxation, Transport sector, Scale, Capacity utilization
1 Professor, Norwegian School of Economics, Bergen, Norway. Email: [email protected] Senior Research Scientist, Norwegian Marine Technology Research Institute – MARINTEK,
Trondheim, Norway. Email: [email protected]
The InTernaTIonal Journal on Green GrowTh and developmenT • 2:2 (2016) • 51--86
52 • articlEs
Introduction
Public Goods, such as Local Air Quality, and their Link to Transport Activities
Environmental goods and services are often ‘pure public goods’, meaning that they are available to all.3 This implies that they may need policy intervention (from government, typically) to be protected or provided at efficient levels. This overall framework—using the concept of pure public goods to place environmental protection in the body of welfare economics—suggests that analysis and intervention start with the cross-sectoral coordination of powers that relate to public goods (e.g., air quality), as in a city council or environment ministry (see Table 1). In the following sections, we stretch the idea of the ‘environment’ so that traffic accidents, congestion, and road wear can be included as public goods. The risk of accidents is, for example, influenced by non-rivalrous and non-excludable conditions, such as the general quality of infrastructure, cars, and drivers. We still allow ourselves to use traditional terms/phrases, such as ‘polluting’, ‘emissions’, ‘abatement’, and ‘beneficiaries of environmental improvements’, since they are most closely aligned with established analytical tools and our examples. In Table 1, for example, we use the term ‘benefit domain’ for an airshed and the people benefiting from air quality improvements within its geographical boundary.
The Taxation of Fuels as a Policy Lever to Supply Environmental Goods and Services
Table 1 illustrates that there are several dimensions that make fuel taxes imperfect from the point of view of public goods provision (or protection), with the imperfections varying in importance across the public goods. Two points stand out. First, location and time are important. For public goods, such as local air quality and congestion, one may want to introduce urban toll rings or other instruments to supplement fuel taxes and differentiate discouragement of fuel use by location and time of day, season, and perhaps air quality status. Second, abatement and technology may be critical. For air quality, one may want cleaner cars and fuels in other ways than what can be achieved by fuel taxes. Provision of public goods may also ask for raising variable costs in a way that is dependent on location and the characteristics of a vehicle, as is the case for road wear and Germany’s odometer-based fee, or with lower urban tolls for emission-free cars, as in Norway.
3 As used herein, the phrase ‘pure public goods’ implies that an individual’s enjoyment of something (e.g., air quality improvements) is not diminished by someone else enjoying it too (non-rivalry) and cannot easily be excluded or charged for (non-excludability, see Samuelson, 1954). Since a public good, such as air quality, can also be thought of as air pollution, though with the opposite sign, the term is interchangeable with ‘public bad’, with emission reductions representing a ‘public good’ provision and emissions representing a ‘public bad’ provision (Kolstad 2011).
The InTernaTIonal Journal on Green GrowTh and developmenT • 2:2 (2016) • 51--86
articlEs • 53
In many cases, a fuel tax is applied because of how it works through an average of conditions, generally discouraging the scale of the transportation activity and enticing responses along the lines of fuel efficiency. Both of these often coincide when supporting environmental goals, though, as explained above, also fail to produce desirable responses.4
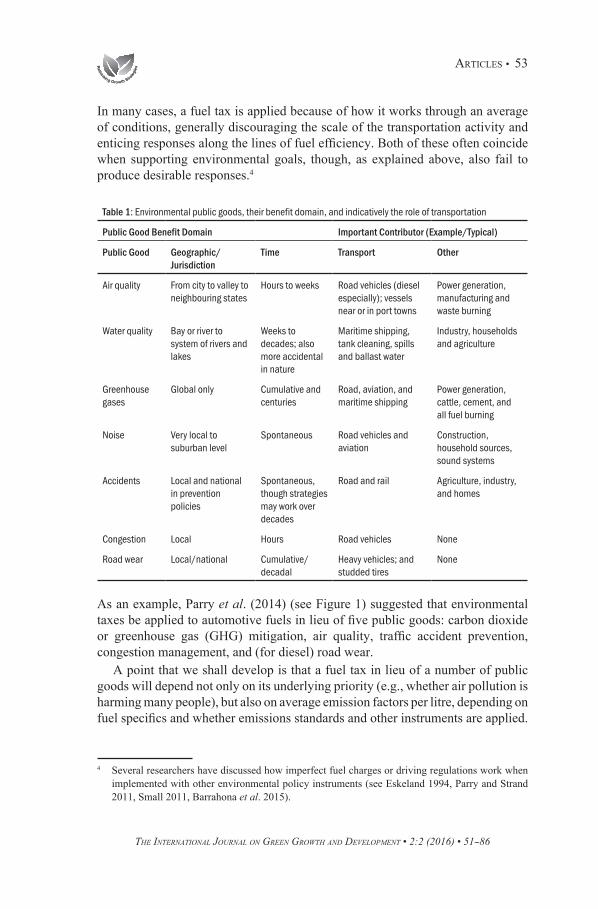
Table 1: Environmental public goods, their benefit domain, and indicatively the role of transportation
Public Good Benefit Domain Important Contributor (Example/Typical)
Public Good Geographic/ Jurisdiction
Time Transport Other
Air quality From city to valley to neighbouring states
Hours to weeks Road vehicles (diesel especially); vessels near or in port towns
Power generation, manufacturing and waste burning
Water quality Bay or river to system of rivers and lakes
Weeks to decades; also more accidental in nature
Maritime shipping, tank cleaning, spills and ballast water
Industry, households and agriculture
Greenhouse gases
Global only Cumulative and centuries
Road, aviation, and maritime shipping
Power generation, cattle, cement, and all fuel burning
Noise Very local to suburban level
Spontaneous Road vehicles and aviation
Construction, household sources, sound systems
Accidents Local and national in prevention policies
Spontaneous, though strategies may work over decades
Road and rail Agriculture, industry, and homes
Congestion Local Hours Road vehicles None
Road wear Local/national Cumulative/decadal
Heavy vehicles; and studded tires
None
As an example, Parry et al. (2014) (see Figure 1) suggested that environmental taxes be applied to automotive fuels in lieu of five public goods: carbon dioxide or greenhouse gas (GHG) mitigation, air quality, traffic accident prevention, congestion management, and (for diesel) road wear.
A point that we shall develop is that a fuel tax in lieu of a number of public goods will depend not only on its underlying priority (e.g., whether air pollution is harming many people), but also on average emission factors per litre, depending on fuel specifics and whether emissions standards and other instruments are applied.
4 Several researchers have discussed how imperfect fuel charges or driving regulations work when implemented with other environmental policy instruments (see Eskeland 1994, Parry and Strand 2011, Small 2011, Barrahona et al. 2015).

The InTernaTIonal Journal on Green GrowTh and developmenT • 2:2 (2016) • 51--86
54 • articlEs
Transport Activities: Their Role in Our Economies
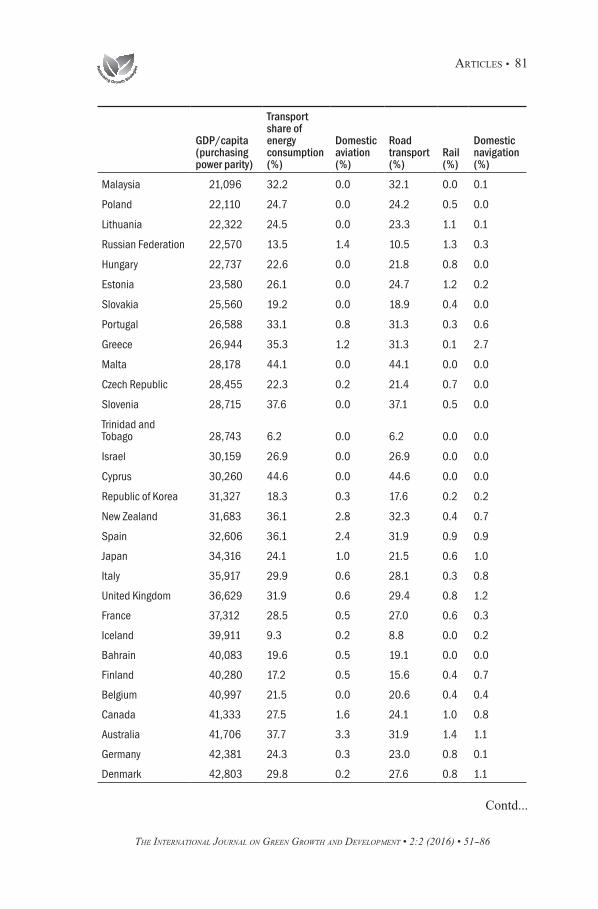
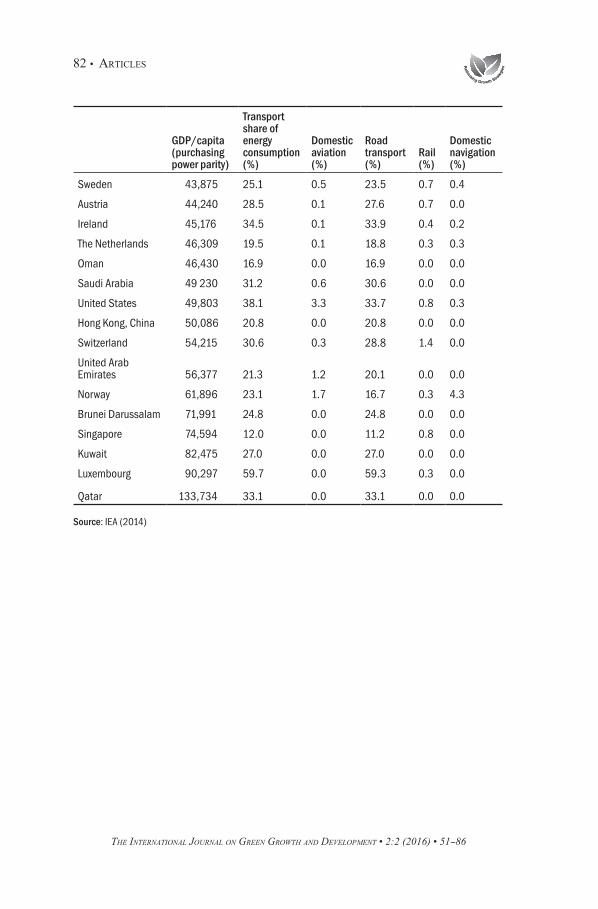
Figure 2 shows—for a select set of countries—the share of domestic transport in total energy consumption by country (see annexure 1 for more complete data). We can see that domestic transport tends to be:• In the range between a fifth and a third of total energy consumption;• Lower for poor, agriculturally-based countries;• Lower for small countries, and countries with an extensive coastline and large
coastal population; and• Dominated by road transport. In addition to domestic transport, transnational movements exist, dominated by maritime shipping of cargo and passenger aviation, each representing 2–3 per cent of global GHG emissions (Buhaug et al., 2009). Figure 3 shifts attention to globalization, transport, and some observations of development over time and shows that the growth in international trade is much smaller in tonnes moved than in dollar value. This means that movement of high-value light items (e.g., garments and electronics) has expanded much more than movement of low-value cargo that costs a lot of energy to move per dollar (e.g., ore, oil, coal, and grain). In fact, tonnes moved have increased in almost exact proportion to world output, or GDP.
Source: Parry et al. (2014) Note: Applied taxes, and in some cases a subsidy, are more often than not lower than suggested, indicating potential for low-cost environmental improvements.
Figure 1: Suggested road fuel taxes in lieu of five public goods

The InTernaTIonal Journal on Green GrowTh and developmenT • 2:2 (2016) • 51--86
articlEs • 55
Figure 2: Domestic transport’s share in total domestic energy consumption for selected countries
Source: IEA (2014), energy efficiency indicators for transport. Data and detail in Annexure 1.
Figure 2 also shows that tonne miles (nautical miles), which is a measure of total transportation work, increases in just about the same proportion as tonnes moved, meaning that the average freight distance has been constant. In this transport-weighted sense, the world has not expanded. Finally, Figure 2 illustrates that to the extent that fuel use in transport is a good proxy for relevant environmental public goods (for GHGs, it is just about perfect), it has increased by even less—150 per cent compared to 250 per cent. As we shall see later, the average fuel consumption (and CO2, or more broadly GHG emissions) per tonne mile of transportation work falls with various factors, such as lower speeds, larger vessels, and slender hulls, as well as technology. So the combined effect of these has been to reduce fuel consumption per tonne mile produced in this period. We shall show that this potential continues to be sizeable.
Environmental Quality: First Declining and then Improving with Income?
Transport tends to rise with income. In consumption, transport is either a normal or a luxury good, and transport is also an input into production. Given this tendency, one should not be surprised to see environmental concerns rising with income growth. All that is required is for some of the environmental phenomena to show capacity constraints that require collectively induced abatement at high (not

The InTernaTIonal Journal on Green GrowTh and developmenT • 2:2 (2016) • 51--86
56 • articlEs
low) levels of transport activities. This will lead to higher willingness to pay for environmental improvements. Whether or not it halts or even reverses deterioration of environmental public goods depends on three factors: (i) income dependence in demand for public goods, (ii) the cost of environmental improvements, and (iii) whether institutions for collective action and policy formation are sufficiently responsive and effective.
In some cases, institutions and abatement are fairly effective—lead was finally removed from gasoline for public health reasons and public-health-weighted air quality improved. In such a case, recommended environmental taxation of
Sources: UNCTAD (2014), IEA (2014), Lindstad (2013) and authors’ own calculations. Abbreviation: TOE = tonnes of oil equivalent
Figure 3: World trade, maritime transport, and other indicators (1979–2012)
The InTernaTIonal Journal on Green GrowTh and developmenT • 2:2 (2016) • 51--86
articlEs • 57
gasoline per litre may decline when the health-weighted emission factor per litre of gasoline declines.
The hypothesis which states that with income growth, environmental quality will first decline then improve is called the Environmental Kuznetz Curve. In the case of transport related public goods, such as air quality and traffic safety, it is both possible and probable to see these public goods initially deteriorate with income growth and then improve. Transport quantity and quality may continue to rise throughout and fuel tax rates may decline if policy instruments and abatement options are sufficiently effective.
The Analytical Foundation of Environmental Taxation
The textbook proposition that environmental problems are best addressed through market-based instruments, such as tradable quotas or emission taxes, is a sophisticated one that is often misunderstood.5
A key idea is that persons and companies try to avoid costs to the extent they can. If emissions are priced uniformly per gram weighted by damage, people and companies will try to reduce emissions up to the point where their marginal abatement costs are equal to that price:
(1) tel = che = ci
e
Where che is the marginal cost of emission reductions (or marginal abatement
costs) for all individuals, firms or sectors h and i. The equality thus ensured across persons, firms, sectors, and abatement alternatives constitutes cost-effective provision of public goods or protection of the environment.
Even when they are cost-effective, such protection of the environment has a cost to persons and firms, and thus to society, and should be justified by environmental benefits. A disciplined route to optimal provision of public goods is the Samuelson condition (1954). Taking the example of a local public good, it asks the emission tax tel (e for emissions, l for a local public good, like air quality) to be set at a level equal to the sum across individuals of marginal benefits of environmental improvements, as follows:
(2) tel = ∑n
(h=1) bhel = nl bel
Here, bhel is the marginal benefit locally (e.g., in a city) to an individual h from
being exposed to reduced emissions in the individual’s area, and expresses the
5 Kolstad (2011). offers a strong textbook exposition, emphasizing the foundation in public goods. Other scholars offer applications with emphasis on fuel taxes (see Parry and Strand 2011, Parry 2012, and Parry et al. 2014).
The InTernaTIonal Journal on Green GrowTh and developmenT • 2:2 (2016) • 51--86
58 • articlEs
same sum with an average for all the individuals in the city. Equation (2) represents a collective demand—willingness to pay—for environmental quality, and through the tax, it asks everyone who can help provide environmental improvement to respond so that demand equals supply.
Fuel Taxation
Alternatively, when the emission tax is levied not on grams of weighted emissions but per litre, the following applies:
(3) teql=∑n
(h=1)bhel = nl bel eql
Here eql is an appropriate average emission coefficient per litre, q, for grams of locally damaging emissions. Benefits must take into account the fact that the fuel tax may have to apply uniformly across locations where benefits differ, for instance, averaged between emissions in a rural area where benefits of air quality improvements are zero and an urban area where benefits are positive.
In this exposition, we have omitted two issues. First, we did not bring in the possibility of a positive ‘shadow price’ of public revenue. In doing so, we essentially, in equations (1) to (3), assume that income has the same value in private and in public hands, so the transfer to the government is not valued in itself (polluters may of course be public, too). Second, though we could have used the idea of revenue neutral reform to justify not examining the shadow price of public revenue, we would have fallen short on the analysis of which other taxes should be reduced if environmental taxes are raised.6
We thus omit, here, the debates of ‘double dividends’ from ‘green tax’ reform. Our focus is on what environmental taxes can do for environmental improvements —the first dividend only. Green taxes can raise substantial revenue, not the least when levied on fuels. But this should not distract attention from the fact that good environmental policies reduce emissions and damages, and thus welcome a shrinking tax base if it is shrinking for the right reasons.
The consequences of revenue neutral green tax reform—a fruitful approach both in terms of analytics and reform communication—depends on which other taxes are reduced and whether to emphasize efficiency gains (e.g., reducing taxes on labour, savings, or business, since these are costly in terms of distortions) or incidence (e.g., reducing taxes on the poor to protect the vulnerable). Both topics are beyond the scope of this paper.
6 Several studies have explored the role of a government revenue constraint, as well as revenue neutral reform, tax interactions, and environmental tax incidence (e.g., see Sandmo 1975, Goulder 1995, Goulder et al. 1999, Bovenberg 1999).
The InTernaTIonal Journal on Green GrowTh and developmenT • 2:2 (2016) • 51--86
articlEs • 59
With these shortcomings in mind, an important message can be derived from equations (1) to (3): a general consequence of using market-based instruments, such as tradable quotas or taxes, to attain environmental improvements is the equalization of marginal costs of environmental improvements across polluters (or providers of public goods), leading to cost-effective environmental improvements.
Abatement Options Different from Reduced Transport or Fuel Use
Pollution and other problems are neither (in general) proportional to output nor to fuel use. Tax approaches, such as a tax on fuel use, are employed in part because they are simple in terms of monitoring, enforcement, and collection, and will thus incentivize some of the responses sought for the environment, but not others. Tax approaches may even lead to some undesirable responses. In contrast, for the textbook case, with an emission tax based on continuous or cumulative monitoring of individual emissions, all desirable responses are actually incentivized in an optimal combination.
In the case of a fuel tax, one must ask how fuel reductions from fuel taxes shall be combined with abatement that is induced by other means, for example, emission standards that reduce emissions of locally damaging air pollutants per litre of fuel or per vehicle kilometre (Eskeland 1994):
(4) teq
eql
= c’ē
Here, c’ē
is the marginal cost of emission reductions from tightening emission standards or in other ways along the technical-control cost curve (e.g., see the Mexico City example). Simply put, a cost-effective pollution control programme views the demand for polluting fuels—or polluting trips [the left hand side of (4)]—as a supply curve for emission reductions, comparable to and competing with the technical-control cost curve (the right hand side). Therefore, the cost-effective programme sets the tax rate on fuels, per unit of emissions, equal to the marginal abatement costs, as shown in the fourth equation.
In Figure 4, panel A displays the idea that a public good, such as air quality, can be provided in part by consumption reduction when travel is produced by consumption of fuel. In panel B, such an output reduction is attained with a fuel tax or an output or input tax, assumed equivalent in this case. In panel C, we have assumed that an abatement option (that is different from output reduction) is to change the technology (a filter, say, an electric engine, or a catalytic converter) to reduce the emission coefficient per litre of fuel. Such a change may be imposed by regulation, such as an emission standard. In panel D, an optimal combination of output reduction and abatement is employed, which can be induced either by a skillful combination of a fuel tax and an emission standard or by a textbook-emission tax based on monitored annual emissions.

The InTernaTIonal Journal on Green GrowTh and developmenT • 2:2 (2016) • 51--86
60 • articlEs
Several Public Goods: Local Air Quality and Global Greenhouse Gas Emissions
We can, in the same spirit, include taxes that reflect global benefits of GHG reductions, multiplied by seven billion plus individuals (and their descendants) who will benefit, so that a litre of gasoline is taxed at the sum of two rates:
(5) teq= teql + teqg = nl bel eql +ngbeg eqg
Here, beg is the average per capita global benefit of GHG emission reductions, and ngbeg eqg is the social cost of carbon expressed per litre of gasoline.
Source: Author’s own calculations
Figure 4: When demand reduction or abatement or a combination offers emission reduction

The InTernaTIonal Journal on Green GrowTh and developmenT • 2:2 (2016) • 51--86
articlEs • 61
Gasoline, here, is only an example, of course, but the basic idea is that a fuel, such as gasoline, will be taxed for several reasons in lieu of different public goods, often with different geographical domains (and jurisdictional domains, perhaps, as with local and global). Averaging marginal damages per litre for uses and users within the bounds given for tax differentiation will be necessary.
Three Examples of Tax Policy Instruments in Transport
In this section, we present three examples from transport: (i) road, (ii) passengers, and (iii) maritime shipping and cargo, to illustrate considerations in practice of using fiscal instruments for environmental purposes, as well as seeing how they will be supplemented.
Air Quality in Mexico City: Fuel Taxes Combined with Emission Standards
Road vehicles have been an important target of air quality policies for many decades, and quite impressive advances have been made in terms of emissions that are harmful to public health locally. Key successes have been the removal of sulphur and lead in fuels, and reducing trace elements of incomplete combustion with improved ignition systems and catalytic converters. The latter relates more to a car’s characteristics than to its fuel consumption, thus it is not easily attained with fuel taxation designs. Lead and sulphur removals can in principle be enhanced with taxes depending on fuel characteristics, though there have often been important arguments for regulatory approaches (e.g., concern for misfuelling).
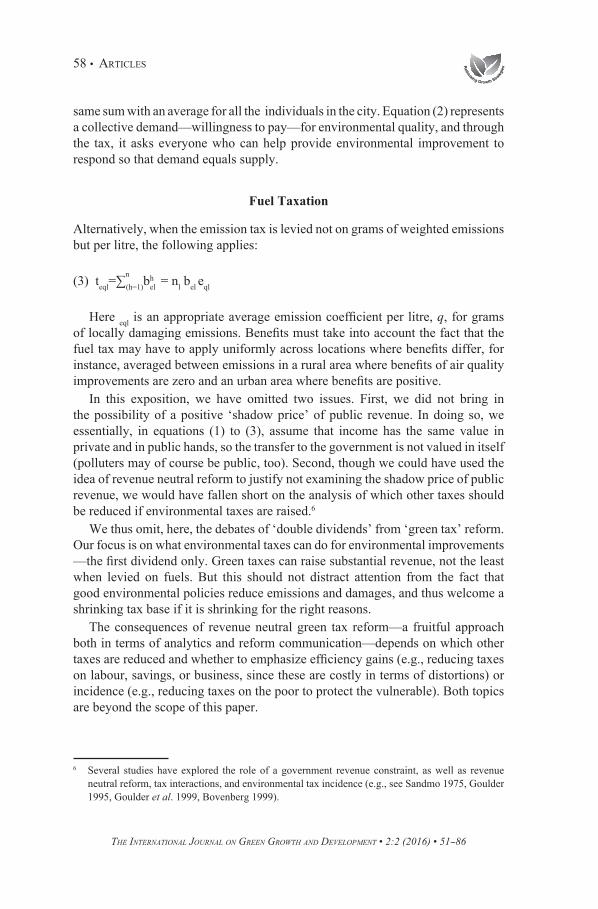
Many of the modifications that can make cars and fuels less polluting may require policy instruments other than fuel taxes. To be simplistic, one can think differently about those policy instruments that can make cars and fuels cleaner, and those policy instruments that discourage car use and fuel use. Figure 5, is from a study that made this point (Eskeland 1994). Eskeland highlighted that policy instruments that make cars and fuels cleaner—often taking the shape of emission standards applied to new car models when sold or also to cars in use through mandatory inspection and maintenance programmes—should be complemented with a gasoline/ diesel tax to manage the scale of the polluting activity of driving. The study estimated that a given air quality target for Mexico City would be about 30 per cent less expensive (in welfare terms) if one included demand-management instruments, such as gasoline taxes, in the toolbox of policy instruments since the most expensive technical controls would not need to be used (see Eskeland and Feyzioglu 1997b).
The example illuminates some other points. First, many emission-reducing initiatives entail a fixed cost at the point of manufacture or retrofit, which yields emission-reduction benefits proportional to the vehicle’s annual usage. This has the implication that policy instruments which target high-use vehicles first (e.g., taxis before cars in ordinary family use) are more cost-effective. Second,
The InTernaTIonal Journal on Green GrowTh and developmenT • 2:2 (2016) • 51--86
62 • articlEs
larger vehicles often offer low-emission transport more cheaply, so public transport is enhanced. In the Mexico City control-cost curve, taxis, minibuses, and buses demonstrated these points (see Figure 4). Third, policies that can be phased in with the speed of vehicle purchases (including replacements) will be easier and cheaper than policies trying to move faster. Finally, if old, polluting vehicles can be transferred to non-polluted rural areas, this may be a better option than policies leading to scrappage.
An important observation is that such knowledge is not needed by policymakers in the theoretical textbook case when an emission tax is available, since a tax levied on emissions continuously measured would make vehicles and trips and abatement opportunities self-select along such lines.
When one moves from emissions of air pollutants to GHGs, another point surfaces: there are greater emissions from GHGs when compared to local air pollutants which are strictly proportional to the fuel consumed. Thus, for GHG emissions, fuel taxes alone will provide complete incentives. These need to take into account differences across fuels, which is easily built into GHG-motivated fuel taxation systems.
In contrast to GHG mitigation, air quality controls may be worth more in certain urban locations and times than in others—a differentiation that generally cannot
Figure 5: Supply curve for emission reductions in Mexico City, with and without an optimally matching gasoline tax
The InTernaTIonal Journal on Green GrowTh and developmenT • 2:2 (2016) • 51--86
articlEs • 63
be built into fuel prices. Thus, for air quality and congestion, tolls may be suitable as supplementary policy instruments. Norwegian toll rings allow electric cars to pass for free, conveying that such differentiation is possible. It would, however, be more sensible to make electric cars pay for road use and congestion, even if they should pay less or nothing for air pollutant emissions. There is also a discussion about whether electric cars in hydro-based Norway should be held accountable for a fossil share in European electricity generation (Eskeland 2012).
Finally, the Mexico City example also demonstrated the value of market-based instruments in discouraging environmentally damaging driving activity. We have already discussed how a fuel tax can reduce polluting trips and the scale of a polluting activity. This recommendation was in contrast to a driving restriction hoy no circula (today, not driving), which used license plate numbers to ban driving, i.e., allowing a car to run only one workday per week. Such a driving restriction is unable to select the least important trips. It also has the disadvantage that it raises the value of an additional car. Many Mexico City households made such acquisitions and the regulation increased driving. The driving restriction reversed the traditional flow of used cars registered in the capital being exported to the rest of the country, resulting in more pollution.7
Carbon Leaner Cars, with Fiscal Instruments
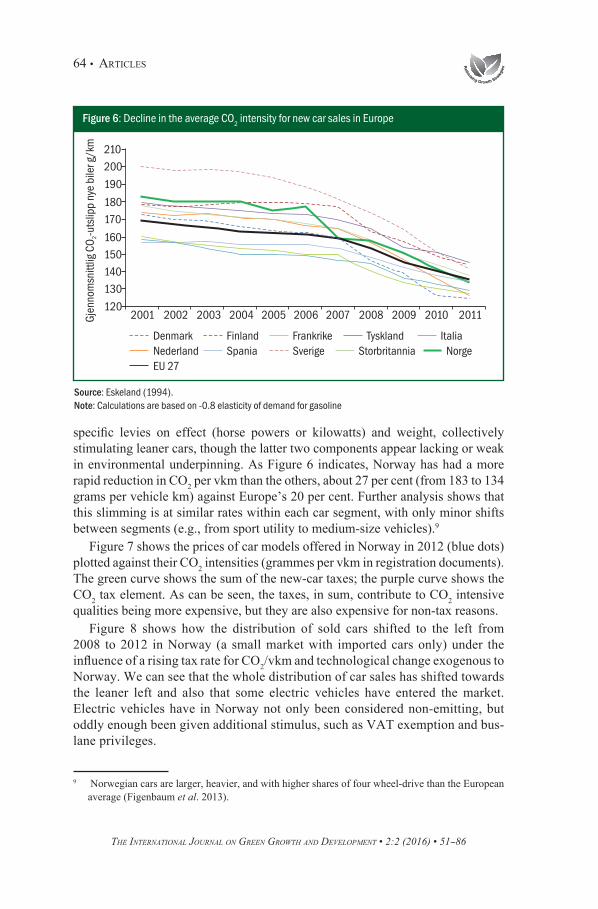
Figure 6 shows the average CO2 intensity—CO2 grammes per vehicle kilometre (vkm)—for new cars sold in European countries from 2001 to 2011. European countries generally have quite high fuel taxes, often including a ‘carbon tax’, which is a suitable instrument according to textbook environmental economics. European countries have, in addition to fuel taxes, set specific goals for a car fleet to become ‘carbon-leaner’, and the figure shows that cars have indeed become leaner over the period.
Since 2006, the policy instrument in Norway has been a specific tax levied in the ‘new car tax schedule (engangsavgiften) for each gram of CO2 per vehicle kilometre (vkm). The tax resembles a feebate, combining a rebate for CO2 lean cars and a tax for cars with high CO2/vkm.8 The feebate works together with
7 Several researchers (e.g., Eskeland and Feyzioglu 1997a, Davis 2008, Barrahona et al. 2015) have performed analyses on driving restrictions, including the beneficial effects when they are designed to accelerate vehicle turnover towards cleaner cars, as attempted in Santiago, Chile.
8 Policies in some EU countries and the US Corporate Average Fuel Economy (CAFE) standards have had similar features. These approaches reduce fuel consumption per vehicle kilometre, but they do not reduce driving. Thus, they risk a ‘rebound’ in driving because variable user costs decline, unless fuel taxes are raised. Small (2011) analysed tighter fuel efficiency standards in the United States (or steeper feebates, similar to the Norwegian system) as compared to higher fuel taxes and found that fuel taxes offer fuel and emission reductions at a lower welfare cost. Eskeland and Mideksa (2008) explored why fuel economy standards often appear in real world policies, emphasizing transition and political commitment.
The InTernaTIonal Journal on Green GrowTh and developmenT • 2:2 (2016) • 51--86
64 • articlEs
specific levies on effect (horse powers or kilowatts) and weight, collectively stimulating leaner cars, though the latter two components appear lacking or weak in environmental underpinning. As Figure 6 indicates, Norway has had a more rapid reduction in CO2 per vkm than the others, about 27 per cent (from 183 to 134 grams per vehicle km) against Europe’s 20 per cent. Further analysis shows that this slimming is at similar rates within each car segment, with only minor shifts between segments (e.g., from sport utility to medium-size vehicles).9
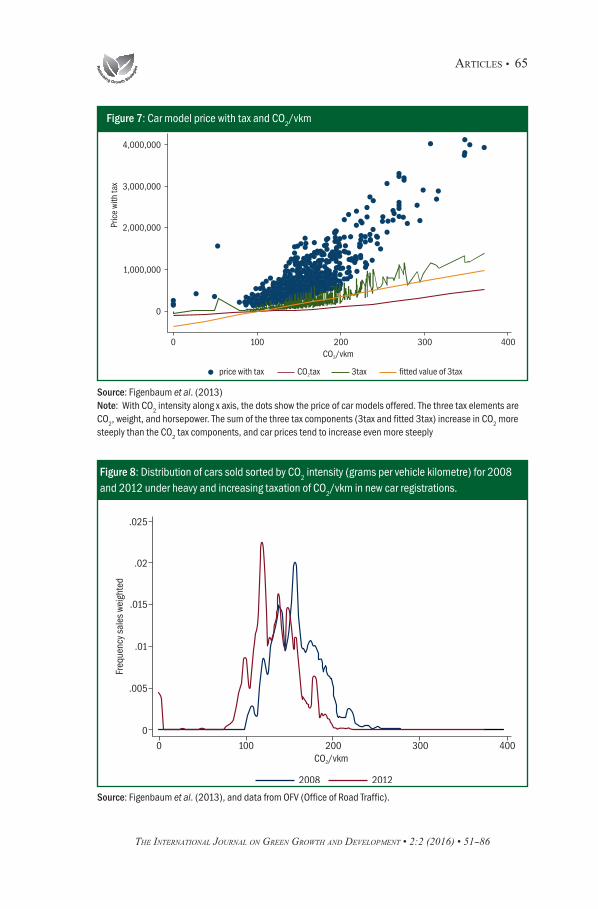
Figure 7 shows the prices of car models offered in Norway in 2012 (blue dots) plotted against their CO2 intensities (grammes per vkm in registration documents). The green curve shows the sum of the new-car taxes; the purple curve shows the CO2 tax element. As can be seen, the taxes, in sum, contribute to CO2 intensive qualities being more expensive, but they are also expensive for non-tax reasons.
Figure 8 shows how the distribution of sold cars shifted to the left from 2008 to 2012 in Norway (a small market with imported cars only) under the influence of a rising tax rate for CO2/vkm and technological change exogenous to Norway. We can see that the whole distribution of car sales has shifted towards the leaner left and also that some electric vehicles have entered the market. Electric vehicles have in Norway not only been considered non-emitting, but oddly enough been given additional stimulus, such as VAT exemption and bus-lane privileges.
9 Norwegian cars are larger, heavier, and with higher shares of four wheel-drive than the European average (Figenbaum et al. 2013).
Source: Eskeland (1994). Note: Calculations are based on -0.8 elasticity of demand for gasoline
Figure 6: Decline in the average CO2 intensity for new car sales in Europe
The InTernaTIonal Journal on Green GrowTh and developmenT • 2:2 (2016) • 51--86
articlEs • 65
Source: Figenbaum et al. (2013) Note: With CO2 intensity along x axis, the dots show the price of car models offered. The three tax elements are CO2, weight, and horsepower. The sum of the three tax components (3tax and fitted 3tax) increase in CO2 more steeply than the CO2 tax components, and car prices tend to increase even more steeply
Source: Figenbaum et al. (2013), and data from OFV (Office of Road Traffic).
Figure 7: Car model price with tax and CO2/vkm
Figure 8: Distribution of cars sold sorted by CO2 intensity (grams per vehicle kilometre) for 2008 and 2012 under heavy and increasing taxation of CO
2/vkm in new car registrations.
The InTernaTIonal Journal on Green GrowTh and developmenT • 2:2 (2016) • 51--86
66 • articlEs
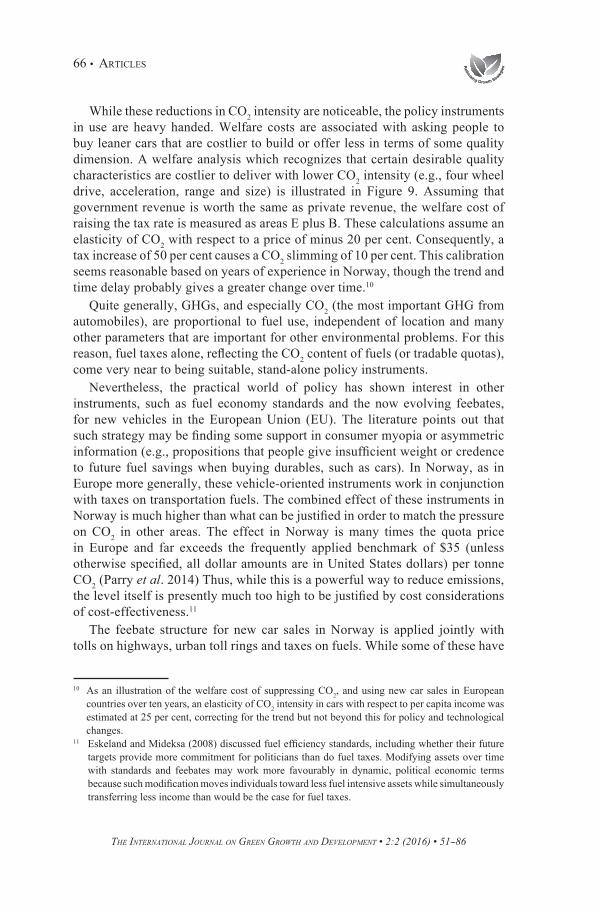
While these reductions in CO2 intensity are noticeable, the policy instruments in use are heavy handed. Welfare costs are associated with asking people to buy leaner cars that are costlier to build or offer less in terms of some quality dimension. A welfare analysis which recognizes that certain desirable quality characteristics are costlier to deliver with lower CO2 intensity (e.g., four wheel drive, acceleration, range and size) is illustrated in Figure 9. Assuming that government revenue is worth the same as private revenue, the welfare cost of raising the tax rate is measured as areas E plus B. These calculations assume an elasticity of CO2 with respect to a price of minus 20 per cent. Consequently, a tax increase of 50 per cent causes a CO2 slimming of 10 per cent. This calibration seems reasonable based on years of experience in Norway, though the trend and time delay probably gives a greater change over time.10
Quite generally, GHGs, and especially CO2 (the most important GHG from automobiles), are proportional to fuel use, independent of location and many other parameters that are important for other environmental problems. For this reason, fuel taxes alone, reflecting the CO2 content of fuels (or tradable quotas), come very near to being suitable, stand-alone policy instruments.
Nevertheless, the practical world of policy has shown interest in other instruments, such as fuel economy standards and the now evolving feebates, for new vehicles in the European Union (EU). The literature points out that such strategy may be finding some support in consumer myopia or asymmetric information (e.g., propositions that people give insufficient weight or credence to future fuel savings when buying durables, such as cars). In Norway, as in Europe more generally, these vehicle-oriented instruments work in conjunction with taxes on transportation fuels. The combined effect of these instruments in Norway is much higher than what can be justified in order to match the pressure on CO2 in other areas. The effect in Norway is many times the quota price in Europe and far exceeds the frequently applied benchmark of $35 (unless otherwise specified, all dollar amounts are in United States dollars) per tonne CO2 (Parry et al. 2014) Thus, while this is a powerful way to reduce emissions, the level itself is presently much too high to be justified by cost considerations of cost-effectiveness.11
The feebate structure for new car sales in Norway is applied jointly with tolls on highways, urban toll rings and taxes on fuels. While some of these have
10 As an illustration of the welfare cost of suppressing CO2, and using new car sales in European countries over ten years, an elasticity of CO2 intensity in cars with respect to per capita income was estimated at 25 per cent, correcting for the trend but not beyond this for policy and technological changes.
11 Eskeland and Mideksa (2008) discussed fuel efficiency standards, including whether their future targets provide more commitment for politicians than do fuel taxes. Modifying assets over time with standards and feebates may work more favourably in dynamic, political economic terms because such modification moves individuals toward less fuel intensive assets while simultaneously transferring less income than would be the case for fuel taxes.
The InTernaTIonal Journal on Green GrowTh and developmenT • 2:2 (2016) • 51--86
articlEs • 67
Source: Figenbaum et al. (2013). Note: The estimates are based on the assumption that resources have the same value in the hands of government as they do in the hands of households.
Figure 9: Schematic treatment of the welfare costs of using taxes to get carbon leaner cars
environmental goals attached to them, their motivation and design also bears evidence of revenue goals and redistributive goals.
Maritime Shipping: Slowing Down, Sizing Up, and Reshaping Vessels
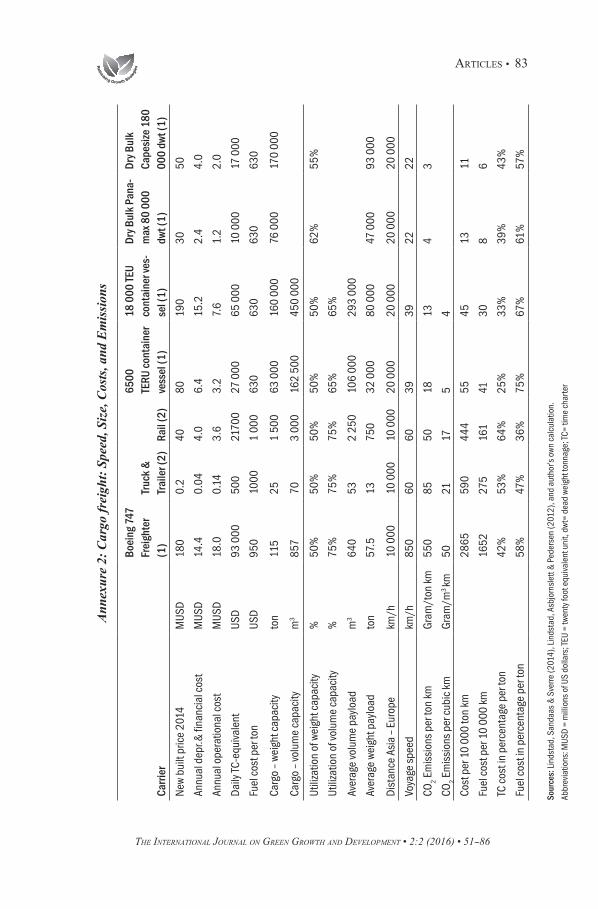
The shape and value of environmental taxation depends on the extent to which the sector can change its ways—or only its activity levels—in response to the taxes. We explore this topic utilizing the example of maritime transport as measured in transportation work—that is, cargo tonne-miles or tonne kilometres globally (Figure 10). As revealed in Figure 10, maritime shipping is dominant in global cargo movements; aviation is less than two tenths of one per cent of cargo tonne-kilometres.
Figure 11 gives an important hint that the strong dominance of maritime shipping is due to its lower energy cost per unit of transportation work performed, in tonne-miles or tonne-kilometres. The figure also shows that the cost-effectiveness ranking and differences for lighter goods, that is, costs per cubic metre transport times kilometres, is similar but with smaller differences. The figure also shows a strong role for scale economies in ‘lot size’ and ‘vehicle size’. The only exceptions to the rule that energy consumption (or CO2 grams per tonne-km) declines with lot size are related to large differences in speed: aviation is much faster than road haulage and container vessels move faster than bulk carriers. Cargo typically chooses faster service if it is valuable per tonne or otherwise time-sensitive. Speed and small lots (or ‘vehicle’ sizes) generally burn a lot of energy. Thus, large shipment lots and low speeds represent abatement options not only for GHG emissions, but

Figure 10: Estimates of the relative roles in global cargo freight by mode of transport, from 2011 and 2012
Source: International Transport Forum, OECD (2013) Note: Rail and road figures include the OECD member states, China, India and the Russian Federation only, thus they do not include inter alia freight within Africa, Latin America, and other parts of Asia.
also for other pollutant emissions. With regard to ‘short-travelled’ consumption (e.g., buying from your neighbourhood grain producer), efficient transport (e.g., not driving too much between suburban shops and farmers) is, by several orders of magnitude, more important than import distance for grains. To visualize the difference, imagine the small share of payload when tomatoes travel in your car as opposed to the large payload when they are imported in larger lots with specialized carriers and less staff.
Regarding the topic of fuel and CO2 consumption in maritime shipping, it is important to note that ships have typically been built to operate at or close to their maximum speeds (Silverleaf and Dawson 1966, Lindstad et al. 2014). However, in the years 2011–14, high oil prices resulted in bunker fuel (the fuel in most vessels). The high price of bunker fuel challenged the status quo, slowed down ships and raised interest in the relationship between speed and emission (see Corbett et al. 2009, Seas at Risk 2010, Psaraftis and Kontovas 2010, 2013, Lindstad et al. 2012, Jonkeren et al. 2012, Assmann et al. 2015).
A key observation from maritime shipping is that in an interval between a vessel’s maximum and minimum speeds, the fuel input ‘q’ (and CO2 emissions) per hour ‘h’ is the cube of speed (distance per hour, d/h), q/h = (d/h)3. This implies that when a ship reduces its speed, the fuel consumption and emissions per freight work unit are reduced. A 10 per cent speed reduction reduces fuel consumption and emissions per day by 30 per cent; it reduces consumption and emissions per tonne-mile transported by 20 per cent. This emission reduction, with speed, is

The InTernaTIonal Journal on Green GrowTh and developmenT • 2:2 (2016) • 51--86
articlEs • 69
mainly a substitution by capital for labour. Lower speeds require more capital tied up in vessels and cargo between ports.12
A second observation on maritime shipping is that large ships tend to be more energy efficient per freight unit than smaller vessels (Cullinane and Khanna 2000, Sys et al. 2008, Notteboom and Vemimmen 2009, Stott and Wright 2011, Lindstad et al. 2012, Lindstad 2013). Other, non-energy costs also tend to rise less than proportionally to cargo capacity. Thus, there are basically port and canal considerations that allow a role for small- and medium-size vessels, as when small shipments are required by port or storage constraints, or by low throughput, either at the exporter or importer nodes.13
A third observation on maritime shipping is that it is possible to introduce energy efficient designs, such as slender hulls, without making logistical changes
12 Tjalling Koopmans (1939) and Leif Johansen (1972) studied capital-energy substitution with oil tankers (see Lindstad and Eskeland 2015).
13 A source of convexity ensuring that shipment size is smaller for buyers or sellers with lower throughput per time period is the cost of storage between shipments. Jansson and Schneerson (1982) emphasized port and handling costs in lending a role to smaller vessels. The economics of hauling, however, favours the larger vessels.
Source: Lindstad, Asbjørnslett & Strømman (2015)
Figure 11: Grams of CO2 per unit of transportation work performed (tonne-kilometres and m3 kilometres)
The InTernaTIonal Journal on Green GrowTh and developmenT • 2:2 (2016) • 51--86
70 • articlEs
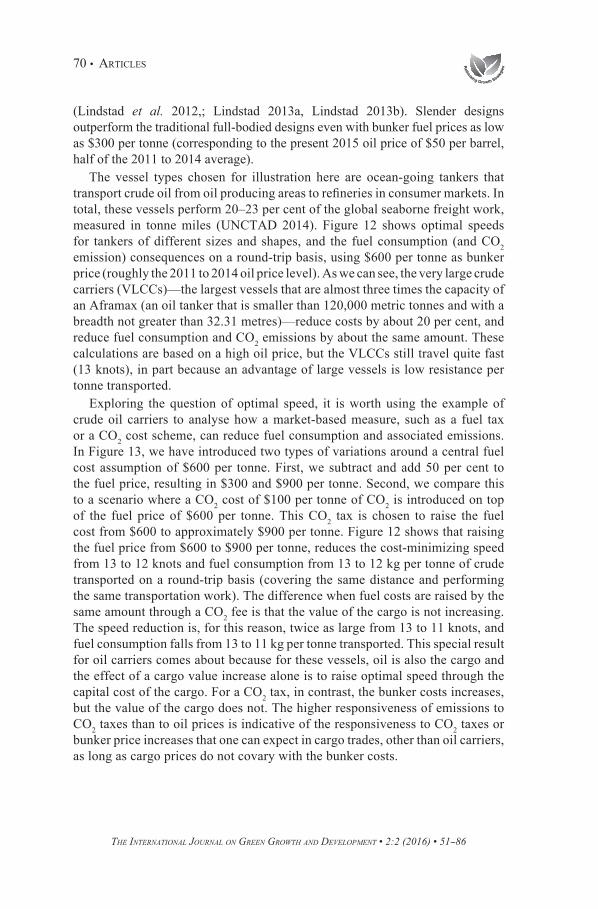
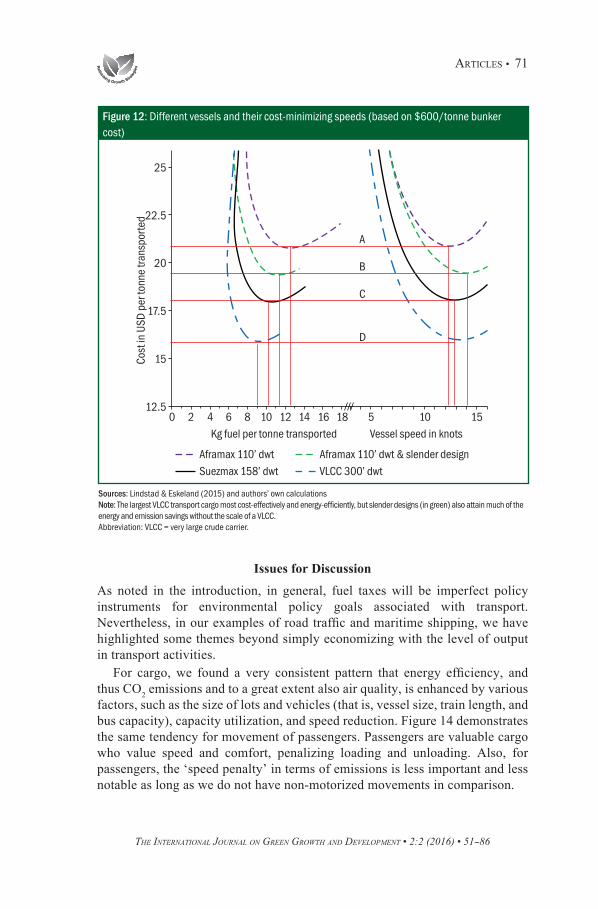
(Lindstad et al. 2012,; Lindstad 2013a, Lindstad 2013b). Slender designs outperform the traditional full-bodied designs even with bunker fuel prices as low as $300 per tonne (corresponding to the present 2015 oil price of $50 per barrel, half of the 2011 to 2014 average).
The vessel types chosen for illustration here are ocean-going tankers that transport crude oil from oil producing areas to refineries in consumer markets. In total, these vessels perform 20–23 per cent of the global seaborne freight work, measured in tonne miles (UNCTAD 2014). Figure 12 shows optimal speeds for tankers of different sizes and shapes, and the fuel consumption (and CO2 emission) consequences on a round-trip basis, using $600 per tonne as bunker price (roughly the 2011 to 2014 oil price level). As we can see, the very large crude carriers (VLCCs)—the largest vessels that are almost three times the capacity of an Aframax (an oil tanker that is smaller than 120,000 metric tonnes and with a breadth not greater than 32.31 metres)—reduce costs by about 20 per cent, and reduce fuel consumption and CO2 emissions by about the same amount. These calculations are based on a high oil price, but the VLCCs still travel quite fast (13 knots), in part because an advantage of large vessels is low resistance per tonne transported.
Exploring the question of optimal speed, it is worth using the example of crude oil carriers to analyse how a market-based measure, such as a fuel tax or a CO2 cost scheme, can reduce fuel consumption and associated emissions. In Figure 13, we have introduced two types of variations around a central fuel cost assumption of $600 per tonne. First, we subtract and add 50 per cent to the fuel price, resulting in $300 and $900 per tonne. Second, we compare this to a scenario where a CO2 cost of $100 per tonne of CO2 is introduced on top of the fuel price of $600 per tonne. This CO2 tax is chosen to raise the fuel cost from $600 to approximately $900 per tonne. Figure 12 shows that raising the fuel price from $600 to $900 per tonne, reduces the cost-minimizing speed from 13 to 12 knots and fuel consumption from 13 to 12 kg per tonne of crude transported on a round-trip basis (covering the same distance and performing the same transportation work). The difference when fuel costs are raised by the same amount through a CO2 fee is that the value of the cargo is not increasing. The speed reduction is, for this reason, twice as large from 13 to 11 knots, and fuel consumption falls from 13 to 11 kg per tonne transported. This special result for oil carriers comes about because for these vessels, oil is also the cargo and the effect of a cargo value increase alone is to raise optimal speed through the capital cost of the cargo. For a CO2 tax, in contrast, the bunker costs increases, but the value of the cargo does not. The higher responsiveness of emissions to CO2 taxes than to oil prices is indicative of the responsiveness to CO2 taxes or bunker price increases that one can expect in cargo trades, other than oil carriers, as long as cargo prices do not covary with the bunker costs.
The InTernaTIonal Journal on Green GrowTh and developmenT • 2:2 (2016) • 51--86
articlEs • 71
Sources: Lindstad & Eskeland (2015) and authors’ own calculations Note: The largest VLCC transport cargo most cost-effectively and energy-efficiently, but slender designs (in green) also attain much of the energy and emission savings without the scale of a VLCC. Abbreviation: VLCC = very large crude carrier.
Figure 12: Different vessels and their cost-minimizing speeds (based on $600/tonne bunker cost)
Issues for DiscussionAs noted in the introduction, in general, fuel taxes will be imperfect policy instruments for environmental policy goals associated with transport. Nevertheless, in our examples of road traffic and maritime shipping, we have highlighted some themes beyond simply economizing with the level of output in transport activities.
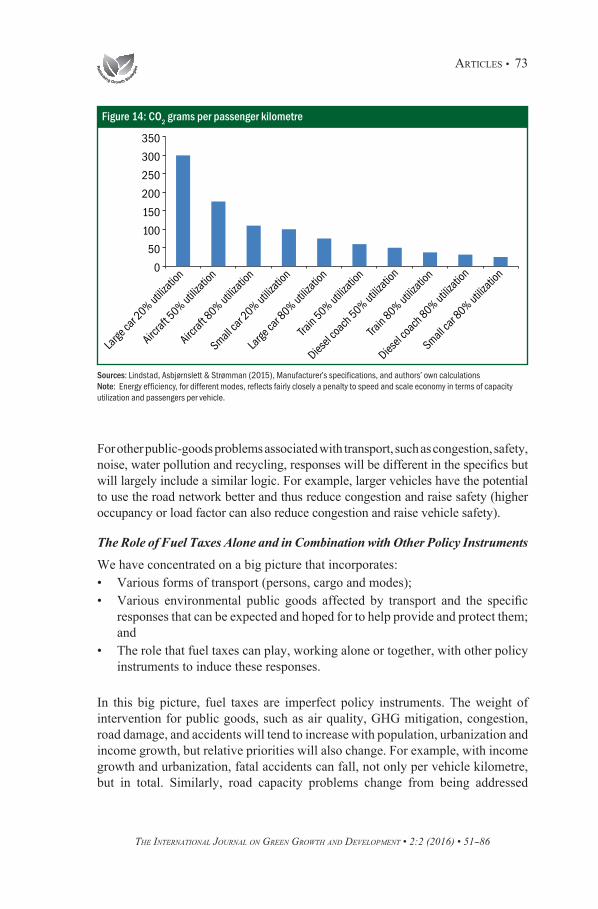
For cargo, we found a very consistent pattern that energy efficiency, and thus CO2 emissions and to a great extent also air quality, is enhanced by various factors, such as the size of lots and vehicles (that is, vessel size, train length, and bus capacity), capacity utilization, and speed reduction. Figure 14 demonstrates the same tendency for movement of passengers. Passengers are valuable cargo who value speed and comfort, penalizing loading and unloading. Also, for passengers, the ‘speed penalty’ in terms of emissions is less important and less notable as long as we do not have non-motorized movements in comparison.

The InTernaTIonal Journal on Green GrowTh and developmenT • 2:2 (2016) • 51--86
72 • articlEs
Source: Authors’ own calculations
Figure 13: Fuel and cost per tonne transported as a function of speed, fuel and carbon price
Reasons for this consistency are that scale reduces energy consumption related to resistance and also, typically, acceleration by reducing the weight of the vessel itself per unit of cargo carrying capacity. Reduced speed does the same.
Environmental and climate policies—for instance fiscal instruments, such as taxes on emissions and fuels, exert pressure on every owner, shipper, operator, and traveller to slim their emissions per tonne kilometre and passenger kilometre, including efforts to allow greater scale, capacity utilization, and slower movements. These responses will, for policies regarding emission of air pollutants and GHGs, include: • A shift towards non-motorized modes and less travel and transport, perhaps
also denser urbanization;• An increase in alternative fuels and technologies;• A substitution between modes (in principle) from air to surface, road to rail
and rail to sea;• Greater capacity utilization (fewer empty seats, containers and trips);• Slower movements (with the exception of when speed relieves congestion, as
with separate, high-capacity lines and lanes); and• Larger vehicles and shipments.
The InTernaTIonal Journal on Green GrowTh and developmenT • 2:2 (2016) • 51--86
articlEs • 73
For other public-goods problems associated with transport, such as congestion, safety, noise, water pollution and recycling, responses will be different in the specifics but will largely include a similar logic. For example, larger vehicles have the potential to use the road network better and thus reduce congestion and raise safety (higher occupancy or load factor can also reduce congestion and raise vehicle safety).
The Role of Fuel Taxes Alone and in Combination with Other Policy Instruments
We have concentrated on a big picture that incorporates: • Various forms of transport (persons, cargo and modes);• Various environmental public goods affected by transport and the specific
responses that can be expected and hoped for to help provide and protect them; and
• The role that fuel taxes can play, working alone or together, with other policy instruments to induce these responses.
In this big picture, fuel taxes are imperfect policy instruments. The weight of intervention for public goods, such as air quality, GHG mitigation, congestion, road damage, and accidents will tend to increase with population, urbanization and income growth, but relative priorities will also change. For example, with income growth and urbanization, fatal accidents can fall, not only per vehicle kilometre, but in total. Similarly, road capacity problems change from being addressed
Sources: Lindstad, Asbjørnslett & Strømman (2015), Manufacturer’s specifications, and authors’ own calculations Note: Energy efficiency, for different modes, reflects fairly closely a penalty to speed and scale economy in terms of capacity utilization and passengers per vehicle.
Figure 14: CO2 grams per passenger kilometre
The InTernaTIonal Journal on Green GrowTh and developmenT • 2:2 (2016) • 51--86
74 • articlEs
mostly through capacity expansion to also including demand management through fuel taxation and tolls, as with the London and Stockholm congestion-charging schemes.
Thus, as priorities for environmental public goods rise and change, fuel taxes will probably rise, and should rise, but this depends on the relative priorities as well as the effectiveness of supplementary instruments, such as emission standards for local air quality and congestion tolls for urban commuting capacity. A reason fuel tax rates might not increase despite rising priority of environmental public goods (the value of saving a statistical life, for instance, will typically be rising) is in part interaction with other instruments. It may be that feebates or standards make cars and fuels less emitting, thus lowering the tax base per litre, even though the tax rate per gramme of pollutants emitted is rising. And it could be that toll-based congestion charges are introduced to discourage driving in urban areas, thus reducing the fuel taxes that are motivated by national (including global) environmental objectives, which are not varying with time and location.
Fuel taxes may still remain and grow in power, however, both because of the general desirability of raising private variable costs to internalize a range of remaining externalities, and because an important range of public goods—GHGs and air quality in particular—gain from reduced scale of transport activities as well as from reduced energy intensity per unit of transportation work. If and when such impacts as emissions of air pollutants and car safety issues are successfully brought down per tonne-kilometre, per passenger kilometre and per litre, pricing variable costs due to issues such as congestion and climate change may prevail and grow in importance. This paper has thus emphasized that certain sweeping and large responses that serve several environmental goals are consistent with fuel taxes. It is important, therefore, to be aware of the generally attractive consequences (as well as the shortcomings) of incentivizing these responses.
Different Public Goods and Abatement Options
As with air quality management, congestion management is an objective that is imperfectly addressed by fuel taxes. In addition, congestion management needs differentiation to be more elevated in urban areas, if and when these are more polluted and/or congested.14 Public transport policies, of course, assist in both the geographical and time dimensions. Ideally, congestion fees should differentiate not merely by time of day and a cordon or area (both of which are possible in toll rings and demonstrated in London, Stockholm, and Trondheim), but also by the actual traffic and pollution situation. Future schemes and technology
14 Parry and Strand (2011) provided a formula and an application to Chile, including peak and off-peak conditions, and the share of driving occurring in urban areas. Stockholm and London are well-studied, successful cases of congestion fees internationally (see, for instance, Leape 2006). Since economists have long advocated road and congestion charges (Vickrey 1969), analysts of the Stockholm and London examples have emphasized not only the substantial net benefits, but also explanations of their political success.

The InTernaTIonal Journal on Green GrowTh and developmenT • 2:2 (2016) • 51--86
articlEs • 75
developments, including global positioning system (GPS) monitoring and seat-sharing systems, will certainly expand the possibilities and further raise the net benefits of congestion charges. Utilization of present technologies is, nevertheless, much below what is possible. Toll rings in Norway, for example, would be suitable to charge less from less polluting vehicles, uncongested hours, and in less polluted months, but all these are neglected.
Road wear is proportional to vehicle usage (vkm, say, or tkm) but depends heavily on such vehicle characteristics as axel pressure (weight) and studded tires. Vehicle characteristics can be and are charged for in taxation—at registration, new sales and annually—and should then ideally include an odometer-based mileage fee. Germany’s truck toll, motivated in part by the many foreign vehicles passing through or operating in the country, combines vehicle characteristics, such as axel load and pollution class in a distance-based charging system.
Agglomeration benefits exist when activities similar to each other benefit from being located next to each other, as with a garment district. Agglomeration benefits may not be fully internalized in themselves, thus providing a rationale for zoning and/or subsidies. Since agglomeration benefits may involve commuting requirements, they may be relevant to transport policy (see Lucas and Rossi-Hansberg 2002, Rossi-Hansberg 2004, Eskeland and Lall 2015).
Accidents, and associated accident prone behaviours, could in principle be internalized to some extent through insurance premiums and liability (e.g., pay-as-you-drive insurance premiums). Governments will want to do more than this, not only because of the public good nature of an accident-lean traffic system, but also because certain measures (police presence, fines and infrastructure, including design) are suited for government.15
Road transport is particularly dominant in domestic transport. Nation states are able to intervene with ease and good justification for within-nation public goods. Also when attempting GHG mitigation in the roads sector, policies will yield no or very little direct carbon leakage, since transport work is not very mobile across country borders. Nevertheless, transit traffic as well as foreign registered vehicles in domestic traffic may represent an issue, and the German example with foreign trucks paying fees for road use shows that solutions can be found for such problems.16
Aviation and maritime shipping activities are, in contrast, subject to carbon leakage in ways that influence policies, and for two main reasons. First, visitors and cargo might choose alternative destinations and routes if flying or sailing
15 Kopits and Cropper (2008) for an analysis of traffic fatality rates internationally (rising and scheduled to rise, globally, but falling per vehicle kilometre). Apart from vehicle numbers and kilometres driven, the literature emphasizes quality of cars and infrastructure, exposure of pedestrians, driver age, and education, police presence and enforcement, alcohol and (other) substance abuse. Kolstad et al. (1990) compares liability ex-post to regulation ex-ante.
16 Available at <http://roadpricing.blogspot.no/2014/04/germany-expands-road-pricing-part-1.html>
The InTernaTIonal Journal on Green GrowTh and developmenT • 2:2 (2016) • 51--86
76 • articlEs
into or via a country becomes costly. Second, small ports and states wanting to be visited by cleaner ships or planes have less of a chance to influence emissions if acting alone, though clean ship rebates in ports are starting to be seen. Jones et al. (2013) found the absence of fees in international aviation and shipping highly anomalous, waiting for international coordination.
For sectors exposed to carbon leakage, such as aviation and shipping, we believe the power of port states and port states in coordination (such as the United States, Europe) is substantial, and may be underestimated. The potential for fuel (and emission) efficiency—intermodally, and in size, speed, slenderness, and technological advance—will probably be sought with multiple instruments, and the role of emission and fuel taxes may be slowed by lagging transnational coordination.
Important environmental problems range from local, spontaneous challenges (e.g., accidents, spills or carbon monoxide problems in a dense neighbourhood) to global, intergenerational challenges (e.g., GHG emissions). One can envision a city or nation acting on air quality with policy instruments that effectively compel automobile companies to reduce emissions of dust particles, or national authorities intervening to reduce nitrogen oxides and sulphur according due to national priorities, or national authorities acting according to international agreements for public goods that are transnational in nature. Control of nitrogen oxides (NOx) and sulphur oxides (SOx) in northern Europe are examples of pollution problems that have been addressed at a regional, transnational level. A good example of a problem that has been dealt with at a global level, is ozone depleting substances through the Montreal Protocol.
Sulphur emissions are now addressed through emission controlled areas (ECA) for maritime shipping covering north western Europe on the one hand and Canada and USA on the other. One should not be surprised that such trans-state initiatives for pollution control from a difficult sector, such as shipping, are first seen in regions that are dense in population, education, wealth, and maritime traffic.
An example of coordination challenges that may then occur is when ECAs combat regional problems in ways that exacerbate global climate problems, as when pressure on NOx and SOx emissions reduces combustion efficiency and raises warming by removing reflective aerosols. Such examples serve to illustrate the need to accelerate the global treaty and policy developments.
Indeed, one may expect a general tendency that institutions and policies will develop sequentially, first to address local problems, then regional and national, and finally global and intergenerational. It will then vary by case, whether what has started at one level facilitates what needs to be done on another, or has actually exposed a conflict between goals, between solutions. But in both cases, the need for coordination at higher levels will show a tendency to become more important over time.
The InTernaTIonal Journal on Green GrowTh and developmenT • 2:2 (2016) • 51--86
articlEs • 77
Hurdles
Raising fuel taxes often faces political hurdles, and important among them is the transfer of income from households and firms to government. Environmental tax reforms (as well as environmental policy reform in general) require clarity and communication on:• The rationale underpinning the provision of public goods, such as air
quality and its public health benefits, road space, safety, and greenhouse gas mitigation; and
• The use of the proceeds.
With regard to the latter point, decisions will have to be made on whether fuel taxes should be used to operate environmental services and programmes, to reduce other taxes that are costly in efficiency terms (e.g., labour income and business taxes), or to support government services (e.g., schooling, crime prevention, and infrastructure development) and vulnerable groups (e.g., social insurance programmes).
There are other obstacles to environmental improvements. Some are specific to fiscal instruments and fuel taxes in particular. One example is the difficulties that are encountered in levying CO2 taxes or fuel taxes on international aviation and maritime shipping (Keen et al. 2013). Understanding the kinds of sectoral responses one would want to see continues to be valuable. For example, it is important to understand that fuel efficiency standards for various categories of ships—emphasized by the International Maritime Organization—will miss very important opportunities if implemented without polices that can stimulate ships and shipments both to slow down and to move up in lot size or towards more slender vessels. Fuel taxes or emission taxes would stimulate both.
Our analysis should not be seen mostly or only as an advocacy of taxes on emissions and fuels; rather it should be seen as a demonstration that the use of imperfect instruments in environmental protection (fuel taxes being an important case in point) requires knowledge of the polluting sector because it requires delicate combinations of policy instruments. The use of imperfect but powerful instruments such as fuel taxes also requires some decisiveness and commitment to simplicity and practicality, prioritization, and communication.
AcknowledgementsThe authors gratefully acknowledge support from the Research Council of Norway, CenSES and HyFiTransport, stays at World Bank and Stanford, as well as remarks from Somik Lall, Larry Goulde, and Roar Aadland. Remaining issues rest with the authors. Additional comments were received from participants at the GGKP’s Third Annual Conference on ‘Fiscal Policies and the Green Economy Transition: Generating Knowledge – Creating Impact’, held in Venice, Italy, January 29–30, 2015.
The InTernaTIonal Journal on Green GrowTh and developmenT • 2:2 (2016) • 51--86
78 • articlEs
Annexures
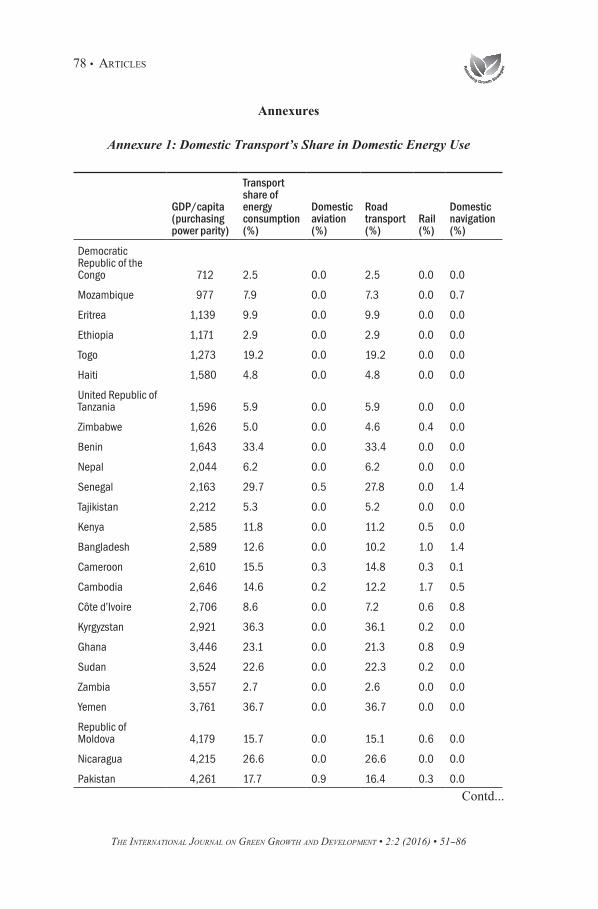
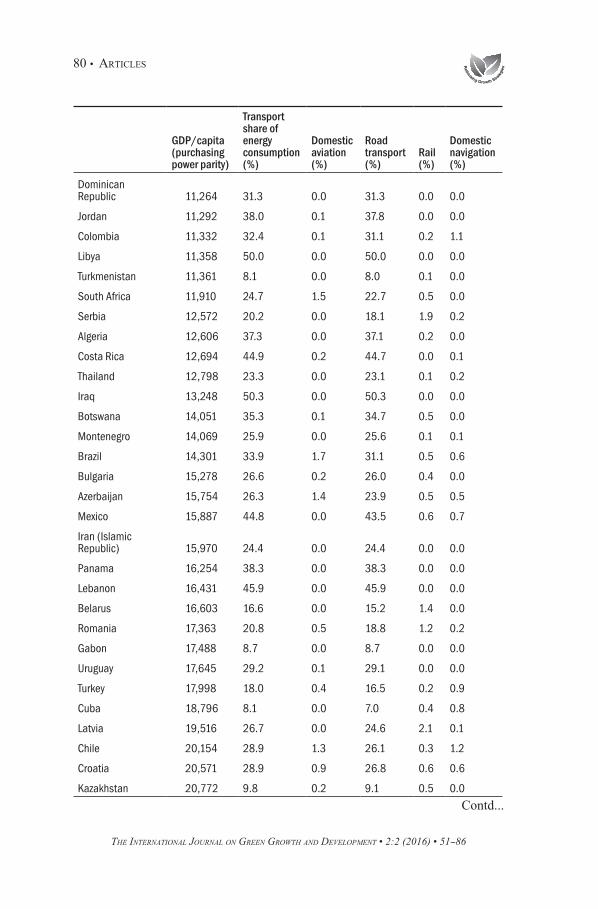
Annexure 1: Domestic Transport’s Share in Domestic Energy Use
GDP/capita (purchasing power parity)
Transport share of energy consumption (%)
Domestic aviation (%)
Road transport (%)
Rail (%)
Domestic navigation (%)
Democratic Republic of the Congo 712 2.5 0.0 2.5 0.0 0.0
Mozambique 977 7.9 0.0 7.3 0.0 0.7
Eritrea 1,139 9.9 0.0 9.9 0.0 0.0
Ethiopia 1,171 2.9 0.0 2.9 0.0 0.0
Togo 1,273 19.2 0.0 19.2 0.0 0.0
Haiti 1,580 4.8 0.0 4.8 0.0 0.0
United Republic of Tanzania 1,596 5.9 0.0 5.9 0.0 0.0
Zimbabwe 1,626 5.0 0.0 4.6 0.4 0.0
Benin 1,643 33.4 0.0 33.4 0.0 0.0
Nepal 2,044 6.2 0.0 6.2 0.0 0.0
Senegal 2,163 29.7 0.5 27.8 0.0 1.4
Tajikistan 2,212 5.3 0.0 5.2 0.0 0.0
Kenya 2,585 11.8 0.0 11.2 0.5 0.0
Bangladesh 2,589 12.6 0.0 10.2 1.0 1.4
Cameroon 2,610 15.5 0.3 14.8 0.3 0.1
Cambodia 2,646 14.6 0.2 12.2 1.7 0.5
Côte d’Ivoire 2,706 8.6 0.0 7.2 0.6 0.8
Kyrgyzstan 2,921 36.3 0.0 36.1 0.2 0.0
Ghana 3,446 23.1 0.0 21.3 0.8 0.9
Sudan 3,524 22.6 0.0 22.3 0.2 0.0
Zambia 3,557 2.7 0.0 2.6 0.0 0.0
Yemen 3,761 36.7 0.0 36.7 0.0 0.0
Republic of Moldova 4,179 15.7 0.0 15.1 0.6 0.0
Nicaragua 4,215 26.6 0.0 26.6 0.0 0.0
Pakistan 4,261 17.7 0.9 16.4 0.3 0.0
Contd...

The InTernaTIonal Journal on Green GrowTh and developmenT • 2:2 (2016) • 51--86
articlEs • 79
GDP/capita (purchasing power parity)
Transport share of energy consumption (%)
Domestic aviation (%)
Road transport (%)
Rail (%)
Domestic navigation (%)
Honduras 4,345 25.5 0.0 25.5 0.0 0.0
Uzbekistan 4,412 5.0 0.4 4.4 0.2 0.0
Vietnam 4,717 21.5 0.4 20.9 0.0 0.2
India 4,883 11.9 0.4 10.6 0.8 0.2
Nigeria 5,217 7.5 0.0 7.5 0.0 0.0
Plurinational State of Bolivia 5,462 33.3 1.6 31.7 0.0 0.0
Congo 5,569 43.7 1.3 42.4 0.0 0.0
Philippines 5,721 33.7 1.3 29.5 0.0 2.8
Georgia 6,322 26.5 0.6 24.8 1.1 0.0
Morocco 6,698 36.1 0.0 35.9 0.2 0.0
Armenia 6,812 25.8 0.0 25.5 0.3 0.0
Guatemala 6 957 21.3 0.0 21.3 0.0 0.0
Angola 7,094 21.2 2.2 18.8 0.0 0.1
Paraguay 7,186 34.9 0.0 34.9 0.0 0.0
El Salvador 7,352 39.9 0.0 39.9 0.0 0.0
Mongolia 7,495 20.8 0.0 14.7 6.2 0.0
Sri Lanka 8,112 26.7 0.1 26.0 0.6 0.0
Kosovo 8,223 24.9 0.0 24.8 0.1 0.0
Ukraine 8,295 12.0 0.0 10.8 1.1 0.1
Indonesia 8,438 24.7 1.4 22.0 0.0 1.3
Jamaica 8,485 24.2 0.0 24.2 0.0 0.0
Namibia 8,715 39.1 0.6 36.8 0.0 1.7
Bosnia, Herzegovina 9,248 33.7 0.0 33.4 0.4 0.0
Ecuador 9,882 54.1 0.0 45.9 0.0 8.1
Albania 9,897 39.6 0.0 38.4 0.2 1.0
China 10,041 12.8 0.7 10.4 0.7 1.0
Tunisia 10,235 27.2 0.0 27.2 0.1 0.0
Peru 10,429 35.0 0.0 34.8 0.0 0.3
Egypt 10,629 25.9 1.2 24.0 0.0 0.7
Contd...
The InTernaTIonal Journal on Green GrowTh and developmenT • 2:2 (2016) • 51--86
80 • articlEs
GDP/capita (purchasing power parity)
Transport share of energy consumption (%)
Domestic aviation (%)
Road transport (%)
Rail (%)
Domestic navigation (%)
Dominican Republic 11,264 31.3 0.0 31.3 0.0 0.0
Jordan 11,292 38.0 0.1 37.8 0.0 0.0
Colombia 11,332 32.4 0.1 31.1 0.2 1.1
Libya 11,358 50.0 0.0 50.0 0.0 0.0
Turkmenistan 11,361 8.1 0.0 8.0 0.1 0.0
South Africa 11,910 24.7 1.5 22.7 0.5 0.0
Serbia 12,572 20.2 0.0 18.1 1.9 0.2
Algeria 12,606 37.3 0.0 37.1 0.2 0.0
Costa Rica 12,694 44.9 0.2 44.7 0.0 0.1
Thailand 12,798 23.3 0.0 23.1 0.1 0.2
Iraq 13,248 50.3 0.0 50.3 0.0 0.0
Botswana 14,051 35.3 0.1 34.7 0.5 0.0
Montenegro 14,069 25.9 0.0 25.6 0.1 0.1
Brazil 14,301 33.9 1.7 31.1 0.5 0.6
Bulgaria 15,278 26.6 0.2 26.0 0.4 0.0
Azerbaijan 15,754 26.3 1.4 23.9 0.5 0.5
Mexico 15,887 44.8 0.0 43.5 0.6 0.7
Iran (Islamic Republic) 15,970 24.4 0.0 24.4 0.0 0.0
Panama 16,254 38.3 0.0 38.3 0.0 0.0
Lebanon 16,431 45.9 0.0 45.9 0.0 0.0
Belarus 16,603 16.6 0.0 15.2 1.4 0.0
Romania 17,363 20.8 0.5 18.8 1.2 0.2
Gabon 17,488 8.7 0.0 8.7 0.0 0.0
Uruguay 17,645 29.2 0.1 29.1 0.0 0.0
Turkey 17,998 18.0 0.4 16.5 0.2 0.9
Cuba 18,796 8.1 0.0 7.0 0.4 0.8
Latvia 19,516 26.7 0.0 24.6 2.1 0.1
Chile 20,154 28.9 1.3 26.1 0.3 1.2
Croatia 20,571 28.9 0.9 26.8 0.6 0.6
Kazakhstan 20,772 9.8 0.2 9.1 0.5 0.0
Contd...
The InTernaTIonal Journal on Green GrowTh and developmenT • 2:2 (2016) • 51--86
articlEs • 81
GDP/capita (purchasing power parity)
Transport share of energy consumption (%)
Domestic aviation (%)
Road transport (%)
Rail (%)
Domestic navigation (%)
Malaysia 21,096 32.2 0.0 32.1 0.0 0.1
Poland 22,110 24.7 0.0 24.2 0.5 0.0
Lithuania 22,322 24.5 0.0 23.3 1.1 0.1
Russian Federation 22,570 13.5 1.4 10.5 1.3 0.3
Hungary 22,737 22.6 0.0 21.8 0.8 0.0
Estonia 23,580 26.1 0.0 24.7 1.2 0.2
Slovakia 25,560 19.2 0.0 18.9 0.4 0.0
Portugal 26,588 33.1 0.8 31.3 0.3 0.6
Greece 26,944 35.3 1.2 31.3 0.1 2.7
Malta 28,178 44.1 0.0 44.1 0.0 0.0
Czech Republic 28,455 22.3 0.2 21.4 0.7 0.0
Slovenia 28,715 37.6 0.0 37.1 0.5 0.0
Trinidad and Tobago 28,743 6.2 0.0 6.2 0.0 0.0
Israel 30,159 26.9 0.0 26.9 0.0 0.0
Cyprus 30,260 44.6 0.0 44.6 0.0 0.0
Republic of Korea 31,327 18.3 0.3 17.6 0.2 0.2
New Zealand 31,683 36.1 2.8 32.3 0.4 0.7
Spain 32,606 36.1 2.4 31.9 0.9 0.9
Japan 34,316 24.1 1.0 21.5 0.6 1.0
Italy 35,917 29.9 0.6 28.1 0.3 0.8
United Kingdom 36,629 31.9 0.6 29.4 0.8 1.2
France 37,312 28.5 0.5 27.0 0.6 0.3
Iceland 39,911 9.3 0.2 8.8 0.0 0.2
Bahrain 40,083 19.6 0.5 19.1 0.0 0.0
Finland 40,280 17.2 0.5 15.6 0.4 0.7
Belgium 40,997 21.5 0.0 20.6 0.4 0.4
Canada 41,333 27.5 1.6 24.1 1.0 0.8
Australia 41,706 37.7 3.3 31.9 1.4 1.1
Germany 42,381 24.3 0.3 23.0 0.8 0.1
Denmark 42,803 29.8 0.2 27.6 0.8 1.1
Contd...
The InTernaTIonal Journal on Green GrowTh and developmenT • 2:2 (2016) • 51--86
82 • articlEs
GDP/capita (purchasing power parity)
Transport share of energy consumption (%)
Domestic aviation (%)
Road transport (%)
Rail (%)
Domestic navigation (%)
Sweden 43,875 25.1 0.5 23.5 0.7 0.4
Austria 44,240 28.5 0.1 27.6 0.7 0.0
Ireland 45,176 34.5 0.1 33.9 0.4 0.2
The Netherlands 46,309 19.5 0.1 18.8 0.3 0.3
Oman 46,430 16.9 0.0 16.9 0.0 0.0
Saudi Arabia 49 230 31.2 0.6 30.6 0.0 0.0
United States 49,803 38.1 3.3 33.7 0.8 0.3
Hong Kong, China 50,086 20.8 0.0 20.8 0.0 0.0
Switzerland 54,215 30.6 0.3 28.8 1.4 0.0
United Arab Emirates 56,377 21.3 1.2 20.1 0.0 0.0
Norway 61,896 23.1 1.7 16.7 0.3 4.3
Brunei Darussalam 71,991 24.8 0.0 24.8 0.0 0.0
Singapore 74,594 12.0 0.0 11.2 0.8 0.0
Kuwait 82,475 27.0 0.0 27.0 0.0 0.0
Luxembourg 90,297 59.7 0.0 59.3 0.3 0.0
Qatar 133,734 33.1 0.0 33.1 0.0 0.0
Source: IEA (2014)
The InTernaTIonal Journal on Green GrowTh and developmenT • 2:2 (2016) • 51--86
articlEs • 83
Ann
exur
e 2:
Car
go fr
eigh
t: Sp
eed,
Siz
e, C
osts
, and
Em
issi
ons
Carr
ier
Boei
ng 7
47
Frei
ghte
r (1
)Tr
uck
&
Trai
ler (
2)Ra
il (2
)
6500
TE
RU c
onta
iner
ve
ssel
(1)
18 0
00 TE
U co
ntai
ner v
es-
sel (
1)
Dry B
ulk
Pana
-m
ax 8
0 00
0 dw
t (1)
Dry B
ulk
Cape
size
180
00
0 dw
t (1)
New
built
pric
e 20
14M
USD
180
0.2
4080
190
3050
Annu
al d
epr.&
fina
ncia
l cos
tM
USD
14.4
0.04
4.0
6.4
15.2
2.4
4.0
Annu
al o
pera
tiona
l cos
tM
USD
18.0
0.14
3.6
3.2
7.6
1.2
2.0
Daily
TC-e
quiv
alen
tUS
D93
000
500
2170
027
000
65 0
0010
000
17 0
00
Fuel
cos
t per
ton
USD
950
1000
1 00
063
063
063
063
0
Carg
o –
weig
ht c
apac
ityto
n11
525
1 50
063
000
160
000
76 0
0017
0 00
0
Carg
o –
volu
me
capa
city
m3
857
703
000
162
500
450
000
Utili
zatio
n of
wei
ght c
apac
ity%
50%
50%
50%
50%
50%
62%
55%
Utili
zatio
n of
volu
me
capa
city
%75
%75
%75
%65
%65
%
Aver
age
volu
me
payl
oad
m3
640
532
250
106
000
293
000
Aver
age
weig
ht p
aylo
adto
n57
.513
750
32 0
0080
000
47 0
0093
000
Dist
ance
Asi
a –
Euro
pekm
/h10
000
10 0
0010
000
20 0
0020
000
20 0
0020
000
Voya
ge s
peed
km/h
850
6060
3939
2222
CO2 E
mis
sion
s pe
r ton
km
Gram
/ton
km
550
8550
1813
43
CO2 E
mis
sion
s pe
r cub
ic k
mGr
am/m
3 km
5021
175
4
Cost
per
10
000
ton
km28
6559
044
455
4513
11
Fuel
cos
t per
10
000
km16
5227
516
141
308
6
TC c
ost i
n pe
rcen
tage
per
ton
42%
53%
64%
25%
33%
39%
43%
Fuel
cos
t in
perc
enta
ge p
er to
n58
%47
%36
%75
%67
%61
%57
%
Sour
ces:
Lin
dsta
d, S
anda
as &
Sve
rre (2
014)
, Lin
dsta
d, A
sbjo
rnsl
ett &
Ped
erse
n (2
012)
, and
aut
hor’s
own
cal
cula
tion.
Abbr
evia
tions
: MUS
D =
mill
ions
of U
S do
llars
; TEU
= tw
enty
foot
equ
ival
ent u
nit,
dwt=
dea
d we
ight
tonn
age;
TC=
time
char
ter
The InTernaTIonal Journal on Green GrowTh and developmenT • 2:2 (2016) • 51--86
84 • articlEs
ReferencesAssmann, L., Andersson J., and Eskeland, G.S. (2015). Missing in Action? Speed Optimization
and Slow Steaming in Maritime Shipping. [Discussion paper 13-2015]. Norvegian School of Economics. Retrieved from http://papers.ssrn.com/sol3/papers.cfm?abstract_id=2577240, (accessed on October 30, 2014).
Barrahona, H., Gallego, F., and Montero, J. P. (2015). Driving Restrictions for Cleaner Vehicles: Lessons on How they Work and How to Improve them. [Mimeographed]. Dept. of Economics, Pontificia Universidad Catolica de Chile.
Bovenberg, A. (1999). “Green Tax Reforms and the Double Dividend: An Updated Reader’s Guide”. International Tax and Public Finance 6(3): 421–443.
Buhaug, Ø., Corbett, J.J., Endresen, Ø.; Eyring, V., Faber, J., Hanayama, S., Lee, D. S., Lee, D., Lindstad, H., Markowska, A. Z., Mjelde, A., Nelissen, D., Nilsen, J., Pålsson, C., Winebrake, J. J.; Wu, W. Q., and Yoshida, K.(2009). Prevention of Air Pollution from Ships: Second IMO GHG Study 2009. London, UK: International Maritime Organization. Retrieved from www.ce.nl/publicatie/second_imo_ghg_study_2009/941. (accessed on September 30, 2014).
Corbett, J. J., Wang, H., and Winebrake, J. J. (2009). “The Effectiveness and Cost of Speed Reductions on Emissions from International Shipping”. Transportation Research D 14 (2009): 593–598.
Cullinane, K., and Khanna, M. (2000). Economies of Scale in Large Containerships: Optimal Size and Geographical Implications. Journal of Transport Geography 8(3): 181–195.
Davis, L. W. (2008). The Effect of Driving Restrictions on Air Quality in Mexico City. Journal of Political Economy 116(1): 38–81.
Eskeland, G. S. (1994). A Presumptive Pigovian Tax: Complementing Regulation to Mimic and Emission Fee. World Bank Economic Review 8(3): 373–394.
Eskeland, G. S. (1997). “Air Pollution Requires Multipollutant Analysis: The Case of Santiago, Chile”. American Journal of Agricultural Economics 79(5): 1636–1641.
Eskeland, G. S. (2012). “Which Emissions are Ours: Electrification of Road Transport in Norway”. Samfunnsøkonomen, 7 (Norwegian).
Eskeland, G. S., and Mideksa, T K. (2008). Transportation Fuel Use, Technology and Standards: The Role of Credibility and Expectations [Working Paper, No. 4695]. Washington, DC: World Bank Policy Research.
Eskeland, G. S., and Feyzioglu T. (1997a). “Rationing can Backfire: The Day Without A Car” in Mexico City. World Bank Economic Review 11(3): 383–408.
Eskeland, G S., and Feyzioglu, T. (1997b). “Is Demand for Polluting Goods Manageable? An Econometric Study of Car Ownership Aand Use in Mexico”. Journal of Development Economics 53(2): 423–445.
Eskeland, G. S., and Lall, S. (2015). “A Crowded City: Agglomeration and Mobility in Urban Development”. DC [Mimeographed]. Washington, DC: World Bank.
Figenbaum, E., Eskeland, G., S., Leonardsen, J., and Hagman, R. (2013). “85g CO2/km by 2020: Is it Achievable?” [TOI report No. 1264/2013]. [Norwegian].
International Energy Agency (IEA). (2014). “Energy Efficiency Indicators: Fundamentals on Statistics”. Paris: OECD/IEA.
Goulder, L. H. (1995). “Environmental Taxation and the Double Dividend: A Reader’s Guide”. International Tax and Public Finance 2(2): 157–183.

The InTernaTIonal Journal on Green GrowTh and developmenT • 2:2 (2016) • 51--86
articlEs • 85
Goulder, L. H., Parry, W H., Williams, R C., and Burtraw, D. “The Cost-effectiveness of Alternative Instruments for Environmental Protection in a Second-best Setting”. Journal of Public Economics 72(3): 329–360.
Jansson, J. O., and Schneerson, D. (1982). “The Optimal Ship Size”. Journal of Transport Economics and Policy 16(3): 217–238.
Johansen, L. (1972). Production Functions: An Integration of Micro and Macro Short Run and Long Run Aspects. Amsterdam, Netherlands: North-Holland Publishing Company.
Jones, B., Keen, M., and Strand, J. (2013). “Fiscal Implications of Climate Change”. International Tax and Public Finance 20(1): 29–70.
Jonkeren, O., Ommeren, J V., and Rietveld, P. (2012). “Freight Prices, Fuel Prices, and Speed”. Journal of Transport Economics and Policy 46(2): 175–188.
Keen, M., Parry, I., & and Strand, J. (2013). “Planes, Ships and Taxes: Charging for International Aviation and Maritime eEmissions”. Economic Policy 28(76): 701–749.
Kolstad, C D. (2011). Environmental Economics. 2nd ed. New York, NY: Oxford University Press.
Kolstad, C D., Ulen, T S., and Johnson, G V. (1990). Ex Post Liability for Harm vs. Ex Ante Safety Regulation: Substitutes or Complements? American Economic Review 80(4): 888–901.
Kopits, E., and Cropper, M. (2008). “Why have Traffic Fatalities Declined in Industrialized Countries? Implications for Pedestrians and Vehicle Occupants”. Journal of Transport Economics and Policy 42(1): 129–154.
Koopmans, T. (1939). “Tanker Freight Rates and Tankship Building: An Analysis of Cyclical Fluctuations”. London: F. Bohn.
Leape, J. (2006). “The London Congestion Charge”. Journal of Economic Perspectives 20(4): 157–176.
Lindstad, H. (2013a). “Assessment of Bulk Designs Enabled by the Panama Canal Expansion”. Society of Naval Architects and Marine Engineers (SNAME) Transactions 121, page 590-610, ISSN 0081 1661, ISBN 978-0-939773-95-4
Lindstad, H. (2013b). “Strategies and Measures for Reducing Maritime CO2 Emissions. Doctoral Thesis PhD”. Norwegian University of Science and Technology – Department of Marine Technology.
Lindstad, H., Asbjørnslett, B E., and Pedersen, J. T. (2012). “Green Maritime Logistics and Sustainability”. In Maritime Logistics: Contemporary Issues, D W. Song and P M. Panayides, eds. Emerald, pp. 227–243.
Lindstad, H., Asbjørnslett, B. E., and Strømman, A. H. (2016). Opportunities for Increased Profit and Reduced Cost and Emissions by Service Differentiation within Container Liner Shipping. Maritime Policy & Management 43(3): 280–294.
Lindstad, H., and Eskeland, G. S. (2015). Low Carbon Maritime Transport: How Speed, Size and Slenderness Amounts to Substantial Capital Energy Substitution. Transportation Research Part D 41 (2015): 244-256.
Lindstad, H., Sandaas, I., and Sverre, S. (2014). “Assessment of Profit, Cost, and Emissions for Slender Bulk Vessel Designs”. Transportation Research Part D: Transport and Environment 29: 32–39.
The InTernaTIonal Journal on Green GrowTh and developmenT • 2:2 (2016) • 51--86
86 • articlEs
Lucas, R. E. Jr., and Rossi-Hansberg, E. (2002). “On the Internal Structure of Cities”. Econometrica 70(4): 1445–76.
Notteboom, T. E., and Vernimmen, B. (2009). “The Effect of High Fuel Liner Service Configuration in Container Shipping”. Journal of Transport Geography 17(5): 325–337.
Organisation for Economic Co-operation and Development (OECD). (2013). Statistics Briefs, December. Paris, France: International Transport Forum.
Parry, I. W. H. (2012). “Reforming the Tax System to Promote Environmental Objectives: An Application to Mauritius”. Ecological Economics 77: 103–112.
Parry, I. W. H., and Strand J. (2011). “International Fuel Tax Assessment: an Application to Chile (IMF Working Paper No. 11/168)”. Washington, DC: IMF.
Parry, I. W. H., et al. (2014). Getting Energy Prices Right: From Principle to Practice. Washington, D C: IMF.
Psaraftis, H. N., and Kontovas, C A. (2010).“Balancing the Economic and Environmental Performance of Maritime Transport”. Transportation Research Part D 15: 458–462.
Psaraftis, H N., and Kontovas, C A. (2013). “Speed Models for Energy-Efficient Maritime Transportation: A Taxonomy and a Survey”. Transportation Research Part C 26: 331–351.
Rossi-Hansberg E. (2004). “Optimal Urban Land Use and Zoning”. Review of Economic Dynamics 7: 69–106.
Samuelson, P. A. (1954). The Pure Theory of Public Expenditure. Review of Economics and Statistics 36(4): 387–389.
Sandmo, A. (1975). Optimal Taxation in the Presence of Externalities. Swedish Journal of Economics 77(1): 86–98.
Seas at Risk. (2010). Going Slow to Reduce Emissions: Can the Current Surplus of Maritime Transport Capacity be Turned into an Opportunity to Reduce GHG Emissions? Delft, Netherlands: CE Delft Retrieved from www.cedelft.eu/publicatie/going_slow_to_reduce_emissions/1029 (accessed on October 30, 2014).
Silverleaf, A., and Dawson, J. (1966). “Hydrodynamic Design of Merchant Ships for High Speed Operation”. Royal Institution of Naval Architects Transactions 109(2): 167–196.
Small, A. K. (2011). “Energy Policies for Passenger Motor Vehicles”. (Working Paper 101108), University of California-Irvine, Department of Economics. Retrieved from www.economics.uci.edu/files/docs/workingpapers/2010-11/small-8.pdf. (accessed on September 30, 2015).
Stott, P. W., and Wright, P. N. H. (2011). “Opportunities for Improved Efficiency and Reduced CO2 Emissions in Dry Bulk Shipping stemming from the Relaxation of the Panamax Beam Constraint”. Transactions A: International Journal Maritime Engineering 153(A4): A215–A229.
Sys, Christa, et al. (2008). “In Search of the Link between Ship Size and Operations”. Transportation Planning and Technology 31(4): 435– 463.
United Nations Conference on Trade and Development (2014). Review of Maritime Transport 2014. New York and Geneva: United Nations. Retrieved from http://unctad.org/en/PublicationsLibrary/rmt2014_en.pdf. (accessed on October 30, 2014).
Vickrey, William S. (1969). “Congestion Theory and Transportation Investment”. American Economic Review 59(2): 251–260.