environmental systems and societies standard...
TRANSCRIPT
Environmental Systems and Societies
Standard level
Specimen paper 1s and 2s
For first examinations in 2010
CONTENTS
Environmental Systems and Societies standard level paper 1 specimen paper Environmental Systems and Societies standard level paper 1 specimen markscheme Environmental Systems and Societies standard level paper 2 specimen paper Environmental Systems and Societies standard level paper 2 specimen resource booklet Environmental Systems and Societies standard level paper 2 specimen markscheme

15 pages
SPEC/4/ENVSO/SP1/ENG/TZ0/XX
SPECIMEN PAPER
ENVIRONMENTAL SYSTEMS AND SOCIETIESSTANDARD LEVELPAPER 1
INSTRUCTIONS TO CANDIDATES
• Write your session number in the boxes above.• Do not open this examination paper until instructed to do so.• Answer all of the questions in the spaces provided. You may continue your answers on
answer sheets. Write your session number on each answer sheet, and attach them to this examination paper and your cover sheet using the tag provided.
• At the end of the examination, indicate the number of answer sheets used in the appropriate box on your cover sheet.
1 hour
Candidate session number
0 0
© International Baccalaureate Organization 2008
–�– SPEC/4/ENVSO/SP1/ENG/TZ0/XX
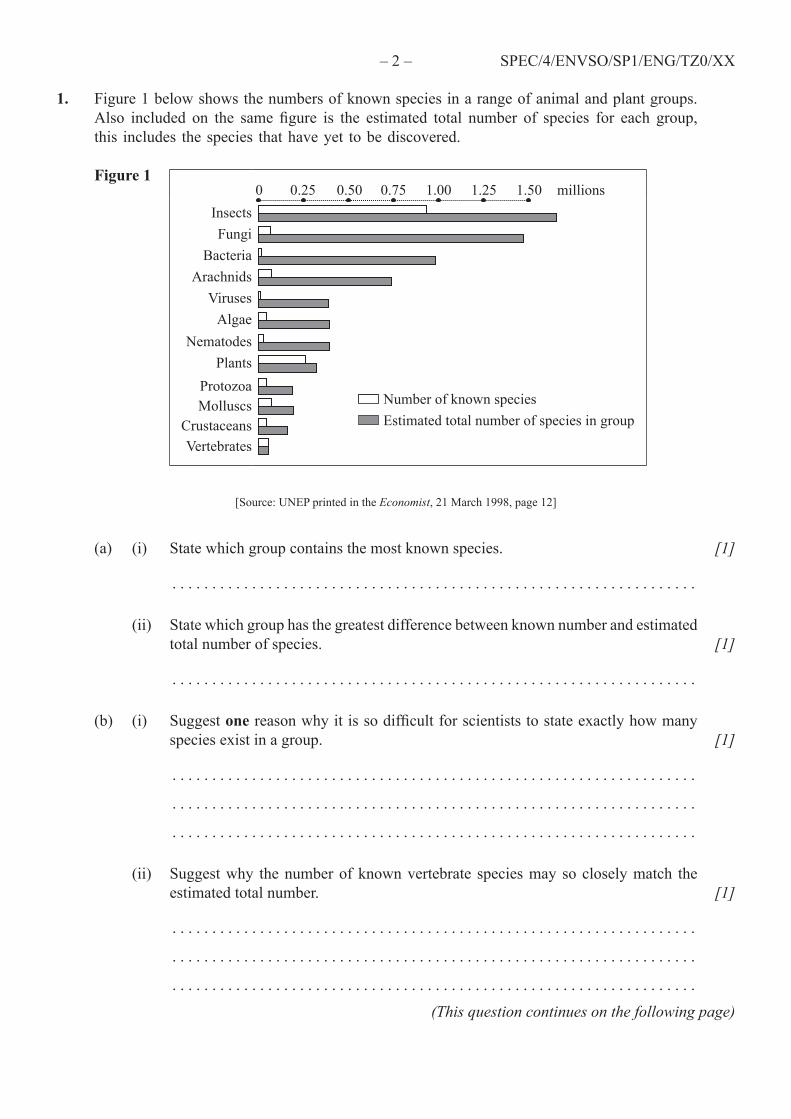
1. Figure1belowshowsthenumbersofknownspeciesinarangeofanimalandplantgroups.Also included on the same figure is the estimated total number of species for each group,this includes thespecies thathaveyet tobediscovered.
Figure 1 0 0.�5 0.50 0.75 1.00 1.�5 1.50 millions
InsectsFungi
BacteriaArachnids
VirusesAlgae
NematodesPlants
ProtozoaMolluscs
CrustaceansVertebrates
Numberofknownspecies Estimatedtotalnumberofspeciesingroup
[Source:UNEPprintedintheEconomist,�1March1998,page1�]
(a) (i) Statewhichgroupcontainsthemostknownspecies.
. . . . . . . . . . . . . . . . . . . . . . . . . . . . . . . . . . . . . . . . . . . . . . . . . . . . . . . . . . . . . . . . . .
[1]
(ii) Statewhichgrouphasthegreatestdifferencebetweenknownnumberandestimatedtotalnumberofspecies.
. . . . . . . . . . . . . . . . . . . . . . . . . . . . . . . . . . . . . . . . . . . . . . . . . . . . . . . . . . . . . . . . . .
[1]
(b) (i) Suggestone reason why it is so difficult for scientists to state exactly how many species exist in a group.
. . . . . . . . . . . . . . . . . . . . . . . . . . . . . . . . . . . . . . . . . . . . . . . . . . . . . . . . . . . . . . . . . .
. . . . . . . . . . . . . . . . . . . . . . . . . . . . . . . . . . . . . . . . . . . . . . . . . . . . . . . . . . . . . . . . . .
. . . . . . . . . . . . . . . . . . . . . . . . . . . . . . . . . . . . . . . . . . . . . . . . . . . . . . . . . . . . . . . . . .
[1]
(ii) Suggestwhy thenumberofknownvertebrate speciesmaysocloselymatch theestimatedtotalnumber.
. . . . . . . . . . . . . . . . . . . . . . . . . . . . . . . . . . . . . . . . . . . . . . . . . . . . . . . . . . . . . . . . . .
. . . . . . . . . . . . . . . . . . . . . . . . . . . . . . . . . . . . . . . . . . . . . . . . . . . . . . . . . . . . . . . . . .
. . . . . . . . . . . . . . . . . . . . . . . . . . . . . . . . . . . . . . . . . . . . . . . . . . . . . . . . . . . . . . . . . .
[1]
(This question continues on the following page)
–�–
Turn over
SPEC/4/ENVSO/SP1/ENG/TZ0/XX
(Question 1 continued)
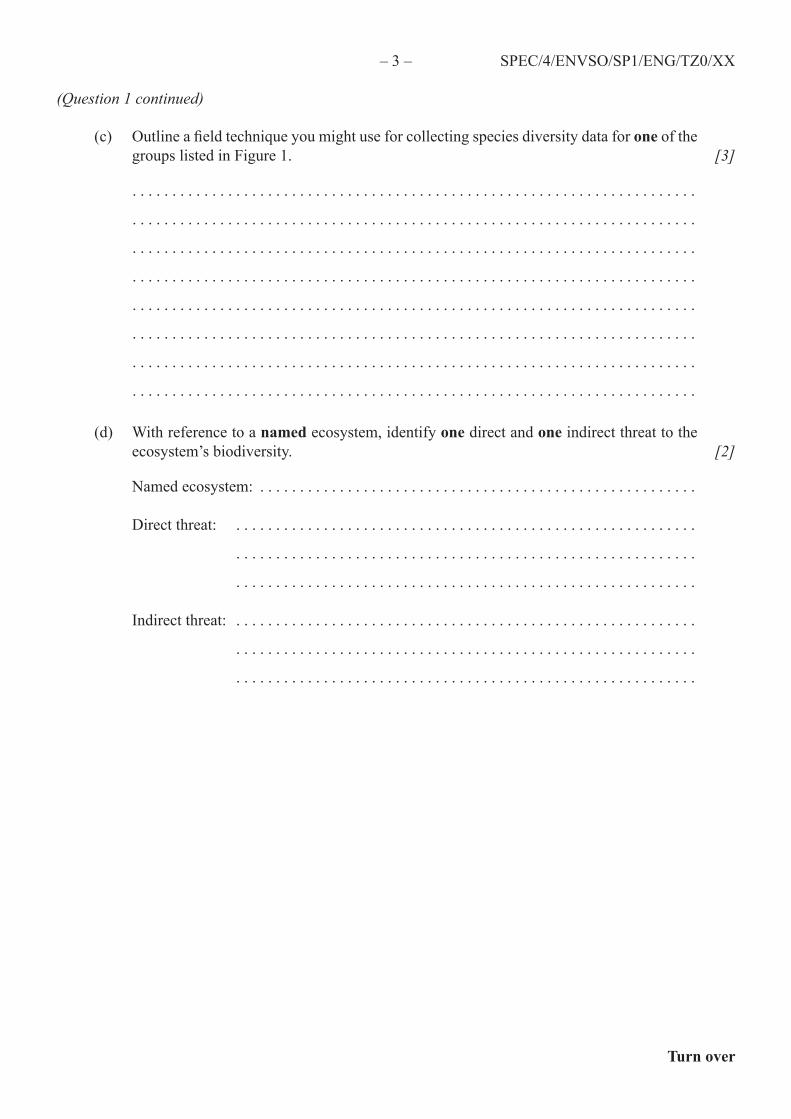
(c) Outline a field technique you might use for collecting species diversity data for oneofthegroupslistedinFigure1.
. . . . . . . . . . . . . . . . . . . . . . . . . . . . . . . . . . . . . . . . . . . . . . . . . . . . . . . . . . . . . . . . . . . . . . .
. . . . . . . . . . . . . . . . . . . . . . . . . . . . . . . . . . . . . . . . . . . . . . . . . . . . . . . . . . . . . . . . . . . . . . .
. . . . . . . . . . . . . . . . . . . . . . . . . . . . . . . . . . . . . . . . . . . . . . . . . . . . . . . . . . . . . . . . . . . . . . .
. . . . . . . . . . . . . . . . . . . . . . . . . . . . . . . . . . . . . . . . . . . . . . . . . . . . . . . . . . . . . . . . . . . . . . .
. . . . . . . . . . . . . . . . . . . . . . . . . . . . . . . . . . . . . . . . . . . . . . . . . . . . . . . . . . . . . . . . . . . . . . .
. . . . . . . . . . . . . . . . . . . . . . . . . . . . . . . . . . . . . . . . . . . . . . . . . . . . . . . . . . . . . . . . . . . . . . .
. . . . . . . . . . . . . . . . . . . . . . . . . . . . . . . . . . . . . . . . . . . . . . . . . . . . . . . . . . . . . . . . . . . . . . .
. . . . . . . . . . . . . . . . . . . . . . . . . . . . . . . . . . . . . . . . . . . . . . . . . . . . . . . . . . . . . . . . . . . . . . .
[3]
(d) Withreferencetoanamedecosystem,identifyonedirectandoneindirectthreattotheecosystem’sbiodiversity.
Namedecosystem: . . . . . . . . . . . . . . . . . . . . . . . . . . . . . . . . . . . . . . . . . . . . . . . . . . . . . . .
Directthreat: ..........................................................
..........................................................
..........................................................
Indirectthreat: ..........................................................
..........................................................
..........................................................
[2]
–4– SPEC/4/ENVSO/SP1/ENG/TZ0/XX
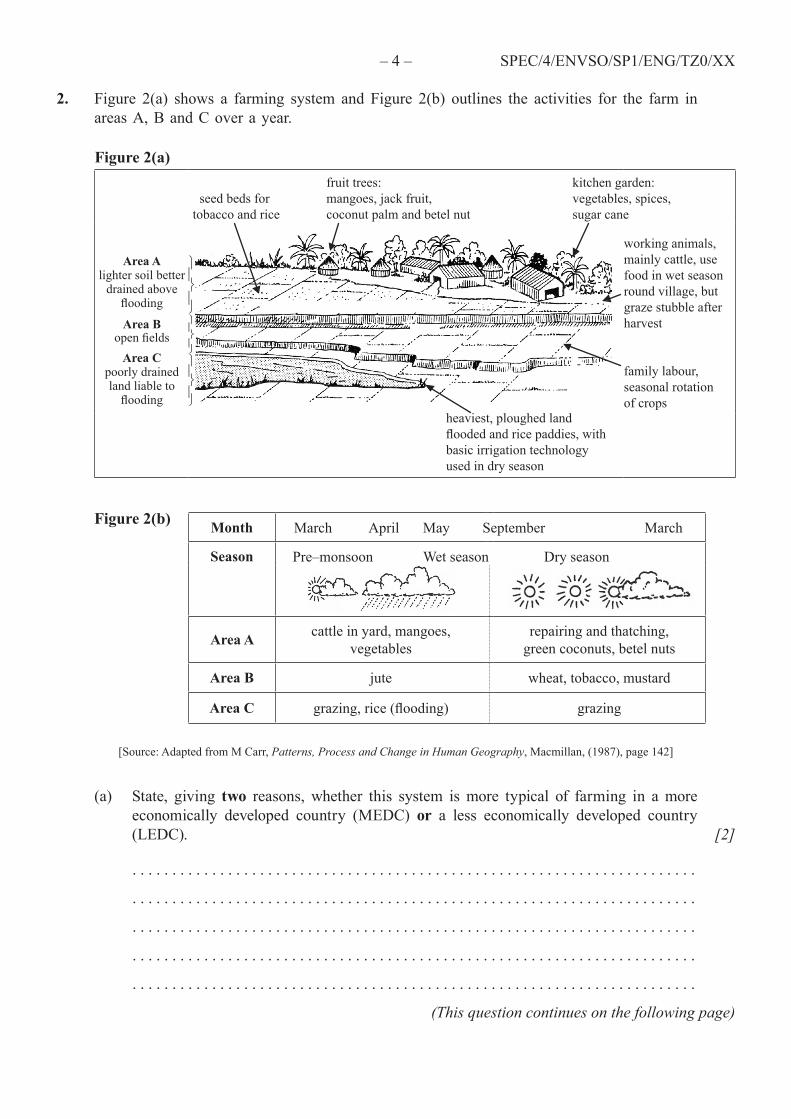
2. Figure �(a) shows a farming system and Figure �(b) outlines the activities for the farm inareasA,BandCoverayear.
Figure 2(a) fruittrees: kitchengarden: seedbedsfor mangoes,jackfruit, vegetables,spices, tobaccoandrice coconutpalmandbetelnut sugarcane
Area Alightersoilbetter
drainedaboveflooding
Area Bopen fields
Area Cpoorlydrainedlandliableto
flooding
workinganimals,mainlycattle,usefoodinwetseasonroundvillage,butgrazestubbleafterharvest
familylabour,seasonalrotationofcrops
heaviest,ploughedland flooded and rice paddies, with basicirrigationtechnology usedindryseason
Figure 2(b) Month March April May September March
Season Pre–monsoon Wetseason Dryseason
Area A cattleinyard,mangoes,vegetables
repairingandthatching,greencoconuts,betelnuts
Area B jute wheat,tobacco,mustard
Area C grazing, rice (flooding) grazing
[Source:AdaptedfromMCarr,Patterns, Process and Change in Human Geography,Macmillan,(1987),page14�]
(a) State, giving two reasons, whether this system is more typical of farming in a moreeconomically developed country (MEDC) or a less economically developed country(LEDC).
. . . . . . . . . . . . . . . . . . . . . . . . . . . . . . . . . . . . . . . . . . . . . . . . . . . . . . . . . . . . . . . . . . . . . . .
. . . . . . . . . . . . . . . . . . . . . . . . . . . . . . . . . . . . . . . . . . . . . . . . . . . . . . . . . . . . . . . . . . . . . . .
. . . . . . . . . . . . . . . . . . . . . . . . . . . . . . . . . . . . . . . . . . . . . . . . . . . . . . . . . . . . . . . . . . . . . . .
. . . . . . . . . . . . . . . . . . . . . . . . . . . . . . . . . . . . . . . . . . . . . . . . . . . . . . . . . . . . . . . . . . . . . . .
. . . . . . . . . . . . . . . . . . . . . . . . . . . . . . . . . . . . . . . . . . . . . . . . . . . . . . . . . . . . . . . . . . . . . . .
[2]
(This question continues on the following page)
–5–
Turn over
SPEC/4/ENVSO/SP1/ENG/TZ0/XX
(Question 2 continued)
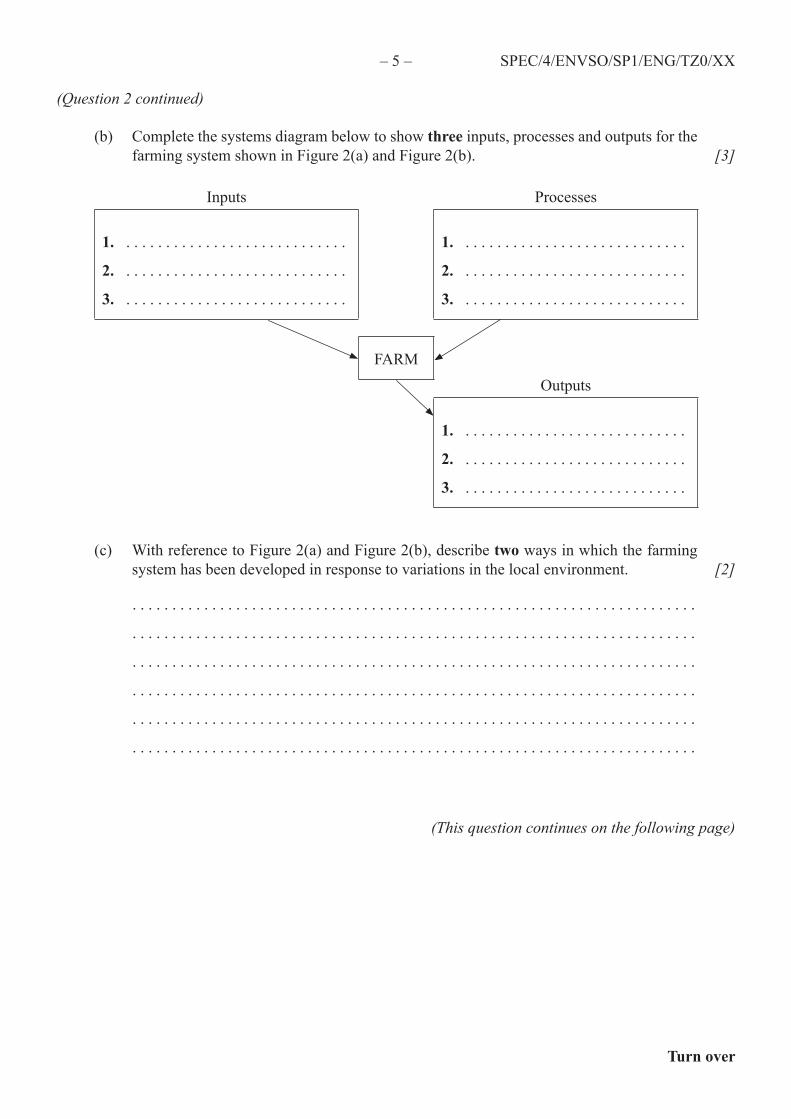
(b) Completethesystemsdiagrambelowtoshowthreeinputs,processesandoutputsforthefarmingsystemshowninFigure�(a)andFigure�(b). [3]
Inputs Processes
1. . . . . . . . . . . . . . . . . . . . . . . . . . . . .
2. . . . . . . . . . . . . . . . . . . . . . . . . . . . .
3. . . . . . . . . . . . . . . . . . . . . . . . . . . . .
1. . . . . . . . . . . . . . . . . . . . . . . . . . . . .
2. . . . . . . . . . . . . . . . . . . . . . . . . . . . .
3. . . . . . . . . . . . . . . . . . . . . . . . . . . . .
FARMOutputs
1. . . . . . . . . . . . . . . . . . . . . . . . . . . . .
2. . . . . . . . . . . . . . . . . . . . . . . . . . . . .
3. . . . . . . . . . . . . . . . . . . . . . . . . . . . .
(c) WithreferencetoFigure�(a)andFigure�(b),describetwowaysinwhichthefarmingsystemhasbeendevelopedinresponsetovariationsinthelocalenvironment.
. . . . . . . . . . . . . . . . . . . . . . . . . . . . . . . . . . . . . . . . . . . . . . . . . . . . . . . . . . . . . . . . . . . . . . .
. . . . . . . . . . . . . . . . . . . . . . . . . . . . . . . . . . . . . . . . . . . . . . . . . . . . . . . . . . . . . . . . . . . . . . .
. . . . . . . . . . . . . . . . . . . . . . . . . . . . . . . . . . . . . . . . . . . . . . . . . . . . . . . . . . . . . . . . . . . . . . .
. . . . . . . . . . . . . . . . . . . . . . . . . . . . . . . . . . . . . . . . . . . . . . . . . . . . . . . . . . . . . . . . . . . . . . .
. . . . . . . . . . . . . . . . . . . . . . . . . . . . . . . . . . . . . . . . . . . . . . . . . . . . . . . . . . . . . . . . . . . . . . .
. . . . . . . . . . . . . . . . . . . . . . . . . . . . . . . . . . . . . . . . . . . . . . . . . . . . . . . . . . . . . . . . . . . . . . .
[2]
(This question continues on the following page)

–�– SPEC/4/ENVSO/SP1/ENG/TZ0/XX
(Question 2 continued)
Figure�belowshowsnutrientcyclinginaterracedpaddy.
Figure 3 irrigation ricepaddy lower canal ricepaddy
decay of rice stubble nitrogen fixation byreleasesnutrients blue-greenalgae terrace riceplants
water littlesoil erosion
dead organic rapid breakdown oxidized zone material slowbreakdown NO� reducedzone(littleO�)
littleleaching
(d) With reference to Figure 3, define
(i) leaching.
. . . . . . . . . . . . . . . . . . . . . . . . . . . . . . . . . . . . . . . . . . . . . . . . . . . . . . . . . . . . . . . . . .
. . . . . . . . . . . . . . . . . . . . . . . . . . . . . . . . . . . . . . . . . . . . . . . . . . . . . . . . . . . . . . . . . .
[1]
(ii) nitrogen fixation.
. . . . . . . . . . . . . . . . . . . . . . . . . . . . . . . . . . . . . . . . . . . . . . . . . . . . . . . . . . . . . . . . . .
. . . . . . . . . . . . . . . . . . . . . . . . . . . . . . . . . . . . . . . . . . . . . . . . . . . . . . . . . . . . . . . . . .
[1]
(e) WithreferencetoFigure� explain the following.
(i) Thereisverylittlesoilerosioninthisfarmingsystem.
. . . . . . . . . . . . . . . . . . . . . . . . . . . . . . . . . . . . . . . . . . . . . . . . . . . . . . . . . . . . . . . . . .
. . . . . . . . . . . . . . . . . . . . . . . . . . . . . . . . . . . . . . . . . . . . . . . . . . . . . . . . . . . . . . . . . .
. . . . . . . . . . . . . . . . . . . . . . . . . . . . . . . . . . . . . . . . . . . . . . . . . . . . . . . . . . . . . . . . . .
[1]
(ii) The dead organic material breaks down more rapidly in the oxidized zone.
. . . . . . . . . . . . . . . . . . . . . . . . . . . . . . . . . . . . . . . . . . . . . . . . . . . . . . . . . . . . . . . . . .
. . . . . . . . . . . . . . . . . . . . . . . . . . . . . . . . . . . . . . . . . . . . . . . . . . . . . . . . . . . . . . . . . .
[1]

–7–
Turn over
SPEC/4/ENVSO/SP1/ENG/TZ0/XX
Blankpage

–8– SPEC/4/ENVSO/SP1/ENG/TZ0/XX
3. Figure 4 below shows how the sun’s energy flows along a food chain and Figure 5 showsoneway inwhichsolarenergycanbeconverted intoelectricity.
Figure 4 Foodchain
Calories/time10� 104 10� 10� 10
Sun Plants Herbivores Predators
Figure 5Electricenergychain
Calories/time10� 104 500 1�5 electricity
Sun Plants Fossilization Powerstation
[Source:AdaptedfromEPOdum,Ecology,A Bridge Between Science and Society,SinauerAssociatesInc.,(199�),page89]
(a) Describe and explain what is happening to energy along the food chain in Figure 4.
. . . . . . . . . . . . . . . . . . . . . . . . . . . . . . . . . . . . . . . . . . . . . . . . . . . . . . . . . . . . . . . . . . . . . . .
. . . . . . . . . . . . . . . . . . . . . . . . . . . . . . . . . . . . . . . . . . . . . . . . . . . . . . . . . . . . . . . . . . . . . . .
. . . . . . . . . . . . . . . . . . . . . . . . . . . . . . . . . . . . . . . . . . . . . . . . . . . . . . . . . . . . . . . . . . . . . . .
. . . . . . . . . . . . . . . . . . . . . . . . . . . . . . . . . . . . . . . . . . . . . . . . . . . . . . . . . . . . . . . . . . . . . . .
[2]
(b) Describetheprocessbywhichthesun’senergyisusedbyplants.
. . . . . . . . . . . . . . . . . . . . . . . . . . . . . . . . . . . . . . . . . . . . . . . . . . . . . . . . . . . . . . . . . . . . . . .
. . . . . . . . . . . . . . . . . . . . . . . . . . . . . . . . . . . . . . . . . . . . . . . . . . . . . . . . . . . . . . . . . . . . . . .
. . . . . . . . . . . . . . . . . . . . . . . . . . . . . . . . . . . . . . . . . . . . . . . . . . . . . . . . . . . . . . . . . . . . . . .
. . . . . . . . . . . . . . . . . . . . . . . . . . . . . . . . . . . . . . . . . . . . . . . . . . . . . . . . . . . . . . . . . . . . . . .
[2]
(c) StatetwoenergysourcesthatcouldbeusedinthepowerstationinFigure5.
. . . . . . . . . . . . . . . . . . . . . . . . . . . . . . . . . . . . . . . . . . . . . . . . . . . . . . . . . . . . . . . . . . . . . . .
. . . . . . . . . . . . . . . . . . . . . . . . . . . . . . . . . . . . . . . . . . . . . . . . . . . . . . . . . . . . . . . . . . . . . . .
[1]
(This question continues on the following page)
–9–
Turn over
SPEC/4/ENVSO/SP1/ENG/TZ0/XX
(Question 3 continued)
(d) Explain how the power station in Figure 5 may contribute to a named environmentalproblem.
Environmentalproblem: . . . . . . . . . . . . . . . . . . . . . . . . . . . . . . . . . . . . . . . . . . . . . . . . . . .
Explanation: . . . . . . . . . . . . . . . . . . . . . . . . . . . . . . . . . . . . . . . . . . . . . . . . . . . . . . . . . . .
. . . . . . . . . . . . . . . . . . . . . . . . . . . . . . . . . . . . . . . . . . . . . . . . . . . . . . . . . . . . . . . . . . . . . .
. . . . . . . . . . . . . . . . . . . . . . . . . . . . . . . . . . . . . . . . . . . . . . . . . . . . . . . . . . . . . . . . . . . . . .
. . . . . . . . . . . . . . . . . . . . . . . . . . . . . . . . . . . . . . . . . . . . . . . . . . . . . . . . . . . . . . . . . . . . . .
. . . . . . . . . . . . . . . . . . . . . . . . . . . . . . . . . . . . . . . . . . . . . . . . . . . . . . . . . . . . . . . . . . . . . .
. . . . . . . . . . . . . . . . . . . . . . . . . . . . . . . . . . . . . . . . . . . . . . . . . . . . . . . . . . . . . . . . . . . . . .
. . . . . . . . . . . . . . . . . . . . . . . . . . . . . . . . . . . . . . . . . . . . . . . . . . . . . . . . . . . . . . . . . . . . . .
. . . . . . . . . . . . . . . . . . . . . . . . . . . . . . . . . . . . . . . . . . . . . . . . . . . . . . . . . . . . . . . . . . . . . .
. . . . . . . . . . . . . . . . . . . . . . . . . . . . . . . . . . . . . . . . . . . . . . . . . . . . . . . . . . . . . . . . . . . . . .
[3]
(This question continues on the following page)

–10– SPEC/4/ENVSO/SP1/ENG/TZ0/XX
(Question 3 continued)
Figure�belowshowstheworlddistributionofprimaryproductionindifferentbiomes.
Figure 6 Primaryproduction/10�kJm–�year–1
Lessthan�.0 �.0–1� 1�–40 40–100 �.0–1� Lessthan40
A B C D E F
Deserts Grasslands Moistforests Continental Deepoceans Deeplakes andsecondary shelfwaters Mountainforests communities Unsubsidized Shallowlakes agriculture Moistgrasslands Average agriculture Someestuaries springs,coral reefs,terrestrial communitieson alluvialplains Fuel-subsidized agriculture
[Source:AdaptedfromEPOdum,Ecology,A Bridge Between Science and Society,SinauerAssociatesInc.,(199�),page94]
(e) State which of the zonesA to F is responsible for the largest proportion of primaryproduction.
. . . . . . . . . . . . . . . . . . . . . . . . . . . . . . . . . . . . . . . . . . . . . . . . . . . . . . . . . . . . . . . . . . . . . . .
[1]
(f) Distinguishbetweenprimary productivityandsecondary productivity.
. . . . . . . . . . . . . . . . . . . . . . . . . . . . . . . . . . . . . . . . . . . . . . . . . . . . . . . . . . . . . . . . . . . . . . .
. . . . . . . . . . . . . . . . . . . . . . . . . . . . . . . . . . . . . . . . . . . . . . . . . . . . . . . . . . . . . . . . . . . . . . .
. . . . . . . . . . . . . . . . . . . . . . . . . . . . . . . . . . . . . . . . . . . . . . . . . . . . . . . . . . . . . . . . . . . . . . .
[1]
(This question continues on the following page)

–11–
Turn over
SPEC/4/ENVSO/SP1/ENG/TZ0/XX
(Question 3 continued)
(g) With reference to Figure 6, explain tworeasonswhysomebiomesaremoreproductivethanothers.
. . . . . . . . . . . . . . . . . . . . . . . . . . . . . . . . . . . . . . . . . . . . . . . . . . . . . . . . . . . . . . . . . . . . . . .
. . . . . . . . . . . . . . . . . . . . . . . . . . . . . . . . . . . . . . . . . . . . . . . . . . . . . . . . . . . . . . . . . . . . . . .
. . . . . . . . . . . . . . . . . . . . . . . . . . . . . . . . . . . . . . . . . . . . . . . . . . . . . . . . . . . . . . . . . . . . . . .
. . . . . . . . . . . . . . . . . . . . . . . . . . . . . . . . . . . . . . . . . . . . . . . . . . . . . . . . . . . . . . . . . . . . . . .
. . . . . . . . . . . . . . . . . . . . . . . . . . . . . . . . . . . . . . . . . . . . . . . . . . . . . . . . . . . . . . . . . . . . . . .
. . . . . . . . . . . . . . . . . . . . . . . . . . . . . . . . . . . . . . . . . . . . . . . . . . . . . . . . . . . . . . . . . . . . . . .
[2]
–1�– SPEC/4/ENVSO/SP1/ENG/TZ0/XX
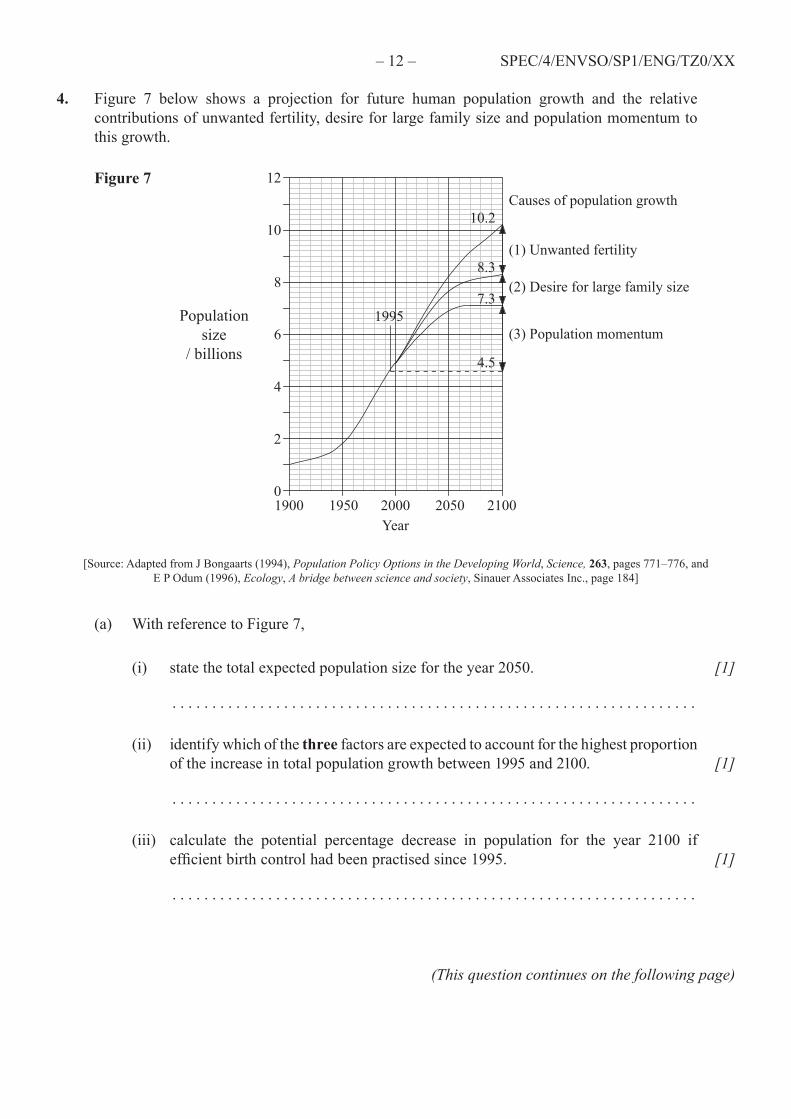
4. Figure 7 below shows a projection for future human population growth and the relativecontributionsofunwantedfertility,desireforlargefamilysizeandpopulationmomentumtothisgrowth.
Figure 7
Populationsize
/billions
1�
10
8
�
4
�
0
Causesofpopulationgrowth 10.�
(1)Unwantedfertility 8.� (�)Desireforlargefamilysize 7.�1995 (�)Populationmomentum
4.5
1900 1950 �000 �050 �100 Year
[Source:AdaptedfromJBongaarts(1994),Population Policy Options in the Developing World,Science,263,pages771–77�,andEPOdum(199�),Ecology,A bridge between science and society,SinauerAssociatesInc.,page184]
(a) WithreferencetoFigure7,
(i) state the total expected population size for the year 2050.
. . . . . . . . . . . . . . . . . . . . . . . . . . . . . . . . . . . . . . . . . . . . . . . . . . . . . . . . . . . . . . . . . .
[1]
(ii) identifywhichofthethree factors are expected to account for the highest proportion oftheincreaseintotalpopulationgrowthbetween1995and�100.
. . . . . . . . . . . . . . . . . . . . . . . . . . . . . . . . . . . . . . . . . . . . . . . . . . . . . . . . . . . . . . . . . .
[1]
(iii) calculate the potential percentage decrease in population for the year �100 ifefficientbirthcontrolhadbeenpractisedsince1995.
. . . . . . . . . . . . . . . . . . . . . . . . . . . . . . . . . . . . . . . . . . . . . . . . . . . . . . . . . . . . . . . . . .
[1]
(This question continues on the following page)
–1�–
Turn over
SPEC/4/ENVSO/SP1/ENG/TZ0/XX
(Question 4 continued)
(b) Explain the reasons for eitherunwantedfertilityordesireforlargefamilysizeinanamedcountry.
. . . . . . . . . . . . . . . . . . . . . . . . . . . . . . . . . . . . . . . . . . . . . . . . . . . . . . . . . . . . . . . . . . . . . . .
. . . . . . . . . . . . . . . . . . . . . . . . . . . . . . . . . . . . . . . . . . . . . . . . . . . . . . . . . . . . . . . . . . . . . . .
. . . . . . . . . . . . . . . . . . . . . . . . . . . . . . . . . . . . . . . . . . . . . . . . . . . . . . . . . . . . . . . . . . . . . . .
. . . . . . . . . . . . . . . . . . . . . . . . . . . . . . . . . . . . . . . . . . . . . . . . . . . . . . . . . . . . . . . . . . . . . . .
. . . . . . . . . . . . . . . . . . . . . . . . . . . . . . . . . . . . . . . . . . . . . . . . . . . . . . . . . . . . . . . . . . . . . . .
. . . . . . . . . . . . . . . . . . . . . . . . . . . . . . . . . . . . . . . . . . . . . . . . . . . . . . . . . . . . . . . . . . . . . . .
. . . . . . . . . . . . . . . . . . . . . . . . . . . . . . . . . . . . . . . . . . . . . . . . . . . . . . . . . . . . . . . . . . . . . . .
[3]
(c) Suggesttwo factorswhichmaylimittotalpopulationgrowthinthefuture.
. . . . . . . . . . . . . . . . . . . . . . . . . . . . . . . . . . . . . . . . . . . . . . . . . . . . . . . . . . . . . . . . . . . . . . .
. . . . . . . . . . . . . . . . . . . . . . . . . . . . . . . . . . . . . . . . . . . . . . . . . . . . . . . . . . . . . . . . . . . . . . .
. . . . . . . . . . . . . . . . . . . . . . . . . . . . . . . . . . . . . . . . . . . . . . . . . . . . . . . . . . . . . . . . . . . . . . .
. . . . . . . . . . . . . . . . . . . . . . . . . . . . . . . . . . . . . . . . . . . . . . . . . . . . . . . . . . . . . . . . . . . . . . .
. . . . . . . . . . . . . . . . . . . . . . . . . . . . . . . . . . . . . . . . . . . . . . . . . . . . . . . . . . . . . . . . . . . . . . .
. . . . . . . . . . . . . . . . . . . . . . . . . . . . . . . . . . . . . . . . . . . . . . . . . . . . . . . . . . . . . . . . . . . . . . .
. . . . . . . . . . . . . . . . . . . . . . . . . . . . . . . . . . . . . . . . . . . . . . . . . . . . . . . . . . . . . . . . . . . . . . .
[2]
–14– SPEC/4/ENVSO/SP1/ENG/TZ0/XX
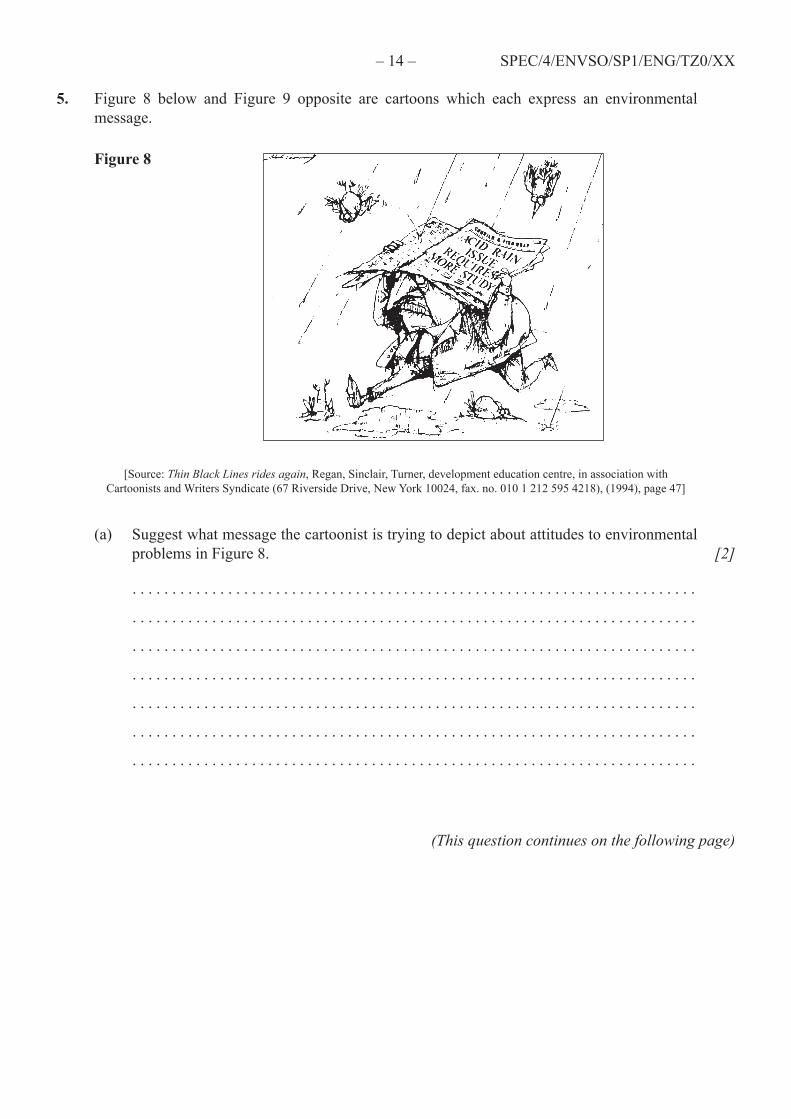
5. Figure 8 below and Figure 9 opposite are cartoons which each express an environmental message.
Figure 8
[Source:Thin Black Lines rides again,Regan,Sinclair,Turner,developmenteducationcentre,inassociationwithCartoonists and Writers Syndicate (67 Riverside Drive, New York 10024, fax. no. 010 1 212 595 4218), (1994), page 47]
(a) SuggestwhatmessagethecartoonististryingtodepictaboutattitudestoenvironmentalproblemsinFigure8.
. . . . . . . . . . . . . . . . . . . . . . . . . . . . . . . . . . . . . . . . . . . . . . . . . . . . . . . . . . . . . . . . . . . . . . .
. . . . . . . . . . . . . . . . . . . . . . . . . . . . . . . . . . . . . . . . . . . . . . . . . . . . . . . . . . . . . . . . . . . . . . .
. . . . . . . . . . . . . . . . . . . . . . . . . . . . . . . . . . . . . . . . . . . . . . . . . . . . . . . . . . . . . . . . . . . . . . .
. . . . . . . . . . . . . . . . . . . . . . . . . . . . . . . . . . . . . . . . . . . . . . . . . . . . . . . . . . . . . . . . . . . . . . .
. . . . . . . . . . . . . . . . . . . . . . . . . . . . . . . . . . . . . . . . . . . . . . . . . . . . . . . . . . . . . . . . . . . . . . .
. . . . . . . . . . . . . . . . . . . . . . . . . . . . . . . . . . . . . . . . . . . . . . . . . . . . . . . . . . . . . . . . . . . . . . .
. . . . . . . . . . . . . . . . . . . . . . . . . . . . . . . . . . . . . . . . . . . . . . . . . . . . . . . . . . . . . . . . . . . . . . .
[2]
(This question continues on the following page)
–15– SPEC/4/ENVSO/SP1/ENG/TZ0/XX
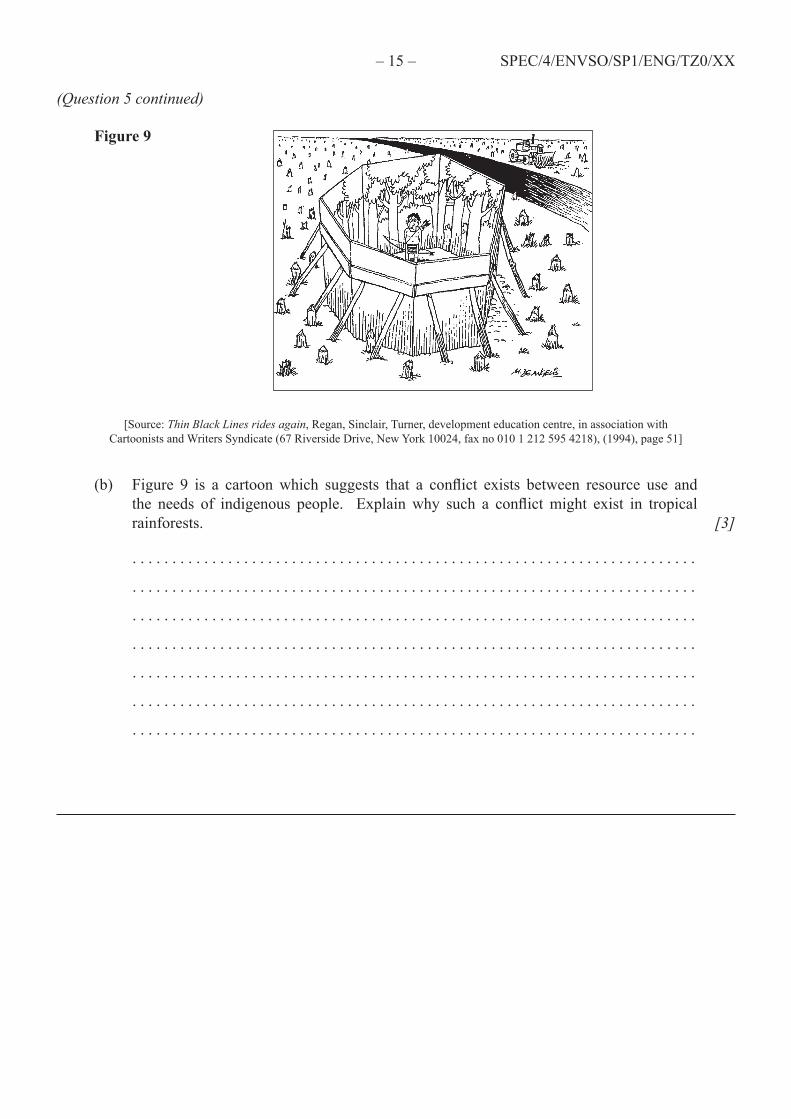
(Question 5 continued)
Figure 9
[Source:Thin Black Lines rides again,Regan,Sinclair,Turner,developmenteducationcentre,inassociationwithCartoonists and Writers Syndicate (67 Riverside Drive, New York 10024, fax no 010 1 212 595 4218), (1994), page 51]
(b) Figure 9 is a cartoon which suggests that a conflict exists between resource use and the needs of indigenous people. Explain why such a conflict might exist in tropical rainforests.
. . . . . . . . . . . . . . . . . . . . . . . . . . . . . . . . . . . . . . . . . . . . . . . . . . . . . . . . . . . . . . . . . . . . . . .
. . . . . . . . . . . . . . . . . . . . . . . . . . . . . . . . . . . . . . . . . . . . . . . . . . . . . . . . . . . . . . . . . . . . . . .
. . . . . . . . . . . . . . . . . . . . . . . . . . . . . . . . . . . . . . . . . . . . . . . . . . . . . . . . . . . . . . . . . . . . . . .
. . . . . . . . . . . . . . . . . . . . . . . . . . . . . . . . . . . . . . . . . . . . . . . . . . . . . . . . . . . . . . . . . . . . . . .
. . . . . . . . . . . . . . . . . . . . . . . . . . . . . . . . . . . . . . . . . . . . . . . . . . . . . . . . . . . . . . . . . . . . . . .
. . . . . . . . . . . . . . . . . . . . . . . . . . . . . . . . . . . . . . . . . . . . . . . . . . . . . . . . . . . . . . . . . . . . . . .
. . . . . . . . . . . . . . . . . . . . . . . . . . . . . . . . . . . . . . . . . . . . . . . . . . . . . . . . . . . . . . . . . . . . . . .
[3]

SPEC/4/ENVSO/SP1/ENG/TZ0/XX/M
6 pages
MARKSCHEME
SPECIMEN PAPER
ENVIRONMENTAL SYSTEMS AND SOCIETIES
Standard Level
Paper 1
– 2 – SPEC/4/ENVSO/SP1/ENG/TZ0/XX/M
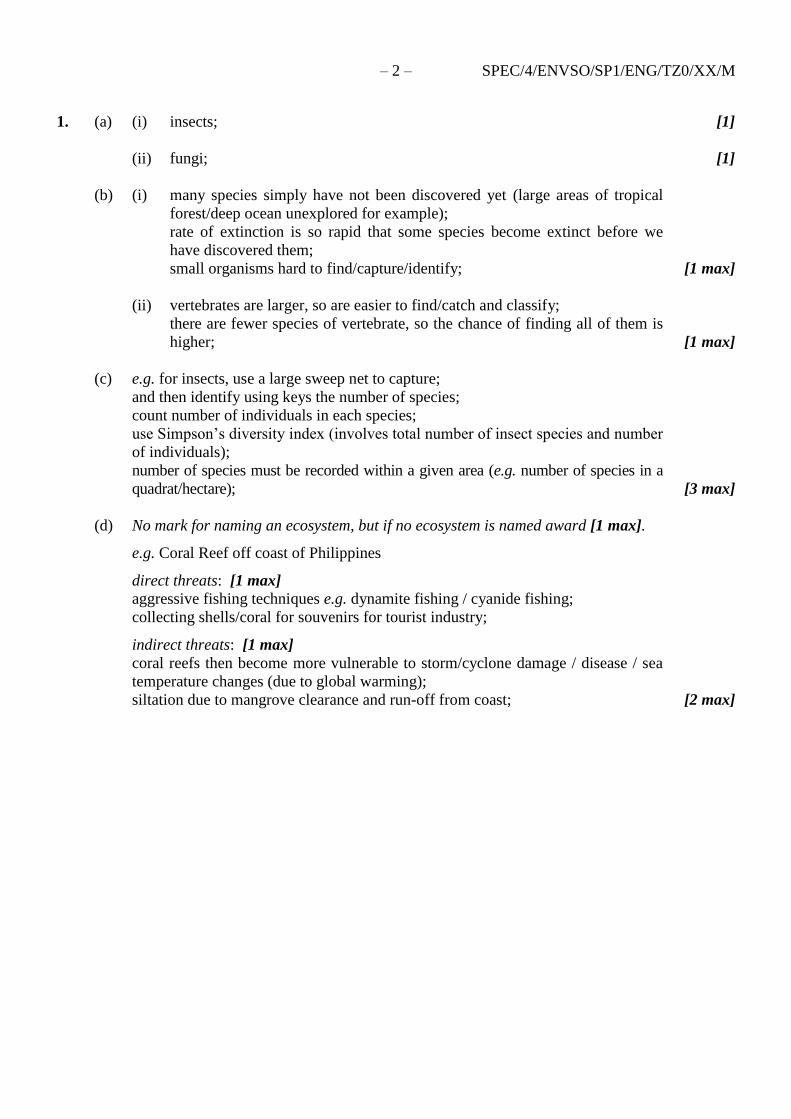
1. (a) (i) insects; [1]
(ii) fungi; [1]
(b) (i) many species simply have not been discovered yet (large areas of tropical
forest/deep ocean unexplored for example);
rate of extinction is so rapid that some species become extinct before we
have discovered them;
small organisms hard to find/capture/identify; [1 max]
(ii) vertebrates are larger, so are easier to find/catch and classify;
there are fewer species of vertebrate, so the chance of finding all of them is
higher; [1 max]
(c) e.g. for insects, use a large sweep net to capture;
and then identify using keys the number of species;
count number of individuals in each species;
use Simpson’s diversity index (involves total number of insect species and number
of individuals);
number of species must be recorded within a given area (e.g. number of species in a
quadrat/hectare); [3 max]
(d) No mark for naming an ecosystem, but if no ecosystem is named award [1 max]. e.g. Coral Reef off coast of Philippines direct threats: [1 max]
aggressive fishing techniques e.g. dynamite fishing / cyanide fishing;
collecting shells/coral for souvenirs for tourist industry; indirect threats: [1 max]
coral reefs then become more vulnerable to storm/cyclone damage / disease / sea
temperature changes (due to global warming);
siltation due to mangrove clearance and run-off from coast; [2 max]

– 3 – SPEC/4/ENVSO/SP1/ENG/TZ0/XX/M
2. (a) LEDC
basic/lack of technology generally;
rice farming is typical of LEDCs / where rice is often the staple crop;
cash crops for export such as sugar cane, tobacco;
houses look fairly simple and made from local / cheap materials / thatched roofs;
dependence on working animals;
labour intensive (family labour);
mixed cropping on small scale; [2 max]
Award [0] for only stating LEDC.
(b) inputs: [1 max]
water / technology / cattle (livestock) / sunlight / rain / manure / seed / labour / soil;
Award [1] for any three of the above. processes: [1 max]
planting / ploughing / harvesting / irrigating / repair / respiration / run-off / labour;
Award [1] for any three of the above. outputs: [1 max]
jute / vegetables / mangoes / Jack fruit / Palm / coconut / sugar cane / spices / crops /
waste / income / energy / rice / food / Betel nuts / tobacco / cattle (livestock) / heat /
oxygen / carbon dioxide / wheat / mustard; [3]
Award [1] for any three of the above.
(c) different crops planted at different levels;
rotation of crops to match seasonal rainfall patterns;
monsoonal climate so main crop is rice;
irrigation technology used in dry season;
livestock fed differently at different times of year;
different jobs done at different times of year; [2 max]
Accept other reasonable answers.
Answers must be linked to variations in environment.
(d) (i) when nutrients, dissolved in water, wash down through the soil/paddy and
are lost; [1]
(ii) process by which nitrogen in atmosphere is fixed to form nitrate by
blue-green algae (and converted into a useable form for plants); [1]
(e) (i) because the terraces are level there is little run-off by water so soil is not
washed away / terraces prevent soil erosion / soil collects in paddies; [1]
(ii) oxygen is required by decomposers to break down organic matter (the
oxidized zone is closer to the surface and richer in oxygen) / higher BOD in
oxidized zone as more decomposers, thus more decomposition; [1]
– 4 – SPEC/4/ENVSO/SP1/ENG/TZ0/XX/M
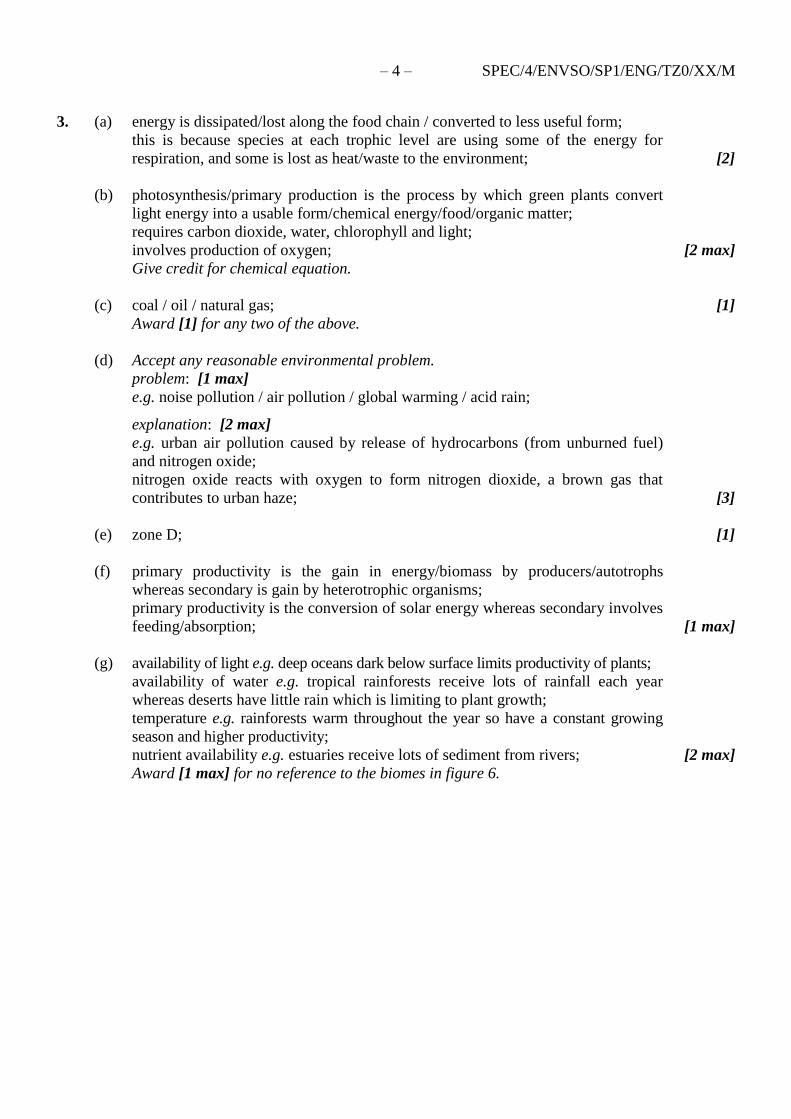
3. (a) energy is dissipated/lost along the food chain / converted to less useful form;
this is because species at each trophic level are using some of the energy for
respiration, and some is lost as heat/waste to the environment; [2]
(b) photosynthesis/primary production is the process by which green plants convert
light energy into a usable form/chemical energy/food/organic matter;
requires carbon dioxide, water, chlorophyll and light;
involves production of oxygen; [2 max]
Give credit for chemical equation.
(c) coal / oil / natural gas; [1]
Award [1] for any two of the above.
(d) Accept any reasonable environmental problem.
problem: [1 max]
e.g. noise pollution / air pollution / global warming / acid rain; explanation: [2 max]
e.g. urban air pollution caused by release of hydrocarbons (from unburned fuel)
and nitrogen oxide;
nitrogen oxide reacts with oxygen to form nitrogen dioxide, a brown gas that
contributes to urban haze; [3]
(e) zone D; [1]
(f) primary productivity is the gain in energy/biomass by producers/autotrophs
whereas secondary is gain by heterotrophic organisms;
primary productivity is the conversion of solar energy whereas secondary involves
feeding/absorption; [1 max]
(g) availability of light e.g. deep oceans dark below surface limits productivity of plants;
availability of water e.g. tropical rainforests receive lots of rainfall each year
whereas deserts have little rain which is limiting to plant growth;
temperature e.g. rainforests warm throughout the year so have a constant growing
season and higher productivity;
nutrient availability e.g. estuaries receive lots of sediment from rivers; [2 max]
Award [1 max] for no reference to the biomes in figure 6.
– 5 – SPEC/4/ENVSO/SP1/ENG/TZ0/XX/M
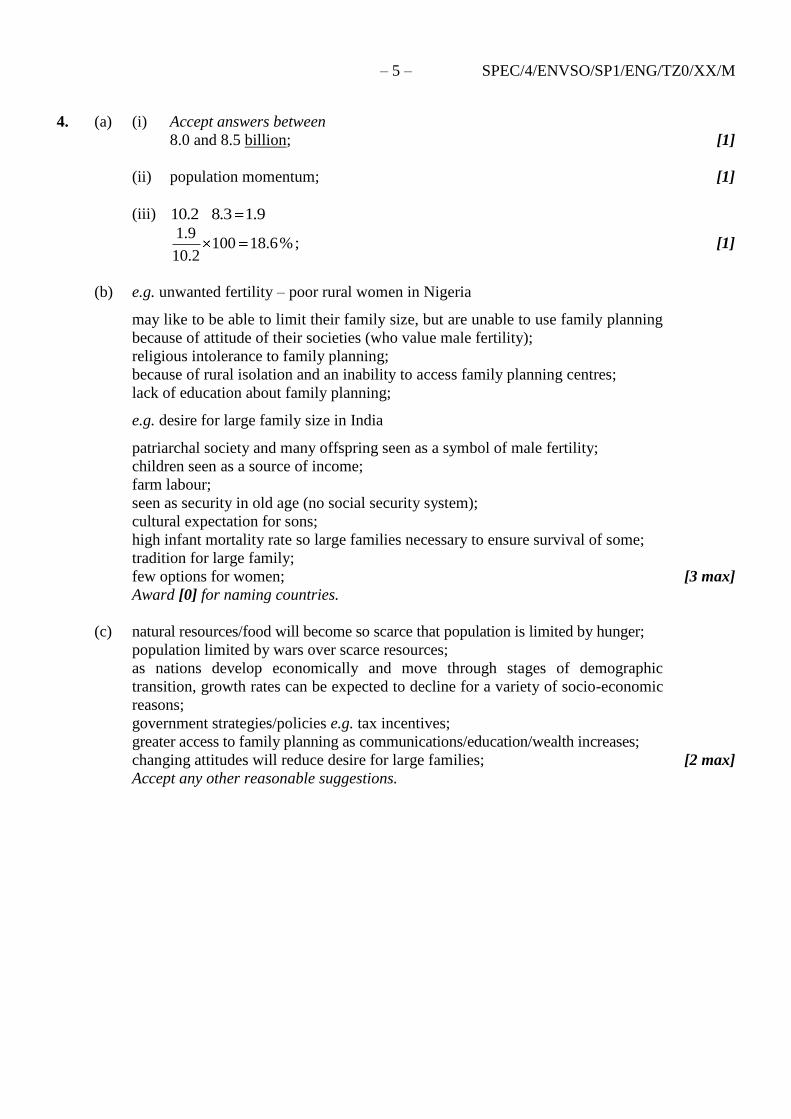
4. (a) (i) Accept answers between
8.0 and 8.5 billion; [1]
(ii) population momentum; [1]
(iii) 10.2 8.3 1.9
1.9
100 18.6%10.2
; [1]
(b) e.g. unwanted fertility – poor rural women in Nigeria
may like to be able to limit their family size, but are unable to use family planning
because of attitude of their societies (who value male fertility);
religious intolerance to family planning;
because of rural isolation and an inability to access family planning centres;
lack of education about family planning; e.g. desire for large family size in India patriarchal society and many offspring seen as a symbol of male fertility;
children seen as a source of income;
farm labour;
seen as security in old age (no social security system);
cultural expectation for sons;
high infant mortality rate so large families necessary to ensure survival of some;
tradition for large family;
few options for women; [3 max]
Award [0] for naming countries.
(c) natural resources/food will become so scarce that population is limited by hunger;
population limited by wars over scarce resources;
as nations develop economically and move through stages of demographic
transition, growth rates can be expected to decline for a variety of socio-economic
reasons;
government strategies/policies e.g. tax incentives;
greater access to family planning as communications/education/wealth increases;
changing attitudes will reduce desire for large families; [2 max]
Accept any other reasonable suggestions.
– 6 – SPEC/4/ENVSO/SP1/ENG/TZ0/XX/M
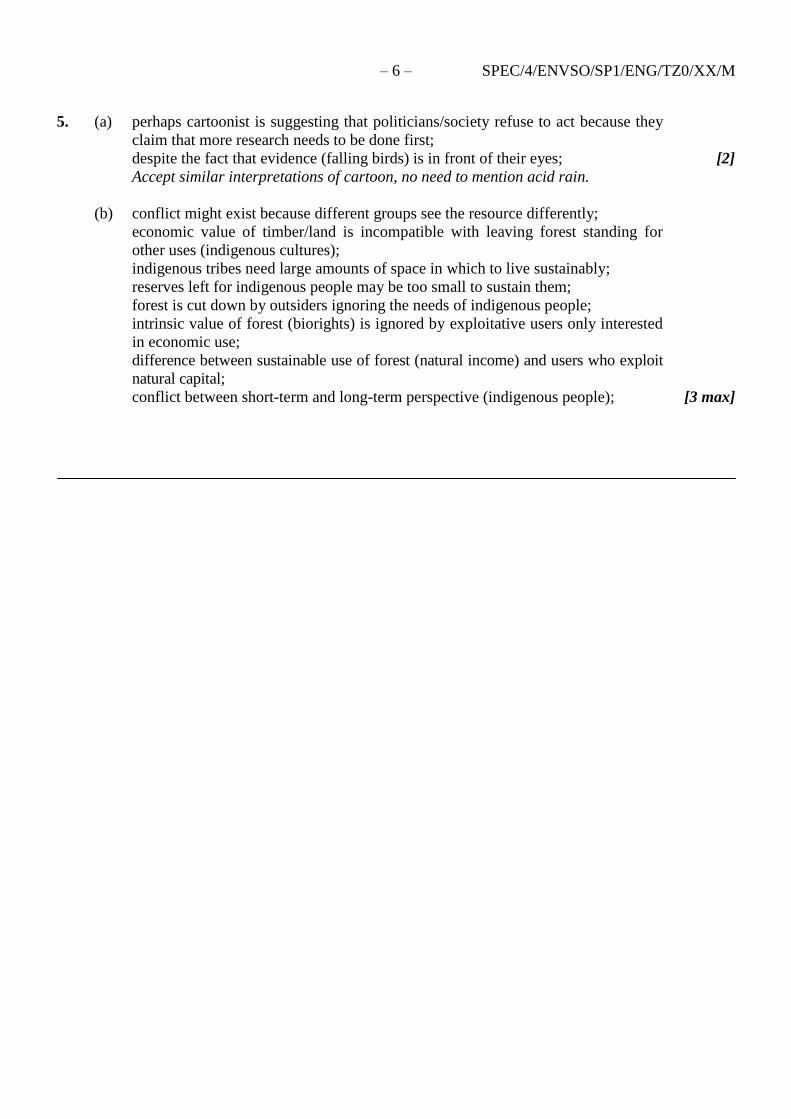
5. (a) perhaps cartoonist is suggesting that politicians/society refuse to act because they
claim that more research needs to be done first;
despite the fact that evidence (falling birds) is in front of their eyes; [2]
Accept similar interpretations of cartoon, no need to mention acid rain.
(b) conflict might exist because different groups see the resource differently;
economic value of timber/land is incompatible with leaving forest standing for
other uses (indigenous cultures);
indigenous tribes need large amounts of space in which to live sustainably;
reserves left for indigenous people may be too small to sustain them;
forest is cut down by outsiders ignoring the needs of indigenous people;
intrinsic value of forest (biorights) is ignored by exploitative users only interested
in economic use;
difference between sustainable use of forest (natural income) and users who exploit
natural capital;
conflict between short-term and long-term perspective (indigenous people); [3 max]
7 pages
SPEC/4/ENVSO/SP2/ENG/TZ0/XX/Q
SPECIMEN PAPER
ENVIRONMENTAL SYSTEMS AND SOCIETIESSTANDARD LEVELPAPER 2
INSTRUCTIONS TO CANDIDATES
• Write your session number in the boxes above.• Do not open this examination paper until instructed to do so.• Section A: answer all of Section A in the spaces provided. Refer to the resource booklet which
accompanies this question paper.• Section B: answer two questions from Section B. Write your answers on answer sheets.
Write your session number on each answer sheet, and attach them to this examination paper and your cover sheet using the tag provided.
• At the end of the examination, indicate the numbers of the questions answered in the candidate box on your cover sheet and indicate the number of sheets used in the appropriate box on your cover sheet.
2 hours
Candidate session number
0 0
© International Baccalaureate Organization 2008

– � – SPEC/4/ENVSO/SP�/ENG/TZ0/XX/Q
Section a
Answer all of Section A in the spaces provided.
The resource booklet provides information on Glen Canyon Dam on the Colorado River, in the United States. Use the resource booklet and your own studies to answer the following.
1. (a) Describe the purpose of an Environmental Impact Assessment (EIA).
. . . . . . . . . . . . . . . . . . . . . . . . . . . . . . . . . . . . . . . . . . . . . . . . . . . . . . . . . . . . . . . . . . . . . . .
. . . . . . . . . . . . . . . . . . . . . . . . . . . . . . . . . . . . . . . . . . . . . . . . . . . . . . . . . . . . . . . . . . . . . . .
. . . . . . . . . . . . . . . . . . . . . . . . . . . . . . . . . . . . . . . . . . . . . . . . . . . . . . . . . . . . . . . . . . . . . . .
. . . . . . . . . . . . . . . . . . . . . . . . . . . . . . . . . . . . . . . . . . . . . . . . . . . . . . . . . . . . . . . . . . . . . . .
. . . . . . . . . . . . . . . . . . . . . . . . . . . . . . . . . . . . . . . . . . . . . . . . . . . . . . . . . . . . . . . . . . . . . . .
[2]
(b) At the time of construction of Glen Canyon Dam no EIA was undertaken. Outline, giving reasons, three variables which should have been measured as part of a baseline study prior to starting construction.
. . . . . . . . . . . . . . . . . . . . . . . . . . . . . . . . . . . . . . . . . . . . . . . . . . . . . . . . . . . . . . . . . . . . . . .
. . . . . . . . . . . . . . . . . . . . . . . . . . . . . . . . . . . . . . . . . . . . . . . . . . . . . . . . . . . . . . . . . . . . . . .
. . . . . . . . . . . . . . . . . . . . . . . . . . . . . . . . . . . . . . . . . . . . . . . . . . . . . . . . . . . . . . . . . . . . . . .
. . . . . . . . . . . . . . . . . . . . . . . . . . . . . . . . . . . . . . . . . . . . . . . . . . . . . . . . . . . . . . . . . . . . . . .
. . . . . . . . . . . . . . . . . . . . . . . . . . . . . . . . . . . . . . . . . . . . . . . . . . . . . . . . . . . . . . . . . . . . . . .
. . . . . . . . . . . . . . . . . . . . . . . . . . . . . . . . . . . . . . . . . . . . . . . . . . . . . . . . . . . . . . . . . . . . . . .
. . . . . . . . . . . . . . . . . . . . . . . . . . . . . . . . . . . . . . . . . . . . . . . . . . . . . . . . . . . . . . . . . . . . . . .
. . . . . . . . . . . . . . . . . . . . . . . . . . . . . . . . . . . . . . . . . . . . . . . . . . . . . . . . . . . . . . . . . . . . . . .
[3]
(This question continues on the following page)
– � –
turn over
SPEC/4/ENVSO/SP�/ENG/TZ0/XX/Q
(Question 1 continued)
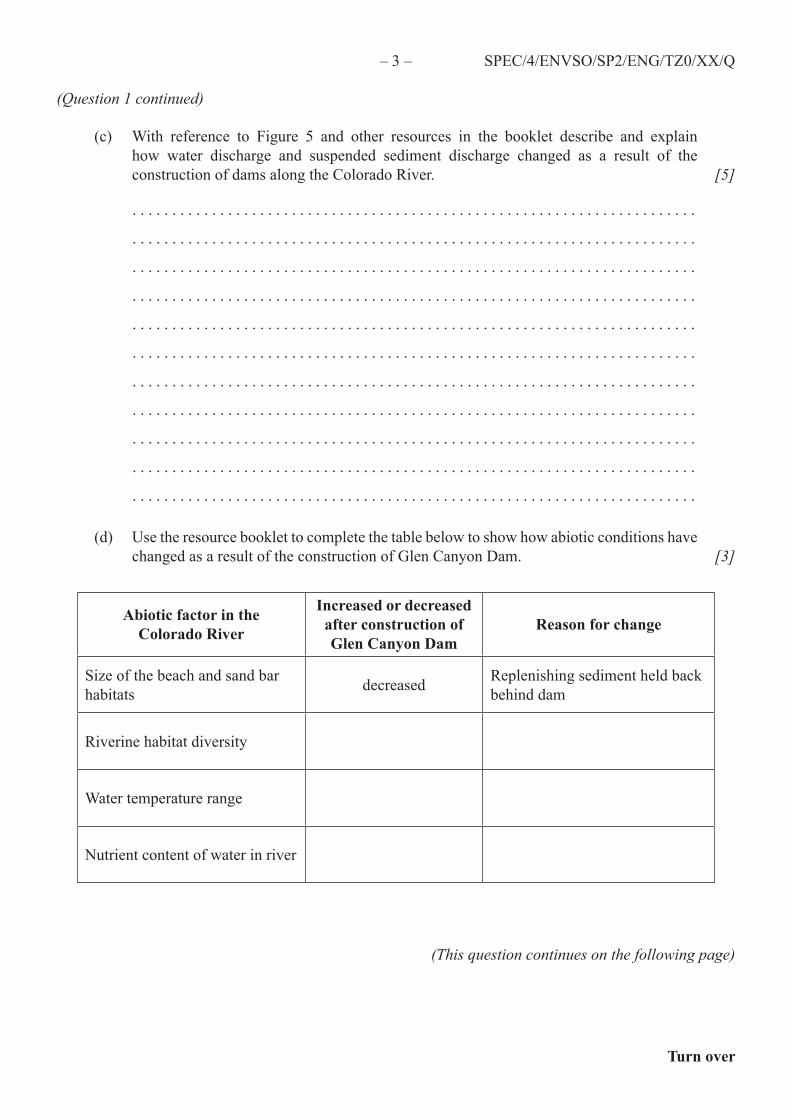
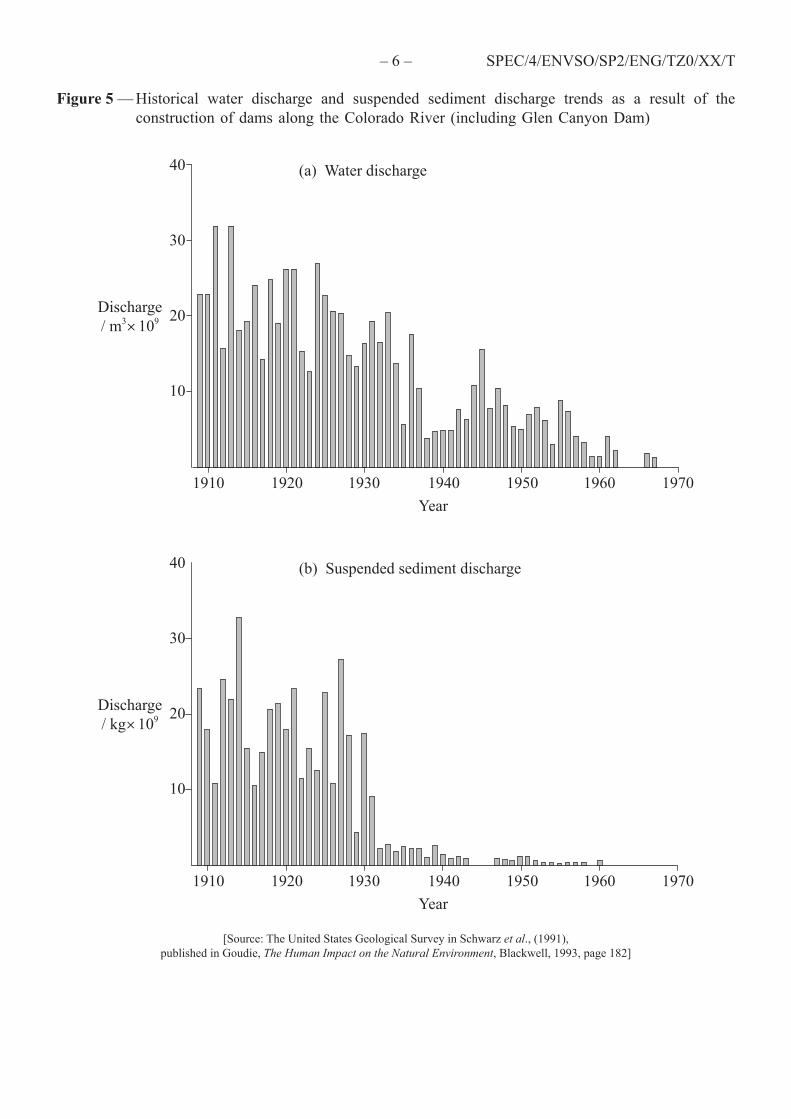
(c) With reference to Figure 5 and other resources in the booklet describe and explain how water discharge and suspended sediment discharge changed as a result of the construction of dams along the Colorado River.
. . . . . . . . . . . . . . . . . . . . . . . . . . . . . . . . . . . . . . . . . . . . . . . . . . . . . . . . . . . . . . . . . . . . . . .
. . . . . . . . . . . . . . . . . . . . . . . . . . . . . . . . . . . . . . . . . . . . . . . . . . . . . . . . . . . . . . . . . . . . . . .
. . . . . . . . . . . . . . . . . . . . . . . . . . . . . . . . . . . . . . . . . . . . . . . . . . . . . . . . . . . . . . . . . . . . . . .
. . . . . . . . . . . . . . . . . . . . . . . . . . . . . . . . . . . . . . . . . . . . . . . . . . . . . . . . . . . . . . . . . . . . . . .
. . . . . . . . . . . . . . . . . . . . . . . . . . . . . . . . . . . . . . . . . . . . . . . . . . . . . . . . . . . . . . . . . . . . . . .
. . . . . . . . . . . . . . . . . . . . . . . . . . . . . . . . . . . . . . . . . . . . . . . . . . . . . . . . . . . . . . . . . . . . . . .
. . . . . . . . . . . . . . . . . . . . . . . . . . . . . . . . . . . . . . . . . . . . . . . . . . . . . . . . . . . . . . . . . . . . . . .
. . . . . . . . . . . . . . . . . . . . . . . . . . . . . . . . . . . . . . . . . . . . . . . . . . . . . . . . . . . . . . . . . . . . . . .
. . . . . . . . . . . . . . . . . . . . . . . . . . . . . . . . . . . . . . . . . . . . . . . . . . . . . . . . . . . . . . . . . . . . . . .
. . . . . . . . . . . . . . . . . . . . . . . . . . . . . . . . . . . . . . . . . . . . . . . . . . . . . . . . . . . . . . . . . . . . . . .
. . . . . . . . . . . . . . . . . . . . . . . . . . . . . . . . . . . . . . . . . . . . . . . . . . . . . . . . . . . . . . . . . . . . . . .
[5]
(d) Use the resource booklet to complete the table below to show how abiotic conditions have changed as a result of the construction of Glen Canyon Dam. [3]
abiotic factor in thecolorado River
increased or decreased after construction of Glen canyon Dam
Reason for change
Size of the beach and sand bar habitats decreased Replenishing sediment held back
behind dam
Riverine habitat diversity
Water temperature range
Nutrient content of water in river
(This question continues on the following page)
– 4 – SPEC/4/ENVSO/SP�/ENG/TZ0/XX/Q
(Question 1 continued)
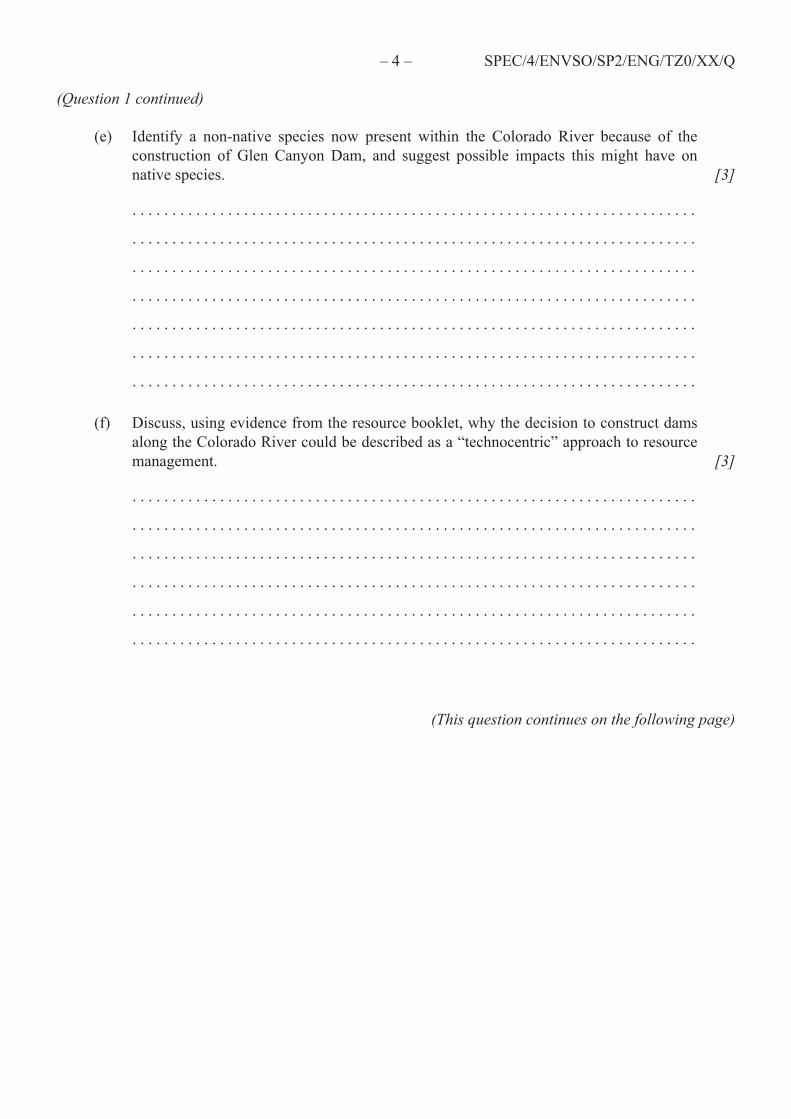
(e) Identify a non-native species now present within the Colorado River because of the construction of Glen Canyon Dam, and suggest possible impacts this might have on native species.
. . . . . . . . . . . . . . . . . . . . . . . . . . . . . . . . . . . . . . . . . . . . . . . . . . . . . . . . . . . . . . . . . . . . . . .
. . . . . . . . . . . . . . . . . . . . . . . . . . . . . . . . . . . . . . . . . . . . . . . . . . . . . . . . . . . . . . . . . . . . . . .
. . . . . . . . . . . . . . . . . . . . . . . . . . . . . . . . . . . . . . . . . . . . . . . . . . . . . . . . . . . . . . . . . . . . . . .
. . . . . . . . . . . . . . . . . . . . . . . . . . . . . . . . . . . . . . . . . . . . . . . . . . . . . . . . . . . . . . . . . . . . . . .
. . . . . . . . . . . . . . . . . . . . . . . . . . . . . . . . . . . . . . . . . . . . . . . . . . . . . . . . . . . . . . . . . . . . . . .
. . . . . . . . . . . . . . . . . . . . . . . . . . . . . . . . . . . . . . . . . . . . . . . . . . . . . . . . . . . . . . . . . . . . . . .
. . . . . . . . . . . . . . . . . . . . . . . . . . . . . . . . . . . . . . . . . . . . . . . . . . . . . . . . . . . . . . . . . . . . . . .
[3]
(f) Discuss, using evidence from the resource booklet, why the decision to construct dams along the Colorado River could be described as a “technocentric” approach to resource management.
. . . . . . . . . . . . . . . . . . . . . . . . . . . . . . . . . . . . . . . . . . . . . . . . . . . . . . . . . . . . . . . . . . . . . . .
. . . . . . . . . . . . . . . . . . . . . . . . . . . . . . . . . . . . . . . . . . . . . . . . . . . . . . . . . . . . . . . . . . . . . . .
. . . . . . . . . . . . . . . . . . . . . . . . . . . . . . . . . . . . . . . . . . . . . . . . . . . . . . . . . . . . . . . . . . . . . . .
. . . . . . . . . . . . . . . . . . . . . . . . . . . . . . . . . . . . . . . . . . . . . . . . . . . . . . . . . . . . . . . . . . . . . . .
. . . . . . . . . . . . . . . . . . . . . . . . . . . . . . . . . . . . . . . . . . . . . . . . . . . . . . . . . . . . . . . . . . . . . . .
. . . . . . . . . . . . . . . . . . . . . . . . . . . . . . . . . . . . . . . . . . . . . . . . . . . . . . . . . . . . . . . . . . . . . . .
[3]
(This question continues on the following page)

– 5 –
turn over
SPEC/4/ENVSO/SP�/ENG/TZ0/XX/Q
(Question 1 continued)
(g) With reference to the checklist for “good” dams in Figure 8 and the information from the resource booklet, justify to what extent you consider Glen Canyon Dam to be a “good” dam.
. . . . . . . . . . . . . . . . . . . . . . . . . . . . . . . . . . . . . . . . . . . . . . . . . . . . . . . . . . . . . . . . . . . . . . .
. . . . . . . . . . . . . . . . . . . . . . . . . . . . . . . . . . . . . . . . . . . . . . . . . . . . . . . . . . . . . . . . . . . . . . .
. . . . . . . . . . . . . . . . . . . . . . . . . . . . . . . . . . . . . . . . . . . . . . . . . . . . . . . . . . . . . . . . . . . . . . .
. . . . . . . . . . . . . . . . . . . . . . . . . . . . . . . . . . . . . . . . . . . . . . . . . . . . . . . . . . . . . . . . . . . . . . .
. . . . . . . . . . . . . . . . . . . . . . . . . . . . . . . . . . . . . . . . . . . . . . . . . . . . . . . . . . . . . . . . . . . . . . .
. . . . . . . . . . . . . . . . . . . . . . . . . . . . . . . . . . . . . . . . . . . . . . . . . . . . . . . . . . . . . . . . . . . . . . .
. . . . . . . . . . . . . . . . . . . . . . . . . . . . . . . . . . . . . . . . . . . . . . . . . . . . . . . . . . . . . . . . . . . . . . .
. . . . . . . . . . . . . . . . . . . . . . . . . . . . . . . . . . . . . . . . . . . . . . . . . . . . . . . . . . . . . . . . . . . . . . .
. . . . . . . . . . . . . . . . . . . . . . . . . . . . . . . . . . . . . . . . . . . . . . . . . . . . . . . . . . . . . . . . . . . . . . .
. . . . . . . . . . . . . . . . . . . . . . . . . . . . . . . . . . . . . . . . . . . . . . . . . . . . . . . . . . . . . . . . . . . . . . .
. . . . . . . . . . . . . . . . . . . . . . . . . . . . . . . . . . . . . . . . . . . . . . . . . . . . . . . . . . . . . . . . . . . . . . .
. . . . . . . . . . . . . . . . . . . . . . . . . . . . . . . . . . . . . . . . . . . . . . . . . . . . . . . . . . . . . . . . . . . . . . .
. . . . . . . . . . . . . . . . . . . . . . . . . . . . . . . . . . . . . . . . . . . . . . . . . . . . . . . . . . . . . . . . . . . . . . .
. . . . . . . . . . . . . . . . . . . . . . . . . . . . . . . . . . . . . . . . . . . . . . . . . . . . . . . . . . . . . . . . . . . . . . .
. . . . . . . . . . . . . . . . . . . . . . . . . . . . . . . . . . . . . . . . . . . . . . . . . . . . . . . . . . . . . . . . . . . . . . .
. . . . . . . . . . . . . . . . . . . . . . . . . . . . . . . . . . . . . . . . . . . . . . . . . . . . . . . . . . . . . . . . . . . . . . .
. . . . . . . . . . . . . . . . . . . . . . . . . . . . . . . . . . . . . . . . . . . . . . . . . . . . . . . . . . . . . . . . . . . . . . .
. . . . . . . . . . . . . . . . . . . . . . . . . . . . . . . . . . . . . . . . . . . . . . . . . . . . . . . . . . . . . . . . . . . . . . .
. . . . . . . . . . . . . . . . . . . . . . . . . . . . . . . . . . . . . . . . . . . . . . . . . . . . . . . . . . . . . . . . . . . . . . .
. . . . . . . . . . . . . . . . . . . . . . . . . . . . . . . . . . . . . . . . . . . . . . . . . . . . . . . . . . . . . . . . . . . . . . .
. . . . . . . . . . . . . . . . . . . . . . . . . . . . . . . . . . . . . . . . . . . . . . . . . . . . . . . . . . . . . . . . . . . . . . .
. . . . . . . . . . . . . . . . . . . . . . . . . . . . . . . . . . . . . . . . . . . . . . . . . . . . . . . . . . . . . . . . . . . . . . .
. . . . . . . . . . . . . . . . . . . . . . . . . . . . . . . . . . . . . . . . . . . . . . . . . . . . . . . . . . . . . . . . . . . . . . .
. . . . . . . . . . . . . . . . . . . . . . . . . . . . . . . . . . . . . . . . . . . . . . . . . . . . . . . . . . . . . . . . . . . . . . .
. . . . . . . . . . . . . . . . . . . . . . . . . . . . . . . . . . . . . . . . . . . . . . . . . . . . . . . . . . . . . . . . . . . . . . .
[6]

– � – SPEC/4/ENVSO/SP�/ENG/TZ0/XX/Q
Section B
Answer two questions. Write your answers on the answer sheets provided. Write your session number on each answer sheet, and attach them to this examination paper and your cover sheet using the tag provided.
Each essay is marked out of [20] of which [2] are for clarity of expression, structure and development of ideas: [0] Quality of expression, structure and development is poor. [1] Quality of expression, structure and development is limited. [2] Quality of expression is clear, structure is good and ideas are well developed.
2. (a) Evaluate the role of socio-cultural factors in the development of different food production systems. [8]
(b) Compare the attitudes towards the natural environment of two named contrasting societies, and discuss the consequences of these attitudes to the way in which natural resources are used. [10]
Expression of ideas [2]
3. (a) Outline the general principles behind the World Conservation Strategy. [4]
(b) Compare and evaluate the role of global and local approaches to environmental problem solving. Support your answer with examples. [8]
(c) Justify the importance of the scientific study of small-scale local ecosystems inenvironmental problem solving. Support your answer with examples. [6]
Expression of ideas [2]
4. (a) Describe the typical features of a climax community. [4]
(b) With reference to a named ecosystem describe the natural and human threats it faces and discuss the consequences for its future equilibrium. [10]
(c) Explain, with the aid of an example, the role of feedback mechanisms in the regulation of ecosystem equilibrium. [4]
Expression of ideas [2]

– � – SPEC/4/ENVSO/SP�/ENG/TZ0/XX/Q
5. (a) Describe some of the contrasting responses to the issue of global warming. [5]
(b) Outline the reasons why people have such different opinions on the issue of global warming. [5]
(c) Describe what is meant by carrying capacity and evaluate the role that technology could play in ensuring that the Earth’s carrying capacity is not exceeded by human populations. [8]
Expression of ideas [2]

9 pages
SPEC/4/ENVSO/SP2/ENG/TZ0/XX/T
SPECIMEN PAPER
ENVIRONMENTAL SYSTEMS AND SOCIETIESSTANDARD LEVELPAPER 2
INSTRUCTIONS TO CANDIDATES
• Do not open this booklet until instructed to do so.• This booklet contains all of the resources required to answer question 1.
2 hours
RESOURCE BOOKLET
© International Baccalaureate Organization 2008
– � – SPEC/4/ENVSO/SP�/ENG/TZ0/XX/T
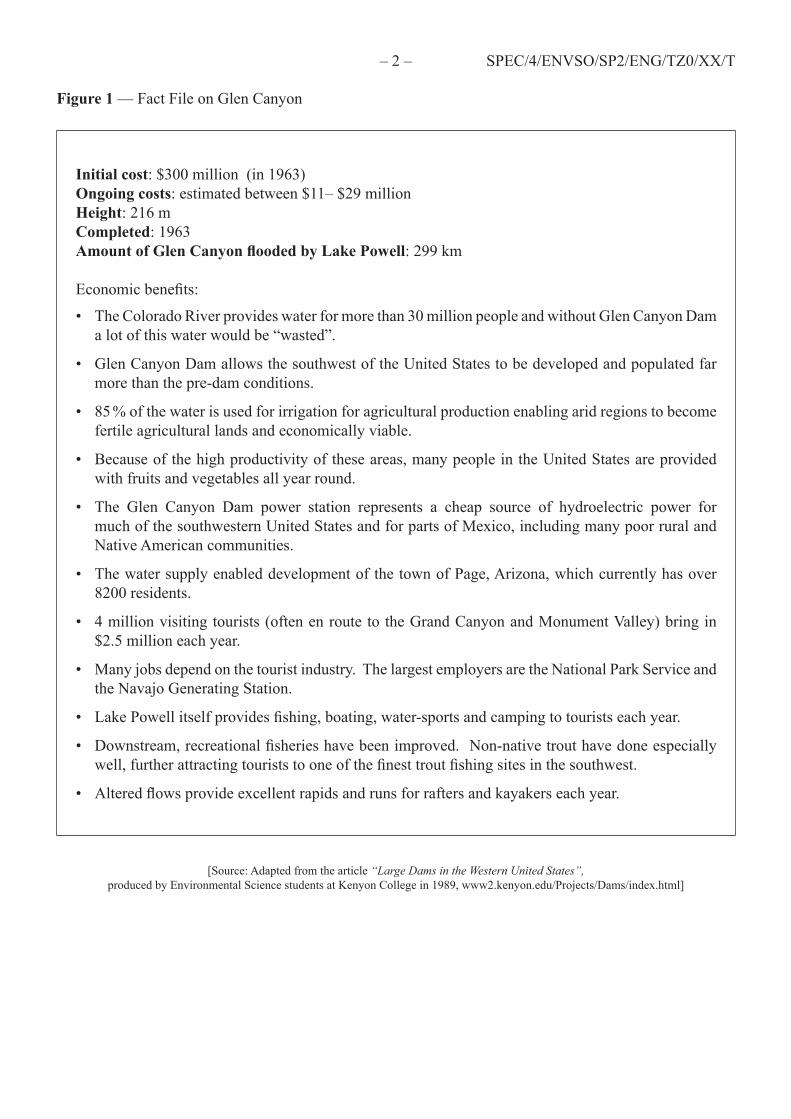
Figure 1 — Fact File on Glen Canyon
Initial cost: $300 million (in 1963)Ongoing costs: estimated between $11– $�9 millionHeight: �16 mCompleted: 1963Amount of Glen Canyon flooded by Lake Powell: �99 km
Economic benefits:
• The Colorado River provides water for more than 30 million people and without Glen Canyon Dam a lot of this water would be “wasted”.
• Glen Canyon Dam allows the southwest of the United States to be developed and populated far more than the pre-dam conditions.
• 85 % of the water is used for irrigation for agricultural production enabling arid regions to become fertile agricultural lands and economically viable.
• Because of the high productivity of these areas, many people in the United States are provided with fruits and vegetables all year round.
• The Glen Canyon Dam power station represents a cheap source of hydroelectric power for much of the southwestern United States and for parts of Mexico, including many poor rural and Native American communities.
• The water supply enabled development of the town of Page, Arizona, which currently has over 8�00 residents.
• 4 million visiting tourists (often en route to the Grand Canyon and Monument Valley) bring in $�.5 million each year.
• Many jobs depend on the tourist industry. The largest employers are the National Park Service and the Navajo Generating Station.
• Lake Powell itself provides fishing, boating, water-sports and camping to tourists each year.
• Downstream, recreational fisheries have been improved. Non-native trout have done especially well, further attracting tourists to one of the finest trout fishing sites in the southwest.
• Altered flows provide excellent rapids and runs for rafters and kayakers each year.
[Source: Adapted from the article “Large Dams in the Western United States”,produced by Environmental Science students at Kenyon College in 1989, www�.kenyon.edu/Projects/Dams/index.html]
– 3 –
Turn over
SPEC/4/ENVSO/SP�/ENG/TZ0/XX/T
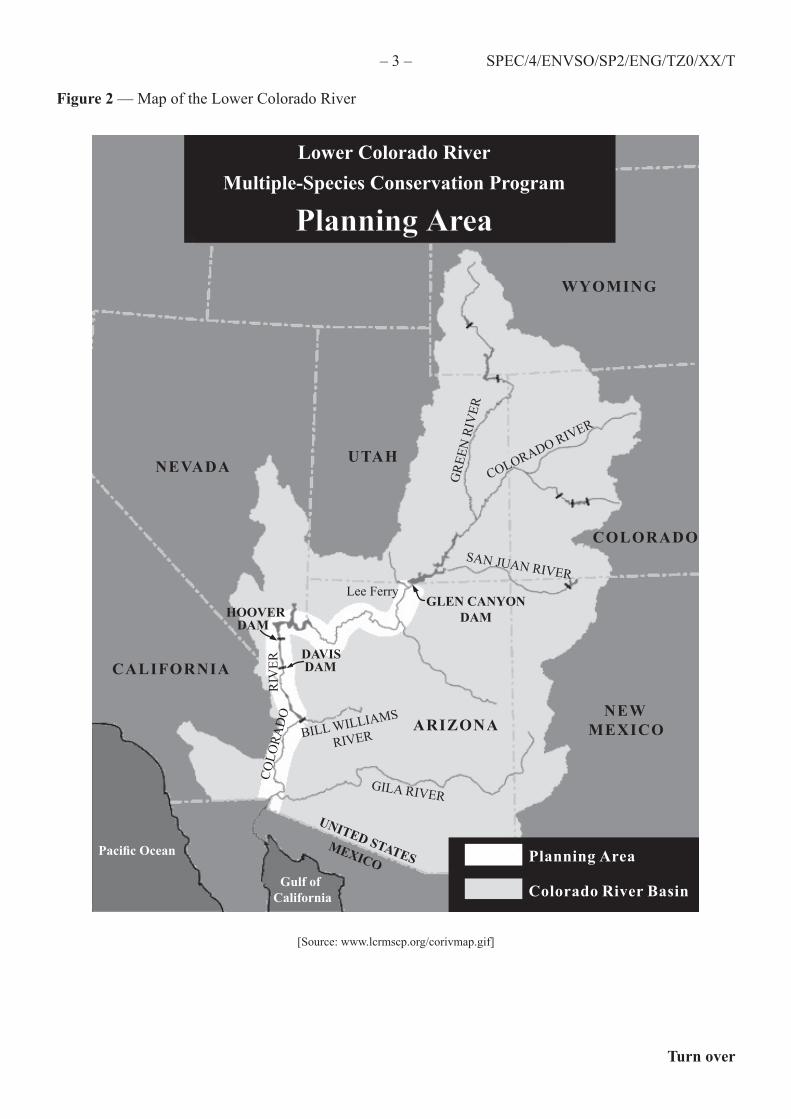
Figure 2 — Map of the Lower Colorado River
Lower Colorado RiverMultiple-Species Conservation Program
Planning Area
WYOMING
COLORADO
UTAHNEVADA
CALIFORNIA
NEWMEXICOARIZONA
COLORADO RIVER
GRE
EN R
IVER
SAN JUAN RIVER
GLEN CANYONDAM
Planning Area
Colorado River Basin
GILA RIVER
Lee FerryHOOVER
DAM
DAVISDAM
BILL WILLIAMS
RIVER
UNITED STATESMEXICO
Gulf ofCalifornia
Pacific Ocean
COLO
RAD
OR
IVER
[Source: www.lcrmscp.org/corivmap.gif]
– 4 – SPEC/4/ENVSO/SP�/ENG/TZ0/XX/T
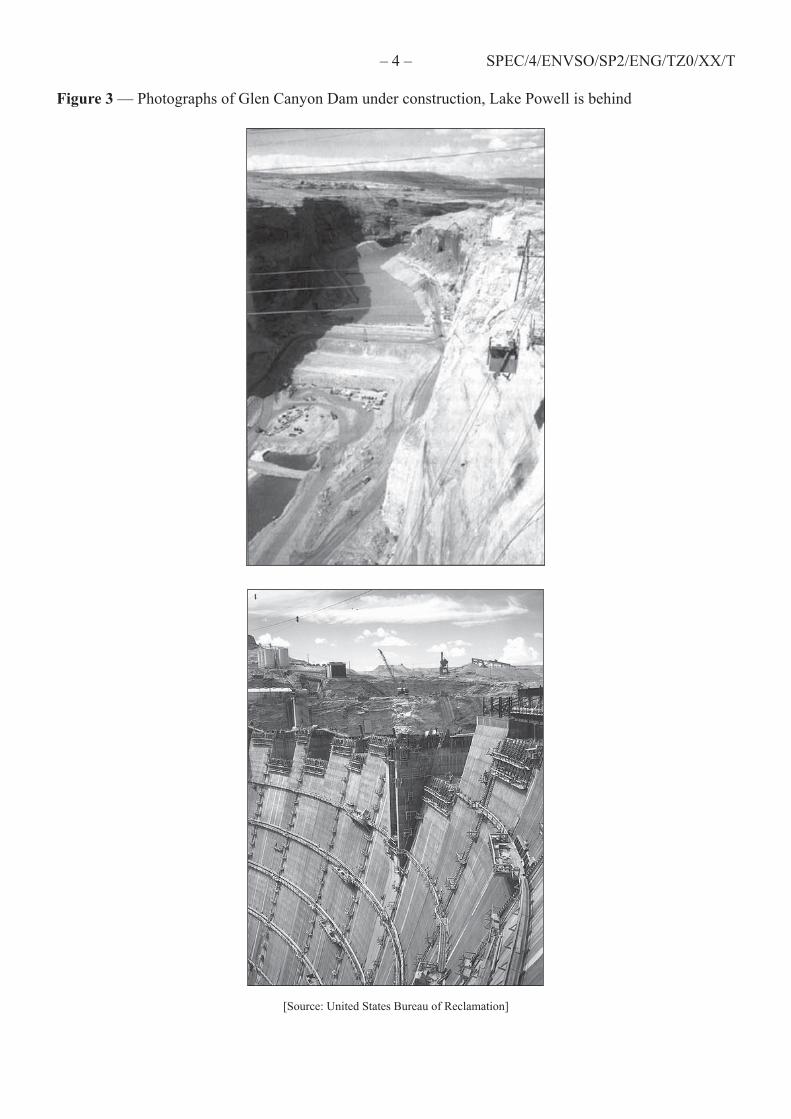
Figure 3 — Photographs of Glen Canyon Dam under construction, Lake Powell is behind
[Source: United States Bureau of Reclamation]
– 5 –
Turn over
SPEC/4/ENVSO/SP�/ENG/TZ0/XX/T
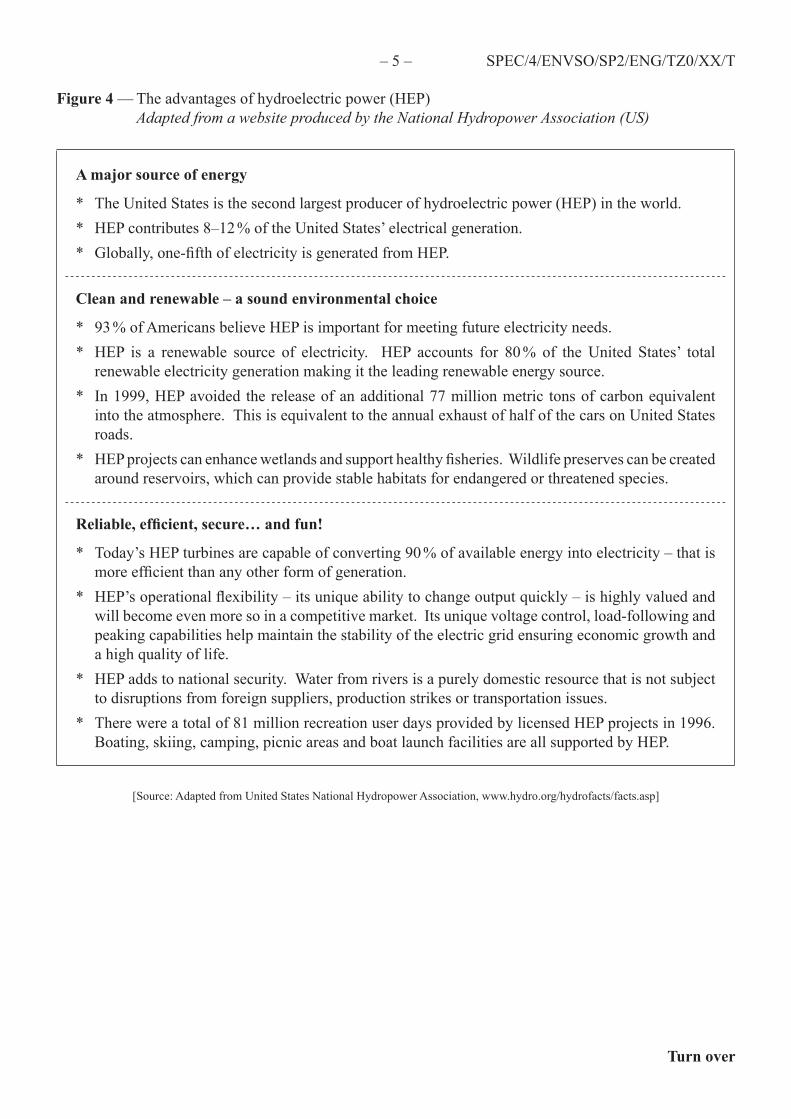
Figure 4 — The advantages of hydroelectric power (HEP) Adapted from a website produced by the National Hydropower Association (US)
A major source of energy
* The United States is the second largest producer of hydroelectric power (HEP) in the world.* HEP contributes 8–1� % of the United States’ electrical generation.* Globally, one-fifth of electricity is generated from HEP.
Clean and renewable – a sound environmental choice
* 93 % of Americans believe HEP is important for meeting future electricity needs.* HEP is a renewable source of electricity. HEP accounts for 80 % of the United States’ total
renewable electricity generation making it the leading renewable energy source.* In 1999, HEP avoided the release of an additional 77 million metric tons of carbon equivalent
into the atmosphere. This is equivalent to the annual exhaust of half of the cars on United States roads.
* HEP projects can enhance wetlands and support healthy fisheries. Wildlife preserves can be created around reservoirs, which can provide stable habitats for endangered or threatened species.
Reliable, efficient, secure… and fun!
* Today’s HEP turbines are capable of converting 90 % of available energy into electricity – that is more efficient than any other form of generation.
* HEP’s operational flexibility – its unique ability to change output quickly – is highly valued and will become even more so in a competitive market. Its unique voltage control, load-following and peaking capabilities help maintain the stability of the electric grid ensuring economic growth and a high quality of life.
* HEP adds to national security. Water from rivers is a purely domestic resource that is not subject to disruptions from foreign suppliers, production strikes or transportation issues.
* There were a total of 81 million recreation user days provided by licensed HEP projects in 1996. Boating, skiing, camping, picnic areas and boat launch facilities are all supported by HEP.
[Source: Adapted from United States National Hydropower Association, www.hydro.org/hydrofacts/facts.asp]
– 6 – SPEC/4/ENVSO/SP�/ENG/TZ0/XX/T
Figure 5 — Historical water discharge and suspended sediment discharge trends as a result of the construction of dams along the Colorado River (including Glen Canyon Dam)
Discharge / m3×109
40
30
�0
10
(a) Water discharge
1910 19�0 1930 1940 1950 1960 1970 Year
Discharge / kg×109
40
30
�0
10
(b) Suspended sediment discharge
1910 19�0 1930 1940 1950 1960 1970 Year
[Source: The United States Geological Survey in Schwarz et al., (1991),published in Goudie, The Human Impact on the Natural Environment, Blackwell, 1993, page 18�]
– 7 –
Turn over
SPEC/4/ENVSO/SP�/ENG/TZ0/XX/T
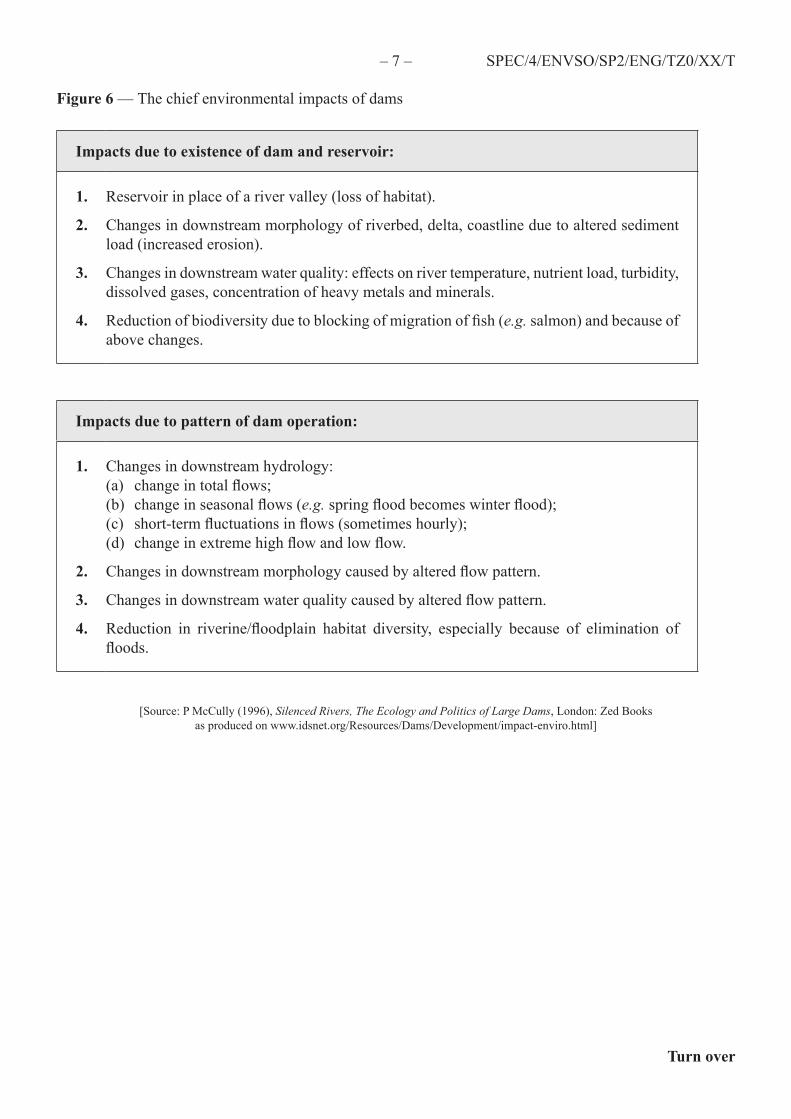
Figure 6 — The chief environmental impacts of dams
Impacts due to existence of dam and reservoir:
1. Reservoir in place of a river valley (loss of habitat).
2. Changes in downstream morphology of riverbed, delta, coastline due to altered sediment load (increased erosion).
3. Changes in downstream water quality: effects on river temperature, nutrient load, turbidity, dissolved gases, concentration of heavy metals and minerals.
4. Reduction of biodiversity due to blocking of migration of fish (e.g. salmon) and because of above changes.
Impacts due to pattern of dam operation:
1. Changes in downstream hydrology: (a) change in total flows; (b) change in seasonal flows (e.g. spring flood becomes winter flood); (c) short-term fluctuations in flows (sometimes hourly); (d) change in extreme high flow and low flow.
2. Changes in downstream morphology caused by altered flow pattern.
3. Changes in downstream water quality caused by altered flow pattern.
4. Reduction in riverine/floodplain habitat diversity, especially because of elimination of floods.
[Source: P McCully (1996), Silenced Rivers, The Ecology and Politics of Large Dams, London: Zed Booksas produced on www.idsnet.org/Resources/Dams/Development/impact-enviro.html]
– 8 – SPEC/4/ENVSO/SP�/ENG/TZ0/XX/T
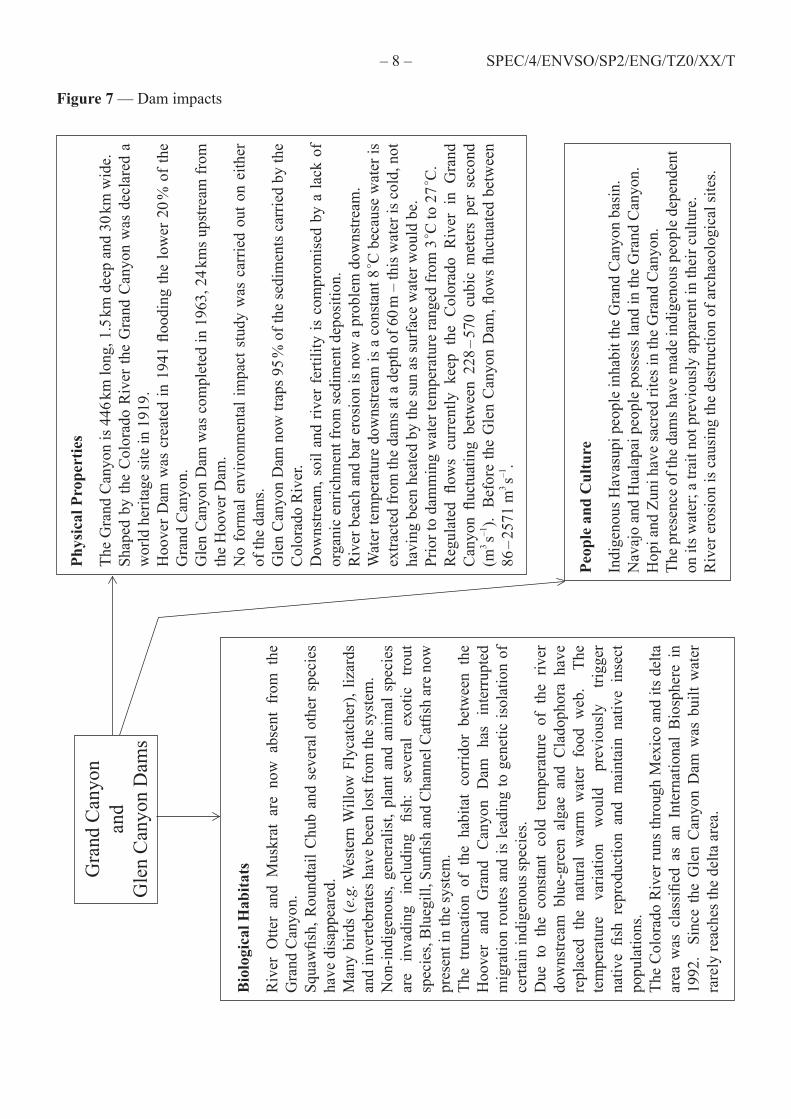
Figure 7 — Dam impactsPh
ysic
al P
rope
rtie
s
The
Gra
nd C
anyo
n is
446
km lo
ng, 1
.5 km
dee
p an
d 30
km w
ide.
Shap
ed b
y th
e C
olor
ado
Riv
er th
e G
rand
Can
yon
was
dec
lare
d a
wor
ld h
erita
ge si
te in
191
9.H
oove
r Dam
was
cre
ated
in 1
941
flood
ing
the
low
er 2
0 % o
f the
G
rand
Can
yon.
Gle
n C
anyo
n D
am w
as c
ompl
eted
in 1
963,
�4 k
ms u
pstre
am fr
om
the
Hoo
ver D
am.
No
form
al e
nviro
nmen
tal i
mpa
ct s
tudy
was
car
ried
out o
n ei
ther
of
the
dam
s.G
len
Can
yon
Dam
now
trap
s 95 %
of t
he se
dim
ents
car
ried
by th
e C
olor
ado
Riv
er.
Dow
nstre
am, s
oil a
nd r
iver
fer
tility
is c
ompr
omis
ed b
y a
lack
of
orga
nic
enric
hmen
t fro
m se
dim
ent d
epos
ition
.R
iver
bea
ch a
nd b
ar e
rosi
on is
now
a p
robl
em d
owns
tream
.W
ater
tem
pera
ture
dow
nstre
am is
a c
onst
ant 8
° C b
ecau
se w
ater
is
extra
cted
from
the
dam
s at a
dep
th o
f 60 m
– th
is w
ater
is c
old,
not
ha
ving
bee
n he
ated
by
the
sun
as su
rfac
e w
ater
wou
ld b
e.Pr
ior t
o da
mm
ing
wat
er te
mpe
ratu
re ra
nged
from
3 ° C
to �
7 °C.
Reg
ulat
ed fl
ows
curr
ently
kee
p th
e C
olor
ado
Riv
er i
n G
rand
C
anyo
n flu
ctua
ting
betw
een
228 –
570
cubi
c m
eter
s pe
r se
cond
(m
3 s–1).
Bef
ore
the
Gle
n C
anyo
n D
am, fl
ows
fluct
uate
d be
twee
n 86
– �5
71 m
3 s–1.
Peop
le a
nd C
ultu
re
Indi
geno
us H
avas
upi p
eopl
e in
habi
t the
Gra
nd C
anyo
n ba
sin.
Nav
ajo
and
Hua
lapa
i peo
ple
poss
ess l
and
in th
e G
rand
Can
yon.
Hop
i and
Zun
i hav
e sa
cred
rite
s in
the
Gra
nd C
anyo
n.Th
e pr
esen
ce o
f the
dam
s hav
e m
ade
indi
geno
us p
eopl
e de
pend
ent
on it
s wat
er; a
trai
t not
pre
viou
sly
appa
rent
in th
eir c
ultu
re.
Riv
er e
rosi
on is
cau
sing
the
dest
ruct
ion
of a
rcha
eolo
gica
l site
s.
Gra
nd C
anyo
nan
dG
len
Can
yon
Dam
s
Bio
logi
cal H
abita
ts
Riv
er O
tter
and
Mus
krat
are
now
abs
ent
from
the
G
rand
Can
yon.
Squa
wfis
h, R
ound
tail
Chu
b an
d se
vera
l oth
er s
peci
es
have
dis
appe
ared
.M
any
bird
s (e
.g. W
este
rn W
illow
Fly
catc
her)
, liz
ards
an
d in
verte
brat
es h
ave
been
lost
from
the
syst
em.
Non
-indi
geno
us, g
ener
alis
t, pl
ant a
nd a
nim
al s
peci
es
are
inva
ding
in
clud
ing
fish:
se
vera
l ex
otic
tro
ut
spec
ies,
Blu
egill
, Sun
fish
and
Cha
nnel
Cat
fish
are
now
pr
esen
t in
the
syst
em.
The
trunc
atio
n of
the
hab
itat
corr
idor
bet
wee
n th
e H
oove
r an
d G
rand
C
anyo
n D
am
has
inte
rrup
ted
mig
ratio
n ro
utes
and
is le
adin
g to
gen
etic
isol
atio
n of
ce
rtain
indi
geno
us sp
ecie
s.D
ue t
o th
e co
nsta
nt c
old
tem
pera
ture
of
the
river
do
wns
tream
blu
e-gr
een
alga
e an
d C
lado
phor
a ha
ve
repl
aced
the
nat
ural
war
m w
ater
foo
d w
eb.
The
te
mpe
ratu
re
varia
tion
wou
ld
prev
ious
ly
trigg
er
nativ
e fis
h re
prod
uctio
n an
d m
aint
ain
nativ
e in
sect
po
pula
tions
.Th
e C
olor
ado
Riv
er ru
ns th
roug
h M
exic
o an
d its
del
ta
area
was
cla
ssifi
ed a
s an
Int
erna
tiona
l B
iosp
here
in
199�
. Si
nce
the
Gle
n C
anyo
n D
am w
as b
uilt
wat
er
rare
ly re
ache
s the
del
ta a
rea.
– 9 – SPEC/4/ENVSO/SP�/ENG/TZ0/XX/T
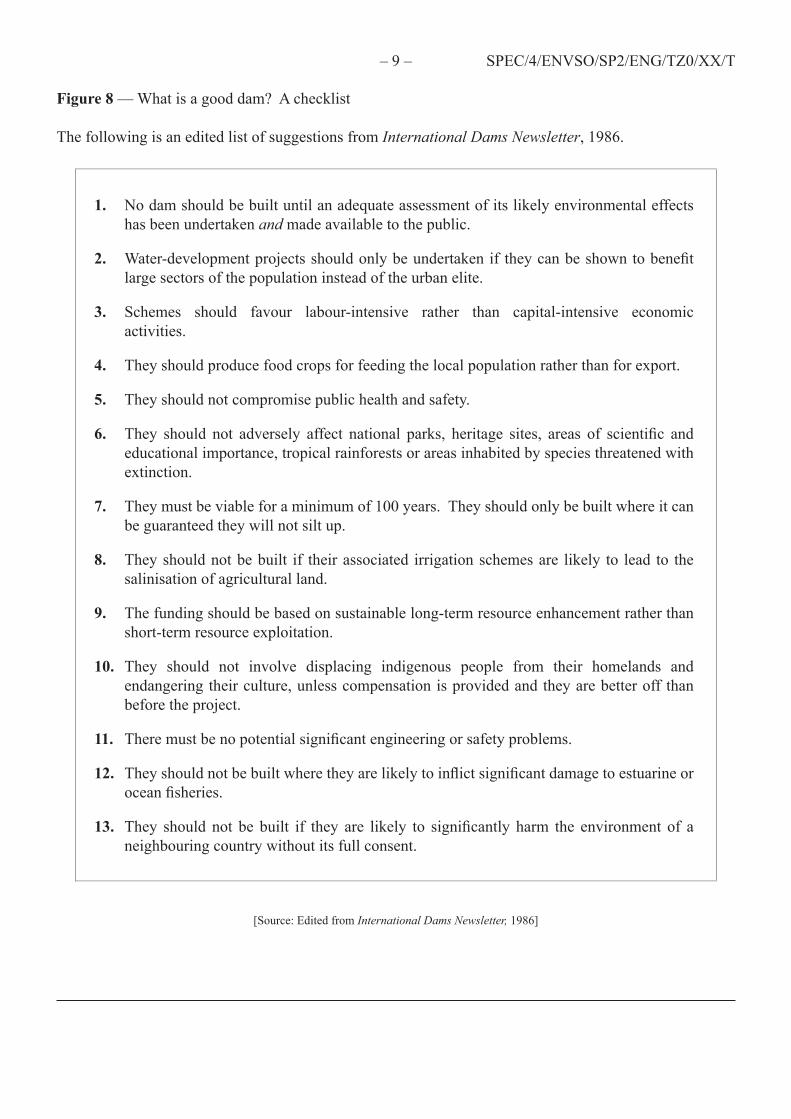
Figure 8 — What is a good dam? A checklist
The following is an edited list of suggestions from International Dams Newsletter, 1986.
1. No dam should be built until an adequate assessment of its likely environmental effects has been undertaken and made available to the public.
2. Water-development projects should only be undertaken if they can be shown to benefit large sectors of the population instead of the urban elite.
3. Schemes should favour labour-intensive rather than capital-intensive economic activities.
4. They should produce food crops for feeding the local population rather than for export.
5. They should not compromise public health and safety.
6. They should not adversely affect national parks, heritage sites, areas of scientific and educational importance, tropical rainforests or areas inhabited by species threatened with extinction.
7. They must be viable for a minimum of 100 years. They should only be built where it can be guaranteed they will not silt up.
8. They should not be built if their associated irrigation schemes are likely to lead to the salinisation of agricultural land.
9. The funding should be based on sustainable long-term resource enhancement rather than short-term resource exploitation.
10. They should not involve displacing indigenous people from their homelands and endangering their culture, unless compensation is provided and they are better off than before the project.
11. There must be no potential significant engineering or safety problems.
12. They should not be built where they are likely to inflict significant damage to estuarine or ocean fisheries.
13. They should not be built if they are likely to significantly harm the environment of a neighbouring country without its full consent.
[Source: Edited from International Dams Newsletter, 1986]


SPEC/4/ENVSO/SP2/ENG/TZ0/XX/M
12 pages
MARKSCHEME
SPECIMEN PAPER
ENVIRONMENTAL SYSTEMS AND SOCIETIES
Standard Level
Paper 2
– 2 – SPEC/4/ENVSO/SP2/ENG/TZ0/XX/M
SECTION A
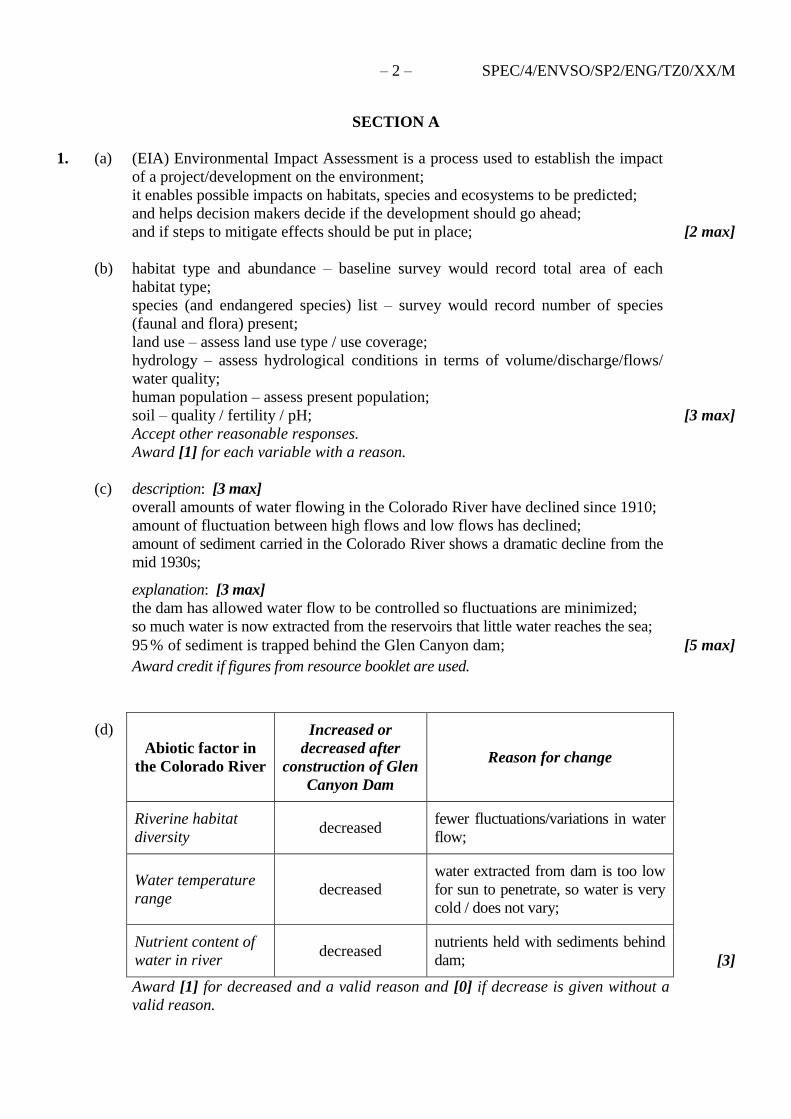
1. (a) (EIA) Environmental Impact Assessment is a process used to establish the impact
of a project/development on the environment;
it enables possible impacts on habitats, species and ecosystems to be predicted;
and helps decision makers decide if the development should go ahead;
and if steps to mitigate effects should be put in place; [2 max]
(b) habitat type and abundance – baseline survey would record total area of each
habitat type;
species (and endangered species) list – survey would record number of species
(faunal and flora) present;
land use – assess land use type / use coverage;
hydrology – assess hydrological conditions in terms of volume/discharge/flows/
water quality;
human population – assess present population;
soil – quality / fertility / pH; [3 max]
Accept other reasonable responses.
Award [1] for each variable with a reason.
(c) description: [3 max]
overall amounts of water flowing in the Colorado River have declined since 1910;
amount of fluctuation between high flows and low flows has declined;
amount of sediment carried in the Colorado River shows a dramatic decline from the
mid 1930s; explanation: [3 max]
the dam has allowed water flow to be controlled so fluctuations are minimized;
so much water is now extracted from the reservoirs that little water reaches the sea;
95 % of sediment is trapped behind the Glen Canyon dam; [5 max]
Award credit if figures from resource booklet are used.
(d)
Abiotic factor in
the Colorado River
Increased or
decreased after
construction of Glen
Canyon Dam
Reason for change
Riverine habitat
diversity decreased
fewer fluctuations/variations in water
flow;
Water temperature
range decreased
water extracted from dam is too low
for sun to penetrate, so water is very
cold / does not vary;
Nutrient content of
water in river decreased
nutrients held with sediments behind
dam;
[3]
Award [1] for decreased and a valid reason and [0] if decrease is given without a
valid reason.
– 3 – SPEC/4/ENVSO/SP2/ENG/TZ0/XX/M
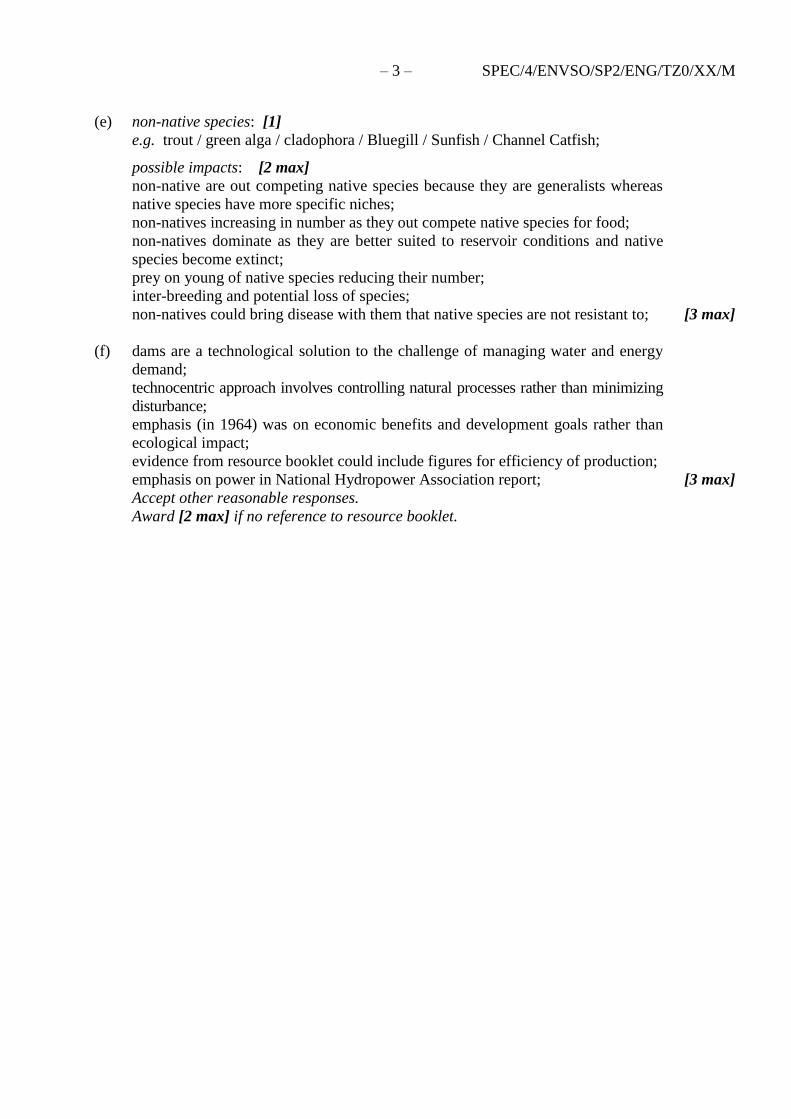
(e) non-native species: [1]
e.g. trout / green alga / cladophora / Bluegill / Sunfish / Channel Catfish; possible impacts: [2 max]
non-native are out competing native species because they are generalists whereas
native species have more specific niches;
non-natives increasing in number as they out compete native species for food;
non-natives dominate as they are better suited to reservoir conditions and native
species become extinct;
prey on young of native species reducing their number;
inter-breeding and potential loss of species;
non-natives could bring disease with them that native species are not resistant to; [3 max]
(f) dams are a technological solution to the challenge of managing water and energy
demand;
technocentric approach involves controlling natural processes rather than minimizing
disturbance;
emphasis (in 1964) was on economic benefits and development goals rather than
ecological impact;
evidence from resource booklet could include figures for efficiency of production;
emphasis on power in National Hydropower Association report; [3 max]
Accept other reasonable responses.
Award [2 max] if no reference to resource booklet.

– 4 – SPEC/4/ENVSO/SP2/ENG/TZ0/XX/M
(g) There must be some discussion of both sides to achieve [6 max] but answers can
be weighted heavily towards one side or another. not a “good” dam because:
no environmental assessment was carried out prior to construction (point 1);
the dam was constructed in a national park and adversely affected areas of scientific
importance (World Heritage Site) (point 6);
and has caused native species to become extinct/endangered e.g. Southwestern
Willow Flycatcher (point 6);
culture of indigenous people has been threatened e.g. Rainbow Bridge;
knock on effects on Mexico (point 13) and impact on delta may have had an impact
on fisheries (point 12);
possible that Lake Powell will silt up – all sediment trapped see figure 4 showing
dramatic drop in sediment after dams constructed (point 7); a “good” dam because:
large sectors of population have benefited from water supply and electricity (point 2);
often poorest communities (rural, indigenous, Mexican) who have benefited (point 2);
economic activities such as farming and tourism can be labour intensive and lots
of jobs are provided (point 3);
fruit and vegetables are provided for domestic economy (point 4);
no evidence from the resource booklet that there are safety or health issues (point 5
or 11);
long-term water and energy demand can be met by this because HEP is a
renewable resource (point 9);
indigenous people have benefited from water and electricity (point 10);
Mexico benefits from the electricity – presumably it gave its consent for the dam
to be built? (point 13); [6 max]
Award [4 max] if advantages and disadvantages of dam are merely listed with no
reference to the checklist.
– 5 – SPEC/4/ENVSO/SP2/ENG/TZ0/XX/M
SECTION B
General Essay Markscheme
Each essay is marked out of [20] of which [2] are for clarity of expression, structure and
development of ideas. [0] Quality of expression, structure and development is poor.
[1] Quality of expression, structure and development is limited.
[2] Quality of expression is clear, structure is good and ideas are well developed.
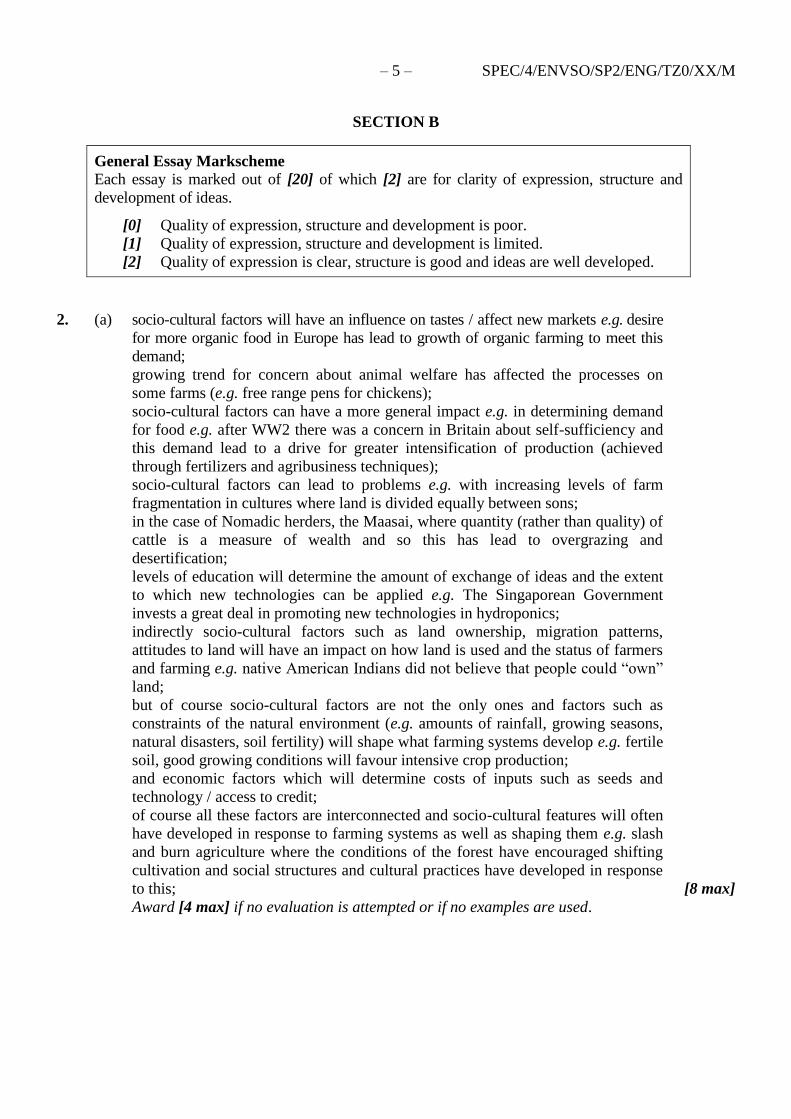
2. (a) socio-cultural factors will have an influence on tastes / affect new markets e.g. desire
for more organic food in Europe has lead to growth of organic farming to meet this
demand;
growing trend for concern about animal welfare has affected the processes on
some farms (e.g. free range pens for chickens);
socio-cultural factors can have a more general impact e.g. in determining demand
for food e.g. after WW2 there was a concern in Britain about self-sufficiency and
this demand lead to a drive for greater intensification of production (achieved
through fertilizers and agribusiness techniques);
socio-cultural factors can lead to problems e.g. with increasing levels of farm
fragmentation in cultures where land is divided equally between sons;
in the case of Nomadic herders, the Maasai, where quantity (rather than quality) of
cattle is a measure of wealth and so this has lead to overgrazing and
desertification;
levels of education will determine the amount of exchange of ideas and the extent
to which new technologies can be applied e.g. The Singaporean Government
invests a great deal in promoting new technologies in hydroponics;
indirectly socio-cultural factors such as land ownership, migration patterns,
attitudes to land will have an impact on how land is used and the status of farmers
and farming e.g. native American Indians did not believe that people could “own”
land;
but of course socio-cultural factors are not the only ones and factors such as
constraints of the natural environment (e.g. amounts of rainfall, growing seasons,
natural disasters, soil fertility) will shape what farming systems develop e.g. fertile
soil, good growing conditions will favour intensive crop production;
and economic factors which will determine costs of inputs such as seeds and
technology / access to credit;
of course all these factors are interconnected and socio-cultural features will often
have developed in response to farming systems as well as shaping them e.g. slash
and burn agriculture where the conditions of the forest have encouraged shifting
cultivation and social structures and cultural practices have developed in response
to this; [8 max]
Award [4 max] if no evaluation is attempted or if no examples are used.
– 6 – SPEC/4/ENVSO/SP2/ENG/TZ0/XX/M
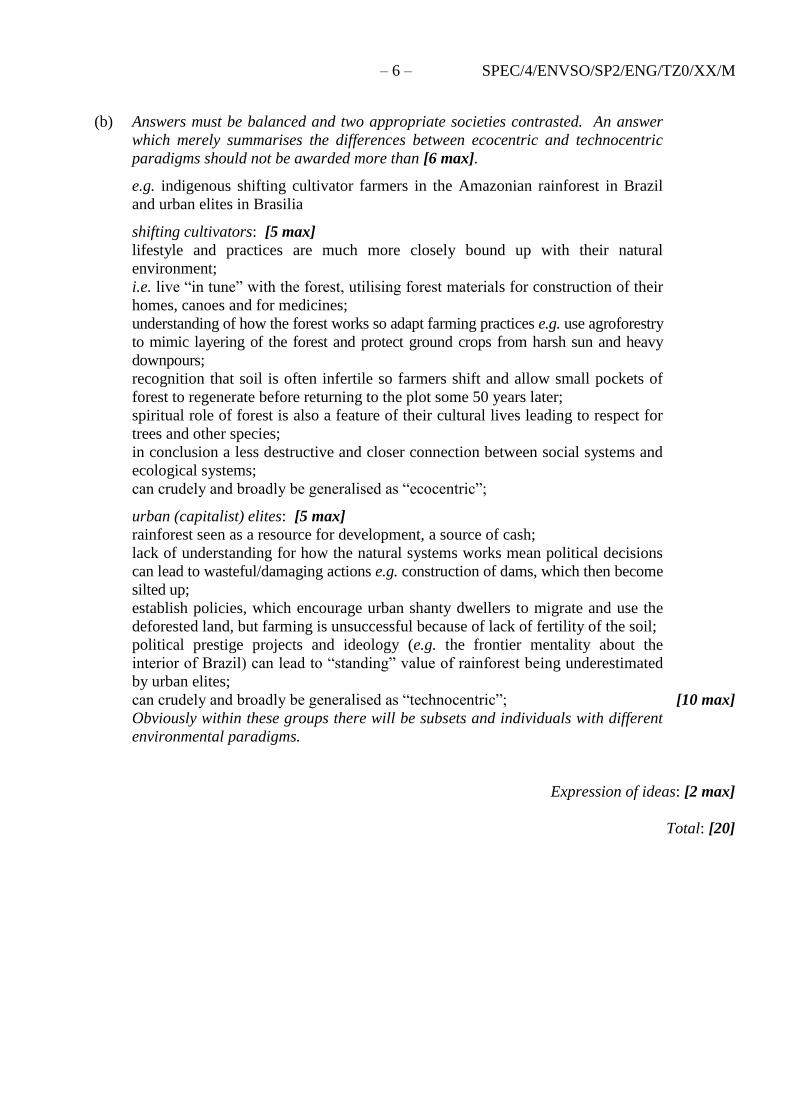
(b) Answers must be balanced and two appropriate societies contrasted. An answer
which merely summarises the differences between ecocentric and technocentric
paradigms should not be awarded more than [6 max].
e.g. indigenous shifting cultivator farmers in the Amazonian rainforest in Brazil
and urban elites in Brasilia shifting cultivators: [5 max]
lifestyle and practices are much more closely bound up with their natural
environment;
i.e. live “in tune” with the forest, utilising forest materials for construction of their
homes, canoes and for medicines;
understanding of how the forest works so adapt farming practices e.g. use agroforestry
to mimic layering of the forest and protect ground crops from harsh sun and heavy
downpours;
recognition that soil is often infertile so farmers shift and allow small pockets of
forest to regenerate before returning to the plot some 50 years later;
spiritual role of forest is also a feature of their cultural lives leading to respect for
trees and other species;
in conclusion a less destructive and closer connection between social systems and
ecological systems;
can crudely and broadly be generalised as “ecocentric”; urban (capitalist) elites: [5 max]
rainforest seen as a resource for development, a source of cash;
lack of understanding for how the natural systems works mean political decisions
can lead to wasteful/damaging actions e.g. construction of dams, which then become
silted up;
establish policies, which encourage urban shanty dwellers to migrate and use the
deforested land, but farming is unsuccessful because of lack of fertility of the soil;
political prestige projects and ideology (e.g. the frontier mentality about the
interior of Brazil) can lead to “standing” value of rainforest being underestimated
by urban elites;
can crudely and broadly be generalised as “technocentric”; [10 max]
Obviously within these groups there will be subsets and individuals with different
environmental paradigms.
Expression of ideas: [2 max]
Total: [20]
– 7 – SPEC/4/ENVSO/SP2/ENG/TZ0/XX/M
3. (a) established in 1980 by the World Conservation Union (IUCN), who are concerned with
importance of conservation of resources for sustainable economic development;
it consisted of three factors:
1. maintaining ecological processes;
2. preserving genetic diversity;
3. and utilizing species and ecosystems in a sustainable fashion;
the strategy outlined a series of global priorities for action;
and recommended that each country prepare its own national strategy as a
developing plan that would take into account the conservation of natural resources
for long-term human welfare;
it drew attention to a fundamental issue: the importance of making the users of
natural resources become their guardians;
without the support and understanding of the local community, those whose lives
are most closely dependent upon the careful management of natural resources, the
strategies cannot succeed; [4 max]
(b) some environmental problems are global in terms of the scale of the effects rather
than local, so international cooperation in addressing them makes sense;
e.g. global warming is going to have far reaching global impacts so a united
response to monitoring and mitigation is more likely to be effective;
international agreements can help to motivate governments to take action and
honour their commitments e.g. to cut CO2 emissions / Montreal protocol, rather
than burying their head in the sand about an issue;
international organisations e.g. UNEP have the resources to mobilise and coordinate
action in environmental research, when individual nations, especially LEDCs, might
not have access to funds/expertise;
when problems cross borders e.g. smuggling of endangered species, international
cooperation is vital (CITES);
however, local solutions have a valuable role to play e.g. often problems are caused
at local scale, so local people should be involved in addressing the problem, the
World Conservation Strategy recognises this;
often the motivation for addressing problems starts at the local level e.g. when
individuals feel passionately about an issue;
some issues e.g. recycling and landfill are local issues so a global strategy would
be cumbersome, bureaucratic and inappropriate; [8 max]
Award [5 max] if no examples are used.
– 8 – SPEC/4/ENVSO/SP2/ENG/TZ0/XX/M
(c) small scale studies allow for in-depth detailed investigations;
understanding processes and interconnectedness at a local level is vital if threats to
that ecosystem are to be effectively mitigated e.g. understanding relationship
between two interdependent species will enable you to predict what will happen if
one of them becomes extinct;
on a practical level, scientists have to be able to undertake studies at a manageable
level i.e. by investigating specific hypotheses, e.g. you could not design a research
programme that was just going to investigate “oceans”;
for groups lobbying about a particular environmental issue, their concerns will not
be taken seriously unless grounded in rigorous fieldwork and fact;
this is one of the problems with conflicting evidence on the issue of global warming;
similarly for political decisions to be taken there needs to be a body of evidence
and understanding on which these decisions are based;
lots of studies of small-scale ecosystems form jigsaw pieces in a bigger picture of
how larger scale ecosystems e.g. biomes are being affected by human actions;
studying small-scale ecosystems enables environmental change e.g. in response to
pollutants, to be monitored over time;
these studies can inform human actions to ensure that practices change in the right
way to mitigate the problem e.g. studies of consequences of applying lime to acidified
lakes; [6 max]
Accept other reasonable responses.
Expression of ideas: [2 max]
Total: [20]
– 9 – SPEC/4/ENVSO/SP2/ENG/TZ0/XX/M
4. (a) greater biomass;
higher levels of species diversity;
soil conditions are more favourable e.g. with greater organic content;
better soil structure / greater water retention;
lower pH;
plant species will be taller and longer living;
more K-strategists / few r-strategists;
greater community complexity and stability/equilibrium;
greater habitat diversity; [4 max]
(b) e.g. Great Barrier Reef off the coast of Queensland, Australia human threats: [4 max]
such as tourism, coral very fragile and easily damaged by divers’ fins / touching
coral / breaking bits off for souvenirs;
over fishing can disrupt the balance of species in the food chain;
inadvertent damage from anchors and pollution from boats;
run-off of fertilisers from sugar plantations on the coast;
sewage and pollution from coastal settlements such as Cairns can lead to excessive
nutrients and algal blooms;
increased sedimentation due to deforestation of mangroves to make space for
tourist developments make water cloudy reducing productivity;
disrupting the interdependence of coral ecosystem with sea grass beds and mangrove
ecosystems;
global warming increases sea temperatures leading to coral bleaching; natural threats: [4 max]
all of these make coral more vulnerable to natural threats such as disease;
natural predators e.g. crown of thorns starfish;
structural damage from storms/cyclones;
increased sea temperatures due to El Niño;
can lead to coral bleaching;
which has knock on effects on the fish species who depend on the reef for food,
protection and nurseries for young; consequences: [3 max]
coral reefs are able to withstand some threats but the collective effect of human
and natural processes can lead to damage of the reef and species, which depend on
it, and the breakdown of the ecosystem;
when the “critical threshold is reached” (when even if threats stop ecosystem will
not recover);
loss of biodiversity;
the valuable role that the ecosystem provides e.g. in conjunction with mangroves
sea grass beds as a line of coastal defence;
as an economic resource; [10 max]
– 10 – SPEC/4/ENVSO/SP2/ENG/TZ0/XX/M
(c) Award credit if diagram is used to illustrate the concept of negative feedback.
feedback is the return of part of the output from a system as input, so as to affect
succeeding outputs;
positive feedback tends to amplify/increase change;
negative feedback on the other hand tends to damp down/neutralise any deviation
from an equilibrium and promote stability;
it is negative feedback therefore which leads to the regulation of equilibrium
within ecosystems;
e.g. effect of a storm on a rainforest – high winds blow down a tree, leaving a gap
in the canopy, this lets in more light, encouraging new growth;
rates of growth are rapid as light levels are high, so new saplings compete to take
place of old tree in the canopy and equilibrium is restored; [4 max]
A range of possible examples may be used.
Award [2 max] if no example used.
Expression of ideas: [2 max]
Total: [20]
– 11 – SPEC/4/ENVSO/SP2/ENG/TZ0/XX/M
5. (a) some politicians believe action should be taken immediately by all nations to curb
emissions of 2CO ;
to change lifestyles and plan to reduce fossil fuel dependence;
whereas others argue that it is unreasonable to expect LEDCs to curb emissions
until they have developed economically like the MEDCs have done;
most scientists are now convinced that there is a causal link between 2CO levels
and global temperature change;
whereas some scientists argue that relationships are more complex and that the
effects of global warming are unclear;
even that recent temperature changes are merely parts of natural fluctuations in the
earth’s temperature;
some ordinary citizens feel they have a responsibility to change the way in which
they live to reduce their personal contribution to the problem;
others do not believe that actions at an individual level can make much difference;
others do not prioritise environmental issues including global warming;
responses by organisms rather than people, migration / extinction / adoption; [5 max]
(b) opinions will depend to a large extent on what scientific evidence they find most
convincing;
this will depend on their specialised knowledge and their level of education;
overall awareness of the issue, which can also depend on the profile of environmental
issues in the media;
environmental paradigms can shape how they read scientific literature;
their attitudes to our relationship with the environment (e.g. whether we should
live in harmony with it or control it using technology);
environmental paradigms will stem from cultural context including prevailing
religious attitudes (e.g. whether we have any moral obligation to future generations);
the growth of the environmental movement (which has grown exponentially in
profile and influence) has played a large role in raising awareness of the issue;
cultural / religious group e.g. Allah is in control;
where people live might affect their views e.g. near the sea;
socio-economic status e.g. extreme poverty leads to short-term view / wealth leads to
faith in money to solve problem;
age e.g. young more concerned than old; [5 max]
Accept other reasonable responses.
– 12 – SPEC/4/ENVSO/SP2/ENG/TZ0/XX/M
(c) carrying capacity is the maximum number of species that can be sustainably supported
by a given environment;
it is determined by availability of resources (e.g. food, water, space) to the population
in an area;
a country is said to be overpopulated if the carrying capacity is exceeded;
it is a problematic term for human populations because technology has a huge
influence on the resources that are available to human populations;
our tastes and demand for particular resources changes at such a rapid rate; at a country level technology can help to ensure carrying capacity is not exceeded;
e.g. by importing new resources with transport technology;
but at a global level technology can be used to intensify the way in which we use
resources e.g. increased agricultural production on the same plot of land by using
HYV rice;
substitutions of resources e.g. developing alternative energy technologies to fossil
fuels;
technology can also play a part in reducing human population size e.g. through
contraception/medicines (reducing infant mortality and thereby reducing the incentive
for high birth rates in many poor countries);
technology alone may not be the full solution, attitudes to resource use may need
to be altered; [8 max]
Award [3 max] for describing carrying capacity and [6 max] for role of technology.
Expression of ideas: [2 max]
Total: [20]