environmental sustainability: the five forces...
TRANSCRIPT

Environmental Sustainability: The Five Forces Analysis
Lewis University Green and Renewable Energy Workshop, by Dejan Ristic, FMSJune 20, 2013

About Argonne
Located 25 miles southwest of Chicago, Illinois
~ 4,500 people work on the site
200+ ongoing research projects in three principal areas:
• Energy (energy storage, alternative energy, nuclear energy)
• Biological and Environmental Systems, and
• National Security

Definitions
“Energy” word origin ~1590’s ‐ from late Latin energia.
Energy is the ability to perform the work
“Mrs. Cent“ – 7 forms of energy [Mechanical (kinetic + potential); Radiant (light); Sound; Chemical; Electrical; Nuclear; Thermal]
Development: Water power Steam Electrical Nuclear

Some 14 Billions Years Ago…
Big Bang temperature: 10E+32 K
• Cosmic background radiation cooled to 2.7 K
At Sun, 600,000,000 tons of H2 fuses into He every second, at 15E+06 K
• Proton‐proton reactions reduce Sun’s mass;
• May last for another 5–10 billion Earth years
Due to strong absorption inside the Sun, light and warmth we receive on Earth today was diffused 1‐2 million years ago!
Earth receives many times more than world energy demand
• That energy is EM radiation, transmitted via massless energy packets (photons)
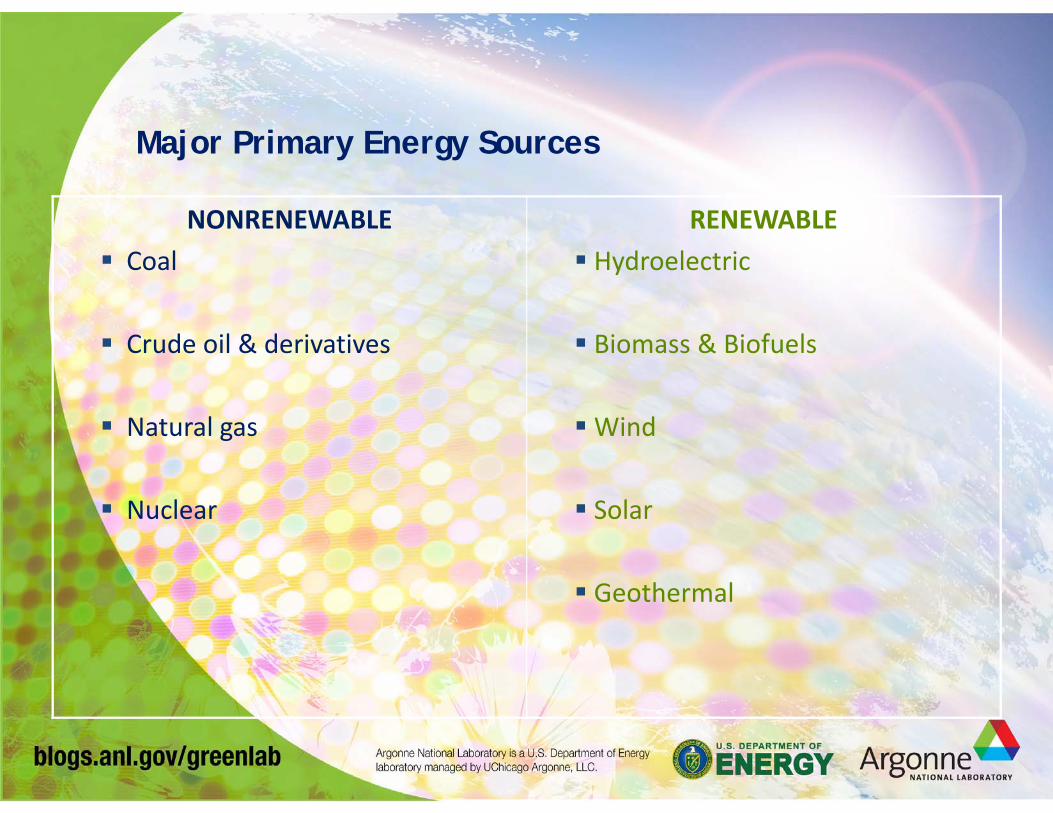
Major Primary Energy Sources
NONRENEWABLE Coal
Crude oil & derivatives
Natural gas
Nuclear
RENEWABLE Hydroelectric
Biomass & Biofuels
Wind
Solar
Geothermal
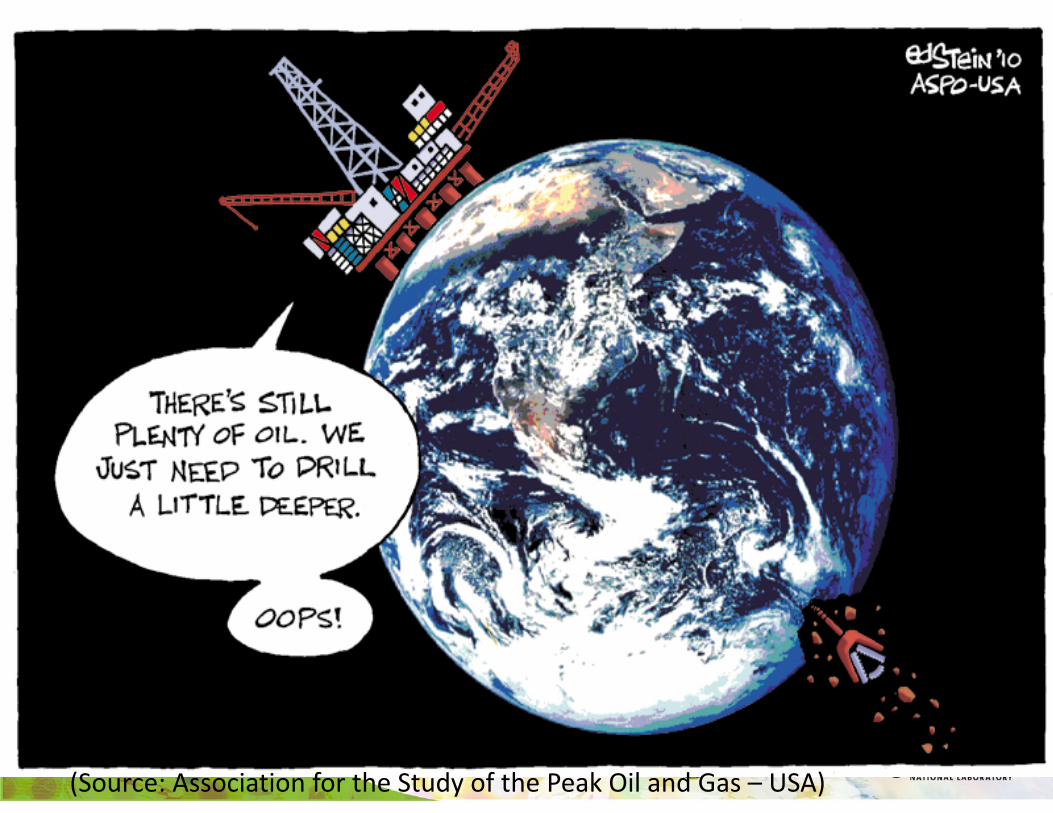
(Source: Association for the Study of the Peak Oil and Gas – USA)

Hydroelectric Power
6% of total U.S. electricity generation, and 63% of generation from renewable (2011)
In a run‐of‐the‐river system, the force of the current applies the needed pressure;
In a storage system, water is accumulated in reservoirs created by dams, then released as needed.
Oceans/seas: Tidal power; Wave power; Thermal energy conversion
Source: http://ga.water.usgs.gov/edu/watercycle.html

Wind Power Created by:
• Uneven heating of water and land
• Irregularities of the Earth's surface
• Rotation of the Earth
No CO2 emission
Took off in CA in 1980’s
~3% of total U.S. electricity generation
Limitations

Solar Power
Converted to electricity in two ways:
• Photovoltaic (PV) devices convert sunlight directly into electricity
• Concentrating Solar Power (CSP) plants ‐ heat a fluid which produces steam that powers the generator
Limitations:
• Location‐dependent;
• Intermittent.
• Requires large areas
• Solar‐grid parity not reached yet

Sunseeker Duo
PlanetSolar – Around the world in 19 Months

Geothermal Power
Using Earth as a heat sink (summer), or heat source (winter)
High temperatures inside the Earth caused by the slow decay of radioactive particles
Has potential: 99% of the Earth interior is hotter than 1800°F
Limitations:
• Cost of drilling
• Causes earthquakes?
Minor contribution to overall U.S. electricity production (0.4% in 2011)
Source: eia.doe.gov

The Sun ‐ a giant ball of H2 gas undergoing fusion into He gas and giving off vast amounts of energy in the process
Nuclear Power
Significant source of energy
Controlled nuclear energy release:
• Fission & Fusion
Uranium is nonrenewable, relatively rare element
Zero carbon emissions
Chain Reactionmovie partially filmed at Argonne!

Electricity Generation, Transmission, and Distribution System
Source: http://www.juniorcitizen.org.uk/kids/electricalsafety/electricity.gif
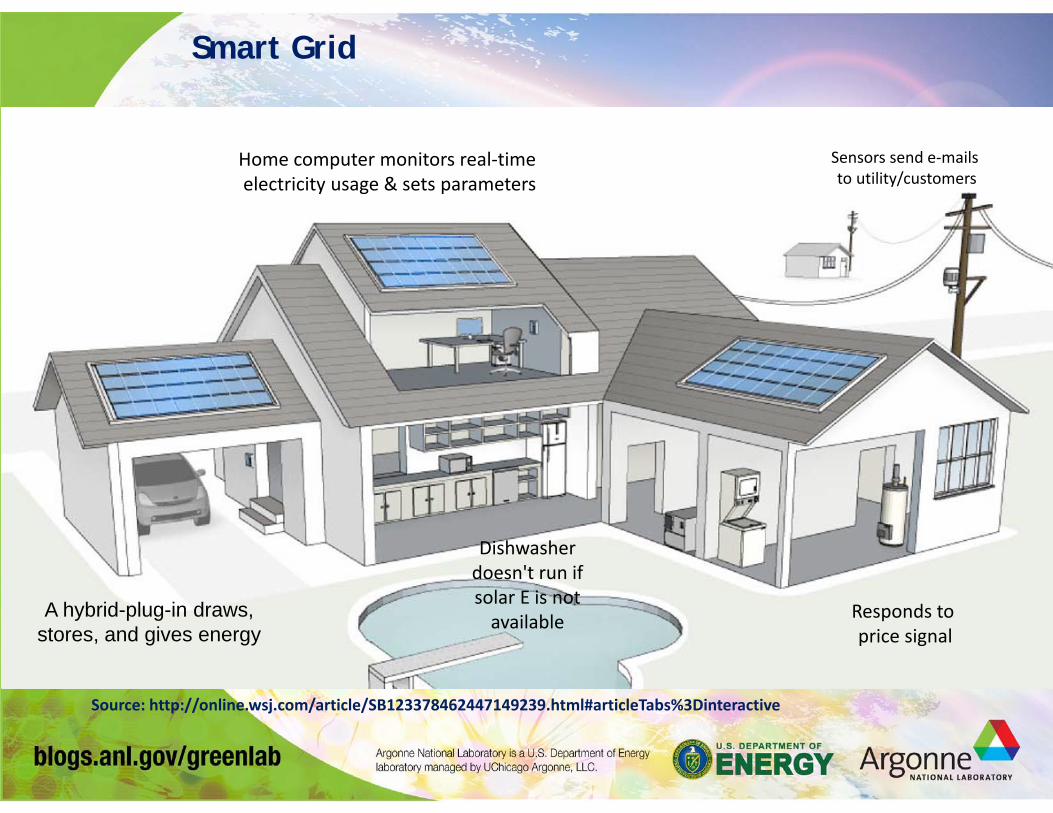
Smart Grid
A hybrid-plug-in draws, stores, and gives energy
Dishwasher doesn't run if solar E is not available Responds to
price signal
Source: http://online.wsj.com/article/SB123378462447149239.html#articleTabs%3Dinteractive
Sensors send e‐mails to utility/customers
Home computer monitors real‐time electricity usage & sets parameters

Source: Guardian
Renewable Energy Investment and Capacity
50
70
90
110
130
150
170
0 1 2 3 4 5 6 7 8 9 10Investmen
t Growth (%
)
Investment Ranking (2009 $)
Global Renewable Energy Investment and Capacity, 2004‐2009
China US UK EU‐other SpainBrazil Germany Canada Italy India
The size of a bubble corresponds with capacity of the country's 2004‐2009
renewable energy installations (US: 53 GW)

How Green Are Electric Cars?(Hint: It Depends on eGRID Region)
Source: http://www.ucsusa.org/assets/documents/clean_vehicles/electric‐car‐global‐warming‐emissions‐exec‐summary.pdf

Natural Greenhouse Effect
IR‐absorbing gases (mostly water vapor, clouds, CO2 in the upper troposphere) work as a “blanket”
It’s good – keeps the Earth’s mean T=59°F (instead of 0°F)!
However, humans‐made emissions likely affected the balance
Image source: Dr. Roy W. Spencer
Biogenic vs Anthropogenic CO2 Emissions
Biogenic: “non‐fossilized and biodegradable organic material originating from plants … as well as … industrial and municipal waste …” (EPA, 2011)
• Biogenic emissions have been treated as carbon neutral: Over time, the biomass fuel sources would regrow, and, in doing so, recapture the same amount of carbon previously emitted, eventually coming out as neutral.
Anthropogenic: Caused by human activities
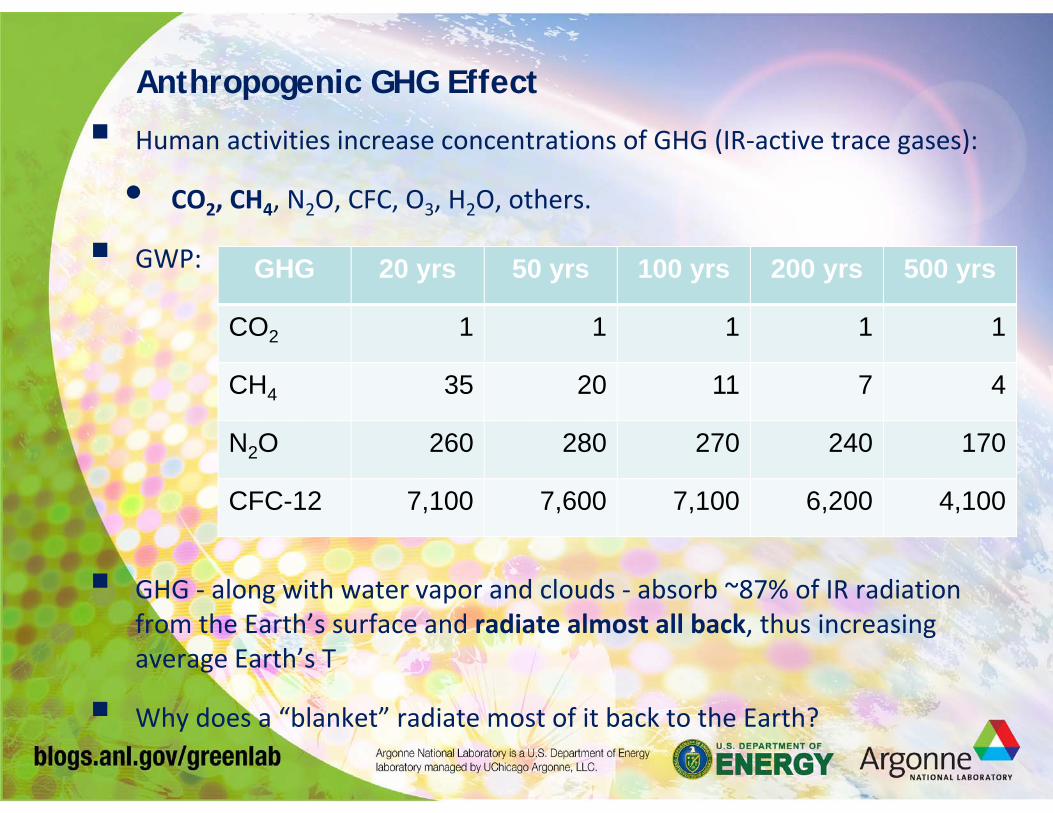
Anthropogenic GHG Effect
Human activities increase concentrations of GHG (IR‐active trace gases):
• CO2, CH4, N2O, CFC, O3, H2O, others.
GWP:
GHG ‐ along with water vapor and clouds ‐ absorb ~87% of IR radiation from the Earth’s surface and radiate almost all back, thus increasing average Earth’s T
Why does a “blanket” radiate most of it back to the Earth?
GHG 20 yrs 50 yrs 100 yrs 200 yrs 500 yrs
CO2 1 1 1 1 1
CH4 35 20 11 7 4
N2O 260 280 270 240 170
CFC-12 7,100 7,600 7,100 6,200 4,100

Radiation Balance of Earth
Source: Schӧnwiese, C. (2003). Klimatologie, Stuttgart.
Absorption spectrum
Majority of received solar radiation 0.3‐3 µm
Majority of emittedradiation 7‐13 µm.
Adding CO2 increases T of water vapor
When T increases, partial pressure of water vapor increases as well
When partial pressure increases, absorption increases
Therefore, more IR is trapped and radiated back
That’s anthropogenic effect of CO2 that causes Earth’s T to increase

Climate Disruption Contributors:
• GHG (79%); Black carbon (18%), and Heat islands (3%)
IPCC Report:
• Frequency of heavy precipitation/droughts will increase;
• Heat waves will increase in length, frequency;
• Maximum wind speed of hurricanes will increase;
• Average sea level will rise.Sources: Jacobson, M. & Hoeve, J.E.T. (2011). Effects of urban surfaces and white roofs on global and regional climate. J. of Climate. http://dx.doi.org/10.1175/JCLI‐D‐11‐00032.1 ; The Intergovernmental Panel on Climate Changes Report on Global Warming and Extreme Weather (November 2011); ORNL; Science Magazine.

Source: U.S. National Snow and Ice Data Center (NSIDC); 2012
When Ice in the Artic Ocean Melts…

…Polar Bears See More TrafficNew LNG corridor cuts travel time by 3 weeks to Japan
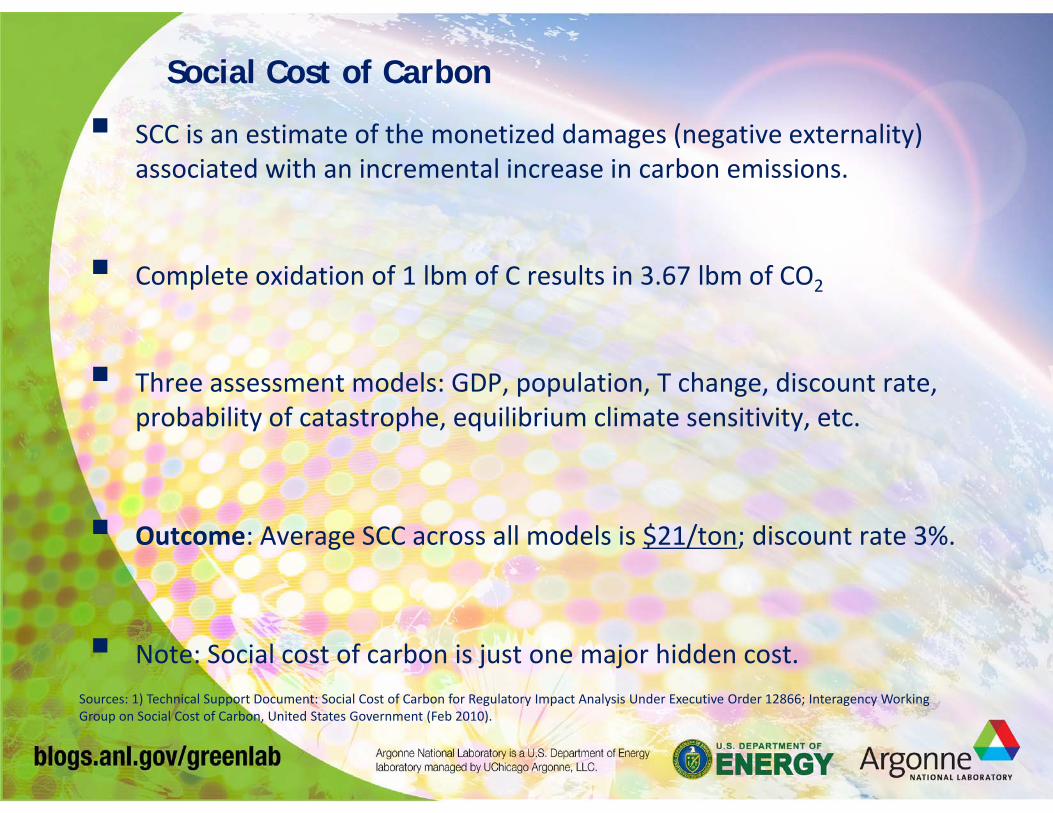
Social Cost of Carbon
SCC is an estimate of the monetized damages (negative externality) associated with an incremental increase in carbon emissions.
Complete oxidation of 1 lbm of C results in 3.67 lbm of CO2
Three assessment models: GDP, population, T change, discount rate, probability of catastrophe, equilibrium climate sensitivity, etc.
Outcome: Average SCC across all models is $21/ton; discount rate 3%.
Note: Social cost of carbon is just one major hidden cost.Sources: 1) Technical Support Document: Social Cost of Carbon for Regulatory Impact Analysis Under Executive Order 12866; Interagency Working Group on Social Cost of Carbon, United States Government (Feb 2010).

GHG Summary
Blanket keeps Earth’s average T conducive to living organisms, but post‐industrial GHG emissions are most likely causing an imbalance.
Imbalance will likely cause non‐linear outcomes in global supply chain.
Current commitments won’t keep an increase of global mean T within 2°C by 2100 ‐ emphasis should be put on adaptation, rather than mitigation
Modeling consequences is tricky: Based on discount rate applied, risks over multi‐year period may appear immaterial.
Communicate and act upon climate disruption risk effectively and timely.
Final goal: Meeting growing energy demand in an economical, environmentally responsible manner.
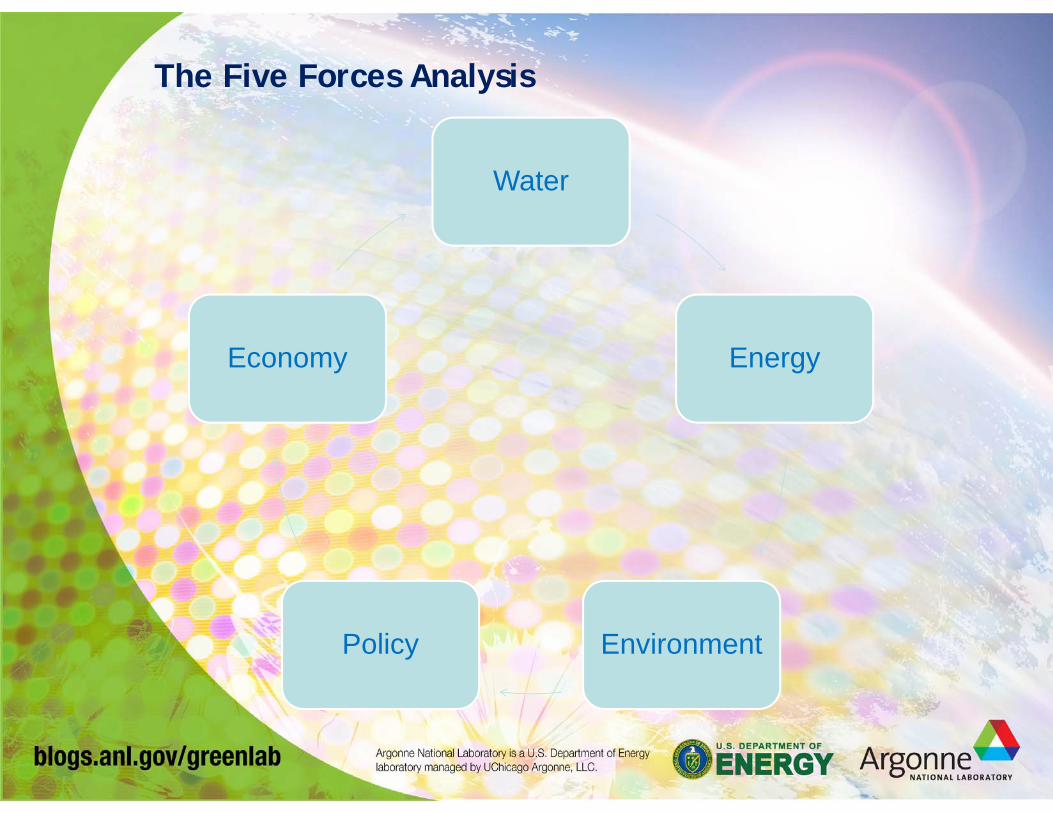
The Five Forces Analysis
Water
Energy
EnvironmentPolicy
Economy

Water Resources vs. Environmental Sustainability
“Of all the potential threats posed by climatic variability and change, those associated with water resources are arguably the most consequential for both society and the environment.”
Competing demands for water supply affect availability of water supply.
Sustainability is “Meeting the needs of the present without compromising the ability of future generations to meet their own needs.”
Forrester, J. (1973): “World Dynamics”, 2e.; US Geological Survey, Circular 1347 (2010); The Intergovernmental Panel on Climate Changes Fact Sheet (2011); The World Commission on Environment and Development (1987); EO 13514.


U.S. Water-related Statistics
Sources of water for population
• 86% from privately‐ and publicly‐owned water systems & 14% from domestic wells
Total use: 410 billion gallons per day (2005). Of that:
• 201 Bgal/d for thermoelectric power & 128 Bgal/d for irrigation
4% of electricity goes toward moving and treating water.
• 80% for moving, and 20% for treating
The Earth’s surface is 70% water
• Saltwater 97.5% & freshwater 2.5%
• Only 1% (of 70%) is accessible freshwater.
Sources: Kenny, J.F. et al. (2009). Estimated Use of Water in the United States. U.S. Geological Survey (Circular 1344); EPA; Safe Drinking Water Act.

US Freshwater Withdrawal
Source: EPRI, USGS

US Freshwater Withdrawal vs Consumption
Source: EPRI, USGS

Sources: U.S. Geological Survey, EPA, The Business Case for Fuel Cells 2011.
Ready for Projected Increased Water Consumption?
0.5 gallons to generate 1 kWh from coal; 0.6 gallons from nuclear.
2.5 gallons of water for 1 gallon of gasoline from conventional crude; 3.5 gallons of water to produce 1 gallon of ethanol; 6 gallons of water to produce 1 gallon of gasoline from oil shale.
“Fracking” can require 4+ million gallons per well!
On the other side, it takes much less water to generate electricity from renewable sources
• 400 kW fuel cell could save around 1.6 Mgal/yr of water, compared to U.S. grid.
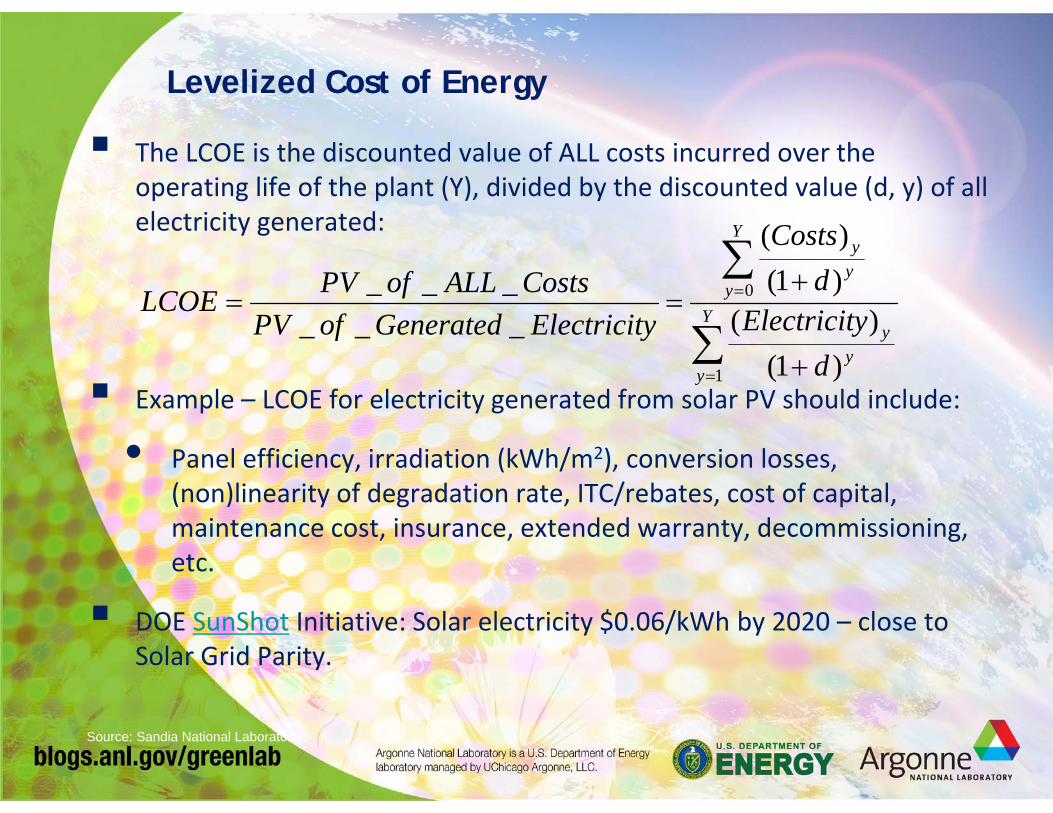
Levelized Cost of Energy
The LCOE is the discounted value of ALL costs incurred over the operating life of the plant (Y), divided by the discounted value (d, y) of all electricity generated:
Example – LCOE for electricity generated from solar PV should include:
• Panel efficiency, irradiation (kWh/m2), conversion losses, (non)linearity of degradation rate, ITC/rebates, cost of capital, maintenance cost, insurance, extended warranty, decommissioning, etc.
DOE SunShot Initiative: Solar electricity $0.06/kWh by 2020 – close to Solar Grid Parity.
Y
yy
y
Y
yyy
dyElectricit
dCosts
yElectricitGeneratedofPVCostsALLofPVLCOE
1
0
)1()(
)1()(
______
Source: Sandia National Laboratories

Impact of Regulations on Economic Factors
Theory: Regulation rearranges the distribution of economic output, but volume stays the same.
• Example 1 ‐Mandated environmental spending by 4 heavily polluting industries resulted in higher employment.
• Example 2 ‐ The cost of imposing Clean Air Act caused a loss of: 590,000 jobs, $37B in capital stock, and $75B of output, in the 1972‐1987 period.
Being laid off costs a “typical male” worker 11‐19% of his future earning (PV).
Taking these factors into consideration, cost‐benefit equation may change.
Sources: Resources for the Future Study (2002) for pulp/paper, plastic, petroleum, iron/steel; M. Greenstone (2001): The Impacts of Environmental Regulations on Industrial Activity: Evidence from the 1970 & 1977 Clean Air Act Amendments and the Census of Manufactures; S. Davis & T. von Wachter(2011): Recessions and the Costs of Job Loss; J.S. Masur & E.A. Posner (2011): Regulation, Unemployment, and Cost‐Benefit Analysis.

Energy-Water Nexus Path Forward
Water, and water‐related energy consumptions will increase:
• In the U.S.: With population growth. In the world: With population growth AND modernization (supply, sanitary).
Regulate energy‐water relationship (Proposed “Energy and Water Integration Act of 2011” by Sen. Bingaman).
Energy Return Ratio should be at least 3:1
• Ratio of the energy input of any process that is intended to save or generate energy;
Site vs. source water transport/processing – look upstream supply chain.
Implement a sensible policy that integrates energy‐water nexus, environment, and economic factors.
Sustainability Program at Argonne

Executive Order 13514 Federal Leadership in Environmental, Energy, and Economic Performance
“To establish an integrated strategy towards sustainability in the Federal Government and make reduction of greenhouse gas (GHG) emissions a priority for agencies.”


Renewable Energy
Solar PV time lapse: https://sharepoint.anl.gov/Groups/energy_water/Shared%20Documents/Miscellaneous/VideoSolarPanelElecChargingStationBld212TimeLapse.mov
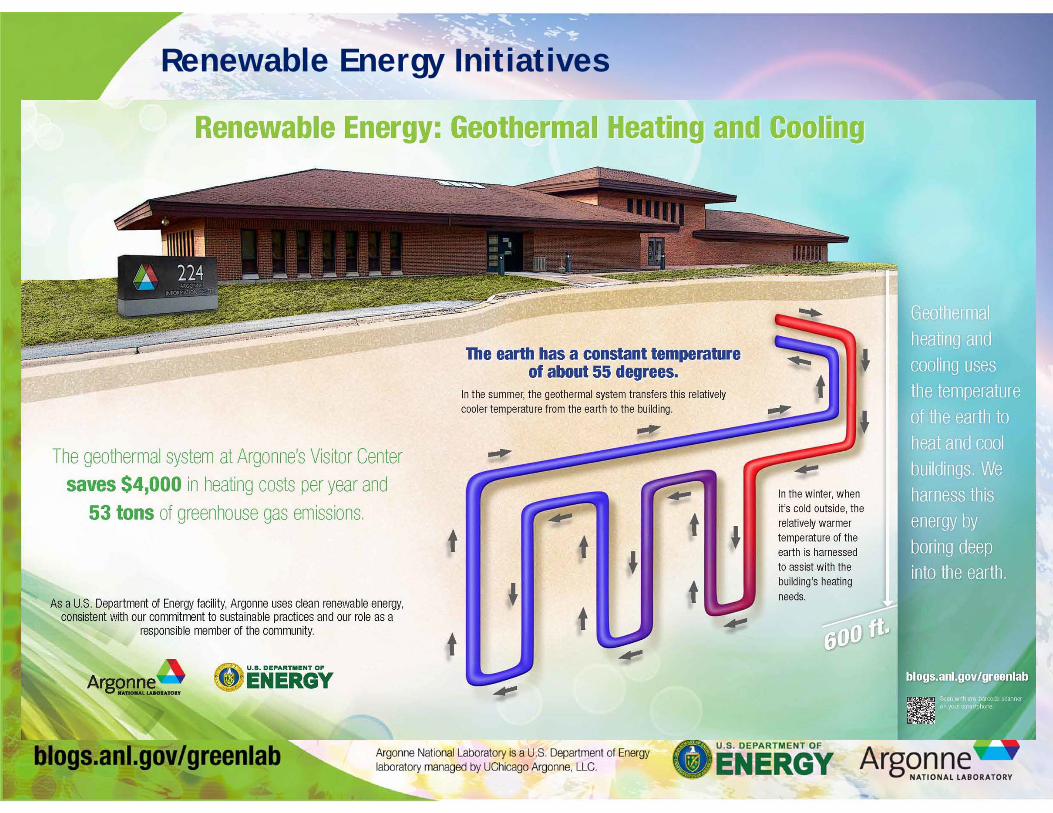
Renewable Energy Initiatives
.
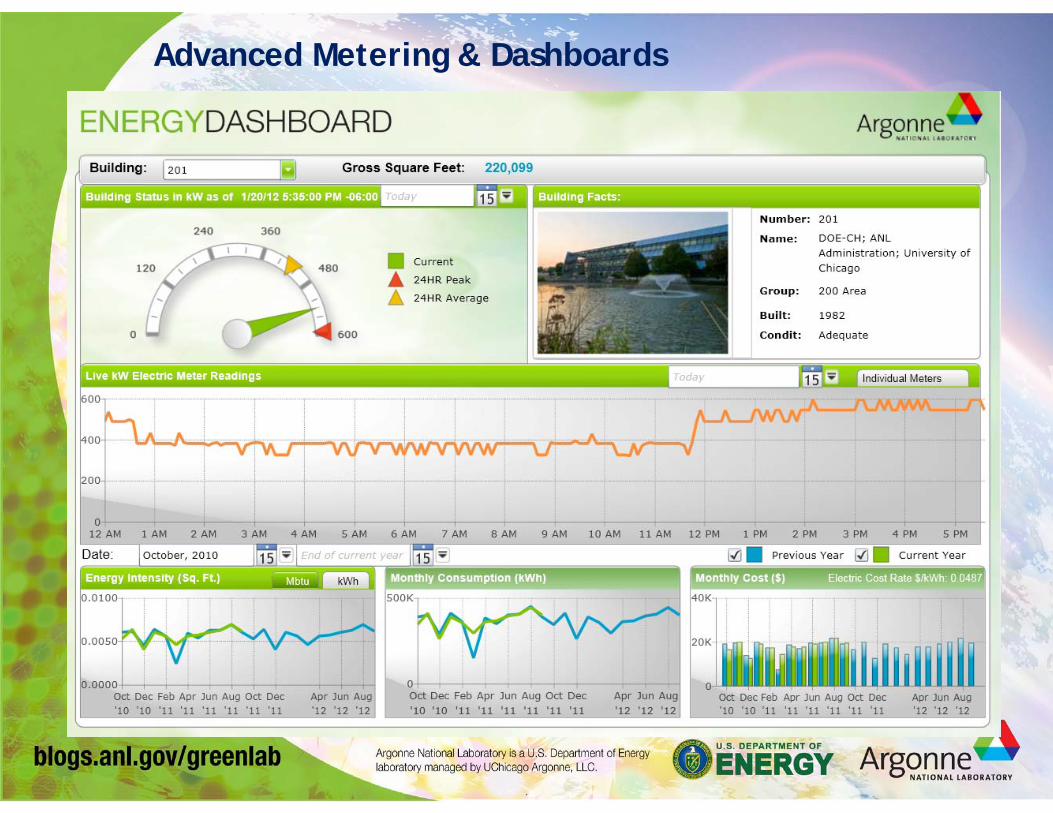
Advanced Metering & Dashboards

BuildingIQ
The Advanced Photon Source office building’s BuildingIQ system makes use of weather
forecast information and building temperature predictions to optimize, in real-time, the
heating and cooling loads

“Green” Buildings
Currently six building qualified as HPSBs ESB and APCF will qualify upon
completion Evaluating other buildings as planned
renovations and energy savings projects are implemented
0
2
4
6
8
10
12
FY10 FY11 FY12 FY13 FY14 FY15
Number of HPSBs at End of FY

Transportation GHG Emissions (Scope 3)
Top 3 Scope 3 emission sources:• Electricity T&D losses• Employee commuting• Business travel
Efforts to reduce transportation GHGs• BikeShare program with 120 bicycles • Sustainable Employee Commute Committee• GreenRide Connect rideshare matching software• Promoting telecommuting• VC hardware and support expansion
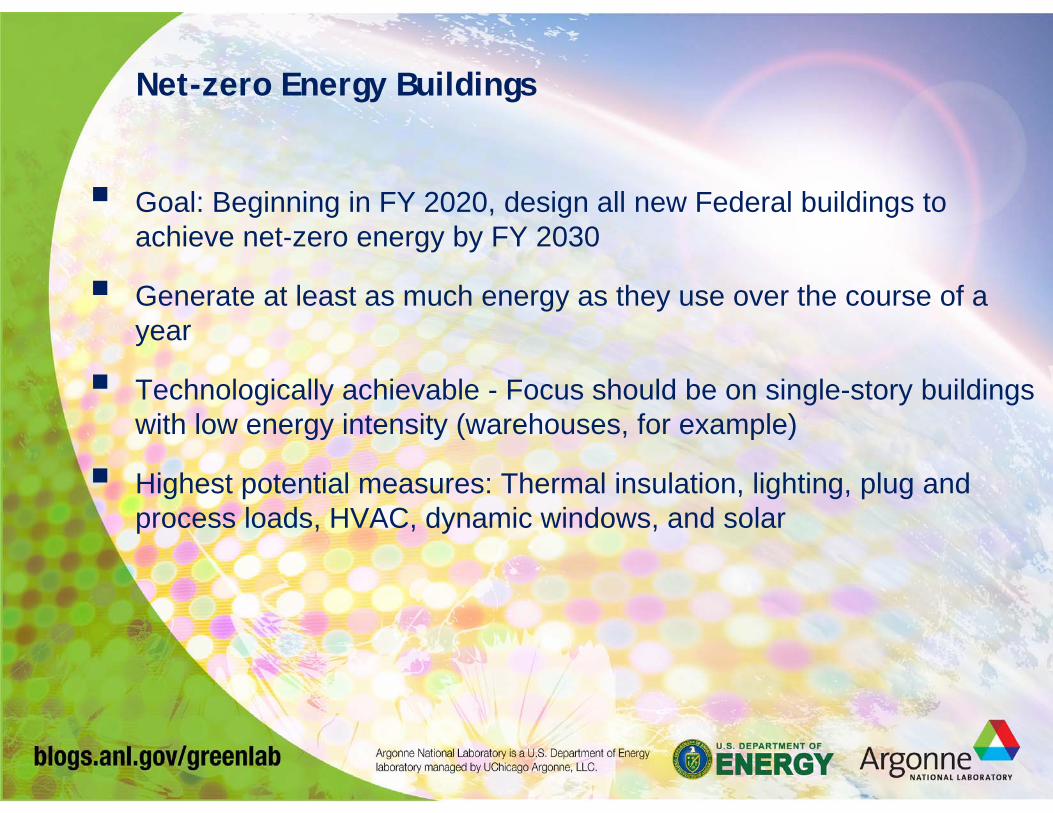
Net-zero Energy Buildings
Goal: Beginning in FY 2020, design all new Federal buildings to achieve net‐zero energy by FY 2030
Generate at least as much energy as they use over the course of a year
Technologically achievable - Focus should be on single-story buildings with low energy intensity (warehouses, for example)
Highest potential measures: Thermal insulation, lighting, plug and process loads, HVAC, dynamic windows, and solar

Outreach
Award‐Winning Middle School Teacher Sustainability Workshop

Site Sustainability Plans


COMMENTS? QUESTIONS?
Thank you!
Source: http://visibleearth.nasa.gov/view_rec.php?id=2429