environmental studies copyright © 2020 china’s improving ... · tions further sugest a marked...
TRANSCRIPT
Ma et al., Sci. Adv. 2020; 6 : eaau3798 3 January 2020
S C I E N C E A D V A N C E S | R E S E A R C H A R T I C L E
1 of 10
E N V I R O N M E N T A L S T U D I E S
China’s improving inland surface water quality since 2003Ting Ma1,2,3*, Na Zhao1,2†, Yong Ni4†, Jiawei Yi1,2†, John P. Wilson1,2,5, Lihuan He4, Yunyan Du1,2, Tao Pei1,2, Chenghu Zhou1,2*, Ci Song1,2, Weiming Cheng1,2
Increased human activity threatens inland water quality in China. Major efforts have been made to alleviate water pollution since 2001. Understanding how water quality responds to these forces can help to guide future efforts to maintain water security and sustainability. We here analyzed the nationwide variability of inland water quality across China from 2003 to 2017 and its responses to anthropogenic discharges. We show that water quality has been improved markedly or was maintained at favorable levels over the country because of reduced discharges in the industrial, rural, and urban residential sectors. However, growing discharges from the agricultural sector threaten these gains. Moreover, the present status of water pollution is relatively severe in north and northeast China. Our findings suggest that China’s water quality would further benefit from more flexible strategies for mitigation measures, which respond to regional differences in the factors that influence water pollution levels in specific regions.
INTRODUCTIONOver the past several decades, China’s rapid economic development has taken place at the expense of the environment (1–8). The wide-spread deterioration of surface water quality in inland water bodies represents one of the most serious environmental threats to human health and ecosystem services (9–21). Large investments have been made in wastewater discharge standards and pollution control strategies to address the water pollution crisis and to promote eco-environment restoration (22–25), especially since 2001 [as summarized in (25)], the start of the 10th National Five-Year Plan.
China’s inland surface water quality presently faces both escalating anthropogenic disturbance, particularly from urban domestic waste-water discharge and agricultural non-point source pollution, and growing environmental efforts, mainly concentrating on the treatment of point source pollution and the provision of urban environmental infrastructure (fig. S1). Several assessments have documented declines in pollutant concentrations at monitoring sites in inland lakes, indi-vidual rivers, and local basins due to these national policies (25–29). The impacts of different factors including socioeconomic activities, environmental processes, and land-use change on inland water pol-lution have also been elucidated by numerous studies (30–35), reports, and statistical bulletins (36–38). These investigations, however, have usually focused on temporal changes in pollutant concentrations for specified water bodies or local regions and lack of direct linkages to anthropogenic pollution sources. They therefore might not reflect the comprehensive relationship between inland water quality and the driving forces across the whole country over time, which plays a key role for understanding the nationwide dynamics in water pollution with regionally varying conditions and diverse human activities.
The work to investigate the effectiveness of past efforts and current regional variations in China’s inland water quality is crucially im-portant in helping to identify pollution control and water quality improvement policies and practices that would improve water security and ecosystem sustainability across all of China’s diverse regions. Here, we report the most nationally representative investigations to date of how three typical water quality parameters—the chemical oxygen demand (COD; the permanganate index, an indicative measure of pollutant loading), ammonium nitrogen ( NH 4 + -N), and dissolved oxygen (DO) in China’s inland surface waters—have changed over space and time due to dynamics in multiple anthropogenic pollution sources.
We compiled time series of monthly mean concentrations of COD, NH 4 + -N, and DO derived from site-level measurements across the whole country and 10 major river basins for the period 2003–2017 (Fig. 1, A to C, and table S1). Considering intersite variations in water quality data for a given region and toward a comprehensive estimate of inland water quality changes in China, we jointly analyzed the trends in six different time series of annual mean observed concentrations: Q1 (composed of the annually averaged first quartile of the regional as-semblage of site-level monthly measurements), Q2 (the median), Q3 (the third quartile), Qm (the maximum after removing upper outliers), Qa (the average of all measurements), and the observed proportion of water quality superior to level IV in each target region. Seasonal fluctuations in observed concentrations have been removed from the time series to eliminate the effect of seasonal variations in streamflow and other influ-encing factors, because here we are mainly interested in the long-term trends in inland surface water quality. Correspondingly, we assembled a dataset of anthropogenic pollution discharges for the industrial, rural, and urban residential and agricultural sectors from multiple data sources to examine and compare region-scale anthropogenic influences on water quality. Detailed information about data sources, data processing, and analysis methods used in this study were provided in Materials and Methods and Supplementary Text.
RESULTS AND DISCUSSIONTrends in COD, NH 4 + -N, and DO concentrationsOur results show that the mean monthly concentrations of site- level COD and NH 4 + -N across the country have declined from 9.28
1State Key Laboratory of Resources and Environmental Information System, Institute of Geographical Sciences and Natural Resources Research, Chinese Academy of Sciences, Beijing 100101, China. 2College of Resources and Environment, University of Chinese Academy of Sciences, Beijing 100049, China. 3Jiangsu Center for Collaborative Innovation in Geographical Information Resource Development and Application, Nanjing 210023, China. 4China National Environmental Monitoring Center, Beijing 100012, China. 5College of Letters, Arts and Sciences, University of Southern California, Los Angeles, CA 90089, USA.*Corresponding author. Email: [email protected] (T.M.); [email protected] (C.Z.)†These authors contributed equally to this work.
Copyright © 2020 The Authors, some rights reserved; exclusive licensee American Association for the Advancement of Science. No claim to original U.S. Government Works. Distributed under a Creative Commons Attribution NonCommercial License 4.0 (CC BY-NC).
on June 7, 2020http://advances.sciencem
ag.org/D
ownloaded from
Ma et al., Sci. Adv. 2020; 6 : eaau3798 3 January 2020
S C I E N C E A D V A N C E S | R E S E A R C H A R T I C L E
2 of 10
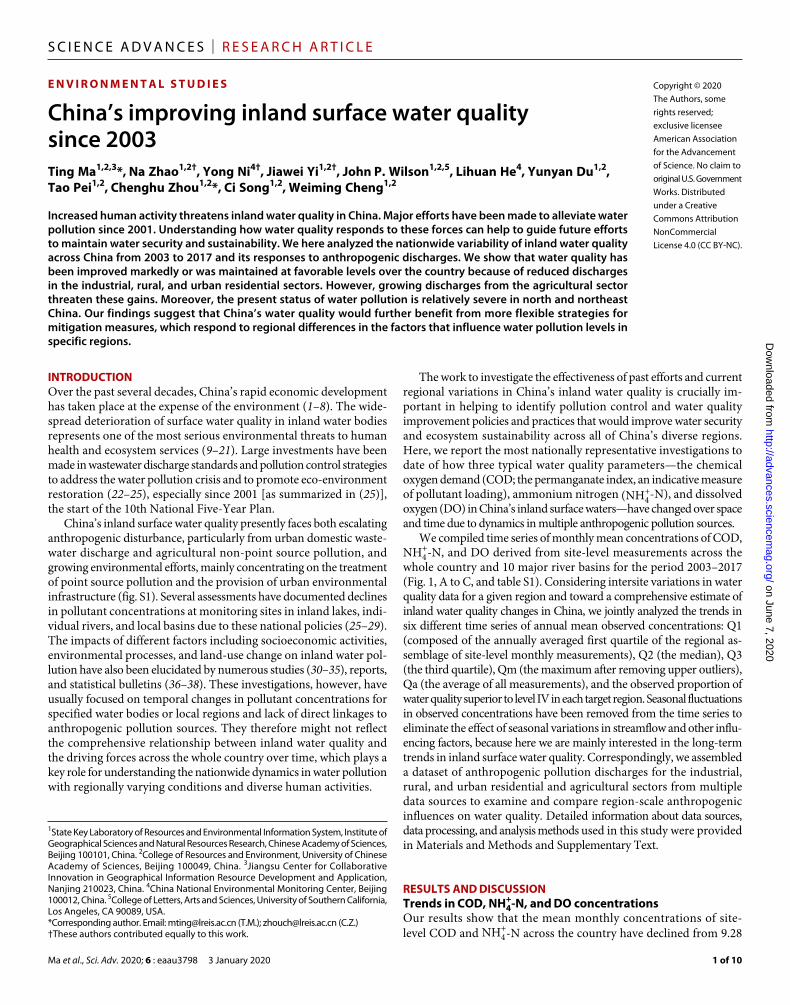
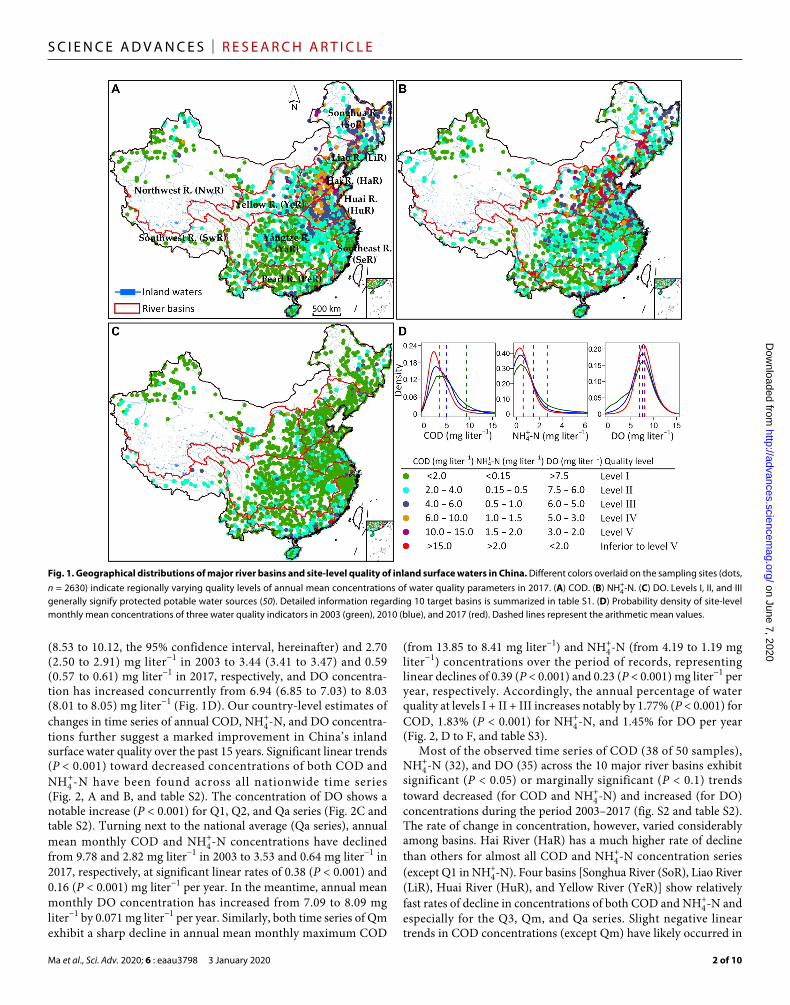
(8.53 to 10.12, the 95% confidence interval, hereinafter) and 2.70 (2.50 to 2.91) mg liter−1 in 2003 to 3.44 (3.41 to 3.47) and 0.59 (0.57 to 0.61) mg liter−1 in 2017, respectively, and DO concentra-tion has increased concurrently from 6.94 (6.85 to 7.03) to 8.03 (8.01 to 8.05) mg liter−1 (Fig. 1D). Our country-level estimates of changes in time series of annual COD, NH 4 + -N, and DO concentra-tions further suggest a marked improvement in China’s inland surface water quality over the past 15 years. Significant linear trends (P < 0.001) toward decreased concentrations of both COD and NH 4 + -N have been found across all nationwide time series (Fig. 2, A and B, and table S2). The concentration of DO shows a notable increase (P < 0.001) for Q1, Q2, and Qa series (Fig. 2C and table S2). Turning next to the national average (Qa series), annual mean monthly COD and NH 4 + -N concentrations have declined from 9.78 and 2.82 mg liter−1 in 2003 to 3.53 and 0.64 mg liter−1 in 2017, respectively, at significant linear rates of 0.38 (P < 0.001) and 0.16 (P < 0.001) mg liter−1 per year. In the meantime, annual mean monthly DO concentration has increased from 7.09 to 8.09 mg liter−1 by 0.071 mg liter−1 per year. Similarly, both time series of Qm exhibit a sharp decline in annual mean monthly maximum COD
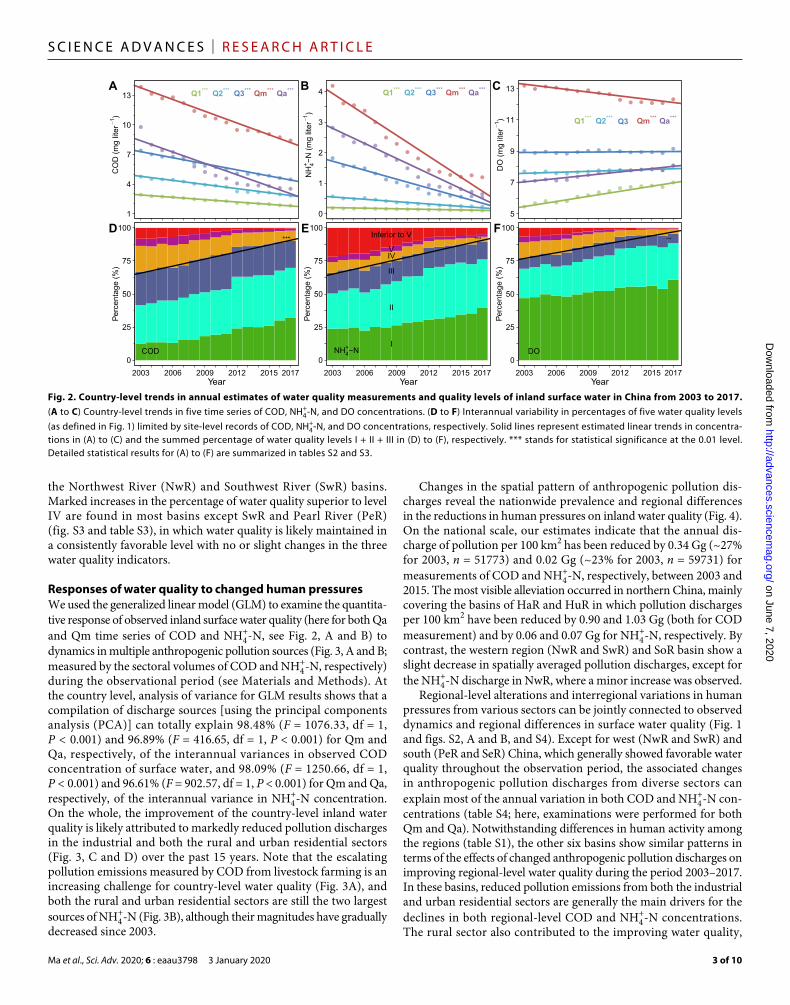
(from 13.85 to 8.41 mg liter−1) and NH 4 + -N (from 4.19 to 1.19 mg liter−1) concentrations over the period of records, representing linear declines of 0.39 (P < 0.001) and 0.23 (P < 0.001) mg liter−1 per year, respectively. Accordingly, the annual percentage of water quality at levels I + II + III increases notably by 1.77% (P < 0.001) for COD, 1.83% (P < 0.001) for NH 4 + -N, and 1.45% for DO per year (Fig. 2, D to F, and table S3).
Most of the observed time series of COD (38 of 50 samples), NH 4 + -N (32), and DO (35) across the 10 major river basins exhibit significant (P < 0.05) or marginally significant (P < 0.1) trends toward decreased (for COD and NH 4 + -N) and increased (for DO) concentrations during the period 2003–2017 (fig. S2 and table S2). The rate of change in concentration, however, varied considerably among basins. Hai River (HaR) has a much higher rate of decline than others for almost all COD and NH 4 + -N concentration series (except Q1 in NH 4 + -N). Four basins [Songhua River (SoR), Liao River (LiR), Huai River (HuR), and Yellow River (YeR)] show relatively fast rates of decline in concentrations of both COD and NH 4 + -N and especially for the Q3, Qm, and Qa series. Slight negative linear trends in COD concentrations (except Qm) have likely occurred in
Fig. 1. Geographical distributions of major river basins and site-level quality of inland surface waters in China. Different colors overlaid on the sampling sites (dots, n = 2630) indicate regionally varying quality levels of annual mean concentrations of water quality parameters in 2017. (A) COD. (B) NH 4 + -N. (C) DO. Levels I, II, and III generally signify protected potable water sources (50). Detailed information regarding 10 target basins is summarized in table S1. (D) Probability density of site-level monthly mean concentrations of three water quality indicators in 2003 (green), 2010 (blue), and 2017 (red). Dashed lines represent the arithmetic mean values.
on June 7, 2020http://advances.sciencem
ag.org/D
ownloaded from
Ma et al., Sci. Adv. 2020; 6 : eaau3798 3 January 2020
S C I E N C E A D V A N C E S | R E S E A R C H A R T I C L E
3 of 10
the Northwest River (NwR) and Southwest River (SwR) basins. Marked increases in the percentage of water quality superior to level IV are found in most basins except SwR and Pearl River (PeR) (fig. S3 and table S3), in which water quality is likely maintained in a consistently favorable level with no or slight changes in the three water quality indicators.
Responses of water quality to changed human pressuresWe used the generalized linear model (GLM) to examine the quantita-tive response of observed inland surface water quality (here for both Qa and Qm time series of COD and NH 4 + -N, see Fig. 2, A and B) to dynamics in multiple anthropogenic pollution sources (Fig. 3, A and B; measured by the sectoral volumes of COD and NH 4 + -N, respectively) during the observational period (see Materials and Methods). At the country level, analysis of variance for GLM results shows that a compilation of discharge sources [using the principal components analysis (PCA)] can totally explain 98.48% (F = 1076.33, df = 1, P < 0.001) and 96.89% (F = 416.65, df = 1, P < 0.001) for Qm and Qa, respectively, of the interannual variances in observed COD concentration of surface water, and 98.09% (F = 1250.66, df = 1, P < 0.001) and 96.61% (F = 902.57, df = 1, P < 0.001) for Qm and Qa, respectively, of the interannual variance in NH 4 + -N concentration. On the whole, the improvement of the country-level inland water quality is likely attributed to markedly reduced pollution discharges in the industrial and both the rural and urban residential sectors (Fig. 3, C and D) over the past 15 years. Note that the escalating pollution emissions measured by COD from livestock farming is an increasing challenge for country-level water quality (Fig. 3A), and both the rural and urban residential sectors are still the two largest sources of NH 4 + -N (Fig. 3B), although their magnitudes have gradually decreased since 2003.
Changes in the spatial pattern of anthropogenic pollution dis-charges reveal the nationwide prevalence and regional differences in the reductions in human pressures on inland water quality (Fig. 4). On the national scale, our estimates indicate that the annual dis-charge of pollution per 100 km2 has been reduced by 0.34 Gg (~27% for 2003, n = 51773) and 0.02 Gg (~23% for 2003, n = 59731) for measurements of COD and NH 4 + -N, respectively, between 2003 and 2015. The most visible alleviation occurred in northern China, mainly covering the basins of HaR and HuR in which pollution discharges per 100 km2 have been reduced by 0.90 and 1.03 Gg (both for COD measurement) and by 0.06 and 0.07 Gg for NH 4 + -N, respectively. By contrast, the western region (NwR and SwR) and SoR basin show a slight decrease in spatially averaged pollution discharges, except for the NH 4 + -N discharge in NwR, where a minor increase was observed.
Regional-level alterations and interregional variations in human pressures from various sectors can be jointly connected to observed dynamics and regional differences in surface water quality (Fig. 1 and figs. S2, A and B, and S4). Except for west (NwR and SwR) and south (PeR and SeR) China, which generally showed favorable water quality throughout the observation period, the associated changes in anthropogenic pollution discharges from diverse sectors can explain most of the annual variation in both COD and NH 4 + -N con-centrations (table S4; here, examinations were performed for both Qm and Qa). Notwithstanding differences in human activity among the regions (table S1), the other six basins show similar patterns in terms of the effects of changed anthropogenic pollution discharges on improving regional-level water quality during the period 2003–2017. In these basins, reduced pollution emissions from both the industrial and urban residential sectors are generally the main drivers for the declines in both regional-level COD and NH 4 + -N concentrations. The rural sector also contributed to the improving water quality,
1
4
7
10
13
CO
D (m
g lit
er)
AQ1*** Q2*** Q3*** Qm*** Qa***
0
1
2
3
4
NH
4+ −N (m
g lit
er)
B Q1*** Q2*** Q3*** Qm*** Qa***
5
7
9
11
13
DO
(mg
liter
)
C
Q1*** Q2*** Q3 Qm*** Qa***
2003 2006 2009 2012 2015 20170
25
50
75
100
Year
Perc
enta
ge (%
)
D
COD
***
2003 2006 2009 2012 2015 20170
25
50
75
100
Year
Perc
enta
ge (%
)
E
NH4+−N
***
I
II
III
IVV
Inferior to V
2003 2006 2009 2012 2015 20170
25
50
75
100
Year
Perc
enta
ge (%
)
F
DO
***
Fig. 2. Country-level trends in annual estimates of water quality measurements and quality levels of inland surface water in China from 2003 to 2017. (A to C) Country-level trends in five time series of COD, NH 4 + -N, and DO concentrations. (D to F) Interannual variability in percentages of five water quality levels (as defined in Fig. 1) limited by site-level records of COD, NH 4 + -N, and DO concentrations, respectively. Solid lines represent estimated linear trends in concentra-tions in (A) to (C) and the summed percentage of water quality levels I + II + III in (D) to (F), respectively. *** stands for statistical significance at the 0.01 level. Detailed statistical results for (A) to (F) are summarized in tables S2 and S3.
on June 7, 2020http://advances.sciencem
ag.org/D
ownloaded from

Ma et al., Sci. Adv. 2020; 6 : eaau3798 3 January 2020
S C I E N C E A D V A N C E S | R E S E A R C H A R T I C L E
4 of 10
especially in HuR, YaR, and YeR. In the relatively highly polluted HaR basin, all of the sectors (except aquaculture) showed positive effects on the declining COD and NH 4 + -N concentrations. In addition, probably owing to low-density human activity in the western region (NwR and SwR) and plentiful water resource in SeR and PeR (table S1), changes in human pressures are likely much less linked to the relatively stable surface water quality in these four basins (table S4).
The effects of environmental investment on pollution dischargesTo mitigate inland water pollution, several national standards for surface water quality and sector-specific discharges of point source water pollutants have been issued by the central government since 2002. Large investments have thus been made to urban environ-mental infrastructure [a total of approximately 4 trillion renminbi (RMB) from 2003 to 2015] and industrial wastewater treatment (0.18 trillion RMB) (table S1 and fig. S5). Reduced pollution emissions from both the industrial and urban residential sectors generally have resulted in the marked declines in both COD and NH 4 + -N concen-trations in the country and most of the basins (Fig. 3, fig. S4, and table S2). In addition, nationwide investment in sanitary toilet facilities promoted by measures for rural toilet improvement likely contrib-uted to declining pollution discharges in rural areas (Fig. 3, fig. S5, and table S1).
At the country level, yearly pollution discharges from the urban residential sector are estimated to have substantially declined by 52.73% (COD) and 31.22% ( NH 4 + -N) between 2003 and 2015, notwithstanding rapidly increased urban population (49.25%) and urbanized lands (36.47%) (fig. S1 and table S1). Meanwhile, pollution emissions from the industrial sector have been reduced by 57.60% (COD) and 45.81% ( NH 4 + -N), which resulted from enhanced treatment capabilities of industrial wastewater, notwithstanding the 2.2- and 4.9-fold increases in industrial lands and the industrial gross domestic product (IGDP), respectively (table S1). A cross-regional comparison analysis further demonstrates the effectiveness of environmental investment to reduced anthropogenic pollution emissions across basins (fig. S6). Our estimates suggest that, on average, annual anthropogenic pollution discharges could be significantly reduced by 14.18 (P = 0.017) and 2.15 Gg (COD; P = 0.002) and 1.86 and 0.13 Gg ( NH 4 + -N; P < 0.001 for both) for the industrial and urban residential sectors, respectively, responding to an environmental investment of 1 billion RMB over the period 2003–2015.
Although there are notable interregional variations in anthropo-genic pollution discharges and underlying driving factors, most of the basins exhibit similar trends toward decreased discharge levels (defined as the volume of pollution emissions per unit population for the urban residential sector and per unit IGDP for the industrial sector) between 2003 and 2015 (fig. S6). For the urban residential
A B
C D
Fig. 3. Country-level dynamics in anthropogenic pollution discharges from different sectors and their relative impacts on interannual variances in observed COD and NH 4 + -N concentrations of China’s inland water during 2003–2017. (A) Pollution discharges measured by COD from different sectors. (B) NH 4 + -N discharges from different sectors. (C and D) Relative impacts (here estimated by the loadings of the first principal component; see Materials and Methods) of different pollution sources to interannual variances in observed COD and NH 4 + -N concentrations, respectively. Solid lines in (A) and (B) are fitted local trends using locally weighted scatter-plot smoothing with 0.8 bandwidth. Gray areas represent the 95% confidence intervals estimated by the bootstrap sampling method. Both (C) and (D) are the analyzed results for country-level Qm and Qa time series (Fig. 2, A and B). Positive values in (C) and (D) indicate a positive effect of reduced sector-specific pollution discharges on the declination in observed concentrations of either COD or NH 4 + -N and vice-versa.
on June 7, 2020http://advances.sciencem
ag.org/D
ownloaded from

Ma et al., Sci. Adv. 2020; 6 : eaau3798 3 January 2020
S C I E N C E A D V A N C E S | R E S E A R C H A R T I C L E
5 of 10
sector spanning 10 major basins, the discharge level is estimated to have declined by 19.63 to 29.21 (min-max) and 1.69 to 2.83 metric tons per 104 urban residents for COD and NH 4 + -N, respectively. Reductions of 1.39 to 6.18 (COD) and 0.01 to 0.76 ( NH 4 + -N) metric tons per 108 RMB IGDP were found for the industrial sector (except for NwR and SwR). In particular, the northern basins, including HaR and HuR, with relatively high-density pollution emissions (Fig. 4) show more significant decreases and lower current status in discharge levels due to relatively high environmental investments (table S1). Further declines in the pollution discharge level, however, are still needed to reduce human pressures on re-gional water quality in these two basins (fig. S3).
Regional variations in current water qualityAlthough the abovementioned findings jointly suggest notable declines in COD and NH 4 + -N concentrations and increases in DO concentration nationally and in most basins, resulting from reduced human pressure, long-term trends in observed concentrations provide an incomplete view of the effects of human activity on water quality because there are conspicuous interregional variations in the current status of water pollution. We therefore performed a cross-regional comparison of the relationship between current COD and NH 4 + -N concentrations of inland surface waters and anthropo-
genic pollution discharge loadings (defined as the ratio of annual discharge and the volume of local surface water resources) among basins (Fig. 5). The significantly positive monotonic relationship indicates the salient role of human activity in current water quality and its regional variations. In comparison with the national average, the current situation with regard to both COD and NH 4 + -N concen-trations and water quality level (Fig. 1, table S3, and figs. S2 and S3) is still relatively poor in north China including the HaR, YeR, LiR, and HuR basins with intensified human pressure with respect to local surface water resource availability, although these regions show relatively fast declines in both COD and NH 4 + -N concentra-tions since 2003. Pollution loadings from rural residences likely have the largest impact on current water quality in those northern basins except LiR (fig. S4). In contrast, NwR, SwR, SeR, YaR, and PeR exhibit relatively less net change in observed COD and NH 4 + -N concentrations and are presently in a better water quality condition due to relatively low-density human disturbances in terms of dis-charge loadings.
Apart from the immediate effects of pollution discharge loadings, the aforementioned regional differences in water pollution can be further explained by the regional heterogeneity of multiple general driving factors, and thus allow us to obtain a more comprehensive understanding of regional differences in water quality in present-day
Fig. 4. Spatial distributions of anthropogenic pollution discharges (in Gg year−1 per 100 km2) and temporal changes between 2003 and 2015. (A) Pollution dis-charge measured by COD in 2015. (B) Changes in pollution discharge measured by COD between 2003 and 2015. (C) NH 4 + -N discharge in 2015. (D) Changes in NH 4 + -N discharge between 2003 and 2015. Spatial estimates are based on assembled anthropogenic pollution discharge datasets involved in this study and satellite-derived land-use maps and performed on 10 km–by–10 km grids (see Materials and Methods).
on June 7, 2020http://advances.sciencem
ag.org/D
ownloaded from

Ma et al., Sci. Adv. 2020; 6 : eaau3798 3 January 2020
S C I E N C E A D V A N C E S | R E S E A R C H A R T I C L E
6 of 10
China. We next performed a cluster analysis among 10 major river basins with six representative and putative variables, which can have potentially significant impacts on inland surface water quality. As presented in Fig. 6, hierarchical cluster analyses of impact variables (see the caption of Fig. 6 for definitions) and among regions explicitly reveal both the similarity of impacts on regional water quality between drivers and how drivers affect simi-larity in water pollution conditions between basins. Across various drivers (Fig. 6A and table S5), we can therefore categorize all impact variables into three groups forming distinct clusters of water quality drivers at the regional level: human pressure (POP and GDP), environ-mental effort (INV), and environmental capability (WAT, PRE, and GRE). Across different regions, we can also find that basins with similar drivers have the most similar water pollution conditions (Fig. 6B and table S5). Furthermore, the ridge regression results quantify the effects of these drivers on the interregional variations in current inland water quality (as summarized in table S5). In particular, WAT and INV commonly have a marked negative effect on both regional-level COD (P = 0.009 and P = 0.141 for WAT and INV, respectively) and NH 4 + -N (P = 0.004 and P = 0.260 for WAT and INV, respectively) concentrations of water bodies. Two factors of human pressure typically show a significant positive effect on COD (P = 0.015 and P = 0.023 for POP and GDP, respectively) and NH 4 + -N (P < 0.001 for both) concentrations.
The results derived from clustering and regression analyses can be jointly used to further explain regional variations in inland water pollution under anthropogenic pressures, water quality improvement efforts, and different environmental conditions across China. The left and the right subclusters in Fig. 6B explicitly depict the differ-ence in driving factors, resulting in regionally distinct water quality, between north and south China (see Fig. 1). In general, owing to the limited environmental conditions, inland surface water quality in north basins is likely less tolerant and more susceptible to human disturbance and its fluctuation. Hence, the impact of high-density demographic and socioeconomic activities with respect to environ-mental conditions in most of the northern areas is not yet completely offset by roughly similar environmental investment (fig. S5), espe-
cially in HaR with the highest GDP and POP, and relatively much lower WAT (table S5).
Implications for future environmental effortsWhile previous research has shown that improved water quality might occur across specified water bodies (25) and diverse regions (35), there is still lack of evidence for direct linkage between inland water quality and anthropogenic pollution sources over the whole country, which is very important to future water quality improve-ment efforts. This study, to the best of our knowledge, provides the first comprehensive assessment of how China’s inland surface water quality responds to multiple driving forces over space and time based on nationwide observations of water quality indicators and multiple impact factors. Our findings confirm the effectiveness of massive environmental efforts aimed at pollution discharge control
Fig. 5. Quantitative relationships between annual estimates of observed regional-level COD and NH 4 + -N concentrations and anthropogenic pollution discharge loadings (with respect to the volume of local surface water resources) among 10 major river basins circa 2015. (A) COD. (B) NH 4 + -N. Both were fitted by a power law model. Red and blue dots and lines represent observed data and fitted results for Qm and Qa (here, both are annual average concentrations in 2015–2017), respectively. Dashed lines link the paired observations of Qm and Qa in the same basin. Basins are labeled according to Qm. Gray areas represent the 95% confidence intervals (CI).
GR
E
WA
T
PR
E
INV
PO
P
GD
P0
1
2
3
4
5A
SeR
PeR Sw
RY
aRH
aRN
wR
HuR
LiR
SoR
YeR
0
1
2
3
4
5
6B
Fig. 6. Similarity of impact factors for 10 major river basins circa 2015. (A) Cluster dendrogram of impact factors of water quality based on the distance metrics over 10 basins. (B) Hierarchical clustering of 10 basins based on the distance metrics among multiple impact factors. WAT, surface water resource per unit area; PRE, average annual precipitation; GRE, the percent of green cover (including forest land and grassland with >20% of cover degree); POP, population density per unit of surface water resource; GDP, gross domestic product density per unit of surface water resource; INV, the proportion of environmental investment accounting for GDP. All data for clustering analysis are listed in table S5.
on June 7, 2020http://advances.sciencem
ag.org/D
ownloaded from

Ma et al., Sci. Adv. 2020; 6 : eaau3798 3 January 2020
S C I E N C E A D V A N C E S | R E S E A R C H A R T I C L E
7 of 10
and water quality improvement over the past 15 years, notwithstanding growing pressures from human activity. Taken as a whole, reduced pollution discharges from the industrial and both the urban and rural domestic sectors primarily contributed to a notable improve-ment in surface water quality in most of China’s inland water bodies. On the other hand, our estimates could provide potential insights into water management strategies for further reducing pollution loadings and improving water quality in accordance with imple-mentations of two important acts including the most stringent water resources management system (known as the “Three Redlines”) (39) and the water pollution control action plan (known as the “Water Ten Plan”) (40) issued by the central government for con-trolling water use and pollution discharge and improving water use efficiency and water quality at both regional and national levels for 2020 and 2030.
First, we note that increasing pollution discharges from the live-stock sector constitute the largest for COD and a major pollution source for NH 4 + -N in the nation and most of major river basins (Fig. 3 and fig. S4) and hence imply that the scope of current environ-mental efforts should be extended from the control of point to non-point sources (25, 41, 42), particularly for the control of livestock farming–derived water pollution, given that the production of live-stock food products is expected to increase markedly to meet the needs of rising per capita consumption in the coming decades (43).
Second, although having a significant trend toward decreased pollution discharges, the urban sector is still the major pollution source and faces escalating pressure resulting from sustained rural- urban migration coupled with rapid urbanization (fig. S1F and table S1). This means that continuously increasing investment for environ-mental facilities and sanitization will be required for all urbanized and urbanizing areas. Although having contributed to declines in COD and NH 4 + -N concentrations due to nationwide rural depopula-tion and the improved rate of access to sanitary toilets, the rural residential sector is still the largest source of pollution discharges at the country level and in most of basins. Hence, improvement in sanitation facilities of rural domestic wastewater is a key issue for local water quality in the ongoing reconstruction of rural communities and the consolidation of rural lands (44).
Third, given the regional differences in driving factors and pollution status across the whole country, more flexible measures and strategies for pollution prevention and control would likely yield further improvement of inland surface water quality in China. For instance, higher standards of sewage discharge in terms of pollutant concentration controls are certainly desirable for the northern basins (HaR, HuR, YeR, SoR, and LiR) owing to lower environmental capability and high-density human development (Fig. 6 and tables S1 and S5). The limited growth of human pressures, especially in terms of land-use conversion, is important for the NwR and SwR basins with less anthropogenic disturbance and favorable status of water quality. Moreover, enhancement in green cover and restoration of ecosystem services in relatively highly polluted northern regions can also be potentially beneficial for local inland water quality (35).
Fourth, note that the current situation of water quality in the HaR basin, in comparison with other basins, shows an unexpected level notwithstanding marked decreases in pollution discharges from all major anthropogenic sources and the highest proportional environmental investment over the past decade (Fig. 5, fig. S4, and
table S5). In this water-poor region with high-density human activity, further aquatic pollution alleviation remains a big challenge in the next decade.
In addition to the management of sector-specific forces and region-specific driving factors, regional differences in current surface water quality should be taken into account in assessing the geographic mismatch between surface freshwater demand and avail-ability (i.e., water scarcity) by combining sectoral water quality requirements in conjunction with local water quality (45). The quality-included measure of water scarcity would be beneficial to a more comprehensive view for alleviation of water stress by physical and virtual water transfers across regions (46). Interregional varia-tion in water quality will certainly aggravate the regional inequality of water stress in China (47) and particularly worsen water scarcity for northern basins. In these regions, aquatic environmental resto-ration, improvement in water use efficiency, control of pollution discharges, interbasin water transfers, and reduction in outsourcing of pollution-intensive goods from other regions (48) probably play pivotal roles in the alleviation of water stress to meet local freshwater demands in terms of both quantity and quality.
In conclusion, we believe that China’s inland surface waters will achieve good ecological status in the near future if the current trends hold. Further improvements are both possible and desirable, and the implementation of measures and strategies for water pollu-tion mitigation and control should be guided by the relationships between water quality dynamics and the diverse driving factors and their regional variations noted in this article.
MATERIALS AND METHODSWater quality monitoring dataFrom the National Environmental Monitoring Network (NEMN), we assembled monthly observations of COD, NH 4 + -N, and DO concentrations across 10 major river basins from the water quality sampling sites (as shown in Fig. 1), which cover China’s major inland rivers and lakes for the period 2003–2017. In NEMN, the site selection, the determination of sampling time and the number of samples taken, the procedure of sample collection, and the measure-ment method of three water quality indicators were compiled using the Technical Specifications Requirements for Monitoring of Surface Water and Wastewater in China (49), one of China’s environmental protection industry standards issued by Ministry of Ecology and Environment, for guidance. The level of water quality was determined by the Environmental Quality Standard for Surface Water in China (50). Reservoirs that provide potable water sources are excluded in this study because of restricted human activity.
Trend analysis for water quality dataWe calculated quartiles of monthly mean COD, NH 4 + -N, and DO concentrations from the regional assemblage of site-level measure-ments for every target region. We then individually composed five regional-level time series of monthly average concentration for three water quality indicators including Q1 (lower quartile, the median of the lower half of the data), Q2 (median of all measure-ments), Q3 (upper quartile, the median of the upper half of the data), Qa (the arithmetic mean of all measurements), and Qm. Qm is the maximum after the removal of upper outliers, which were defined as larger than Q3 + 1.5 × IQR (the interquartile range, i.e., Q3 − Q1).
on June 7, 2020http://advances.sciencem
ag.org/D
ownloaded from

Ma et al., Sci. Adv. 2020; 6 : eaau3798 3 January 2020
S C I E N C E A D V A N C E S | R E S E A R C H A R T I C L E
8 of 10
We next used a seasonal-trend decomposition procedure based on locally weighted scatterplot smoothing [STL; (51)] to eliminate irregular components and streamflow and other influences caused by seasonal fluctuations in original time series of concentration data. The STL method decomposes monthly observation data into three components: trend, seasonal, and remainder. We finally obtain the five time series (i.e., Q1, Q2, Q3, Qa, and Qm) of annual mean concentrations for COD, NH 4 + -N, and DO for all target areas by averaging the monthly trend component retrieved by the STL method. Missing values for individual time series were interpolated using a cubic spline function. The time series of the annual observed proportion of water quality superior to level IV for COD, NH 4 + -N, and DO in each region were obtained by counting the yearly frequency of different levels of observed monthly mean concentrations accord-ing to the water quality standards for inland surface waters in China (as presented in Fig. 1) (50). In this study, we used the Theil-Sen estimator, which supports robust fitting, to quantify the linear trend in annual time series data (Fig. 2 and tables S2 and S3). The statistical significance was determined using the two-tailed Mann-Kendall trend test.
Anthropogenic discharge data and impact variablesVarious human actions can significantly impact the dynamics of observed COD and NH 4 + -N concentrations in inland water bodies. In this study, we assembled a province-level dataset of anthropo-genic pollution discharges covering six major sectors in China: industry, urban residential, rural residential (including domestic wastewater and excrement, separated for COD and combined for NH 4 + -N, due to the minor volume of excrement for NH 4 + -N), aquaculture, livestock farming, and crop farming (for NH 4 + -N only). Details regarding data sources and estimation approaches are sum-marized and explained in Supplementary Text. In addition, the sources and features of all of the maps and ancillary data used in this study are also provided in Supplementary Text.
Our analyses were carried out for the nation and the major groundwater basins. We used a land-use area-weighted method to transform administrative boundary-based statistical and census data to basin-level estimates of various anthropogenic driving factors of observed COD and NH 4 + -N concentrations of surface water bodies. First, we obtained a composite map by overlaying two boundary maps of province-level units and water basins. Second, we separately counted the area of different types of land use for every intersected unit on the composite map. Third, we disaggregated province-level variable data into intersected units according to land-use areas of specified types. Last, we summed variable data for all target basins from intersected units located within the same basin. Land-use information was obtained for 5-year periods from nationwide land-use data with a spatial resolution of 100 m that were published in 2000, 2005, 2010, and 2015. We used linear regression–based interpolation and extrapolation to build an annual time series of land-use data to match the data for other variables. Various types of land-use data were separately used for disaggregating different province-level variable data including anthropogenic dis-charge, population, and environmental investment into basin-level units: urban and built-up lands (including factories and mines, industrial districts, and oilfields) for the industrial sector, urban land for the urban residential sector, rural land for the rural residential sector and livestock farming sector, rain-fed and irrigated croplands
for the crop farming sector, and selected water bodies (including lakes, reservoirs, and ponds) for the aquaculture sector.
Basin-level GDP data were obtained through weighted propor-tional allocation, as addressed above, using satellite-derived nighttime light data because of the well-documented significant quantitative relationship between GDP and anthropogenic nocturnal brightness at the regional level. Detailed information regarding data process-ing and analysis of nighttime lights can be found in (52). Moreover, the regional averaging method was used to obtain precipitation information and the rate of access to sanitary toilets for rural residents for target basins, based on site-level observations and province-level statistical data, respectively. Statistical data for 2016 and 2017 are not yet available and were estimated by linear interpolation based on the last 2 years of data. The abovementioned strategy, i.e., a propor-tional sharing method based on the area of different land-use types, was also used in mapping the spatial distributions of anthropogenic discharges of COD and NH 4 + -N in 2003 and 2015 at the grid cell level with a spatial resolution of 10 km by 10 km (as shown in Fig. 4) in the Albers equal-area conic projection spatial reference system.
Statistical analysis for the connection between water quality dynamics and driving factorsWe used a GLM (here using Gaussian family with log link) to inves-tigate the quantitative response of observed inland water quality dynamics to anthropogenic pollution discharges from various sectors. A notable advantage of GLM is that response variables (i.e., the observed COD and NH 4 + -N concentrations) can be transformed to improve linearity and homogeneity of variance for a better quantita-tive estimate of how changes in sectoral discharges affect the observed inland water quality dynamics at the regional level.
To eliminate the effect of multicollinearity among explanatory variables in the GLM analysis, we applied the PCA to convert sector-specific discharge into a set of linear combinations. All of the principal components were used in the GLM analysis. The first principal component, generally having the maximum contribution (except COD for Qm in NwR, SwR, and PeR; COD for Qa in SeR and PeR; NH 4 + -N for Qm in NwR; and NH 4 + -N for Qa in NwR and SeR) for explaining annual variation of COD and NH 4 + -N concen-trations determined by type II analysis of variance (ANOVA) in the GLM results, was selected for multiple comparisons of the effects of explanatory variables on observed water quality dynamics. The relative magnitude of each explanatory variable was quantified by principal component loadings (as shown in Fig. 4, C and D, and table S4).
Furthermore, it should be pointed out that the anthropogenic non-point source loadings of pollution for inland water bodies were determined not only by the volume of pollution discharges but also by the geophysical conditions, such as geomorphology, surface run-off, land cover, and river network. In this study, we mainly focused on quantifying the impacts of changes in various human activities on the water quality dynamics, while geophysical conditions were assumed to be unchanged within basins over the observational period for a large-scale investigation.
In addition, the hierarchical cluster method was applied for ana-lyzing similarities between six general driving factors (Fig. 6A) and 10 major river basins (Fig. 6B) based on distance metrics (Euclidean distance after scaling) over basins and among multiple impact factors, respectively. To reduce the impact of collinearity, we used
on June 7, 2020http://advances.sciencem
ag.org/D
ownloaded from

Ma et al., Sci. Adv. 2020; 6 : eaau3798 3 January 2020
S C I E N C E A D V A N C E S | R E S E A R C H A R T I C L E
9 of 10
linear ridge regression to quantify the relationships between general driving factors and NH 4 + -N and COD concentrations over 10 major river basins (data are listed in table S5). All aforementioned data processing and statistical analyses were performed in Esri’s ArcGIS and the R (with packages of stats, zyp, car, gvlma, pvclust, and ridge) software environments.
SUPPLEMENTARY MATERIALSSupplementary material for this article is available at http://advances.sciencemag.org/cgi/content/full/6/1/eaau3798/DC1Supplementary TextFig. S1. National-level changes in multiple driving factors of inland water quality in China during the period 2003–2015.Fig. S2. Observed changes in water quality measures for five time series across 10 basins during the period 2003–2017.Fig. S3. Interannual variability in percentages of five water quality levels limited by site-level records of water quality measures for 10 basins during the period 2003–2017.Fig. S4. Changes in anthropogenic pollution discharges from different sectors across 10 basins during the period 2003–2017.Fig. S5. Changes in the volume of environmental investment and the rate of access to sanitary toilets for rural residents across 10 basins during the period 2003–2015.Fig. S6. The relationships between environmental investments and declining pollution emissions and changes in the discharge levels between 2003 and 2015 across 10 basins.Table S1. Summary of the distinguishing characteristics of 10 basins delineated in this study.Table S2. Summary of analysis results of trends in water quality indicators during the period 2003–2017 across China and 10 basins.Table S3. Summary of analysis results of trends in the proportion of water quality levels I + II + III for water quality indicators for the period 2003–2017 across China and 10 basins.Table S4. Coefficients of the first component derived from PCA of loading sources and used for the explained variances estimated by type II ANOVA in both the Qm and Qa time series of COD and NH 4 + -N concentrations from 2003–2017 across 10 basins.Table S5. Summary of impact factors of local inland surface water quality across 10 basins.
REFERENCES AND NOTES 1. O. Varis, P. Vakkilainen, China’s 8 challenges to water resources management in the first
quarter of the 21st Century. Geomorphology 41, 93–104 (2001). 2. J. Liu, J. Diamond, China’s environment in a globalizing world. Nature 435, 1179–1186
(2005). 3. C. K. Chan, X. Yao, Air pollution in mega cities in China. Atmos. Environ. 42, 1–42 (2008). 4. K.-m. Zhang, Z.-g. Wen, Review and challenges of policies of environmental protection
and sustainable development in China. J. Environ. Manage. 88, 1249–1261 (2008). 5. J. Liu, S. Li, Z. Ouyang, C. Tam, X. Chen, Ecological and socioeconomic effects of China's
policies for ecosystem services. Proc. Natl. Acad. Sci. U.S.A. 105, 9477–9482 (2008). 6. A. Jalil, M. Feridun, The impact of growth, energy and financial development
on the environment in China: A cointegration analysis. Energ. Econ. 33, 284–291 (2011).
7. J. Liu, W. Yang, Water sustainability for China and beyond. Science 337, 649–650 (2012). 8. J. Liu, C. Zang, S. Tian, J. Liu, H. Yang, S. Jia, L. You, B. Liu, M. Zhang, Water conservancy
projects in China: Achievements, challenges and way forward. Global Environ. Chang. 23, 633–643 (2013).
9. C. Wu, C. Maurer, Y. Wang, S. Xue, D. L. Davis, Water pollution and human health in China. Environ. Health Perspect. 107, 251–256 (1999).
10. M. Shao, X. Tang, Y. Zhang, W. Li, City cluster in China: Air and surface pollution. Front. Ecol. Environ. 4, 353–361 (2006).
11. B. Qin, P. Xu, Q. Qu, L. Luo, Y. Zhang, Environmental issues of Lake Taihu, China. Hydrobiologia 581, 3–14 (2007).
12. S. Khan, Q. Cao, Y. M. Zheng, Y. Z. Huang, Y. G. Zhu, Health risks of heavy metals in contaminated soils and food crops irrigated with wastewater in Beijing, China. Environ. Pollut. 152, 686–692 (2008).
13. Y. Jiang, China’s water scarcity. J. Environ. Manage. 90, 3185–3196 (2009). 14. L.-J. Bao, K. A. Maruya, S. A. Snyder, E. Y. Zeng, China’s water pollution by persistent
organic pollutants. Environ. Pollut. 163, 100–108 (2012). 15. A. Ebenstein, The consequences of industrialization: Evidence from water pollution
and digestive cancers in China. Rev. Econ. Stat. 94, 186–201 (2012). 16. Y. Hu, H. Cheng, Water pollution during China's industrial transition. Environ. Dev. 8,
57–73 (2013). 17. W. Li, X. Li, J. Su, H. Zhao, Sources and mass fluxes of the main contaminants in a heavily
polluted and modified river of the North China Plain. Environ. Sci. Pollut. Res. 21, 5678–5688 (2014).
18. O. Varis, M. Kummu, C. Lehr, D. Shen, China's stressed waters: Societal and environmental vulnerability in China's internal and transboundary river systems. Appl. Geog. 53, 105–116 (2014).
19. Y. Lu, S. Song, R. Wang, Z. Liu, J. Meng, A. J. Sweetman, A. Jenkins, R. C. Ferrier, H. Li, W. Luo, T. Wang, Impacts of soil and water pollution on food safety and health risks in China. Environ. Int. 77, 5–15 (2015).
20. Q. Wang, Z. Yang, Industrial water pollution, water environment treatment, and health risks in China. Environ. Pollut. 218, 358–365 (2016).
21. X. Zhang, J. Liu, Y. Tang, X. Zhao, H. Yang, P. W. Gerbens-Leenes, M. T. H. van Vilet, J. Yan, China’s coal-fired power plants impose pressure on water resources. J. Clean. Prod. 161, 1171–1179 (2017).
22. L. Jin, G. Zhang, H. Tian, Current state of sewage treatment in China. Water Res. 66, 85–98 (2014).
23. Z. Ouyang, H. Zheng, Y. Xiao, S. Polasky, J. Liu, W. Xu, Q. Wang, L. Zhang, Y. Xiao, E. Rao, L. Jinag, F. Lu, X. Wang, G. Yang, S. Gong, B. Wu, Y. Zeng, W. Yang, G. C. Daily, Improvements in ecosystem services from investments in natural capital. Science 352, 1455–1459 (2016).
24. Q. H. Zhang, W. N. Yang, H. H. Ngo, W. S. Guo, P. K. Jin, M. Dzakpasu, S. J. Yang, Q. Wang, X. C. Wang, D. Ao, Current status of urban wastewater treatment plants in China. Environ. Int. 92-93, 11–22 (2016).
25. Y. Tong, W. Zhang, X. Wang, R.-M. Couture, T. Larssen, Y. Zhao, J. Li, H. Liang, X. Liu, X. Bu, W. He, Q. Zhang, Y. Lin, Decline in Chinese lake phosphorus concentration accompanied by shift in sources since 2006. Nat. Geosci. 10, 507–511 (2017).
26. H.-p. Qin, Q. Su, S.-T. Khu, N. Tang, Water quality changes during rapid urbanization in the Shenzhen River Catchment: An integrated view of socio-economic and infrastructure development. Sustainability 6, 7433–7451 (2014).
27. X. Zhai, J. Xia, Y. Zhang, Water quality variation in the highly disturbed Huai River Basin, China from 1994 to 2005 by multi-statistical analyses. Sci. Total Environ. 496, 594–606 (2014).
28. M. Dou, Y. Zhang, G. Li, Temporal and spatial characteristics of the water pollutant concentration in Huaihe River Basin from 2003 to 2012, China. Environ. Monit. Assess. 188, 522 (2016).
29. X. Liu, J. Feng, Y. Qiao, Y. Wang, L. Zhu, Assessment of the effects of total emission control policies on surface water quality in China: 2004 to 2014. J. Environ. Qual. 46, 605–613 (2017).
30. S. Li, S. Gu, W. Liu, H. Han, Q. Zhang, Water quality in relation to land use and land cover in the upper Han River Basin, China. Catena 75, 216–222 (2008).
31. J. Wang, L. Da, K. Song, B.-L. Li, Temporal variations of surface water quality in urban, suburban and rural areas during rapid urbanization in Shanghai, China. Environ. Pollut. 152, 387–393 (2008).
32. F. Huang, X. Wang, L. Lou, Z. Zhou, J. Wu, Spatial variation and source apportionment of water pollution in Qiantang River (China) using statistical techniques. Water Res. 44, 1562–1572 (2010).
33. J. Xia, Y.-Y. Zhang, C. Zhan, A. Z. Ye, Water quality management in China: The case of the Huai River Basin. Water Res. Devel. 27, 167–180 (2011).
34. J. Zhao, G. Fu, K. Lei, Y. Li, Multivariate analysis of surface water quality in the Three Gorges area of China and implications for water management. J. Environ. Sci. 23, 1460–1471 (2011).
35. Y. Zhou, J. Ma, Y. Zhang, B. Qin, E. Jeppesen, K. Shi, J. D. Brookes, R. G. M. Spencer, G. Zhu, G. Gao, Improving water quality in China: Environmental investment pays dividends. Water Res. 118, 152–159 (2017).
36. China Environmental Statistical Yearbook, 2003–2015 (National Bureau of Statistics and Ministry of Ecology and Environment of China, 2003–2015).
37. Annual Statistic Report on Environment in China, 2011–2015 (Ministry of Ecology and Environment of China, 2011–2015).
38. China Environmental Quality Bulletin, 2003–2016 (Ministry of Ecology and Environment of China, 2003–2016).
39. Opinions of the State Council on the Implementation of the Most Stringent Water Resources Management (State Council of China, 2012).
40. Water Pollution Control Action Plan (State Council of China, 2015). 41. E. D. Ongley, Z. Xiaolan, Y. Tao, Current status of agricultural and rural non-point source
pollution assessment in China. Environ. Pollut. 158, 1159–1168 (2010). 42. B. Sun, L. Zhang, L. Yang, F. Zhang, D. Norse, Z. Zhu, Agricultural non-point source
pollution in China: Causes and mitigation measures. Ambio 41, 370–379 (2012). 43. J. Kearney, Food consumption trends and drivers. Phil. Trans. R. Soc. B 365, 2793–2807
(2010). 44. H. Long, Y. Li, Y. Liu, M. Woods, J. Zou, Accelerated restructuring in rural China fueled by
‘increasing vs. decreasing balance’ land-use policy for dealing with hollowed villages. Land Use Policy 29, 11–22 (2012).
45. M. T. H. van Vliet, M. Flörke, Y. Wada, Quality matters for water scarcity. Nat. Geosci. 10, 800–802 (2017).
on June 7, 2020http://advances.sciencem
ag.org/D
ownloaded from

Ma et al., Sci. Adv. 2020; 6 : eaau3798 3 January 2020
S C I E N C E A D V A N C E S | R E S E A R C H A R T I C L E
10 of 10
46. X. Zhao, J. Liu, Q. Liu, M. R. Tillotson, D. Guan, K. Hubacek, Physical and virtual water transfer for regional water stress alleviation in China. Proc. Natl. Acad. Sci. U.S.A. 112, 1031–1035 (2015).
47. S. Sun, C. Fang, J. Lv, Spatial inequality of water footprint in China: A detailed decomposition of inequality from water use types and drivers. J. Hydrol. 553, 398–407 (2017).
48. X. Zhao, J. Liu, H. Yang, R. Duarte, M. R. Tillotson, K. Hubacek, Burden shifting of water quantity and quality stress from megacity Shanghai. Water Resour. Res. 52, 6916–6927 (2016).
49. Technical Specifications Requirements for Monitoring of Surface Water and Wastewater (Ministry of Ecology and Environment of China, 2002).
50. Environmental Quality Standard for Surface Water in China (Ministry of Ecology and Environment of China, 2002).
51. R. B. Cleveland, W. S. Cleveland, J. E. McRae, I. Terpenning, STL: A seasonal-trend decomposition procedure based on loess. J. Off. Stat. 6, 3–33 (1990).
52. T. Ma, C. Zhou, T. Pei, S. Haynie, J. Fan, Quantitative estimation of urbanization dynamics using time series of DMSP/OLS nighttime light data: A comparative case study from China's cities. Remote Sens. Environ. 124, 99–107 (2012).
Acknowledgments: We would like to thank the anonymous reviewers for their insightful and helpful comments to improve the manuscript. Funding: This study was funded by the
Key Research Program of Frontier Science, Chinese Academy of Sciences (grant no. QYZDY-SSW-DQC007), the National Natural Science Foundation of China (grant nos. 41771418, 41590845, and 41421001), and the National Science and Technology Key Project (grant no. 2016YFB0502301). Author contributions: T.M. and C.Z conceived the study. Y.N. and L.H. undertook the processing of water quality data. T.M., N.Z., J.Y., Y.D., T.P., C.S., and W.C. undertook the collection, processing, and calculation of pollution discharge data. T.M., N.Z., Y.N., J.Y., J.P.W., and C.Z. analyzed and interpreted the data and results. T.M., N.Z., and J.P.W. wrote the paper with contributions by all authors. Competing interests: The authors declare that they have no competing interests. Data and materials availability: All data needed to evaluate the conclusions in the paper are present in the paper and/or the Supplementary Materials. Additional data related to this paper may be requested from the authors.
Submitted 5 June 2018Accepted 7 November 2019Published 3 January 202010.1126/sciadv.aau3798
Citation: T. Ma, N. Zhao, Y. Ni, J. Yi, J. P. Wilson, L. He, Y. Du, T. Pei, C. Zhou, C. Song, W. Cheng, China’s improving inland surface water quality since 2003. Sci. Adv. 6, eaau3798 (2020).
on June 7, 2020http://advances.sciencem
ag.org/D
ownloaded from

China's improving inland surface water quality since 2003
ChengTing Ma, Na Zhao, Yong Ni, Jiawei Yi, John P. Wilson, Lihuan He, Yunyan Du, Tao Pei, Chenghu Zhou, Ci Song and Weiming
DOI: 10.1126/sciadv.aau3798 (1), eaau3798.6Sci Adv
ARTICLE TOOLS http://advances.sciencemag.org/content/6/1/eaau3798
MATERIALSSUPPLEMENTARY http://advances.sciencemag.org/content/suppl/2019/12/20/6.1.eaau3798.DC1
REFERENCES
http://advances.sciencemag.org/content/6/1/eaau3798#BIBLThis article cites 45 articles, 4 of which you can access for free
PERMISSIONS http://www.sciencemag.org/help/reprints-and-permissions
Terms of ServiceUse of this article is subject to the
is a registered trademark of AAAS.Science AdvancesYork Avenue NW, Washington, DC 20005. The title (ISSN 2375-2548) is published by the American Association for the Advancement of Science, 1200 NewScience Advances
License 4.0 (CC BY-NC).Science. No claim to original U.S. Government Works. Distributed under a Creative Commons Attribution NonCommercial Copyright © 2020 The Authors, some rights reserved; exclusive licensee American Association for the Advancement of
on June 7, 2020http://advances.sciencem
ag.org/D
ownloaded from