environmental scanning - sage publications · environmental scanning ... affect its capabilities to...
TRANSCRIPT

1
Environmental Scanning
A marketing-oriented firm looks outwards to the environment in which it operates,adapting to take advantage of emerging opportunities and to minimise potential threats.In this section we shall examine the marketing environment, and how to monitor it. Inparticular, we shall look at some of the major forces acting on companies, such as theeconomic, social, legal, physical and technological issues which affect corporate activities.
The marketing environment consists of the actors and forces that affect a company’scapability to operate effectively in providing products and services to its customers. It isuseful to classify these forces into the micro-environment and the macro-environment.The micro-environment consists of the actors in the firm’s immediate environment thataffect its capabilities to operate effectively in its chosen markets. The key actors aresuppliers, distributors, customers and competitors.
The macro-environment consists of a number of broader forces that affect not only thecompany but also the other actors in the micro-environment. These can be groupedunder economic, social, legal, physical and technological forces. These shape the characterof the opportunities and threats facing a company, and yet are largely uncontrollable.
The process of monitoring and analysing the marketing environment of a companyis called environmental scanning. Two key decisions that management need to makeare what to scan and how to organise the activity. Clearly, in theory every event in theword has the potential to affect a company’s operations but to establish a scanningsystem which covers every conceivable force would be unmanageable. The first task,then, is to define a feasible range of forces that require monitoring. These are the poten-tially relevant environmental forces that have the most likelihood of affecting futurebusiness prospects.The second prerequisite for an effective scanning system is to designa system which provides a fast response to events that are only partially predictableand emerge as surprises and grow very rapidly. This is essential because of the increasingturbulence of the marketing environment.Ansoff proposes that environmental scanningmonitors the company’s environment for signals of the development of strategic issueswhich can have an influence on company performance.
1 Line management functional managers (e.g. sales, marketing, purchasing) can be requiredto conduct environmental scanning in addition to their existing duties. This approach canfalter because of line management resistance to the imposition of additional duties, and thelack of specialist research and analytical skills required of scanners.
2 Strategic planner environment scanning is made part of the strategic planner’s job.The drawback of this approach is that a head-office planner may not have the depth ofunderstanding of a business unit’s operations to be able to do the job effectively.
3 Separate organisational unit regular and ad hoc scanning is conducted by a separateorganisational unit and is responsible for disseminating relevant information to managers.General Electrics use such a system with the unit’s operations funded by the informationrecipients. The advantage is that there is a dedicated team concentrating their efforts onthis important task. The disadvantage is that it is very costly and unlikely to be feasibleexcept for large, profitable companies.
Moutin-01.qxd 22/09/2007 1:49 PM Page 1
4 Joint line/general management teams a temporary planning team consisting of line andgeneral (corporate) management may be set up to identify trends and issues that may havean impact on the business. Alternatively, an environment tread or issue may have emergedwhich requires closer scrutiny. A joint team may be set up to study its implications.
The most appropriate organisational arrangement for scanning will depend on theunique circumstances facing a firm. A judgement needs to be made regarding the costsand benefits of each alternative. The size and profitability of the company and the per-ceived degree of environment turbulence will be factors which impinge on this decision:
Brownlie (1987) suggests that a complete environment scanning system wouldperform the following:
1 Monitor trends, issues and events and study their implications.2 Develop forecasts, scenarios and issues analysis as input to strategic decision-making.3 Provide a focal point for the interpretation and analysis of environmental information
identified by other people in the company.4 Establish a library or database for environmental information.5 Provide a group of internal experts on environmental affairs.6 Disseminate information on the business environment through newsletters, reports and
lectures.7 Evaluate and revise the scanning system itself by applying new tools and procedures.
The benefits of formal environmental scanning were researched by Diffenbach(1983), who found that practitioners believed that it provided the following:
1 Better general awareness of and responsiveness to environment changes.2 Better strategic planning and decision-making.3 Greater effectiveness in dealing with government.4 Improved industry and market analysis.5 Better foreign investment and international marketing.6 Improved resource allocation and diversification decisions.7 Superior energy planning.
Environmental scanning provides the essential informational input to strategic fitbetween strategy, organisation and the environment. Marketing strategy should reflectthe environment even if it means a fundamental organisation of operations.
(I) Problem 1.1 Environmental scanning procedure
Introductory comments
Like any other new programme, the scanning activity in a corporation evolves overtime. There is no way to introduce a foolproof system from the beginning. If conditionsare favourable, that is if there is an established system of strategic planning in placeand the CEO is interested in a structured effort at scanning, the evolutionary periodshortens, of course, but the state of the art may not permit the introduction of a fullydeveloped system at the outset. Besides, behavioural and organisational constraintsrequire that things be done over a period of time.
The level and type of scanning activity that a corporation undertakes should becustom designed, and a customised system takes time to emerge into a viable system.
Problems in Marketing
2
Moutin-01.qxd 22/09/2007 1:49 PM Page 2
Environmental Scanning
3
Figu
re 1
.1Li
nkin
g en
viron
men
tal s
cann
ing
to c
orpo
rate
strate
gy.
Inpu
ts fro
min
terna
len
viron
men
t
Inpu
ts fro
mop
erati
ngen
viron
men
t
Stra
tegic
actio
n
Stra
tegic
actio
n
Stra
tegic
actio
n
Fore
cast
Fore
cast
Fore
cast
Analy
se
Unde
rtake
Delin
eate
Seek
expo
sure
to
Broa
dtre
nds
Relev
ant
trend
s
In-d
epth
analy
sis o
f the
signi
fican
ceof
tren
ds
Impa
ct on
prod
uct\
mar
ket
Prod
uct\m
arke
tm
omen
tum
with
out
trend
s
Prod
uct/
mar
ket
mom
entu
mwi
th tr
ends
Dire
ction
of
trend
s in
the
futu
re
New
oppo
rtuni
ties
Corp
orate
strate
gy
Analy
se
Exter
nal
envir
onm
ent
• pol
itica
l• s
ocial
• e
cono
mic
• reg
ulato
ry• t
echn
olog
ical
Moutin-01.qxd 22/09/2007 1:49 PM Page 3

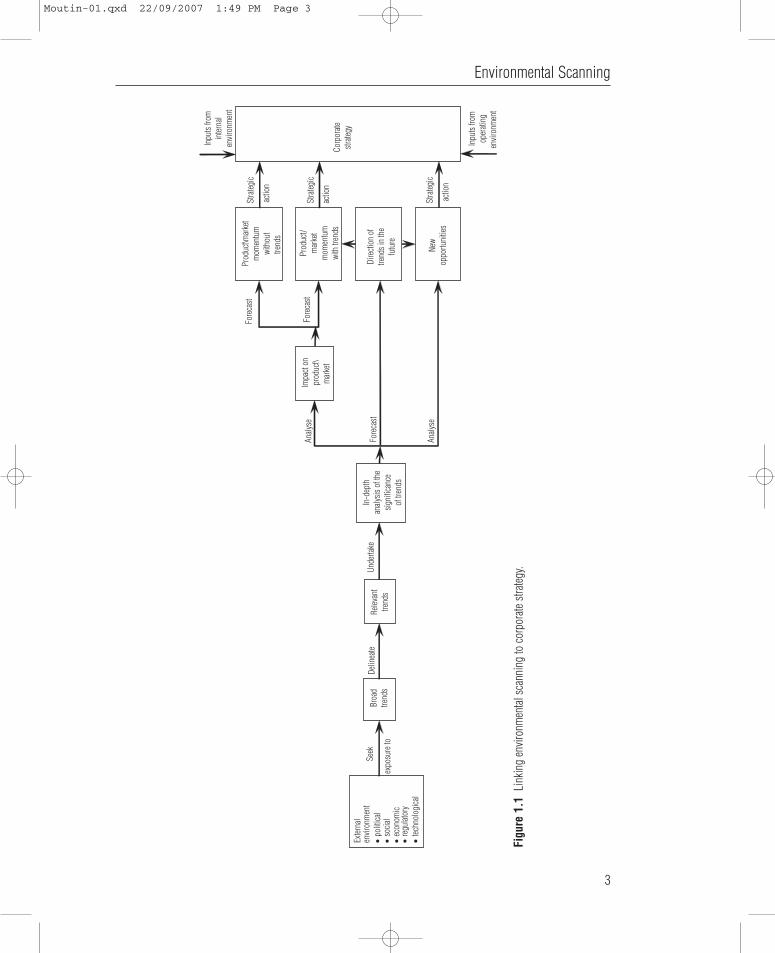
Figure 1.1 shows the process by which environmental scanning is linked to marketingstrategy. Listed below are the procedural steps which explain this relationship.
1 Keep a tab on broad trends appearing in the environment. Once the scope of environmentalscanning is determined, broad trends in the chosen areas may be reviewed from time totime. For example, in the area of technology, trends in mastery of energy, material science,transportation capability, mechanisation and automation, communications and informationprocessing, and control over natural life may be studied.
2 Determine the relevance of an environmental trend. Not everything happening in theenvironment may be relevant for a company. Therefore attempts must be made to selectthose trends in the environment which have significance for the company. There cannotbe any hard-and-fast rules for making a distinction between ‘relevant’ and ‘irrelevant’.Consider, for example, the demise of the steam locomotive industry. Perhaps itsconstituencies would have been more receptive to changes had these come from withinthe industry itself.
I would hypothesise that if the new threat is very similar to a firm’s traditional wayof meeting consumer needs, such as the turbine-powered automobile being similar tothe internal combustion-powered automobile, then management often would perceivethe new development as threatening. However, if it meets consumer needs in verydifferent ways, it is less likely to be recognised at an early point. For instance, I suspectthat one of the major threats to the future growth of commercial airlines is originatingnot with transportation companies, but rather with communication firms. I am thinkingin particular of the US Telephone and Telegraph’s development of the ‘television phone’.As that product is perfected and as the costs of using it are lowered, it may eliminatecompletely the need for many business flights, and consequently substantially impactupon the future growth of airlines.
Management’s creativity and farsightedness would play an important role in a company’sability to pinpoint the relevant areas of concern. Described below is one way (for a largecorporation) of identifying relevant trends in the environment:
• Place a senior person in charge of scanning.• Identify a core list of about 100 relevant publications worldwide.• Assign these publications to volunteers within the company, one per person. Selected
publications considered extremely important should be scanned by the scanningmanager.
• Each scanner reviews stories/articles/news items in the assigned publication that meetpredetermined criteria, based on the company’s aims. Scanners might also reviewbooks, conference proceedings, lectures and presentations.
• The scanned information is given a predetermined code. For example, a worldwideconsumer goods company used the following codes: subject (e.g. politics); geography(e.g. Middle East); function (e.g. marketing); application (e.g. promotion, distribution);and ‘uniterm’ or keyword for organising the information. An abstract is prepared onthe story, and so forth, in a few lines.
• The abstract, along with the codes, is submitted to a scanning committee consisting ofseveral managers, to determine the relevance in terms of effect on corporate/SBU/product market strategy. An additional relevance code is added at this time.
• The codes and the abstract are computerised.• A newsletter is prepared to disseminate the information company-wide. Managers
whose areas are directly affected by the information are encouraged to contact thescanning department for further analysis.
3 Study the impact of an environmental trend on a product/market. An environmental trendcan pose either a threat or an opportunity for a company’s product/market; which one itwill turn out to be must be studied. The task of determining the impact of a change is theresponsibility of the SBU manager. Alternatively, it may by assigned to another executivewho is supposedly familiar with the product/market. If the whole subject appears
Problems in Marketing
4
Moutin-01.qxd 22/09/2007 1:49 PM Page 4

controversial, it may be safer to have an ad hoc committee look into it, or even consultants,either internal or external, may be approached. There is a good chance that a manager whohas been involved with a product or service for a good many years would look at any changeas a threat. He or she may therefore avoid the issue by declaring the impact to be irrele-vant at the outset. If such sabotage is feared, perhaps it would be better to rely on thecommittee or a consultant.
4 Forecast the direction of an environmental trend into the future. If an environmental trenddoes appear to have significance for a product/market, it is desirable to determine thecourse that the trend is likely to adopt in the future. In other words, attempts must be madeat environmental forecasting.
5 Analyse the momentum of the product/market business with the environmental trend.Assuming the company takes no action, what will be the shape of the product/marketperformance in the midst of the environmental trend and its direction into the future?The impact of an environmental trend is usually gradual. While it is helpful to be ‘first’ torecognise freedom of action, a serious effort would have to be undertaken to ‘open up’ linemanagers to new ideas and to encourage innovation in their plans.
CONDUCTING ENVIRONMENTAL SCANNING
Following the steps in Table 1.1 an attempt is made here to illustrate how specifictrends in the environment may be systematically scanned.
A literature search in the area of politics shows the following laws:
1 Eliminating inside directors.2 Requiring companies to meet the cost of ‘unfriendly’ proxy contests.3 Barring nominee ownership of stock.4 Reducing a company’s right to fire workers at will.5 Guarding worker privacy.6 Mandating due-process procedures for grievances.7 Disclosing lobbying efforts in detail.8 Requiring that all ad claims be substantiated.9 Publishing corporate actions that endanger workers or the environment.
Environmental Scanning
5
Table 1.1 Systematic approach to environmental scanning
1 Pick up events in different environments (via literature search)2 Delineate events of interest to the SBU in one or more of the following areas: production, labour, markets (house-
hold, business, government, foreign), finance, R&D. This could be achieved via trend-impact analysis of the events3 Undertake cross-impact analysis of the events of interest4 Relate the trends of the noted events to current SBU strategies in different areas5 Select the trends which appear either to provide new opportunities or to pose threats6 Undertake trends’ forecasts
Wild card predictionMost probable occurrenceConservative estimate
7 Develop three scenarios for each trend based on three types of forecast8 Pass on the information to strategists9 Strategists may repeat steps 4–7 and develop more specific scenarios vis-à-vis different products/markets. These
scenarios will then be incorporated in SBU strategy
Moutin-01.qxd 22/09/2007 1:49 PM Page 5

SCANNING TECHNIQUES
Environmental scanning has been implemented mainly with the use of conventionalmethodologies such as marketing research, economic indicators, demand forecastingand industry studies. But the use of such conventional techniques for environmentalscanning has not been without pitfalls, for two major reasons. One, these techniqueshave failed to provide reliable insights into the future. As Ewing has said, ‘the mostcareful and sophisticated forecasts of market demand have gone awry, and there isno technical improvement in sight that promises to change matters’. Two, thesetechniques, in any event, provide a narrow view of the environment:
Direct competition . . . is only one of the basic dimensions of the company’s total strategicenvironment. The competitive audit must be augmented by assessment of the broader govern-mental, social, economic, ideological and other forces which all influence the company’scharacter, purpose and strategies over the longer term. (J. Thomas Cannon (1972), Auditing thecompetition environment, in John W. Bonge and Bruce P. Coleman (eds), Concepts of CorporateStrategy, New York: Macmillan Co., pp. 263–4.)
Discussed below are a variety of techniques which have been adapted for use inenvironmental scanning.
Extrapolation procedures. These procedures require the use of information from thepast to explore the future. Obviously their use assumes that the future is some func-tion of the past. There are a variety of extrapolation procedures which range from asimple estimate of the future (based on past information) to regression analysis.
Historical analogy. Where past data cannot be used to scan an environmentalphenomenon, the phenomenon may be studied by establishing historical parallels withother phenomena. Assumed here is the availability of sufficient information on theother phenomena. The turning points in the progression of these phenomena becomethe guideposts for predicting the behaviour of the phenomenon under study.
Missing-link approach. The missing-link approach combines morphological analysisand the network method. Many developments and innovations that appear promisingand marketable may be held back because something is missing. Under such circum-stances this technique may be used to scan new trends to see if they provide answersto the missing links.
Model building. This technique emphasises construction of models followingdeductive or inductive procedures. Two types of models may be constructed: phe-nomenological models and analytic models. Phenomenological models identify trendsas a basis for prediction but make no attempt to explain the underlying causes.Analyticmodels seek to identify the underlying causes of change so that future developmentsmay be forecast on the basis of a knowledge of their causes.
Delphi technique. The Delphi technique is the systematic solicitation of expertopinion. Based on reiteration and feedback, this technique gathers opinions of a panelof experts on happenings in the environment.
Intuitive reasoning. This technique bases the future on the ‘rational feel’ of thescanner. Intuitive reasoning requires free thinking unconstrained by past experienceand personal biases. This technique, therefore, may provide better results when usedby freelance think tanks than when used by managers on the job.
Problems in Marketing
6
Moutin-01.qxd 22/09/2007 1:49 PM Page 6

Scenario building. This technique calls for developing a time-ordered sequence ofevents bearing a logical cause–effect relationship to one another. The ultimate forecastis based on multiple contingencies, each with its respective probability of occurrence.
Cross-impact matrices. When two different trends in the environment pointtowards conflicting futures, this technique may be used to study these trends simulta-neously for their effect. As the name implies, this technique uses a two-dimensionalmatrix, arraying one trend along the rows and the other along the columns. Some ofthe features of cross-impact analyses that make them attractive for strategic planningare that (1) they can accommodate all types of eventuality (social or technological,quantitative or qualitative, and binary events or continuous functions); (2) they rapidlydiscriminate important from unimportant sequences of developments; and (3) theunderlying rationale is fully retraceable from the analysis.
Morphological analysis. This technique requires identification of all possible ways toachieve an objective. For example, the technique can be employed to anticipate inno-vations and to develop the optimum configurations for a particular mission or task.
Network methods. There are two types of network method: contingency trees andrelevance trees. A contingency tree is simply a graphical display of logical relationshipsamong environmental trends that focuses on branch-points where several alternativeoutcomes are possible. A relevance tree is a logical network similar to a contingencytree, but drawn in a way that assigns degrees of importance to various environmentaltrends with reference to an outcome.
Problem – example
The marketing strategist of a consumer goods company may want to determine if thesetrends have any relevance for the company. To do so the marketing strategist willundertake trend-impact analysis. This will require the formation of a Delphi panel todetermine the desirability (0–1) technical feasibility (0–1), probability of occurrence(0–1) and probable time of occurrence of each event listed above. The panel may alsobe asked to suggest the area(s) which may be affected by each event that is production,labour, markets (household, business, government, foreign), finance, or R&D.
The above information about an event may be studied by managers in areas which,according to the Delphi panel, are likely to be affected by the event. If their consen-sus is that the event is indeed important, the scanning may continue (see Table 1.2).
Next, cross-impact analysis may be undertaken. This type of analysis is planned tostudy the impact of an event on other events. Where events are mutually exclusive,such analysis may not be necessary. But where an event seems to reinforce or inhibitother events, the cross-impact analysis is highly desirable for uncovering the truestrength of an event.
The cross-impact analysis amounts to studying the impact of an event (given its probability ofoccurrence) upon other events. The impact may be delineated either in qualitative terms (suchas critical, major, significant, slight or none) or in quantitative terms in the form of probabilities.
Table 1.3 shows how cross-impact analysis may be undertaken. The cross-impactratings or probabilities can best be determined with the help of another Delphi panel.To sharpen the analysis further, it may also be determined whether the impact of anevent on other events will be felt immediately or after a certain number of years.
Environmental Scanning
7
Moutin-01.qxd 22/09/2007 1:49 PM Page 7

Problems in Marketing
8
Table 1.2 Trend-impact analysis: an example
Event Requiring that all ad Reducing a company’s right claims be substantiated to fire workers at will
Desirability .8 .5Feasibility .6 .3Probability of occurrence .5 .1Probable time of occurrence 2003 2010Area(s) impacted Household markets Labour
Business markets FinanceGovernment marketsFinanceR&DProduction
Decision Carry on scanning Drop from further consideration
Note: Two to three rounds of Delphi would be needed to arrive at the above probabilities.
Event Probability of Impactoccurrence
(a) Eliminating .6 a b c d e f g h iinside directors
(b) Requiring companies .3 .3*to meet the costof ‘unfriendly’ proxy contests
(c) Barring nominee .5ownership of stock
(d) Reducing acompany’s right to fire .1workers at will
(e) Guarding worker privacy .4
(f) Mandating due-process procedures .3for grievances
(g) Disclosing lobbying .4efforts in detail
(h) Requiring that all ad .5claims be substantiated
(i) Publishing corporate .4 .7**actions that endangerworkers or theenvironment
Notes* This means that elimination of inside directors has no effect on the probability of event (b).** This means that if publishing corporate actions that endanger workers or the environment occurs (probability .4), the probability ofrequiring that all ad claims be substantiated increases from .5 to .7.
Table 1.3 Cross-impact analysis: an example
Moutin-01.qxd 22/09/2007 1:49 PM Page 8
The cross-impact analysis provides the ‘time’ probability of occurrence of an event and indicatesother key events which may be monitored to keep track of the first event. Cross-impact analysisis more useful for project-level scanning than for general scanning.
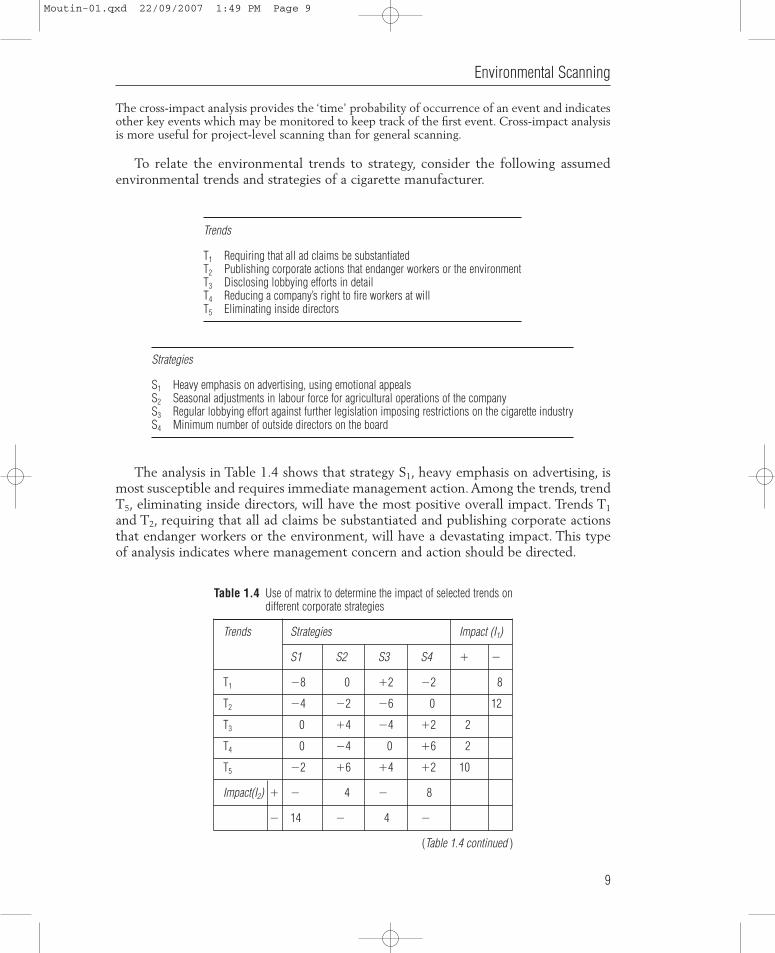
To relate the environmental trends to strategy, consider the following assumedenvironmental trends and strategies of a cigarette manufacturer.
Environmental Scanning
9
Trends
T1 Requiring that all ad claims be substantiatedT2 Publishing corporate actions that endanger workers or the environmentT3 Disclosing lobbying efforts in detailT4 Reducing a company’s right to fire workers at willT5 Eliminating inside directors
Strategies
S1 Heavy emphasis on advertising, using emotional appealsS2 Seasonal adjustments in labour force for agricultural operations of the companyS3 Regular lobbying effort against further legislation imposing restrictions on the cigarette industryS4 Minimum number of outside directors on the board
Table 1.4 Use of matrix to determine the impact of selected trends ondifferent corporate strategies
Trends Strategies Impact (I1)
S1 S2 S3 S4 � �
T1 �8 0 �2 �2 8
T2 �4 �2 �6 0 12
T3 0 �4 �4 �2 2
T4 0 �4 0 �6 2
T5 �2 �6 �4 �2 10
Impact(I2) � � 4 � 8
� 14 � 4 �
(Table 1.4 continued )
The analysis in Table 1.4 shows that strategy S1, heavy emphasis on advertising, ismost susceptible and requires immediate management action. Among the trends, trendT5, eliminating inside directors, will have the most positive overall impact. Trends T1
and T2, requiring that all ad claims be substantiated and publishing corporate actionsthat endanger workers or the environment, will have a devastating impact. This typeof analysis indicates where management concern and action should be directed.
Moutin-01.qxd 22/09/2007 1:49 PM Page 9

Thus, it will be desirable to undertake forecasts of trends T1 and T2. The forecasts maypredict when the legislation will be passed, what the major provisions of the legislationwill be, and so forth. Three different forecasts may be obtained:
1 Extremely unfavourable legislation.2 Most probable legislation.3 Most favourable legislation.
Three different scenarios (using three types of forecast) may be developed, indicatingthe impact of each trend. This information may then be passed on to product/marketmanagers for action. Product/market managers may repeat steps 4–7 (see Table 1.1) tostudy the selected trend(s) in depth.
Questions
1 Define both areas and discuss the link between the concepts of environmental scanning andstrategic planning.
2 Give and explain some examples of classic market opportunity analyses which haverecognised key environmental trends.
3 What are the organisational behaviour implications of environmental scanning, especiallywhen dealing with (1) responsibility; (2) key tasks to be implemented; and (3) staff trainingand motivation?
4 Describe and comment on the trend impact analysis approach as well as on the Delphitechnique.
(I) Problem 1.2 Assessing the social environment
Introductory comments
The ultimate test of a business is its social relevance.This is particularly true in a societywhere survival needs are already met. It therefore behoves the strategic planner to
Problems in Marketing
10
Table 1.4 continued
Scale
�8 Critical
�6 Major
�4 Significant
�2 Slight
0
�2 Slight
�4 Significant
�6 Major
�8 Critical
Enha
nce
the
impl
emen
tatio
nof
stra
tegy
Inhi
bit t
he im
plem
entat
ion
of s
trateg
y
�
�
Moutin-01.qxd 22/09/2007 1:49 PM Page 10

be familiar with emerging social trends and concerns. The relevance of the socialenvironment to a particular business will of course vary depending on the nature of thebusiness. For a technologically oriented business, the scanning of the social environmentwill be limited to aspects of pollution control and environmental safety. For a consumerproducts company, however, the impact of the social environment will go much further.
An important aspect of the business environment is the values people hold. In recentyears changes in these values have stimulated massive regulations, deep criticisms, newdemands and challenges of the very foundation on which business rests. For example,a substantial percentage of people in the USA are less and less willing to accept theimpartial operation of the market mechanism as the best way to allocate resources.They expect government to intervene on their behalf. Another interesting value shiftis what Daniel Bell calls the Revolution of Rising Entitlements, challenging the tradi-tional concept of egalitarianism. Equality had meant that conditions should permitindividuals, whatever, their origins, to make a life on the basis of ability and character.It was believed that everyone should have an equal place at ‘the starting line’. Morerecently the emphasis has shifted to the finish line, a guarantee of an equal outcomefor all. A central tenet of the new egalitarianism argues that because people are bornwith different natural abilities and are raised under different circumstances, not every-one approaches the starting line equally. In this light, it is argued, fairness and justicenecessitate equalisation of results.
Observers have noted many other value shifts that directly or indirectly influencebusiness. For example, people today seek self-gratification now rather than later. Theywant the good things of life immediately. They want to lead lives that are continuouslyimproving in quality. There is a growing attitude of cynicism towards authority. Thereseems to be an erosion of that part of the Protestant ethic that motivates people tohigh standards of work performance. People seem to want a more comfortable andless risky life. People are no longer willing to accept traditional rights of propertyownership but want to influence how property is used. Profit is no longer universallyaccepted as the end purpose of business. Society is coming more and more to expectthat societal interests be considered, as well as business self-interest, in pursuing profitobjectives. Some observers see in such trends a serious erosion of the fundamentalinstitutional values of the classical free enterprise system.
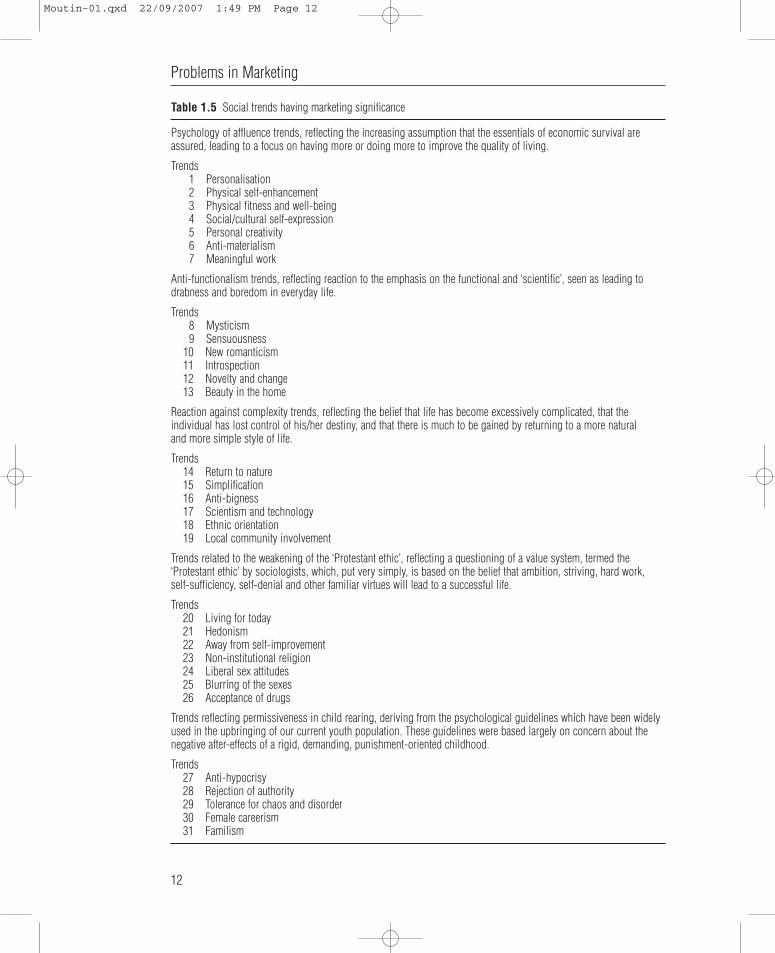
Information on social trends may be derived from published sources. The impactof social trends on a particular business can be studied in-house or with the help ofoutside consultants.A number of consulting firms specialise in making this kind of study.Table 1.5 shows 31 social trends which, according to the firm of Yankelovich, Skelleyand White, Inc., will have a tremendous effect on business in the coming years. One ofthese, female careerism (trend 30 in Table 1.5), is of particular interest to the retailindustry. This structural social change leads retailers to ask such questions as: Wheredoes the working wife like to do most of her shopping? What type of store does she prefer?How fashion-conscious is she? What sources of information does she use before she makesa purchase? What kinds of service does she expect retailers to provide?
A proprietary study on the subject (conducted for a major department store) withwhich the author was associated brought out interesting findings. It was found that ingeneral, working wives are better educated, are more experienced metropolitans andhave more sophisticated tastes than wives who do not work outside the home. Theirshopping behaviour is considerably different from that of the traditional woman shopper.
Environmental Scanning
11
Moutin-01.qxd 22/09/2007 1:49 PM Page 11
Problems in Marketing
12
Table 1.5 Social trends having marketing significance
Psychology of affluence trends, reflecting the increasing assumption that the essentials of economic survival areassured, leading to a focus on having more or doing more to improve the quality of living.
Trends1 Personalisation2 Physical self-enhancement3 Physical fitness and well-being4 Social/cultural self-expression5 Personal creativity6 Anti-materialism7 Meaningful work
Anti-functionalism trends, reflecting reaction to the emphasis on the functional and ‘scientific’, seen as leading todrabness and boredom in everyday life.
Trends8 Mysticism9 Sensuousness
10 New romanticism11 Introspection12 Novelty and change13 Beauty in the home
Reaction against complexity trends, reflecting the belief that life has become excessively complicated, that theindividual has lost control of his/her destiny, and that there is much to be gained by returning to a more natural and more simple style of life.
Trends14 Return to nature15 Simplification16 Anti-bigness17 Scientism and technology18 Ethnic orientation19 Local community involvement
Trends related to the weakening of the ‘Protestant ethic’, reflecting a questioning of a value system, termed the‘Protestant ethic’ by sociologists, which, put very simply, is based on the belief that ambition, striving, hard work,self-sufficiency, self-denial and other familiar virtues will lead to a successful life.
Trends20 Living for today21 Hedonism22 Away from self-improvement23 Non-institutional religion24 Liberal sex attitudes25 Blurring of the sexes26 Acceptance of drugs
Trends reflecting permissiveness in child rearing, deriving from the psychological guidelines which have been widelyused in the upbringing of our current youth population. These guidelines were based largely on concern about thenegative after-effects of a rigid, demanding, punishment-oriented childhood.
Trends27 Anti-hypocrisy28 Rejection of authority29 Tolerance for chaos and disorder30 Female careerism31 Familism
Moutin-01.qxd 22/09/2007 1:49 PM Page 12

The working-wife market cannot be served by a store that is ‘all things to all customers’.It is predicted that a new kind of store is on the horizon which may emerge eitherwithin a department store or as a separate institution to cater for this market. Theworking wife was found to prefer suburban stores to downtown stores even though shemay be working downtown. She is likely to be interested in the latest fashions and looksfor clothing that is stylish but practical on the job. The above findings bear heavily onretailers’ strategies in such areas as merchandising, the role of the suburban store, storepositioning, fashion orientation, promotion and store services.
Let us take two additional trends – physical fitness and well-being (trend 3 in Table 1.5)and meaningful work (trend 7) – and examine their impact on marketing strategy.
Physical fitness and well-being
Salads and fish are replacing the traditional American dinner of meat and potatoes.Increasing varieties of decaffeinated coffee and tea and substitutes for sugar and saltare crowding supermarket shelves. Shoppers are reading the small print to check forartificial ingredients in foods and beverages they once bought without a thought.Smoking is finally declining. Manufacturers and retailers of natural foods are buildinga healthy ‘health industry’ in the midst of a slow economy.
The dramatic new awareness of health is prompting these changes. The desire tofeel better, look younger and live longer exerts a powerful influence on what peopleput into their bodies, and this strong force is now moving against a well-entrenchedhabit that affects millions and dates back to biblical times – the consumption of toomuch alcohol.
Health substitutes for alcoholic beverages, labelled ‘dealcoholised’, are now beingoffered to US consumers. For some time, gourmet food shops have stocked champagne-like bottles of carbonated grape juice and cans containing a not-fully brewed mixtureof water, malt, corn, yeast and hops. Except for the packaging, these alcohol-freeimitations failed to resemble wine and beer, especially in the crucial area of taste.The newdealcoholised beverages, however, are fully fermented or brewed before their alcoholis separated out – either by pressure or heat – to below an unnoticeable 0.5 per cent,which is the federal maximum before classifying a drink as alcoholic. The taste andbody of the beverages match that of their former alcoholised selves.
This 0.5 per cent level is so low that a drinker would need to consume 24 glassesof dealcoholised wine or eight cans of dealcoholised beer to obtain the same amountof alcohol as in one 4-ounce glass of regular wine or one 12-ounce can of regular beer.Thus the drinker avoids not only intoxication but also worthless calories, as a regularglass of wine or beer has about 150 calories, while their dealcoholised copies containabout 40–60 calories respectively. And their prices are the same.
Introduced in Europe around 2001, dealcoholised wines are just now enteringthe USA.
Meaningful work
The following changes are producing a new challenge at work. First, people want goodjobs, not make-work. Second, workers want their individual rights to be respected.Third, the concept of the professional appears to be under siege. It is increasingly
Environmental Scanning
13
Moutin-01.qxd 22/09/2007 1:49 PM Page 13

difficult for professionals to maintain their special status in a society that is becomingmore knowledge-oriented, more bureaucratic and more participatory. The growth ofthe two-income family is also blurring status distinctions, as it has brought a newdegree of affluence to the so-called working class. For example, a secretary and herlabourer husband can have a family income of £30,000 a year, while a family headedby a sole-earner college professor or attorney can have an income well under that.Fourth, the oncoming generation has doubts about the ideals of efficiency. They areunwilling to pay the crushing price of loss of pride, mind-killing monotony, dehuman-isation and stress diseases in return for the highest wages in history. Fifth, today awoman’s place can be wherever she wants it to be, and so a greater number of womenare expected to find their place in the labour market.
Problem
LIFESPAN is a new company in the insurance market in Scotland. The company is aniche player pursuing specific types of segment (i.e. work-related insurance services)as well as developing a range of new financial services products, such as the ‘housewifeinsurance plan’ which takes into account the new life demands (e.g. dual-income families,the difficulties associated with the fulfilment of housework chores and duties, etc.) andwork/social pressures which affect many layers of the population. Mike O’Leary, themarketing manager of the company, is considering the implementation of a marketingscanning study to take into account social trends which will impact directly on hisstrategic marketing plans.
Questions
1 What are the strategic implications derived from the main source trends which will impacton LIFESPAN with regard to the job market and working patterns?
2 What is your assessment of the future developments linked with the women’s job market,their employment situation as well as their specific needs for life insurance?
3 What lessons can LIFESPAN learn from the environmental scanning exercise with regardto equal employment opportunities and group coverage?
(M) Problem 1.3 Scanning and forecasting methods
Introductory comments
Market measurement is an activity of critical importance for a wide range of decisions.Market-potential estimates and industry and company sales forecasts are essential forthe development of corporate marketing strategies and produce objectives. Middle-management decisions regarding the size and allocation of marketing expendituresdepend heavily on sales forecasts and on the relationship between forecasts andmeasures of profitability and productivity. By understanding the purpose and assump-tions behind a given market measurement, a manager will find it easier to specifythe kind of information needed in a given situation and to understand the degree ofreliability that should be placed on a given market-measurement estimate.
Additionally, managers should be aware of the available data sources that canbe used to develop market-measurement estimates. When environmental changes
Problems in Marketing
14
Moutin-01.qxd 22/09/2007 1:49 PM Page 14
can be expected to create a shift in the historical pattern of sales, then time-seriesmodels are likely to prove unsatisfactory. In such situations, managers are more likelyto use forecasting techniques that link sales to one or more factors thought to cause orinfluence sales. Descriptive models such as multiple-regression models are used whena number of factors have an impact on sales. Multiple-regression forecasts allow man-agers to incorporate the expected effects of any controllable marketing variables likelyto be significant when one is forecasting company sales. The goal is to assess therelationship between these controllable variables and sales. Can the variation in salesfor different time periods be explained by levels of price, promotion, distribution andso on, in those time periods? A multiple-regression model, with sales as the dependentvariable and the controllable factors as predictor or independent variables, will addressthis question.
JUDGEMENTAL APPROACHES
Frequently, it is not possible to rely on statistical approaches to forecasting. Time-seriesmethods may be inappropriate because of wide fluctuations in sales or because ofanticipated changes in trends. Regression methods may not be feasible because of a lackof historical data or because of management’s inability to determine (or even identify)causal factors. The judgemental approach may be management’s only possible avenuefor forecasting in these situations.
Even when statistical estimates are available, managers may want to use judgementto supplement these approaches because even the most sophisticated statistical modelscannot anticipate all the potential external factors that can influence sales (such asstrikes at customers’ facilities or major competitive innovations). Two prevalent judge-mental techniques are jury of executive opinion and Delphi techniques. The jury ofexecutives opinion invites the input from senior-level executives. In some cases theexecutives are asked to give an optimistic, pessimistic and most probable level of salesfor some future period. The forecasting managers first determine a forecast for eachexecutive and then combine the levels of all the executives. The Delphi technique asksmembers of a team to submit their forecasts and the assumptions behind the forecasts.These are then reviewed by a team leader and given back to the participants, witha summary of the first round, for a second round of forecasts. When an acceptableconsensus is reached the process stops.
INTERPRETING THE FORECAST
In evaluating the managerial implications of a sales forecast, managers should be fullyaware of both the sensitivity of forecast results to slight changes in forecast assumptionsor techniques and the costs of forecasting errors.
SENSITIVITY ANALYSIS
If several techniques give essentially the same results, the reliability of a forecast shouldbe greater.Accordingly, some firms develop parallel forecasts based on alternative tech-niques. Knowing how different techniques or assumptions lead to alternative estimates
Environmental Scanning
15
Moutin-01.qxd 22/09/2007 1:49 PM Page 15
enables a manager to determine how sensitive the forecast is to a change in these factors.When forecasts are highly sensitive, managers should expect greater imprecision andshould closely monitor the environment to find out which model and which assumptionsmost closely approximate reality.
THE COSTS OF FORECAST ERRORS
Companies that make or sell products with long lifetimes and steady sales are lessconcerned with the costs of forecast errors because the forecasts in these cases arelikely to be close to actual sales. However, when the sales forecast given to manage-ment has a large standard error, managers need to consider the costs of overestimatingand underestimating sales.
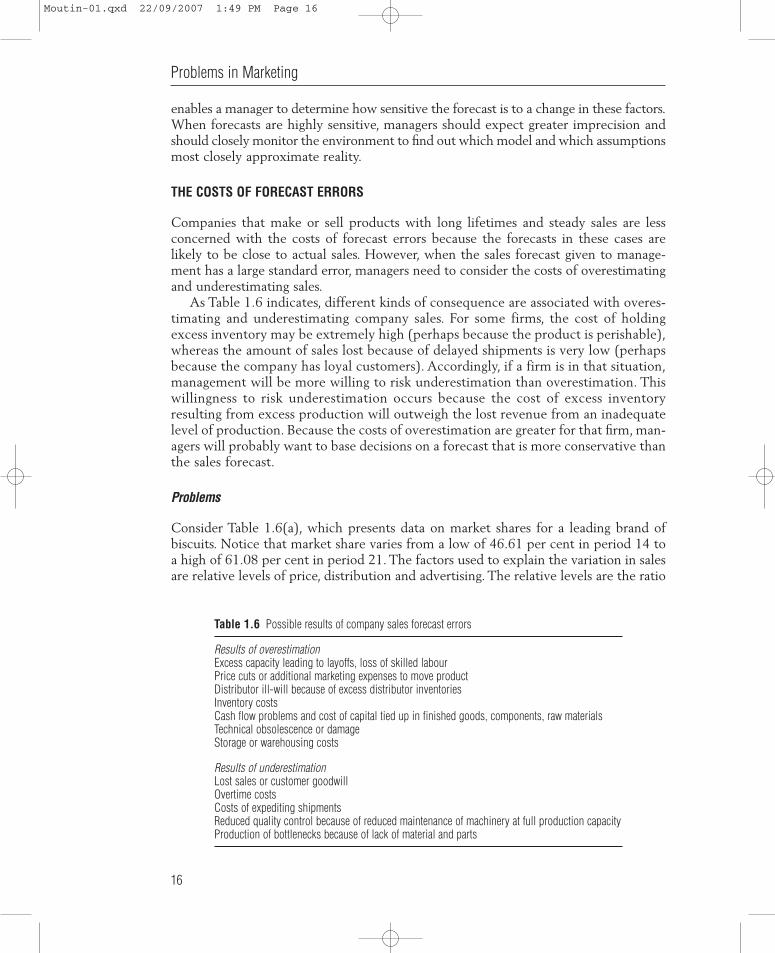
As Table 1.6 indicates, different kinds of consequence are associated with overes-timating and underestimating company sales. For some firms, the cost of holdingexcess inventory may be extremely high (perhaps because the product is perishable),whereas the amount of sales lost because of delayed shipments is very low (perhapsbecause the company has loyal customers). Accordingly, if a firm is in that situation,management will be more willing to risk underestimation than overestimation. Thiswillingness to risk underestimation occurs because the cost of excess inventoryresulting from excess production will outweigh the lost revenue from an inadequatelevel of production. Because the costs of overestimation are greater for that firm, man-agers will probably want to base decisions on a forecast that is more conservative thanthe sales forecast.
Problems
Consider Table 1.6(a), which presents data on market shares for a leading brand ofbiscuits. Notice that market share varies from a low of 46.61 per cent in period 14 toa high of 61.08 per cent in period 21. The factors used to explain the variation in salesare relative levels of price, distribution and advertising. The relative levels are the ratio
Problems in Marketing
16
Table 1.6 Possible results of company sales forecast errors
Results of overestimationExcess capacity leading to layoffs, loss of skilled labourPrice cuts or additional marketing expenses to move productDistributor ill-will because of excess distributor inventoriesInventory costsCash flow problems and cost of capital tied up in finished goods, components, raw materialsTechnical obsolescence or damageStorage or warehousing costs
Results of underestimationLost sales or customer goodwillOvertime costsCosts of expediting shipmentsReduced quality control because of reduced maintenance of machinery at full production capacityProduction of bottlenecks because of lack of material and parts
Moutin-01.qxd 22/09/2007 1:49 PM Page 16

of the company’s level to the industry average. The multiple-regression model basedon the data in Table 1.6(a) is
Market share � .61 – 1.11 (relative price) �.97 (relative distribution)�.01 (relative advertising)
Although many other factors could explain why market share varies from oneperiod to another, the model explains greater than 60 per cent of the variation inmarket share, based solely on relative levels of price, distribution and advertising.
Additionally, as in any statistical forecast, the company was able to determine thestandard error of the forecast – in this case .025; that is, there is always some imprecisionin terms of past sales and past forecasts. Two-thirds of the time the forecast estimateof sales will be within one standard error (in this case .025) of actual market share;95 per cent of the time, forecasted share will be within two standard errors (in thiscase .05) of the actual market share.
Multiple-regression models allow managers to predict values of the dependentvariable (e.g. market share) for different levels of the predictor variables (e.g. price,distribution and advertising). If we set the relative price at .95, relative distribution at1.06, and relative advertising at 1.0, the estimated level of market share, based on themultiple-regression model described above, is:
Market share � .61 � 1.11 (.95) �.97 (1.06) �.01 (1.0)� .5937
Environmental Scanning
17
Table 1.6(a) Leading brand of biscuits
Period Market share Relative price Relative distribution Relative advertising
1 0.518667 0.99596 1.05763 0.830482 0.558001 0.99112 1.03970 0.427233 0.545538 0.98112 1.04589 0.247834 0.493883 1.00633 1.03959 0.557975 0.502510 0.98687 1.03284 1.000006 0.553169 0.97524 1.04448 1.000007 0.561195 0.97223 1.04752 0.974418 0.535317 0.99437 1.05605 0.512849 0.540326 0.99321 1.05296 0.51284
10 0.522628 0.98322 1.03618 0.5612011 0.536117 1.00383 1.04714 0.8089212 1.558861 0.99705 1.04960 1.0000013 0.524293 1.00225 1.04838 0.2273714 0.466122 1.00172 1.04868 0.3265215 0.471938 1.00017 1.02406 0.3254616 0.497760 0.98295 1.03772 0.8095517 0.511327 0.97971 1.06260 0.8733718 0.554894 0.98837 1.09686 0.7308419 0.590279 0.99098 1.10962 0.9575920 0.572970 0.98397 1.06835 1.0000021 0.610783 0.97863 1.11071 0.46047
Moutin-01.qxd 22/09/2007 1:49 PM Page 17
When constructing and interpreting multiple-regression models, managers need toaddress a number of important questions in order to assess the reliability of the regres-sion forecasts. Two of the more important questions regarding multiple-regressionmodels are:
• Have any important factors been left out of the model?• Are the independent or predictor variables correlated among themselves?
The first question deals with the specification of the model. If any factors that have asignificant impact on sales have been left out of the model, the impact will not beincluded in the forecast and, therefore, the forecast can be seriously biased.
The second question deals with the manager’s ability to isolate the effects ofpredictor variables on the dependent variable. Consider the multiple-regression modelfor estimating the market shares for the biscuit manufacturer.The coefficients for price,distribution and advertising are 1.11, .97 and .01 respectively. There is a temptation toconclude that distribution is highly related to changes in market share and advertisingis not. However, if the two variables, distribution and advertising, are themselves highlycorrelated, one cannot make this conclusion.
Assume that a manager has been given a company sales forecast of 200,000 unitswith a standard error of 10,000 units. Statistical theory tells us that there is a 95 per centchance that the actual level sales will be within two standard errors. Thus, there is a95 per cent chance that sales will be within the range of 180,000–220,000 units. Ifthe manager sets production at the lower end – 180,000 units – and demand is higher,the underestimation will lead to stockouts or shortages of the product. If the managersets production at the high end – 220,000 units – and demand is less, the overestimationwill lead to excess inventory. Either of these consequences adds to the cost of theproducts. In some industries characterised by highly volatile demand, like the fashionindustry, the costs of stockouts for underestimation and markdowns for overestimationcan actually exceed the original cost of manufacturing.
Questions
1 What are some of the key issues that you need to address in order to evaluate the reliabilityof regression forecasts?
2 Comment of the methodology behind these two judgemental forecasting methods: jury ofexecutive opinion and Delphi technique.
3 Discuss the different kinds of consequences associated with overestimating and under-estimating company sales.
(M) Problem 1.4 Data mining
Introductory comments
Analysing large databases has become known as data mining, and businesses hope itwill allow them to boost sales and profits by better understanding their customers. Theanalysis of databases is not new – what is new and challenging is the extraordinary sizeof these databases.
The availability of huge databases began with scanner purchase data. Estimatessuggest that marketing managers in packaged goods companies are inundated with100 to 1,000 times more bits of data than even a few years ago because of the adoption
Problems in Marketing
18
Moutin-01.qxd 22/09/2007 1:49 PM Page 18

of scanner technology in their channels of distribution. Some data mining techniquesalso arose in response to ‘database marketing’ or ‘direct marketing’ (e.g. by cataloguevendors or coupon distribution providers) in which a company is trying to formrelationships with its individual customers, as marketing attempts to proceed from‘mass’ (one media message for all potential buyers) to ‘segments’ (some targeting andpositioning differences) to ‘one-to-one’ marketing. In order to achieve such tailoredmarket offerings, a company has to know a lot about its customers, hence the datacontain many pieces of information on each of the company’s many customers.
Traditionally, a company’s database would have contained only current businessinformation, but many now contain historical information as well. These ‘data ware-houses’ literally dwarf those available even a few years ago. For example, Wal-Marthas contracted with NCR Corporation to build a data warehouse with 24 terabytes(1 terabyte � 1,000 gigabytes) of data storage, which will make it the world’s largestdata warehouse. The system will provide information about each of Wal-Mart’s 3,000plus stores in multiple countries. Wal-Mart plans to use the information to selectproducts that need replenishment, analyse seasonal buying patterns, examine customerbuying trends, select markdowns, and react to merchandise volume and movement.
In response to the increasingly massive data sets, firms have been working to createincreasingly sophisticated data mining technologies (hardware and software) to analysethe data. Data mining uses massively parallel processing (MPP) and symmetric multi-processing (SMP) supercomputer technologies (during which multiple data points andsub-routines may be processing simultaneously, compared with old-fashioned ‘serial’processing, in which one datum is processed after another). These huge machinessupport ‘relational’ database programs that can slice massive amounts of data intodozens of smaller, more manageable pools of information.
Sometimes these intensive approaches are applied to databases that are beinganalysed with fairly traditional statistical techniques. For example, regression is still apremier analytical tool, because many predictors can be used to capture complexconsumer decision-making and market behaviour – forecasting sales as a function ofseason, price, promotions, sales force, competitor factors and delivery delays. Otherpopular techniques of data mining include cluster analysis for segmentation and neuralnetworks. Businesses regularly use data mining analytical tools to mathematicallymodel customers who respond to their promotional campaigns versus those whodo not. The effects of direct mailing efforts, for example, are easily measured andcompared as a function of customer information (demographics such as age, householdsize, income) and purchase behaviour (past buying history, cross-sales). Data miningcan also be used to measure incremental business (additional traffic, sales, profits) thatmay be directly attributed to a recent promotion by deliberately withholding thepromotional mailing from a ‘control’ group ‘experimental’ techniques.
In addition to standard techniques being applied to these huge data sets, marketingresearch methodologists are creating techniques and software especially for datamining analyses of large data sets. Sales of such customer management software arecurrently growing at five times the rate of the overall software market, as managersstruggle to track every encounter with each customer, to facilitate call-centre interac-tions between customers and customer service representatives, and to manage internalcustomers, for example, one’s sales force. Some of these relational database systemsinclude NCR’s Teradata system or Unix or Windows NT machines, IBM’s Intelligent
Environmental Scanning
19
Moutin-01.qxd 22/09/2007 1:49 PM Page 19
Miner and SAS’s Enterprise Miner. Other software companies offer ‘content aggregator’services that synthesise multiple databases – company financial information, histories,executive profiles and the like.
As an illustration of a data mining exercise, Farmers Insurance used IBM’sDecisionEdge software to look at the 200 pieces of information the companymaintained on its database of 10 million automobile insurance policy owners. Think ofa sports car owner and ‘you probably imagine a twenty-something single guy flamingdown the highway in his hot rod’. This profile fit many of its customers, but the datamining exercise identified another segment of sports car owner – married babyboomers with kids and more than one car. These customers produced fewer claims, yethad been paying the same sports-car surcharge. With this information in hand, Farmerscould charge them less, providing greater value and customer satisfaction.
There is no question that the explosion in databases, computer hardware andsoftware for accessing those databases, and the World Wide Web are all changing theway marketing intelligence is obtained. Not only are more companies building DSSs,but those that have them are becoming more sophisticated in using them for generalbusiness and competitive intelligence. This, in turn, has produced some changes inthe organisation of the marketing intelligence function. One change has been theemergence of the position of chief information officer, or CIO.
The CIO’s major role is to run the company’s information and computer systemslike a business. The CIO serves as the liaison between the firm’s top management andits information systems department. He or she has the responsibility for planning,coordinating and controlling the use of the firm’s information resources, and is muchmore concerned with the firm’s outlook than with the daily activities of the department.CIOs typically know more about the business in general than do the managers of theinformation systems department, who are often more technically knowledgeable. Inmany cases, the managers of the information systems department will report directlyto the CIO. Information systems are not intended to be simply data warehouses – themanagement of information is ideally designed as an electronic library that allows allemployees access to the ‘firm’s collective wisdom’.
FROM ACCOUNTS TO CUSTOMERS
The data extracted from the customer information system had one row per account.This reflects the usual product-centric organisation of a bank where managers areresponsible for the profitability of particular products rather than the profitability ofcustomers or households. The best next offer project required pivoting the data tobuild customer-centric models.
To be useful for cross-selling, the 1.2 million account-level records extracted fromthe customer information system had to be transformed into around a quarter of amillion household-level records. This was accomplished using SAS to group all theaccounts for a given tax identification number and then transpose them into a singlecustomer record with a set of columns for each account type. In cases where the bankwas aware that multiple members of a household had accounts, one of them waschosen as the primary ID (identifiers) for the household and used to identify all house-hold members. This allowed each newly created customer record to represent allaccounts belonging to an entire household. The new customer record contains a count
Problems in Marketing
20
Moutin-01.qxd 22/09/2007 1:49 PM Page 20
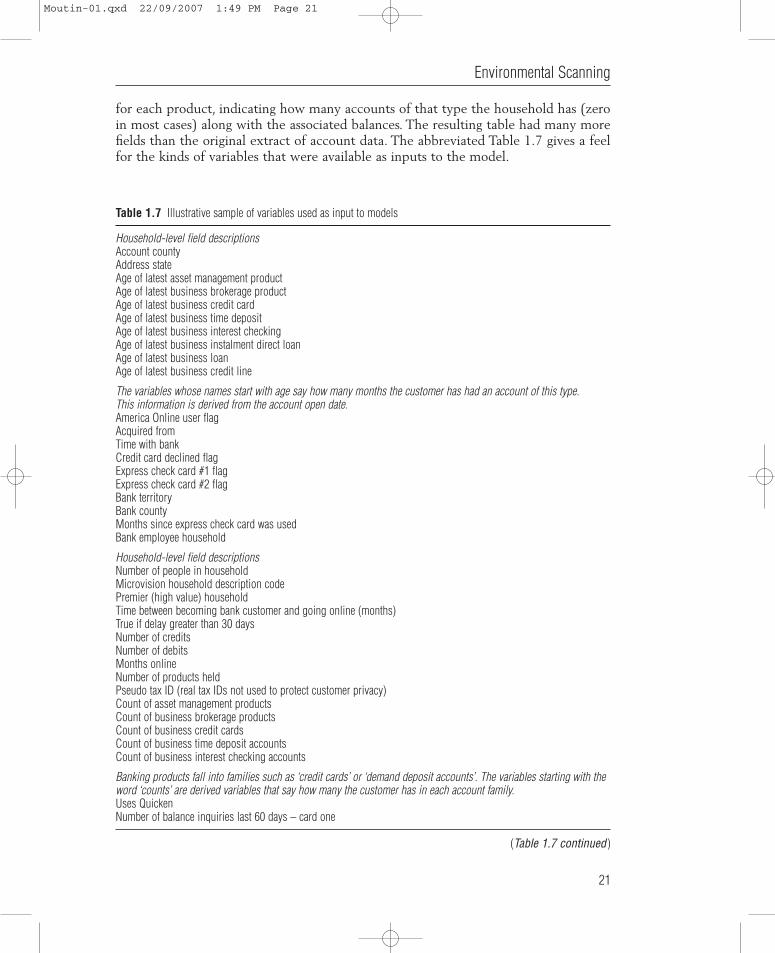
for each product, indicating how many accounts of that type the household has (zeroin most cases) along with the associated balances. The resulting table had many morefields than the original extract of account data. The abbreviated Table 1.7 gives a feelfor the kinds of variables that were available as inputs to the model.
Environmental Scanning
21
Table 1.7 Illustrative sample of variables used as input to models
Household-level field descriptionsAccount countyAddress stateAge of latest asset management productAge of latest business brokerage productAge of latest business credit cardAge of latest business time depositAge of latest business interest checkingAge of latest business instalment direct loanAge of latest business loanAge of latest business credit line
The variables whose names start with age say how many months the customer has had an account of this type.This information is derived from the account open date.America Online user flagAcquired fromTime with bankCredit card declined flagExpress check card #1 flagExpress check card #2 flagBank territoryBank countyMonths since express check card was usedBank employee household
Household-level field descriptionsNumber of people in householdMicrovision household description codePremier (high value) householdTime between becoming bank customer and going online (months)True if delay greater than 30 daysNumber of creditsNumber of debitsMonths onlineNumber of products heldPseudo tax ID (real tax IDs not used to protect customer privacy)Count of asset management productsCount of business brokerage productsCount of business credit cardsCount of business time deposit accountsCount of business interest checking accounts
Banking products fall into families such as ‘credit cards’ or ‘demand deposit accounts’. The variables starting with theword ‘counts’ are derived variables that say how many the customer has in each account family.Uses QuickenNumber of balance inquiries last 60 days – card one
(Table 1.7 continued )
Moutin-01.qxd 22/09/2007 1:49 PM Page 21

Note that many of the variables used as inputs to the model-building process arederived variables that were not part of the original extract. Some values, such as lengthof tenure, have been binned into ranges. Others, such as total balance, are valuescalculated from the original fields. A few are flags added to reflect groups of peoplethat the bank considered interesting, such as people who tried online banking within30 days of becoming a bank customer and people whose total deposits with the bankwere over $50,000.
DEFINING THE PRODUCTS TO BE OFFERED
The customer information system recognised several hundred different products, manyof which are simply small variations on a theme. This level of product differentiationis too detailed for the kind of marketing campaign we were supporting. For example,the bank might make someone an offer of a savings account without trying todetermine which of several variants would be most likely to appeal.These variants offer
Problems in Marketing
22
Table 1.7 Continued
Number of ATM payments last 60 days – card oneNumber of POS uses last 60 days – card oneNumber of balance inquiries last 60 days – card oneNetwork ATM use last 60 days – card oneBank ATM use last 60 days – card oneTrue if customer has any business productTrue if customer uses Quicken bill paying featureTrue if customer uses MS MoneyTrue if customer uses Quicken
Many of the fields are flags that are true if the customer uses a particular service or has exhibited a certain behaviour.True if customer has at least one student loanTrue if customer has at least one time depositTrue if customer has at least one unsecured line of credit
Household-level field descriptionsTrue if customer has at least one wholesale DDA productTrue if customer has private banking servicesBalance for asset management productsBalance for business brokerage productsBalance for business credit cardsBalance for business time deposit accountsBalance for business interest checking
Clearly, account balances can be very predictive.Total balance over all customer’s accountsTrue if customer has total balance over $50,000County of residence or ‘other’Customer tenure binTelephone area code or ‘other’Household standard metropolitan statistical area or ‘other’First three digits of postal zip code or ‘other’
Moutin-01.qxd 22/09/2007 1:49 PM Page 22

different interest rates based on total balances at the bank, other types of account,and so on. In fact, there are business rules for determining which savings account ismost appropriate for a given customer – data mining can figure out that a savingsaccount is appropriate and then business rules take over to determine which one inparticular.
Often the number of product codes is often dauntingly large. And, when there aretoo many codes (more than a few dozen) it is difficult to develop good cross-sellmodels – there are simply too few instances for each one. Often, many of the codesrefer to the same type of thing, such as a current account or a home mortgage, withjust minor (from the point of view of marketing) differences between them. Look fora hierarchy that describes the products at the right level.
There is a budgeting application that rolls up account types into a hierarchy ofproduct category, account type and subtype. The four major categories are depositaccount, loan, service and investment. The marketing people decided that, with a fewmodifications, the account-type level of this pre-existing hierarchy would serve well.From a marketing perspective, some of the account types are essentially the same, suchas certificates of deposit (CDs) and time deposits (TDs). These account types werecombined into a single category.
The product categories were used as the target variables for modelling. That is,a model predicted who would have CD/TD, or home mortgages, or whatever.The individual product types were retained as input variables. Table 1.8 shows the45 product types used for the best next offer model. Of these, 25 products are onesthat may be offered to a customer as part of this campaign. Information on theremaining (business-oriented) account types are used only as input variables whenbuilding the models.
Problem – example
Pillsbury’s internal network allows its employees in over 70 countries access to data ofseveral kinds, including consumer feedback that has been logged into a massivedatabase (based on 3,500 calls a day to the 800 number printed on every Pillsburyproduct), manufacturing (testing equipment at new plants, statistics on productionquality and packaging) and so on. Any employee, at a plant or at a sales call pitchingnew products to a grocer, can access the company’s data.
Hallmarks Cards assists its 15,000 store managers in ‘stock-keeping unit(SKU) optimisation’, the allocation of store square footage to its 40,000 products.It can determine which cards and gifts are selling on any given day at any givenretail outlet.
CONSUMER INSIGHTS GAINED FROM DATA MINING
Loyalty cards, such as those offered at supermarket retailers, offer consumersdiscounted prices and coupon incentives. In the past ten years, more than 100 millionloyalty cards and key tags have been issued: 30 per cent of supermarket customers havethem and, of those, 70 per cent use them. Companies know that all customers arenot equal, and loyalty cards enable one-to-one marketing, customising the shopping
Environmental Scanning
23
Moutin-01.qxd 22/09/2007 1:49 PM Page 23

Problems in Marketing
24
Table 1.8 Product types used in the best next offer model
Product code Product description To be Account Combinemodelled holders with
ASM Asset management NoBBK Business brokerage NoBCC Business credit card NoBCD Business certificate of deposit NoBIC Business interest
bearing checkingBIL Bill pay Yes 106,949BLD Business loan division NoBLN Business line of credit NoBMM Business money market NoBMR Business market rate NoBMS Business money
market savings NoBNC Business non-interest checking NoBSV Business savings NoCC Credit card Yes 154,738CD Certificate of deposit Yes 10,646CUS Custody NoDLR Instalment dealer loans Yes 2,693ELC Equity line of credit Yes 10,952EXL Express lease Yes 2,792GRP Group retirement programmes NoGUR Wholesale loan guarantors NoIBC Interest bearing checking Yes 40,233IL Instalment direct loans Yes 12,545IRA Individual retirement Yes 13,074
account IRB Individual retirement Yes 2,045
account brokerageIRF Individual retirement Yes 5,339
account mutual fundsLOC Line of credit Yes 53ML2 Second mortgage Yes 519MMA Money market access Yes 1,823MMS Money market savings Yes 35,841MRA Market rate account Yes 19,467MTG Mortgage Yes 2,444NIC Non-interest Yes 370,420
bearing checkingPAN Platform annuities NoPMR Premier NoRBR Retail brokerage Yes 5,297RP Retirement programmes NoRPS Retirement programmes securities No
Moutin-01.qxd 22/09/2007 1:49 PM Page 24

experience for households with different purchasing profiles (e.g. sensitivities to price,value, brand and quality). Loyalty cards and grocery purchases have yielded consumerinsights and marketing actions such as these:
1 Of Diet Coke drinkers, 13 per cent consume 83 per cent of its volume.Taster’s Choice is evenmore extreme – it generates 73 per cent of its sales from only 4 per cent of its customers.
2 Gillette used a direct marketing mailing campaign to send its razors and coupons to menand women who purchased competitors’ razors.
3 Coca-Cola strengthened its relationship and power with retailers when it demonstratedthat customers who purchased Coke as one of the items in their shopping trolleys weremore profitable to the retailer (for the entire basket of purchases) than consumers who didnot purchase Coke.
Federal Express data mines to obtain customer segments to pinpoint their desires forgreater profitability. Customer service representatives are empowered to go to differentlengths to satisfy customers who have been segmented as more and less profitable. Thiscustomer relationship management effectively creates a profit-and-loss statement percustomer and customer segment.
Rubbermaid data mines its warehouse to determine promotional effectiveness. It canmodel the likely sales resulting from a 25 per cent reduction on prices with two-pageads compared with 40 per cent price cuts with smaller ads. They also use their datafor merchandise optimisation and claim that this careful category management alsoenhances their relationships with their retailers, such as Wal-Mart, Pamida and Ames.
Hotels regularly collect a great deal of information on their guests.They supplementguest history data with guest preferences, and can thereby provide better quality andcustomised service. Implementers of such data systems find greater customer satisfactionand loyalty, and increased revenue per customer.
Questions
1 Explain some of the reasons behind the advent and availability of large databases to helpcompanies/organisations increase their marketing effectiveness.
2 Discuss the role and managerial implications of some of the key data mining technologies.3 Comment on the emergence of the position of a chief information officer (CIO) and its
appearance on an organisational chart and its main functions.
(I) Problem 1.5 Elements of a global information system
Introductory comments
Information, or useful data, is the raw material of executive action. The global marketeris faced with a dual problem in acquiring the information needed for decision making.In advanced countries the amount of information available far exceeds the absorptivecapacity of an individual or an organisation. The problem is super-abundance, notscarcity. While advanced countries all over the world are enduring an informationexplosion, there is relatively little information available on the marketing characteristicsof less developed countries. Thus the global marketer is faced with the problem ofinformation abundance and information scarcity.The global marketer must know where
Environmental Scanning
25
Moutin-01.qxd 22/09/2007 1:49 PM Page 25

to go to obtain information, the subject areas that should be covered, and the differentways that information can be acquired. The process of information acquisition isknown as scanning.The section that follows presents a scanning model for multinationalmarketing. The chapter continues with an outline of how to conduct global marketingresearch.
ELEMENTS OF A GLOBAL INFORMATION SYSTEM
Information subject agenda
A subject agenda, or list of subjects for which information is desired, is a basic elementof a global marketing information system. Because each company’s subject agendashould be developed and tailored to the specific needs and objectives of the company,it is not possible to suggest an ideal or standard agenda. Therefore any framework, suchas that proposed in Table 1.9, consists of six broad information areas with 31 information
Problems in Marketing
26
Table 1.9 Categories for a global business intelligence system
Category Coverage
I Market information1 Market potential Information indicating potential demand for products,
including the status and prospects of existing companyproducts in existing markets
2 Consumer/customer attitudes Information and attitudes, behaviour, and needs of consumersand behaviour and customers of existing and potential company products.
Also included in this category are attitudes of investorstowards a company’s investment, merit
3 Channels of distribution Availability, effectiveness, attitudes and preferences ofchannel agents
4 Communications media Media availability, effectiveness and cost5 Market sources Availability, quality and cost6 New products Non-technical information concerning new products for a
company (this includes products that are already marketed byother companies)
II Competitive information7 Competitive business strategy Goals, objectives. Definition of business; the ‘design’ and
and plans rationale of the company8 Competitive functional strategies, Marketing: target markets, product, price, place, promotion.
plans and programmes Strategy and plan, finance, manufacturing, R&D and humanresource strategy, plans, and programmes
9 Competitive operations Detailed intelligence on competitor operations. Production,shipments, employee transfers, morale, etc.
III Foreign exchange10 Balance of payments Government reports11 Nominal and real interest rates Expert estimation12 Inflation rate compared with weighted Secondary information report
trading partner average13 Estimate of international Expert judgement
competitiveness
(Table 1.9 continued)
Moutin-01.qxd 22/09/2007 1:49 PM Page 26

categories. The framework satisfies two essential criteria. First, it is exhaustive: itaccepts all the subject areas of information encountered by a company with globaloperations. Second, the categories in the framework are mutually exclusive: any kindof information encompassed by the framework can be correctly placed in one and onlyone category.
Prescriptive information covers the rules for action in the foreign market. This categoryincorporates information from guidelines to regulations, rulings and laws by public and privategroups and authorities.
Environmental Scanning
27
Table 1.9 Continued
Category Coverage
14 Attractiveness of country currency Currency demandand assets to global investors
15 Government policy regards: Expert assessmentcountry competitiveness
16 Country monetary and fiscal policy Expert assessment17 Spot and forward market activity Market reports18 Expectations and opinions of General assessment
analysts, traders, bankers,economists, business people.
IV Prescriptive information19 Foreign taxes Information concerning decisions, intentions and attitudes of
foreign authorities regarding taxes upon earnings, dividendsand interest
20 Other foreign prescriptions All information concerning local, regional or internationaland laws authority guidelines, rulings, laws, decrees other than foreign
exchange and tax matters affecting the operations, assets orinvestments of a company
21 Home country prescriptions Home country incentives, controls, regulations, restraints,etc., affecting a company
V Resource information22 Human resources Availability of individuals and groups, employment
candidates, sources, strikes, etc.23 Money Availability and cost of money for company uses24 Raw material Availability and cost25 Acquisitions and mergers Leads or other information concerning potential acquisitions,
mergers or joint ventures
VI General conditions26 Economic factors Macro-economic information dealing with broad factors,
such as capital movements, rates of growth, economicstructure, and economic geography
27 Social factors Social structure of society, customs, attitudes, andpreferences
28 Political factors ‘Investment climate’, meaning of elections, political change29 Scientific technological factors Major developments and trends30 Management and Management and administrative practices and procedures
administrative practices concerning such matters as employees compensation, report procedure
31 Other information Information not assignable to another category
Moutin-01.qxd 22/09/2007 1:49 PM Page 27
Scanning modes: surveillance and search
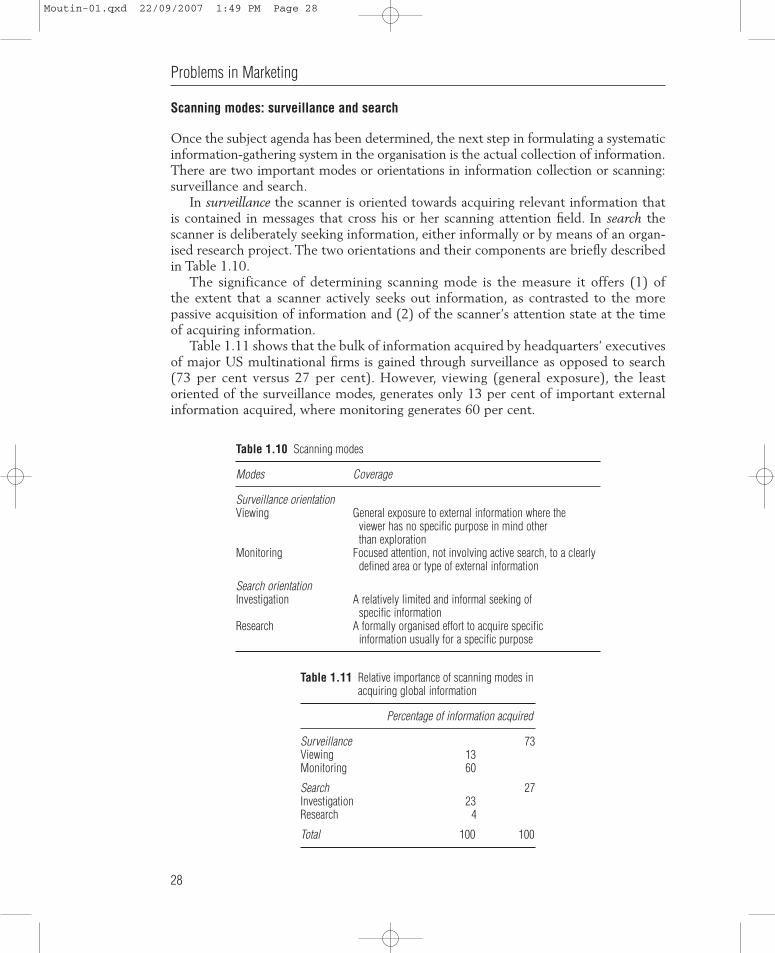
Once the subject agenda has been determined, the next step in formulating a systematicinformation-gathering system in the organisation is the actual collection of information.There are two important modes or orientations in information collection or scanning:surveillance and search.
In surveillance the scanner is oriented towards acquiring relevant information thatis contained in messages that cross his or her scanning attention field. In search thescanner is deliberately seeking information, either informally or by means of an organ-ised research project. The two orientations and their components are briefly describedin Table 1.10.
The significance of determining scanning mode is the measure it offers (1) ofthe extent that a scanner actively seeks out information, as contrasted to the morepassive acquisition of information and (2) of the scanner’s attention state at the timeof acquiring information.
Table 1.11 shows that the bulk of information acquired by headquarters’ executivesof major US multinational firms is gained through surveillance as opposed to search(73 per cent versus 27 per cent). However, viewing (general exposure), the leastoriented of the surveillance modes, generates only 13 per cent of important externalinformation acquired, where monitoring generates 60 per cent.
Problems in Marketing
28
Table 1.10 Scanning modes
Modes Coverage
Surveillance orientationViewing General exposure to external information where the
viewer has no specific purpose in mind otherthan exploration
Monitoring Focused attention, not involving active search, to a clearlydefined area or type of external information
Search orientationInvestigation A relatively limited and informal seeking of
specific informationResearch A formally organised effort to acquire specific
information usually for a specific purpose
Table 1.11 Relative importance of scanning modes inacquiring global information
Percentage of information acquired
Surveillance 73Viewing 13Monitoring 60
Search 27Investigation 23Research 4
Total 100 100
Moutin-01.qxd 22/09/2007 1:49 PM Page 28

This paucity of information generated by viewing is the result of two factors. Oneis the extent to which executives are exposed to information that is not included in aclearly defined subject agenda. The other is their receptiveness to information outsidethis agenda. Both factors operate to limit the relative importance of viewing as ascanning mode. Every executive limits his or her exposure to information that will nothave a high probability of being relevant to the job or company. This is a rational andnecessary response to the basic human mental limitations. A person can handle only aminute fraction of the data available to him or her. Because exposure absorbs limitedmental resources, exposure must be selective.
Nevertheless, receptiveness by the organisation as a whole to information notexplicitly recognised as important is vital. The effective scanning system must ensurethat the organisation is viewing areas where developments that could be important to thecompany might occur. This may require the creation of a full-time scanning unit thatwould have explicit responsibility for acquiring and disseminating information onsubjects of importance to the organisation.
SOURCES OF INFORMATION
Human sources
As can be seen in Table 1.12, people are the most important source of information forheadquarters executives of global companies. The most important human source ofexternal information is company subsidiaries, affiliates and branches. The importanceof executives abroad as a source of information about the world environment is oneof the most striking features of the modern global corporation. The general view ofheadquarters executives is that company executives overseas are the people who knowbest what is going on in their areas. Typical comments of headquarters executives are:
Our principal sources are internal. We have a very well informed and able overseas establish-ment. The local people have a double advantage. They know the local scene and they knowour business. Therefore, they are an excellent source. They know what we are interested inlearning, and because of their local knowledge they are able to effectively cover availableinformation from all sources.
The presence of an information network abroad in the form of company people is a majorstrength of the global company. It may also be a weakness in the scanning posture of a companythat has only partially extended the limits of its geographical operations because inside sourcesabroad tend to scan only information about their own countries or region. Although there maybe more attractive opportunities outside existing areas of operation, the chances of their beingnoticed by inside sources in a domestic company are very low because the horizons of domesticexecutives tend to end at national borders.
Environmental Scanning
29
Table 1.12 Sources of information (percentage)
Location of sources Types of source
Inside organisation 34 People 67Outside organisation 66 Documentary 27
Physical phenomena 6
Moutin-01.qxd 22/09/2007 1:49 PM Page 29
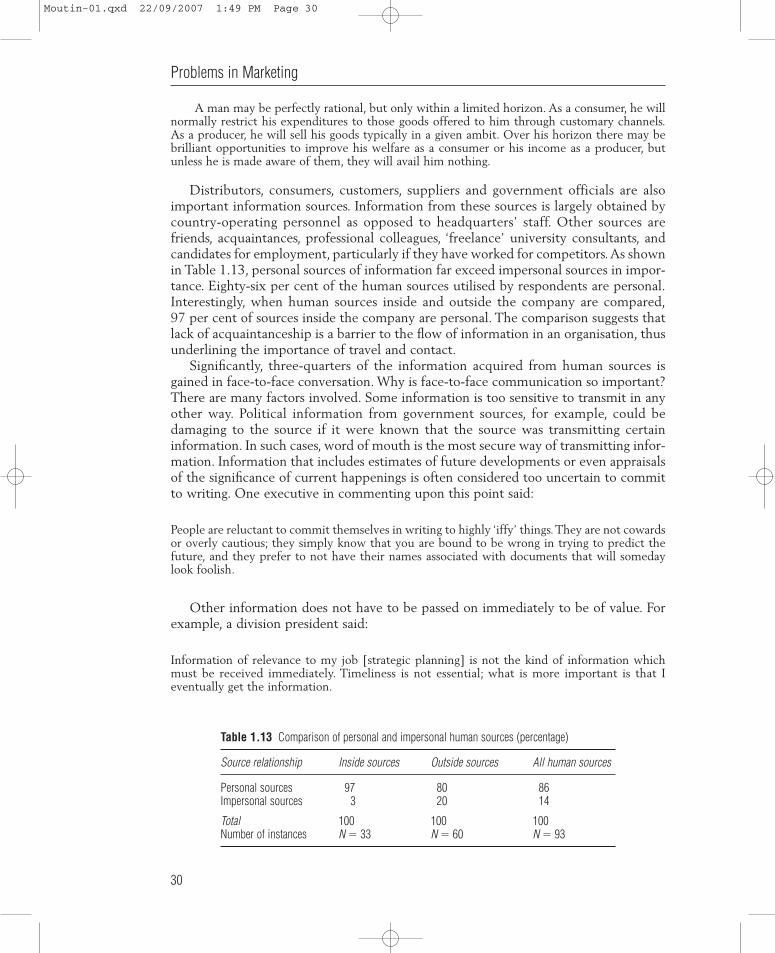
A man may be perfectly rational, but only within a limited horizon. As a consumer, he willnormally restrict his expenditures to those goods offered to him through customary channels.As a producer, he will sell his goods typically in a given ambit. Over his horizon there may bebrilliant opportunities to improve his welfare as a consumer or his income as a producer, butunless he is made aware of them, they will avail him nothing.
Distributors, consumers, customers, suppliers and government officials are alsoimportant information sources. Information from these sources is largely obtained bycountry-operating personnel as opposed to headquarters’ staff. Other sources arefriends, acquaintances, professional colleagues, ‘freelance’ university consultants, andcandidates for employment, particularly if they have worked for competitors.As shownin Table 1.13, personal sources of information far exceed impersonal sources in impor-tance. Eighty-six per cent of the human sources utilised by respondents are personal.Interestingly, when human sources inside and outside the company are compared,97 per cent of sources inside the company are personal. The comparison suggests thatlack of acquaintanceship is a barrier to the flow of information in an organisation, thusunderlining the importance of travel and contact.
Significantly, three-quarters of the information acquired from human sources isgained in face-to-face conversation. Why is face-to-face communication so important?There are many factors involved. Some information is too sensitive to transmit in anyother way. Political information from government sources, for example, could bedamaging to the source if it were known that the source was transmitting certaininformation. In such cases, word of mouth is the most secure way of transmitting infor-mation. Information that includes estimates of future developments or even appraisalsof the significance of current happenings is often considered too uncertain to committo writing. One executive in commenting upon this point said:
People are reluctant to commit themselves in writing to highly ‘iffy’ things.They are not cowardsor overly cautious; they simply know that you are bound to be wrong in trying to predict thefuture, and they prefer to not have their names associated with documents that will somedaylook foolish.
Other information does not have to be passed on immediately to be of value. Forexample, a division president said:
Information of relevance to my job [strategic planning] is not the kind of information whichmust be received immediately. Timeliness is not essential; what is more important is that Ieventually get the information.
Problems in Marketing
30
Table 1.13 Comparison of personal and impersonal human sources (percentage)
Source relationship Inside sources Outside sources All human sources
Personal sources 97 80 86Impersonal sources 3 20 14
Total 100 100 100Number of instances N � 33 N � 60 N � 93
Moutin-01.qxd 22/09/2007 1:49 PM Page 30

The great importance of face-to-face communication lies in the dynamics of personalinteraction. Personal contact provides an occasion for executives to get together for along enough time to permit communication in some depth. Face-to-face discussion alsoexposes highly significant forms of communication, such as the tone of voice, theexpression of a person’s eyes, movements, and many other forms of communicationthat cannot be expressed in writing.
Documentary sources
Of all the changes in recent years affecting the availability of information, perhaps noneis more apparent than the outpouring of documentary information. This outpouringhas created a major problem, the so-called ‘information explosion’. The problem isparticularly acute for international marketers who must be informed about numerousnational markets.
Although executives are overwhelmed with documentary information, only ahandful of companies employ a formal system for monitoring documentary informa-tion. The absence of formal monitoring systems has resulted in a considerable amountof duplication. A typical form of duplication is the common practice of an entiremanagement group reading one publication covering a particular subject area whenseveral excellent publications covering the same area are available.
The best way to identify unnecessary duplication is to carry out an audit of readingactivity by asking each person involved to list the publications he or she reads regularly.A consolidation of the lists will reveal the reading attention of the group. In a surpris-ingly large number of instances, the reading attention of the group will be limited to ahandful of publications to the exclusion of other publications of considerable merit.An elaboration of this procedure could involve consultation with experts outside thecompany regarding the availability and quality of publications in relevant fields.
External documentary sources are a valuable source of information for part of everycompany’s international information requirement, and they are also a particularlyvaluable source of information for the student who typically does not have the humanand written sources that are available to a long-time professional working in the field.
Perception sources
Direct perception is the source of a very limited proportion of the informationacquired by executives, as measured by message volume. However, it provides a vitalbackground for the information that comes from human and documentary sources.There are three types of direct perception. One type is information easily availablefrom other sources, but it requires sensory perception of the actual phenomena toregister the information in the respondent’s mind.
Another type of direct perception is information not readily available from alter-native sources. An example is the information that a company is erecting a plant in acountry capable of producing a competitive product. Local executives in the countrydrive by the new plant every day on their way to their offices but are unaware of theproduct X potential of the plant under construction. The company erecting the planthad announced that it was for product Y, and local executives have accepted thisannouncement. The headquarters executive realises immediately that it is potentially
Environmental Scanning
31
Moutin-01.qxd 22/09/2007 1:49 PM Page 31

capable of producing product X. He possesses technical knowledge that enables himto perceive information in a physical object (the plant) that his local executives areunable to perceive.
The third type of direct perception is perhaps the most important. This is thebackground information that one gets from observing a situation. Of course, inmultinational marketing, direct perception requires travel. Thus the independentvariable in the use of this source is travel. Travel should be seen not only as a tool formanagement control of existing operations, but also as a vital and indispensable tool ininformation scanning.
Information perception and media
The medium is the channel through which information is transmitted. Any marketinginformation system is based on three basic media: the human voice for transmittingwords and numbers; printed words and numbers; and direct perception through thesenses of sight, hearing, smell, taste and touch. Each of these basic information systemmedia has been extended in recent years by important innovations in electronic andtravel technologies. Of particular importance to the marketing information system havebeen the impressive developments in the Internet, e-mail, satellite communicationnetworks for voice and data, and transportation via jet aircraft.
Comparability of international data
International statistics are subject to more than the usual number of caveats andqualifications concerning comparability. An absence of standard data-gathering tech-niques is the basis for some of the lack of comparability in international statistics. InGermany, for example, consumer expenditures are estimated largely on the basis ofturnover tax receipts, whereas in the UK consumer expenditures are estimated on thebasis of data supplied not only by tax receipts but also from household surveys andproduction sources.
Even with standard data-gathering techniques, definitional differences would stillremain internationally. In some cases, these differences are minor; in others, they arequite significant. Germany, for example, classifies the purchase of a television set as anexpenditure for ‘recreation and entertainment’, whereas the same expenditure fallsinto the ‘furniture, furnishings and household equipment’ classification in the USA.
Problem – example
Survey data are subject to perhaps even more comparability problems. When PepsicoInternational, a typical user of international research, reviewed its data, it found aconsiderable lack of comparability in a number of major areas. Table 1.14 shows howage categories were developed in seven countries surveyed by Pepsico.
While flexibility may have the advantage of providing groupings for local analysisthat are more pertinent (e.g. 14–19 might be a more pertinent ‘youth’ classification inone country, whereas 14–24 might be a more useful definition of the same segment inanother country), the marketing research group at Pepsico’s headquarters pointedout that if data were reported to the company’s headquarters in standard five-year
Problems in Marketing
32
Moutin-01.qxd 22/09/2007 1:49 PM Page 32
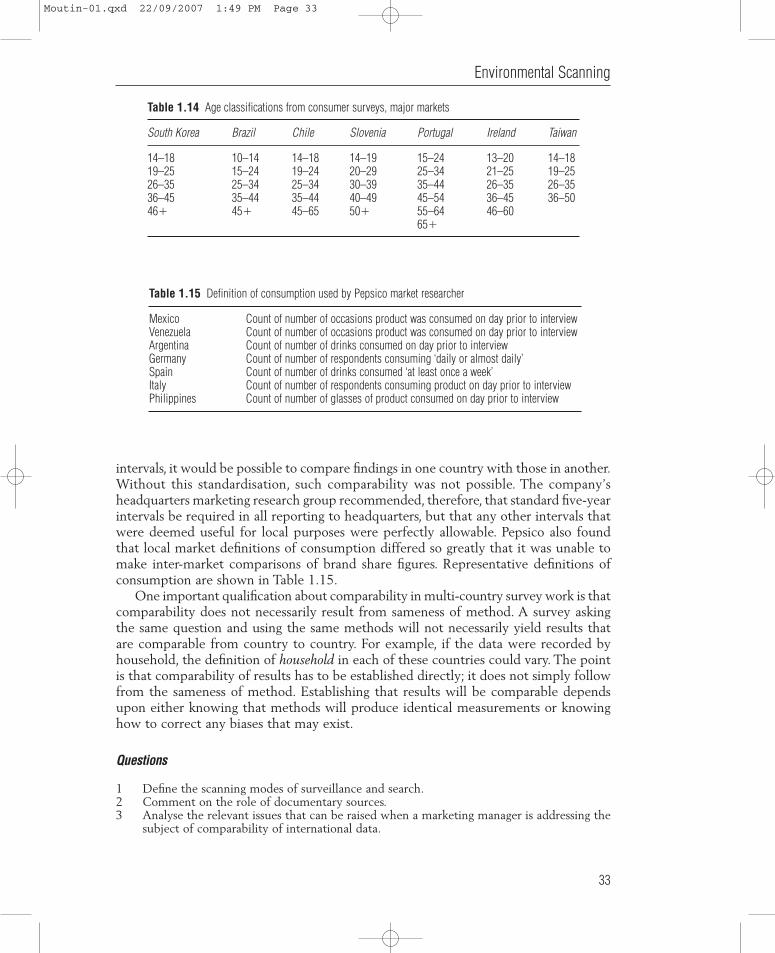
intervals, it would be possible to compare findings in one country with those in another.Without this standardisation, such comparability was not possible. The company’sheadquarters marketing research group recommended, therefore, that standard five-yearintervals be required in all reporting to headquarters, but that any other intervals thatwere deemed useful for local purposes were perfectly allowable. Pepsico also foundthat local market definitions of consumption differed so greatly that it was unable tomake inter-market comparisons of brand share figures. Representative definitions ofconsumption are shown in Table 1.15.
One important qualification about comparability in multi-country survey work is thatcomparability does not necessarily result from sameness of method. A survey askingthe same question and using the same methods will not necessarily yield results thatare comparable from country to country. For example, if the data were recorded byhousehold, the definition of household in each of these countries could vary. The pointis that comparability of results has to be established directly; it does not simply followfrom the sameness of method. Establishing that results will be comparable dependsupon either knowing that methods will produce identical measurements or knowinghow to correct any biases that may exist.
Questions
1 Define the scanning modes of surveillance and search.2 Comment on the role of documentary sources.3 Analyse the relevant issues that can be raised when a marketing manager is addressing the
subject of comparability of international data.
Environmental Scanning
33
Table 1.14 Age classifications from consumer surveys, major markets
South Korea Brazil Chile Slovenia Portugal Ireland Taiwan
14–18 10–14 14–18 14–19 15–24 13–20 14–1819–25 15–24 19–24 20–29 25–34 21–25 19–2526–35 25–34 25–34 30–39 35–44 26–35 26–3536–45 35–44 35–44 40–49 45–54 36–45 36–5046� 45� 45–65 50� 55–64 46–60
65�
Table 1.15 Definition of consumption used by Pepsico market researcher
Mexico Count of number of occasions product was consumed on day prior to interviewVenezuela Count of number of occasions product was consumed on day prior to interviewArgentina Count of number of drinks consumed on day prior to interviewGermany Count of number of respondents consuming ‘daily or almost daily’Spain Count of number of drinks consumed ‘at least once a week’Italy Count of number of respondents consuming product on day prior to interviewPhilippines Count of number of glasses of product consumed on day prior to interview
Moutin-01.qxd 22/09/2007 1:49 PM Page 33

Reference and further readings
Berry, M. and Linoff, G.S. (2000) Mastering Data Mining, New York: John Wiley & Sons.Bishop, W.S., Graham, J.L. and Jones, M.H. (1984) Volatility of derived demand in industrial
markets and its management implications, Journal of Marketing, Fall: 95–103.Brownlie, D. (1987) Environmental analysis, in Baker, M.J. (ed.) The Marketing Book, Oxford:
Butterworth-Heinemann.Churchill, G. and Iacobucci, D. (2002) Marketing Research: Methodological Foundations, Mason,
OH: South-Western.Dalrymple, D., Strahle, W. and Bock, D. (1989) How many observations should be used in trend
regression in forecasts? Journal of Business Forecasting, Spring: 7–10.Daniel Bell (1975) The revolution of rising entitlements, Fortune, April: 98–185.Dickinson, C. and Tabernilla, M. (1999) A new customer relationship management approach,
Lodging Hospitality, 15 May: R11–12.Diffenbach, J. (1983) Corporate environmental analysis in large US corporations, Long Range
Planning, 16(3): 107–16.Frisbie, G. and Mabert, V.A. (1981) Crystal ball vs. system: the forecasting dilemma, Business
Horizons, September–October: 72–6.Georgoff, D.M. and Murdick, R.G. (1986) Manager’s guide to forecasting, Harvard Business
Review, January–February: 110–19.Guiltinan, J.P., Paul, G. and Madden, T. (1997) Marketing Management: Strategies and Programs,
New York: McGraw-Hill.Hagdorn-van der Meijden, Jo, van Nunen, A.E.e. and Ramondt, A. (1994) Forecasting – bridging
the gap between sales and manufacturing, International Journal of Production Economics,101–14.
Jobber, D. (1988) Principles and Practice of Marketing (second edition), London: McGraw-Hill.Judge, P.C. (1998) What’ve you done for us lately? Business Week, 14 September: 140–6.Keegan, W.C. (1989) Global Marketing Management, Englewood Cliffs, NJ: Prentice-Hall.Mahajan, V., Muller, E. and Bass, F. (1990) New product diffusion models in marketing: a review
and directions for research, Journal of Marketing, January: 1–26.Mentzer, J.T. and Gomes, R. (1994) Further extensions of adaptive extended exponential
smoothing and comparison with the M-comparison, Journal of the Academy of MarketingScience, 22 (4): 372–82.
Norton, P. (1994) Welcome to the fast lane, Sales and Marketing Management, August: 65–6.Proctor, R.A. (1989) A different approach to sales forecasting: using a spreadsheet, European
Management Journal, Fall: 358–65.Raider, A.M. (1999) Programs make results out of research, Marketing News, 33 (21 June): 14.Schnaars, S.P. (1984) Situational factors affecting forecast accuracy, Journal of Marketing
Research, August: 290–7.Sobek, R. (1973) A manager’s primer on forecasting, Harvard Business Review, May–June: 6–15.Thomas Cannon, J. (1972) Auditing the competition environment, in John W. Bonge and Bruce
P. Coleman (eds) Concepts of Corporate Strategy, New York: Macmillan Co. pp. 263–4.Wang, G.C.S. (1993–94) What you should know about regression-based forecasting, The Journal
of Business Forecasting, Winter: 15–21.
Problems in Marketing
34
Moutin-01.qxd 22/09/2007 1:49 PM Page 34