environmental quality and landscape-hazard …
TRANSCRIPT

209 I. Petrosillo et al. (eds.), Use of Landscape Sciences for the Assessment of Environmental Security, 209–224.
ENVIRONMENTAL QUALITY AND LANDSCAPE-HAZARD
ASSESSMENT IN THE YANTRA RIVER BASIN, BULGARIA
MARYIANA NIKOLOVA*, STOYAN NEDKOV, AND STOYAN IANKOV Bulgarian Academy of Sciences, Institute of Geography, Sofia, Bulgaria DARIUS SEMMENS U S Environmental Protection Agency Office of Research and Development, Las Vegas, Nevada, USA
Abstract. The objective of the present work is to analyze the role of landscape for environmental security in the Yantra River Basin, exploring its relationships with river-water quality and flood hazard. The relationship between landscape and river-water quality is analyzed on the basis of landscape indicators and assessment tools like Automated Geospatial Watershed Assessment (AGWA) and Analytical Tools Interface for Landscape Assessment (ATtILA). The relationship between landscape and flood hazard is explored using set of flood-hazard indicators and the Soil and Water Assessment Tool (SWAT). The results from ATtILA implementation show that the main sources of nitrogen loading are the agricultural landscapes and the urban areas in the river basin. The SWAT simulation is done for three scenarios in which land cover (forest lands) changes are related to flood hazard. For the most unfavorable scenario, decrea-sing forest lands, a significant increase of the river discharge is predicted. The degree of environmental security depends strongly on the specific spatial patterns of landscape change in the river basin.
Keywords: Landscape modeling; water quality; hazard assessment
______ * Corresponding Author: Dr. Nikolova Maryiana, Bulgarian Academy of Sciences, Institute of Geography,
Akad. G. Bonchev Str., Bl. 3, 1113 Sofia, Bulgaria, Phone: +3592 870 02 53, e-mail: [email protected]
© 2008 Springer.
M. NIKOLOVA ET AL. 210
1. Introduction
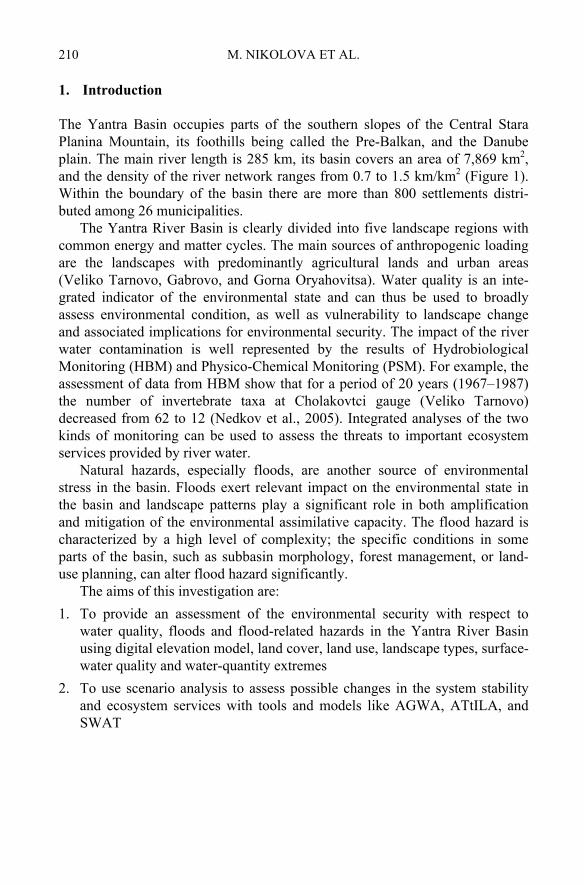
The Yantra Basin occupies parts of the southern slopes of the Central Stara Planina Mountain, its foothills being called the Pre-Balkan, and the Danube plain. The main river length is 285 km, its basin covers an area of 7,869 km2, and the density of the river network ranges from 0.7 to 1.5 km/km2 (Figure 1). Within the boundary of the basin there are more than 800 settlements distri-buted among 26 municipalities.
The Yantra River Basin is clearly divided into five landscape regions with common energy and matter cycles. The main sources of anthropogenic loading are the landscapes with predominantly agricultural lands and urban areas (Veliko Tarnovo, Gabrovo, and Gorna Oryahovitsa). Water quality is an inte-grated indicator of the environmental state and can thus be used to broadly assess environmental condition, as well as vulnerability to landscape change and associated implications for environmental security. The impact of the river water contamination is well represented by the results of Hydrobiological Monitoring (HBM) and Physico-Chemical Monitoring (PSM). For example, the assessment of data from HBM show that for a period of 20 years (1967–1987) the number of invertebrate taxa at Cholakovtci gauge (Veliko Tarnovo) decreased from 62 to 12 (Nedkov et al., 2005). Integrated analyses of the two kinds of monitoring can be used to assess the threats to important ecosystem services provided by river water.
Natural hazards, especially floods, are another source of environmental stress in the basin. Floods exert relevant impact on the environmental state in the basin and landscape patterns play a significant role in both amplification and mitigation of the environmental assimilative capacity. The flood hazard is characterized by a high level of complexity; the specific conditions in some parts of the basin, such as subbasin morphology, forest management, or land-use planning, can alter flood hazard significantly.
The aims of this investigation are: 1. To provide an assessment of the environmental security with respect to
water quality, floods and flood-related hazards in the Yantra River Basin using digital elevation model, land cover, land use, landscape types, surface-water quality and water-quantity extremes
2. To use scenario analysis to assess possible changes in the system stability and ecosystem services with tools and models like AGWA, AТtILA, and SWAT

LANDSCAPE-HAZARD ASSESSMENT 211
2. Materials and methods
2.1. DATA ACQUISITION
2.1.1. Water quality
The assessment of water quality is based on the results of physicochemical and hydrobiological monitoring carried out by the Regional Inspectorate for Environment and Water (RIEW) in Veliko Tarnovo. The system of HBM includes 214 sampling points. Bulgarian RIEWs have adopted the Irish Q-rating biotic index, which was adapted for local conditions and implemented in 1997. The biotic index has a five-level scale for water-quality assessment. The highest value, BI-5, is given for clear water with high quality and no anthropogenic influence; the lowest value, BI-1, is for extremely polluted water (State of the Environment, 2004). The data used in the investigation include results from 158 sampling points for 2000–2003, of which 37 were sampled twice per visit with collection of samples twice in a year (Figure 1). The short period of observation does not allow investigations on water-quality dynamics for longer time periods. For this reason we also used the information available from bioindication assessment based on the saprobiological method for the period from the 1960s to the beginning of the 1990s (Rusev, 1994; Janeva and Rusev, 1997). It is based on different biotic indices like the Pantle-Buk index, Zelinka-Marvan-Rothshtein index and others. The water quality is measured in five-level saprobity scale, which corresponds to particular values of every index. The water-quality categories of the biotic index and saprobity scale have similar characteristics and can be easily converted to the five-level biological classification of the rivers adopted in Bulgaria (Table 1).
The system for PCM includes 16 points with monthly sampling and 24 observed parameters. We used data for the period 1999–2004 from 10 sampling points for 13 parameters (dissolved oxygen, dissolved solids, suspended solids, manganese oxydability, biological oxygen demands (BOD5), chlorides, sulfates, phosphates (PO4), ammonia nitrogen (NH4–N), nitrite (NO2–N), nitrate (NO3–N), iron, and manganese content) (Figure 1). The results from the HBM and PCM systems complement each other because the hydrobiological sampling points cover more precisely the river system, while the physicochemical ones ensure more information for selected points.

M. NIKOLOVA ET AL. 212
Figure 1. Yantra River Basin: 1 – Border between landscape regions; 2 – Landscape regions: I – Plain, temperate, dry subhumid; II – Hilly and plateau, temperate, moist subhumid; III–Low mountain, temperate, moist subhumid; IV – Mid mountain, temperate humid; V – High mountain, cold humid; 3 – Physicochemical monitoring sampling points; 4 – Hydrobiological monitoring sampling points.
2.1.2. Natural hazards (floods)
The objective of the investigation requires implementing indicators for the assessment of floods as a natural hazard, specifically in terms of their direct and indirect pressure on the landscape. Floods in the Yantra River Basin, which have caused significant material losses and can be the subject of flood-risk analysis, are classified as devastating when runoff is higher than 100 m3 s−1 (Gerasimov, 1992). During the period 1990–2005 52 floods were registered in the Yantra Basin, of which 25 were in the Yantra River, 21 in the Rositsa River, and 6 in the Vidima River.
The flood dimensions depend on the basin morphology; soils, land cover, flood-inducing rains, etc., and can be manifested as flood-related hazards like landslides and erosion. It is a complex pressure with impacts that are different for each location in the basin. To estimate this pressure, we need to know first, what are the hazardous phenomena displayed within the framework of a given territorial unit (municipality, basin, subbasin, etc.) and what are the probability

LANDSCAPE-HAZARD ASSESSMENT 213
and intensity with which they occur, and second, to what extent their total effect would influence the landscape security or/and vulnerability of the socioeconomic system. For this reason we propose the use of a complex parameter (R), (Nikolova, 1998, 2001), obtained as follows: • Frequency of occurrence of each hazardous phenomenon at a given place
is assigned to the territory of the municipality in which it is contained. • Class interval (I) is calculated for the data set (X1….n) about the frequency
of the phenomenon in each municipality:
I = (X max – X min)/k. (1)
• The number of hazard classes depends on the sample size and is determined according to the formula:
k = 1 + 3,3lg N (2)
where: k – number of classes, and N – corresponds to the grouping of the real frequencies, to which the corresponding hazard classes are assigned for each single phenomenon.
• The assessment of the total loading of the municipalities is made on the basis of the formula:
R = ∑ r/n (3)
where: r – hazard class assigned to each phenomenon in a given municipality; n – number of the hazardous phenomena within the assigned risk class.
The assignment of hazard classes to the phenomena makes them comparable; at the same time it makes it possible to show clearly the relative weight of the pressure of each of them on the territory.
The following data were used to define the potential hazard: frequency of intensive rains (May–August); frequency of river raising and floods; zoning of erosion on the basis of the sediment yield; and number of active landslides, according to Nikolova et al. (1998).
2.2. LANDSCAPE CHARACTERIZATION
The construction of the landscape classification scheme has been carried out using elements from other schemes, developed for the territory of Bulgaria and adapted for the needs of the investigation. The characterization of landscapes in the Yantra River Basin has been made on the basis of a three-level hierarchical classification scheme.
The first level of differentiation corresponds to the landscape types according to Velchev et al. (1992). The territorial units are distinguished on the

M. NIKOLOVA ET AL. 214
basis of differences determined by the effect of hydro-climatic factors. The degree of generalization conforms to a middle scale mapping. The so-formed territorial units correspond to the concept of a landscape region in the context of Forman (1995) and Farina (2000). Five landscape regions are distinguished in the Yantra River Basin (Figure 1; Iankov et al., 2004).
The second hierarchical level differentiates the Yantra River Basin into subbasins on the basis of specific features of relief, which determines the direction of water flows by the form of the topographic surface. The basin has been divided in 12 subbasins, 6 of them being on the main river, 2 on the main tributary – the Rositsa River, and 4 on the eastern tributaries – the Drianovska, Golyamata, Stara, and Djuliunitsa Rivers (Figure 1).
The third level of landscape differentiation is based on the European CORINE Land Cover classification. Of the 44 CORINE land cover classes, 37 are present in the Bulgarian territory (Vatseva, 2005). The application of this scheme, which has been adopted by almost all European countries, provides the possibility of comparing the results with other regions of the continent.
2.3. CHANGE DETECTION AND SCENARIOS DEVELOPMENT
The Executive Environmental Agency (EEA) provided the CORINE Land Cover for the years 1990 and 2000. It is structured in the form of a database in GIS format. This provides the possibility of establishing the land cover changes that took place within a 10-year period. For this purpose the land cover data for the two years have been compared, separating the detected transformation in a single layer (shape file). The obtained areas were grouped according to their land cover classes and a number of indicators were derived for analyzing their spatial position within the framework of the basin as a whole and within the subbasins.
Another source for change detection was the information from the Bulgarian Inquiry for Observation of Agriculture and Economic Conjuncture (BIOAEC). It covers the period from 1998 to 2003 and was developed on the basis of satellite images and field investigations (Nedkov et al., 2005). It was provided by the Ministry of Agriculture and includes land use data in the tables distri-
buted according to the municipal boundaries. This information is transformed and conformed to the territorial units used in the investigation – landscape regions and subbasins.
These two sources show particular discrepancies and represent different trends in the land cover changes, which are due to differences in the methods and criteria used. This gives an opportunity to use CORINE and BOIAEC data to work out two future scenarios for the basin. The changes observed in the CORINE land cover could be interpreted as more representative of the current

LANDSCAPE-HAZARD ASSESSMENT 215
trend. These data were therefore used to create a future scenario characterized by relatively slight changes for the basin as a whole, with some significant differences between the subbasins. A second scenario was based on the data from BIOAEC, and represents future conditions that could be realized under the condition that plans for the development of this territory on local and regional level are realized. It is characterized by a significant increase of forest areas and reduction of agriculture lands. A third scenario was adopted to represent a pessimistic view of future changes in the basin, and is characterized by more significant replacement of forested areas with agricultural and barren lands.
2.4. INDICATORS
The assessment of the relationship between environmental security and land-scape pattern was realized using landscape indicators (land cover, land use, and water quality) and flood-hazard indicators (catchment morphometry, rainfall intensity, river raising, floods, land cover, land use, landslides, and erosion). Each landscape region was characterized according to its indicator attributes (shape and size of the basins, land cover/land use changes as a percentage of the area, water-quality categories of the rivers, rains, floods, landslides and erosion intensity and potential, total loading of flood-related hazards, density of the population, and the exposure of settlements to hazards. Settlement vulnerability, or sensitivity to processes taking place in the river basin, was assessed with AGWA tool and its component SWAT model.
2.5. TOOLS AND MODELS
The AGWA tool is a GIS-based multipurpose hydrologic analysis system designed to: provide a simple, direct and repeatable method for hydrological modeling; use basic, attainable GIS data; be compatible with other geospatial basin-based environmental analysis software; and be useful for scenario development and alternative future simulation work at multiple scales (Miller et al., 2002, 2007). AGWA provides the functionality to conduct the processes of modeling and assessment for two component hydrologic models: SWAT and the Kinematic Runoff and Erosion Model (KINEROS2, Smith et al., 1995).
SWAT is a distributed lumped-parameter model developed at the US Department of Agriculture, Agricultural Research Service (USDA-ARS) to predict the impact of land management practices on water, sediment, and agriculture chemical yields in large complex basins with varying soils, land use and management conditions over long periods of time. It is a continuous-time model using daily average input values and has some major components including: hydrology, weather generator, sedimentation, soil temperature, crop

M. NIKOLOVA ET AL. 216
growth, groundwater, and lateral flow (Arnold et al., 1994). The use of SWAT in the investigation is directed to evaluate the effect of changes in the landscape on the river flow and especially during the periods with floods. The output data can be represented as average yearly or monthly values as well as daily output, which enable the user to receive detailed information about the investigated characteristics.
ATtILA is an ArcView-based tool, which facilitates the process of deriving different kinds of landscape metrics (Ebert and Wade, 2004). It gives the opportunity to calculate four groups of metrics: landscape characteristics, riparian characteristics, human stressors, and physical characteristics. It was used for the water-quality analyses at subbasin level.
2.6. ASSESSMENT
The subbasins divided on the second level of the landscape differentiation were used to determine the effect of landscapes on water quality, and to differentiate the original sources of pollution. To evaluate water quality and define measures for its improvement, it is very important to differentiate the point and nonpoint sources. It has been established by experience that the individual land uses discharge different amounts of pollutants. For example, from one hectare of urban territory (land cover) 1.2 kg of phosphorus and 5.5 kg of nitrogen are
3. Results
3.1. LAND COVER CHANGES
In accordance with the performed analysis of the CORINE Land Cover data, it has been established that a total of 4,619 ha in the Yantra River Basin experienced some type of land cover change during the period from 1990 to
discharged annually in water. The application of the Human Stressors option ofATtILA shows potential for exerting impact on river-water quality by nitrogenloading. A direct comparison of these data with the results from the physiochemicalmonitoring is difficult to accomplish because of differences in the appliedmethodology for obtaining them and a discrepancy between the measuring units. For this purpose we use a simple coefficient defined as the ratio betweenthe two values: K = m/As, where m is the average amount of nitrogen or otherwater-quality constituent in the water of the respective point and As is thecalculated quantity of the nitrogen incoming to the respective subbasin fromthe landscapes. It gives the opportunity to differentiate point and nonpointsources of nitrogen load.

LANDSCAPE-HAZARD ASSESSMENT 217
2000. It includes 162 areas with various types of land use (land cover) with an average area of 22 ha (min 5 ha, max 103 ha).
A typical feature of most of the changes for the period 1990–2000 is that they are observed in both directions: from transitional woodland-shrub vegetation to deciduous forests and the opposite. The largest share of changes belongs to the transformation from transitional woodland-shrub vegetation to deciduous forests (33% of the area and 54 changed areas); the reverse trans-formation (deciduous forests to transitional woodland-shrub vegetation) is the second largest change. Thus the real change for deciduous forests is reduced to 808.5 ha, while transitional woodland-scrub decreases with 716 ha (Table 1). This was due mostly to forestry activities, including felling of the forest during the considered period and to a greater extent the recovery of forest cut earlier. A comparison of the results shows that the areas with recovered forests exceed by about 50% the areas with felling.
TABLE 1. Land cover changes in the Yantra River Basin determined from the CORINE land cover data for the period 1990–2000. Total change includes all transformation in particular land cover type, while in real change column, the reverse transformations were subtracted.
Land cover type Total change ha % Real change %
Forests 1,829 40% 808.5 18% Transitional woodland shrub 1,010 22% −716 −16% Pastures 393 9% −84 −2% Arable lands 1,181 26% 729 16% Agriculture with natural vegetation
112 2.4% −114 −2.5%
Urban areas 10.3 0.2% 10.3 0.2% Industrial or commercial units 5.2 0.1% 5.2 0.1%
The largest portion of the changes for agricultural land is in the northern part of the basin, 95% of them being in landscape regions II and I. The areas with forests are increased in the subbasins of the rivers Dzhulyunitsa, Stara Reka, and Golyamata Reka at the expense of the areas with tree-shrub vegetation, while these areas have decreased in the subbasins of the Rositsa River upstream of its mouth, the Dryanovska and Yantra Rivers before the Cholakovtsi village.
According to the data of BIOAEC the agricultural lands on the territory of the Yantra River Basin have been decreased by about 2% during the period 1998–2003. This reduction is distributed across the whole basin with the exception of region I, where the most fertile land is concentrated (Nedkov et al., 2005). A trend of increasing forested lands is also observed, which is better expressed in landscape regions II (4%) and landscape region I (3%). The

M. NIKOLOVA ET AL. 218
growth trend of forest areas coincides for both sources, but it is rather less expressed in CORINE data.
3.2. WATER QUALITY
According to the results of HBM, a clearly expressed tendency towards aggravation of water quality was observed in the period from the 1960s to the 1980s in accordance to social and economical changes in the region (Nedkov et al., 2005). After the late 1980s there is particular improvement of the water quality in all streams except G. Oriahovitza. Spatial analysis of the HBM data shows that during the period 1995–2004 the river-water quality has dropped down to the level observed during the 1980s and in the lower river course some quality improvement is observed relative to the 1990s (Table 2).
TABLE 2. Water quality of the Yantra River according to the biomonitoring results in 1967, 1987, 1995, and 2004. Water-quality classes: Water-quality classes according to BDS EN ISO 8689-1:2001: I – worst condition; II – bad condition; III – moderate condition; IV – good condition; V – very good condition. Locations of the sites are shown on Figure 1.
Year Jabalka Gabrovo V. Turnovo Samovodene G. Oriahovitza Karanzi Mouth
1967 V IV IV IV IV IV IV 1987 V I I II I II II 1995 V II III III I IV III 2004 V I I II I III III
Analysis of the physicochemical data for the Yantra River showed
biological oxygen demand (BOD5), ammonium nitrogen (NH4–N), nitrite nitrogen (NO2–N), phosphates (PO4), iron and insoluble substances exceeded the admissible limits. The points along the Yantra River after Gabrovo and Samovodene (after Veliko Tarnovo) and along the Rositza River after Sevlievo exhibit the greatest number of parameters (BOD5, NH4–N, NO2–N, PO4, Fe and insoluble substances) exceeding the admissible limits. In these places are situated the biggest urbanized and industrial centers and point sources of the river-water pollution.
To obtain more complete picture, the average values of water quality obtained from the HBM and the number of “hot spots” in each subbasin have been introduced as additional indicators. The results obtained from the appli-cation of the Human Stressors option of ATtILA show that the landscapes in the lower course of the Yantra River (Table 3) have the highest potential for exerting impact on river-water quality by nitrogen emissions. To differentiate the point and nonpoint sources of contamination with ammonium nitrogen, a coefficient (K) was calculated. Analysis of the results shows that for the subbasins

LANDSCAPE-HAZARD ASSESSMENT 219
where nitrogen has mainly nonpoint sources, the value of this coefficient is between 0.30 and 0.45.These data confirm some of the established results, for example the existence of a pollution source at the Gabrovo station. For other subbasins, however, the additional indicators establish the presence of point sources that were not identified previously. In particular, the subbasin of the Yantra River before the Karantsi point, where the coefficient is only 0.33 but the water quality measured is rather low (2.6). Further investigation, by means of additional differentiation for the subbasin, revealed the source of this discrepancy: It is the strongly urbanized zone around the Gorna Oryahovitsa town. An analogous procedure was applied for the subbasins of the Yantra River before Gabrovo and of the Rositsa River before Sevlievo (Table 3).
TABLE 3. Water quality indicators and characteristics in some subbasins of the Yantra River.
Subbasins Sum N mg/l N load kg/ha/year K Mean HBM No. of hot spots
Yantra Jabalka 0.8 2.5 0.32 4.0 0 Yantra Etara 2.8 3.6 0 Yantra Gabrovo 7.0 4.1 1.73 2.3 1 Yantra Samovodene 2.2 3.8 0.57 1.9 1 Yantra G. Oriahovitza 6.2 2.1 2 Yantra Karanzi 2.2 6.6 0.33 3.0 Yantra mouth 2.2 7.2 0.31 2.9 0 Rositza before Sevlievo 4.0 3.8 Rositza Sevlievo 2.2 5.6 0.39 2.5 1 Rositza mouth 2.9 5.8 0.50 2.9 1
3.3. NATURAL HAZARDS
The Yantra River Basin is characterized by high natural hazards pressure. The main hazards, floods and intensive rains, are also important factors for the activation of landslides and erosion. To evaluate the pressure of the floods and flood-induced hazards on the territory and its impact on the landscape, we first estimated the complex pressure of these hazards on the river basin, and then estimated how the changes in land cover, especially in the forest lands, enhance or mitigate the flood hazard in the catchment. Four hazard classes (1 – low, 2 – medium, 3 – high, and 4 – very high) were estimated for intensive rains, floods, landslides and erosion on the basis of frequency of occurrence of each phenomenon within each of the municipal territories in the Yantra Basin (Nedkov and Nikolova, 2006). The total loading of all investigated hazards is represented by a complex parameter (R), (Figure 2). The results show that in all landscape regions the intensive-rains hazard is estimated as medium to high,

M. NIKOLOVA ET AL. 220
flood hazard is medium only in region I and high in regions II, III, and IV. Landslide hazard is estimated as low for region I, high for region II and very high for regions III and IV. The erosion impact is low in landscape regions I, II, and IV and medium for region III. The complex pressure of the investigated hazards according to R parameter is highest for landscape region III (R = 12), followed by region IV (R = 10), III (R = 9), and I (R = 6). The highest values of R are observed in the southern part of the basin around the municipalities Veliko Tarnovo, Sevlievo, and Elena, which occupy landscape regions III and IV. The lowest values of R are for the municipalities of Polski Trambesh, Svishtov and Biala, situated in the northern part of the basin in landscape region I.
Forests have a significant regulatory effect on surface runoff, river flow, and the whole water balance in the basin, but they also have regulatory functions for some geomorphic hazards induced from heavy precipitation and floods, such as landslides and soil erosion. SWAT modeling was implemented to analyze how some changes in the natural system, such as detected changes in forest areas, enhance or mitigate the expected treat of floods.
Figure 2. Distribution of the hazard classes for intensive rains, floods, landslides, erosion, and the complex hazard class R, by landscape regions in Yantra River Basin.
Two stream-flow stations were used for the process of hazard modeling: Veliko Tarnovo and Gabrovo. The subbasins of the river upstream of these stations were delineated using AGWA. Five flood events were chosen for the process of modeling. Two of them (26 May 2005 and 06 July 1991) are characterized as very high hazard. The other three (10 May 1993, 13 April and 20 June 1992) are characterized as high level of hazard. The model simulation representing the first land cover scenario shows a slight increase (between 0.5% and 1.5%) in water quantity at the Veliko Tarnovo station, and an even smaller change in Gabrovo. The second scenario is characterized by a significant

LANDSCAPE-HAZARD ASSESSMENT 221
increase of the forested areas at the expense of arable land, transitional woodland-scrub and some urban areas. The simulation results for this scenario show a decrease of the peak flow varying from 3% to 26% for the different events. The third and most unfavorable scenario resulted in an increase of the river discharge varying from 3% to 18% (Figure 3).
Figure 3. Change of the peak river discharge at Veliko Tarnovo station in percent for five flood events according to model simulations for two scenarios (scenario 1 was not included because of the insignificant changes).
Further investigation was directed to evaluate the change of flood hazard for
the three scenarios. According to the measured water quantities for the period 1987–1998, there were 18 cases with river risings that could be characterized as a flood hazard. The modeling results from second scenario reduce the water quantity for three of them below the hazardous rating cutoff of 100 m3 s−1 at Veliko Tarnovo station. Of the two observed events classified as very high hazard (above 350 m3 s−1), one of them was reduced to the high hazard level according to the model. This translates into an overall 17% reduction of the flood hazard for that area in scenario 2. Results from the third scenario show that there are two additional cases exceeding the 100 m3 s−1 threshold, and another five coming very close. This increases the overall flood hazard by 11% or 28%, respectively.
4. Discussion and conclusions
The obtained results demonstrate that the level of environmental security with respect to both the river-water quality and flood hazard varies in the boundaries of the Yantra River Basin, and depends on the landscape patterns. The tendency towards aggravation of water quality observed in the period from the 1960s to the 1980s is due mainly to the processes of industrialization and urbanization

M. NIKOLOVA ET AL. 222
during this period, which lead to increasing the share of both industrial pollutants and household wastewater. It is characterized with intensive use of ecosystem values provided by river water. Political changes in the country during the 1990s led to an economic crisis, industrial collapse and population decline. This in turn reduced anthropogenic pressure on the environment and as a result, definite improvement of water quality and the ecological state of aquatic landscapes was observed. These changes occurred spontaneously and not as result of any purposeful measures for improving the quality of envi-ronment and hence the environmental security. Economic development towards the end of the 1990s and beginning of the 21st century led to new growth of anthropogenic pressures and to aggravation of the ecological conditions under qualitatively new circumstances, which are illustrated by the substantial territorial differences in water quality. The use of AGWA and ATtILA provides the opportunity to differentiate the pressure from point and non-point sources of contamination and in this way to analyze the relationship between water quality and land-use changes. The obtained results show that the main sources of nitrogen load in the low part of the Yantra Basin are agriculture landscapes, while in the middle part the impacts of urban area (point sources) is dominant. The impact of the river-water contamination is long term, and the impact of some of the most devastating floods, like those observed in the Yantra Basin in July 2005, has a short-term impact that usually lasts until the natural restoration of the ecosystem. However, some flood-related hazards, such as erosion or landslides, lead to land degradation that could also have a long-term impact.
The implementation of SWAT enabled the evaluation of the role of land cover changes on flood dimensions. The increase of natural vegetation and especially forest-land cover reduces the hazard, while more agricultural, urban, or barren lands increase the flood threat. This influence varies around the different subbasins according to the landscape patterns.
All investigated indicators show that the anthropogenic and natural hazard pressure is highest in the low mountain landscape region III as a result of land cover change, poor water quality, and abundant natural hazards. The biggest settlements, Veliko Turnovo and Gabrovo, with high densities of population, transportation, and industrial infrastructure, are situated in the mountainous landscape regions (III and IV). It makes these regions more vulnerable and increases the ecological and socioeconomic risk. The implementation of the complex parameter R gives good results for risk management on both landscape and administrative levels.

LANDSCAPE-HAZARD ASSESSMENT 223
Acknowledgments
The authors are grateful to Professor Gregory Knight who was kind to provide for this investigation hydrologic, climatologic and DEM data from the REKA project, sponsored by US National Science Foundation.
This work was supported from the Regional Environmental Inspectorate at Veliko Turnovo and we would like to express our gratitude to its Director, Ms. Elena Grigorova.
References
Arnold, J.G., Williams, J.R., Srinavasan, R., King, K.W., and Griggs, R.H., 1994. SWAT-Soil Water Assessment Tool. USDA, Agricultural Research Service, Grassland, Soil and Water Research Laboratory, Temple, Texas, http://www.brc.tamus.edu/swat/
Ebert, D.W. and Wade, T.G., 2004. Analytical Tools Interface for Landscape Assessments (ATtILA) Version 2004 User Manual. US-EPA Report EPA/600/R-04/083. http://www.epa.gov/nerlesd1/ land-sci/attila/
Farina, A., 2000. Principles and Methods in Landscape Ecology. Kluwer, Dordrecht, 256 pp. Forman, R.T., 1995. Some general principles of landscape and regional ecology. Landscape
Ecology 10, 133–142. Gerasimov, S., 1992. Chronology and classification of the big floods in Bulgaria. Proceedings
from Scientific Conference on Protection of the Population from Disasters and Accidents, Book IV, Sofia, 119–126.
Iankov, S., Nikolova, M., and Nedkov, S., 2004. Use of bioindicators for landscape assessment in the Yantra river basin, Central North Bulgaria. EcoSys 42, 35–49.
Janeva, J. and Rusev, B., 1997. Veranderungen der Artenzusammensetzung und Guteklasse des Bulgarishen Donauzuflusses Yantra nach dem Makrozoobenton. Lauterbornia 31, 1–6.
Miller, S.N., Semmens, D.J., Miller, R.C., Hernandez, H., Goodrich, D.C., Miller, W.P., Kepner, W.G., and Ebert, D., 2002. Automated Geospatial Watershed Assessment (AGWA): A GIS-based hydrologic modeling tool. Proceedings of the Second Federal Interagency Hydrologic Modeling Conference, Las Vegas, NV, 7/28–8/1.
Miller, S.N., Semmens, D.J., Goodrich, D.C., Hernandez, M., Miller, R.C., Kepner, W.G., and Guertin, D.P., 2007. The automated geospatial watershed assessment tool. Environmental Modeling and Software 22(3), 365–377.
Nedkov, S., Nikolova, M., and Iankov, S., 2005. Demographical changes and their influence on the landscapes in the area of Yantra river basin. EcoSys 11, 85–98.
Nedkov, S. and Nikolova, M., 2006. Modeling flood hazard in Yantra river basin. CD Proceedings of Papers from International Conference on Water Observation and System for Decision Support, 2326 May, Ohrid, Macedonia.
Nikolova, M., Aleksiev, G., Zyapkov, L., Tishkov, H., Kroumova, J., Velev, S., and Vlaskov, V., 1998. Scientific research project “Risk Analysis of Disasters and Catastrophes of Natural and Technogenic Origin in Bulgaria”. Ministry of Education and Science, Sofia (in Bulgarian).

M. NIKOLOVA ET AL. 224
Nikolova, M., 2001. Natural hazard pressure on the territory. Proceedings of the International Scientific Session “Management of Natural and Technogenic Risks”, 4–8 June, Sofia, 173–176.
Rusev, B. (Editor), 1994. Limnology of the Bulgarian Tributaries of the Danube, Sofia, 255 pp. (in Bulgarian).
Smith, R.E., Goodrich, D.C., Woolhiser, D.A., and Unkrich C.L., 1995. KINEROS – A kinematic runoff and erosion model. In: V.J. Singh (Editor), Computer Models of Watershed Hydrology, Water Resources Publications, Highlands Ranch, CO, pp. 697–732.
State of the Environment, 2004. Regional Inspectorate of Environment and Water – Velico Turnovo. http://www.riosv-vt.hit.bg.
Vatseva, R., 2005. Land cover and relief elements mapping and updating based on satellite imagery. Ph.D. thesis, 195 pp.
Velchev, A., Todorov, N., Asenov, A., and Beruchashvili, N., 1992. Landscape map of Bulgaria in scale 1:500000. Annual of the Sofia University “St. Kliment Ohridski”, Faculty of Geology and Geography, Book 2 – Geography, Vol. 84: 25–37 (in Bulgarian).