environmental effects of foreign investment versus domestic
TRANSCRIPT
1
OECD GLOBAL FORUM ON INTERNATIONAL INVESTMENTConference on Foreign Direct Investment and the Environment
Lessons to be Learned from the Mining Sector
7 - 8 February 2002OECD Headquarters, 2 rue André Pascal, 75775 CEDEX 16, Paris, France
ENVIRONMENTAL EFFECTS OF FOREIGN INVESTMENT
VERSUS DOMESTIC INVESTMENT IN THE MINING SECTOR
IN LATIN-AMERICA
Authors: Nicola BorregaardAnnie Dufey
CENTRO DE INVESTIGACION Y PLANIFICACION DEL MEDIO AMBIENTE - CIPMABucarest 046, 2ª Piso, Depto. D, Providencia - Casilla 16362 - Santiago 9 - Chile
Fonos: 3341091 - 3341096 - 2310602 - Fax (562) 3341095 - www.cipma.cl________________________________________________________________________________________________
2
LIST OF CONTENT
I. INTRODUCTION ............................................................................................................................3
II. DIRECT NATIONAL AND FOREIGN INVESTMENT IN THE MINING SECTOR.......................4II.1. Chile......................................................................................................................................4
Production ................................................................................................................................4Investment.................................................................................................................................5
II.2. Peru .......................................................................................................................................6Production ................................................................................................................................6Investments ...............................................................................................................................7
III. ENVIRONMENTAL EFFECTS OF DIRECT FOREIGN INVESTMENT.......................................8III.1. Scale Effects ........................................................................................................................9
III.1.1. Air contamination.......................................................................................................10III.1.2. Water contamination ..................................................................................................11III.1.3. Water use ....................................................................................................................12III.1.4. Other effects ...............................................................................................................12
III.2. Structural Effects ...............................................................................................................14III.3. Technology Effects ............................................................................................................14III.5. Regulatory Effects .............................................................................................................16III.6. Summary of environmental effects....................................................................................17
IV DOMESTIC AND INTERNATIONAL PRESSURES FOR IMPROVED PERFORMANCE ................17IV.1. Domestic Pressures ...........................................................................................................18IV.2. International pressures.......................................................................................................18
V. CONCLUSIONS ........................................................................................................................20
BIBLIOGRAPHY ..............................................................................................................................22
ANNEX 1 .........................................................................................................................................24
ANNEX 2 ..........................................................................................................................................28
3
I. INTRODUCTION
One of the characteristics of the world economy over the last two decades has been the strong growth in the directforeign investment flow (FDI1). In fact, more and more companies, in an increasing number of economic sectors andcountries, have decided to expand their investments beyond their borders; in parallel, the receiving parties competewith ever increasing ardour to attract these investment capitals.
The participation of developing countries in the total flow of FDI at a world scale increased continuously between1984 and 1997, year in which it reached a peak of 41%.
As for Latin-America, FDI in the Region has increased continuously, reaching a total of US$ 767 billion in 1998, afigure equivalent to about 40% of the total investment flow into developing countries.2
However, it is important to point out that the strong increase in FDI has not been spontaneous, but rather induced byimportant policy reform processes such as the opening up of the economies and changes in regulatory policies, aswell as the implementation of privatisation processes of companies in the Region.3 The agreement to grant nationaltreatment to foreign investments, endorsed by member countries of the WTO, has also contributed to this process.
The economic benefits of FDI are well-known: technological innovation, increases in competitiveness, improvementsin efficiency and transfers of intangible resources such as new forms of organisation, administration and marketing.4
On the other hand, environmentalists have argued that FDI brings along negative environmental effects especially indeveloping countries that have lower environmental standards, possibly constituting pollution havens.
Also, many developing economies, particularly those of Latin America, are characterised by their natural resourcebased production and exports, primarily in the mining, forestry and fishery sectors. These are environmentallysensitive sectors, not only with regard to the potential environmental effect involved in the processing of theresources, but also regarding the exhaustibility of the resources involved, and thus involving, especially at the locallevel, all kinds of long term sustainability issues.
This document intends to determine the environmental impact of FDI in the mining sector in Latin America.Considering the scarcity of information available on the subject within the Region, Chile and Peru have been chosenas representative, both, for the importance of these countries in regional production and exports, and because theyreflect different realities in terms of their production structures and evolution.
The impact of FDI on the environment will be measured against its scale and structural effect, its effect uponenvironmental regulations; and its effect upon technology.
Additionally, some elements which have a direct impact upon the environmental effects of the domestic and foreigninvestments will be briefly analysed. Amongst these elements, the degree of environmental consciousness amongstthe population, the existence of a regulatory framework, the financial sources of the capital base and the image factorare emphasised.
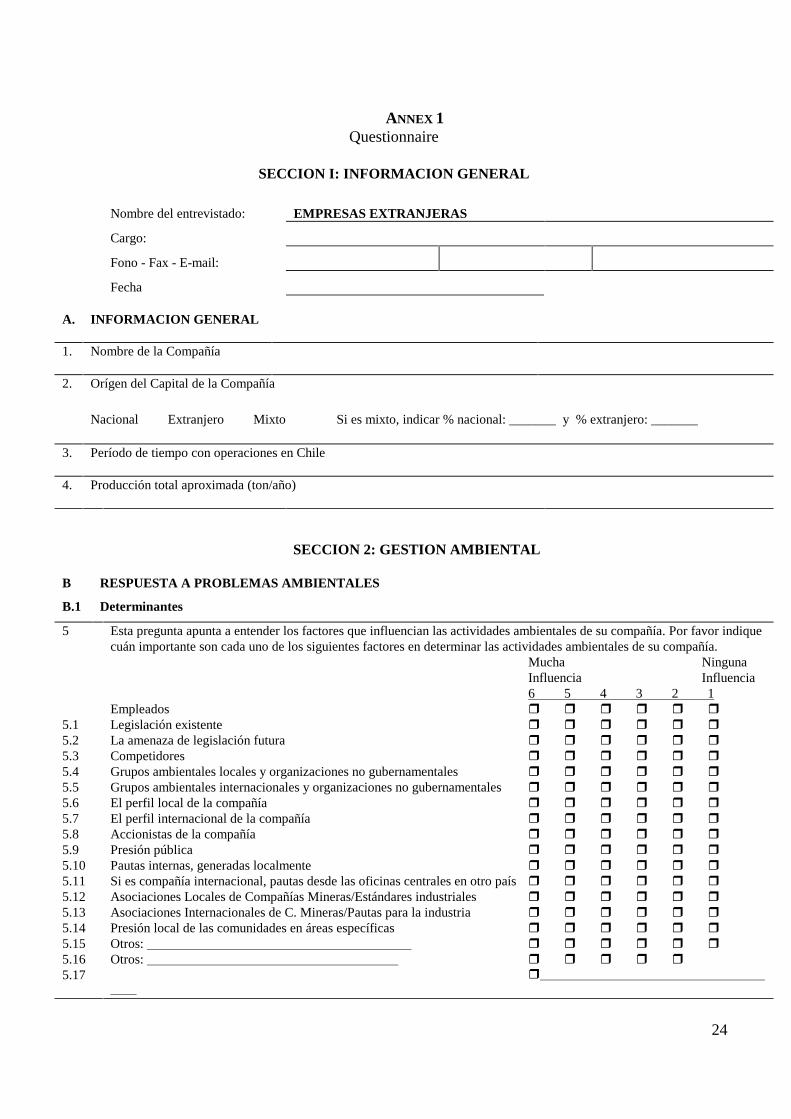
The paper´s finding are based on a literature review, interviews to selected experts in the respective countries, and asurvey that involved the major mining companies in Chile5.
1 According to the OECD benchmark definition, FDI refers to capital invested with the aim of acquiring a lastinginterest in a company and in order to exercise some degree of influence over the company’s operations.2 See CEPAL (1999)3 See OECD (1998)4 See Johnston (1999)5 This survey was applied to 50 mining companies in Chile. The survey was directed at obtaining basic informationon environmental management in foreign and domestic companies. The response rate to the survey was 26%. Therespondees make up approximately a 50% of total production. Annex 1 contains the questionnaire.
4
II. DIRECT NATIONAL AND FOREIGN INVESTMENT IN THE MINING SECTOR
During the last decade there has been an increase regarding investments in Latin America’s mining sector from US$200 million to US$ 117 billion in 1997.
Chile and Peru are the most important mining countries in Latin America. Chile is the largest copper producer in theRegion as well as in the world, now delivering about a third of the global copper production. Peru, on the otherhand, occupies the seventh place on a global level and second in Latin America. In both cases foreign investmentstatutes and tax regimes are favourable, and in the Peruvian case there has been an important privatisation process.
II.1. Chile
Production
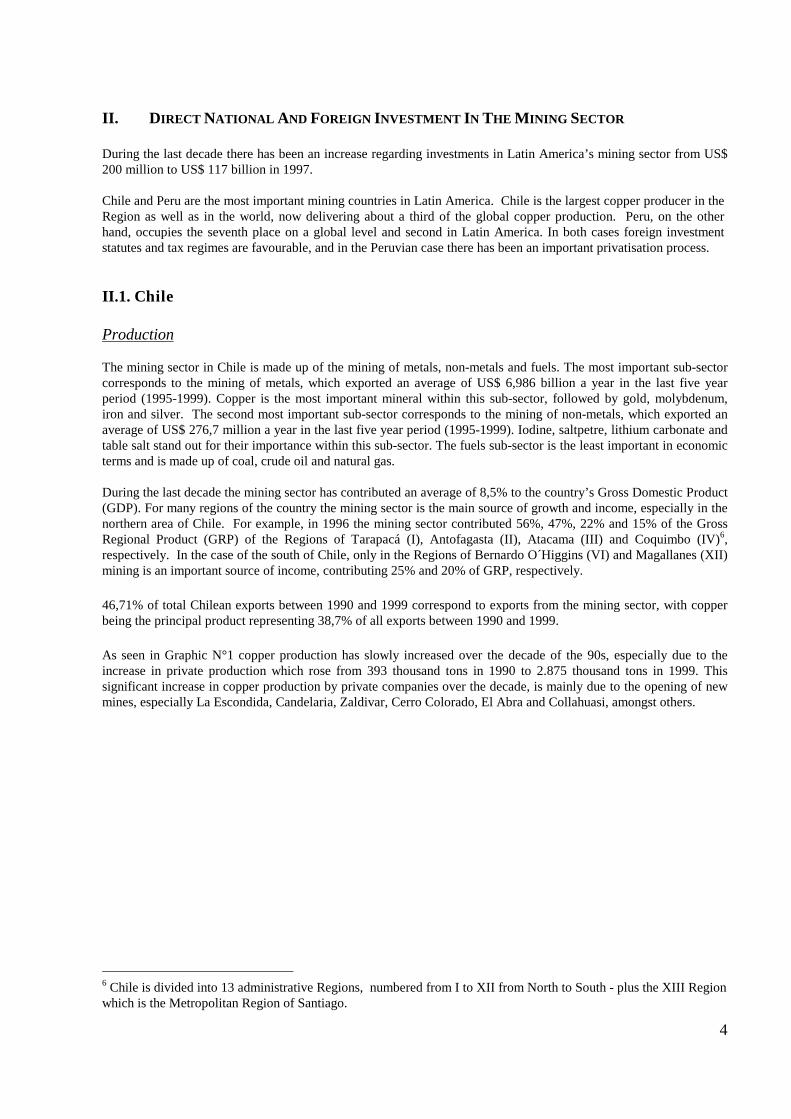
The mining sector in Chile is made up of the mining of metals, non-metals and fuels. The most important sub-sectorcorresponds to the mining of metals, which exported an average of US$ 6,986 billion a year in the last five yearperiod (1995-1999). Copper is the most important mineral within this sub-sector, followed by gold, molybdenum,iron and silver. The second most important sub-sector corresponds to the mining of non-metals, which exported anaverage of US$ 276,7 million a year in the last five year period (1995-1999). Iodine, saltpetre, lithium carbonate andtable salt stand out for their importance within this sub-sector. The fuels sub-sector is the least important in economicterms and is made up of coal, crude oil and natural gas.
During the last decade the mining sector has contributed an average of 8,5% to the country’s Gross Domestic Product(GDP). For many regions of the country the mining sector is the main source of growth and income, especially in thenorthern area of Chile. For example, in 1996 the mining sector contributed 56%, 47%, 22% and 15% of the GrossRegional Product (GRP) of the Regions of Tarapacá (I), Antofagasta (II), Atacama (III) and Coquimbo (IV)6,respectively. In the case of the south of Chile, only in the Regions of Bernardo O´Higgins (VI) and Magallanes (XII)mining is an important source of income, contributing 25% and 20% of GRP, respectively.
46,71% of total Chilean exports between 1990 and 1999 correspond to exports from the mining sector, with copperbeing the principal product representing 38,7% of all exports between 1990 and 1999.
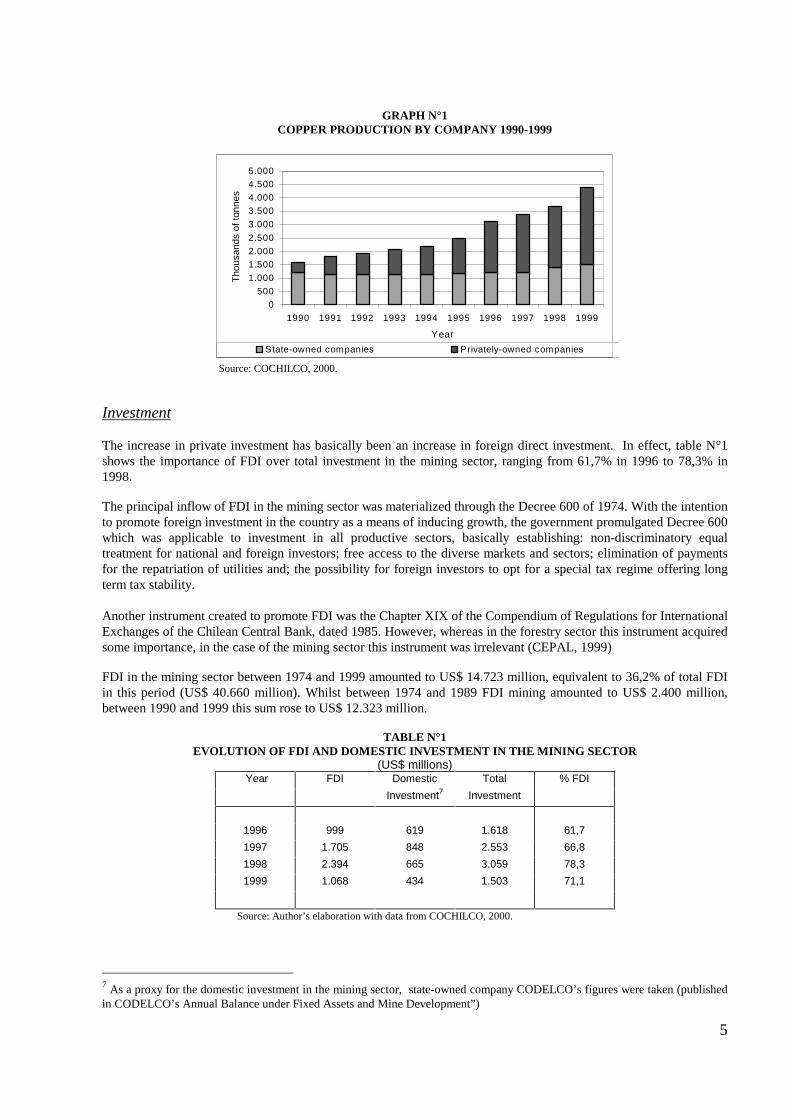
As seen in Graphic N°1 copper production has slowly increased over the decade of the 90s, especially due to theincrease in private production which rose from 393 thousand tons in 1990 to 2.875 thousand tons in 1999. Thissignificant increase in copper production by private companies over the decade, is mainly due to the opening of newmines, especially La Escondida, Candelaria, Zaldivar, Cerro Colorado, El Abra and Collahuasi, amongst others.
6 Chile is divided into 13 administrative Regions, numbered from I to XII from North to South - plus the XIII Regionwhich is the Metropolitan Region of Santiago.
5
GRAPH N°1COPPER PRODUCTION BY COMPANY 1990-1999
0500
1.000
1.5002.000
2.500
3.000
3.5004.000
4.5005.000
1990 1991 1992 1993 1994 1995 1996 1997 1998 1999
Year
Tho
usan
ds o
f ton
nes
S tate-owned companies Privately-owned companies
Source: COCHILCO, 2000.
Investment
The increase in private investment has basically been an increase in foreign direct investment. In effect, table N°1shows the importance of FDI over total investment in the mining sector, ranging from 61,7% in 1996 to 78,3% in1998.
The principal inflow of FDI in the mining sector was materialized through the Decree 600 of 1974. With the intentionto promote foreign investment in the country as a means of inducing growth, the government promulgated Decree 600which was applicable to investment in all productive sectors, basically establishing: non-discriminatory equaltreatment for national and foreign investors; free access to the diverse markets and sectors; elimination of paymentsfor the repatriation of utilities and; the possibility for foreign investors to opt for a special tax regime offering longterm tax stability.
Another instrument created to promote FDI was the Chapter XIX of the Compendium of Regulations for InternationalExchanges of the Chilean Central Bank, dated 1985. However, whereas in the forestry sector this instrument acquiredsome importance, in the case of the mining sector this instrument was irrelevant (CEPAL, 1999)
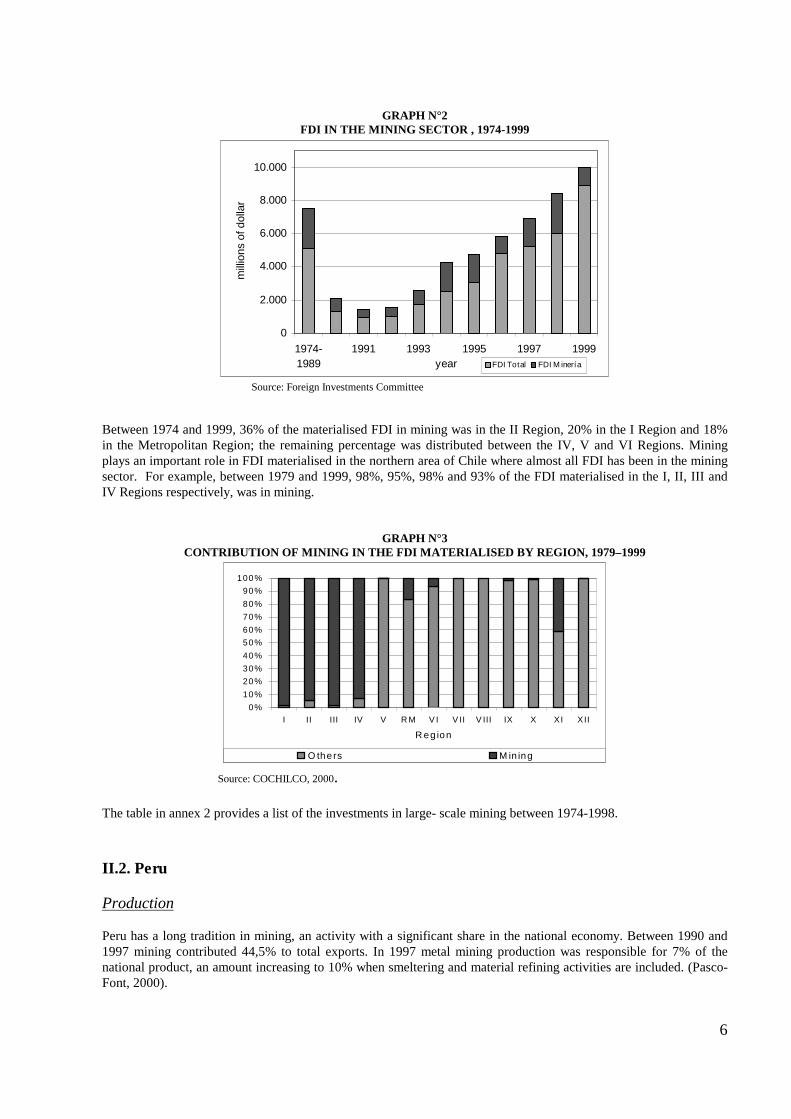
FDI in the mining sector between 1974 and 1999 amounted to US$ 14.723 million, equivalent to 36,2% of total FDIin this period (US$ 40.660 million). Whilst between 1974 and 1989 FDI mining amounted to US$ 2.400 million,between 1990 and 1999 this sum rose to US$ 12.323 million.
TABLE N°1EVOLUTION OF FDI AND DOMESTIC INVESTMENT IN THE MINING SECTOR
(US$ millions) Year FDI Domestic Total % FDI
Investment7 Investment
1996 999 619 1.618 61,7
1997 1.705 848 2.553 66,8
1998 2.394 665 3.059 78,3
1999 1.068 434 1.503 71,1
Source: Author’s elaboration with data from COCHILCO, 2000.
7 As a proxy for the domestic investment in the mining sector, state-owned company CODELCO’s figures were taken (publishedin CODELCO’s Annual Balance under Fixed Assets and Mine Development”)
6
GRAPH N°2FDI IN THE MINING SECTOR , 1974-1999
0
2.000
4.000
6.000
8.000
10.000
1974-1989
1991 1993 1995 1997 1999year
mill
ions
of d
olla
r
F DI T otal FDI Minerí a
Source: Foreign Investments Committee
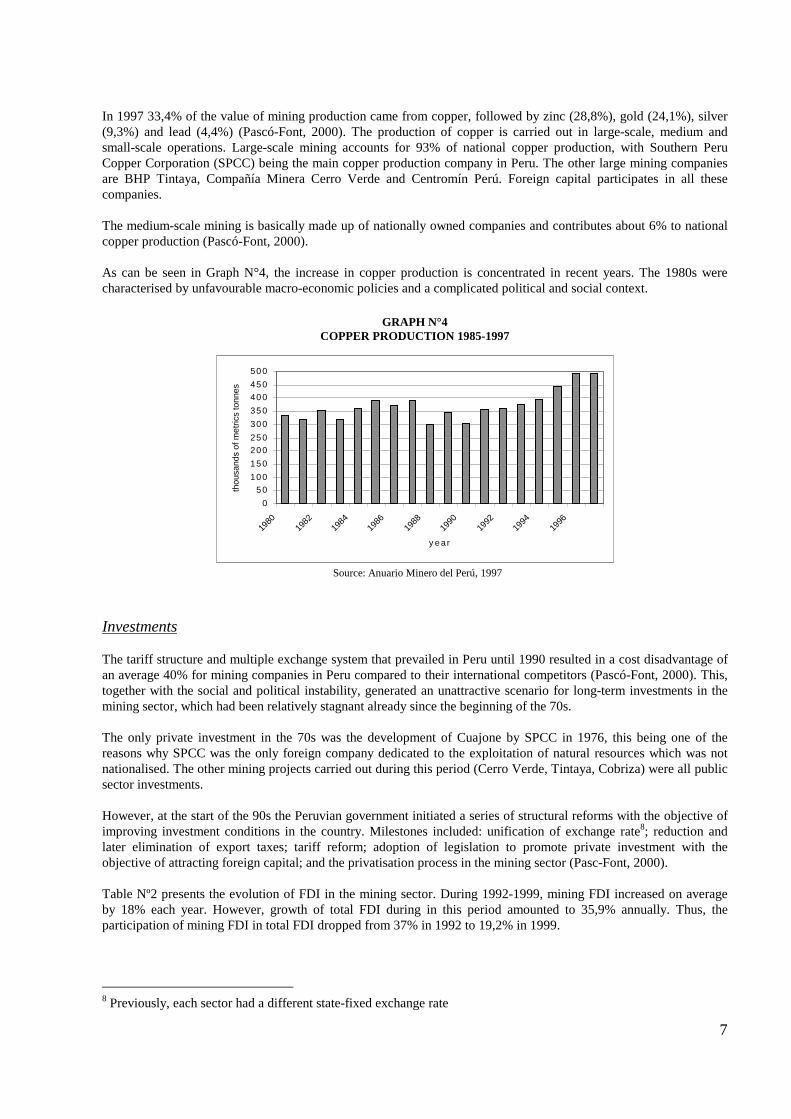
Between 1974 and 1999, 36% of the materialised FDI in mining was in the II Region, 20% in the I Region and 18%in the Metropolitan Region; the remaining percentage was distributed between the IV, V and VI Regions. Miningplays an important role in FDI materialised in the northern area of Chile where almost all FDI has been in the miningsector. For example, between 1979 and 1999, 98%, 95%, 98% and 93% of the FDI materialised in the I, II, III andIV Regions respectively, was in mining.
GRAPH N°3CONTRIBUTION OF MINING IN THE FDI MATERIALISED BY REGION, 1979–1999
0%
10%
20%
30%
40%
50%
60%
70%
80%
90%
100%
I II III IV V R M V I V II V III IX X XI XII
R eg ion
O thers M in ing
Source: COCHILCO, 2000.
The table in annex 2 provides a list of the investments in large- scale mining between 1974-1998.
II.2. Peru
Production
Peru has a long tradition in mining, an activity with a significant share in the national economy. Between 1990 and1997 mining contributed 44,5% to total exports. In 1997 metal mining production was responsible for 7% of thenational product, an amount increasing to 10% when smeltering and material refining activities are included. (Pasco-Font, 2000).
7
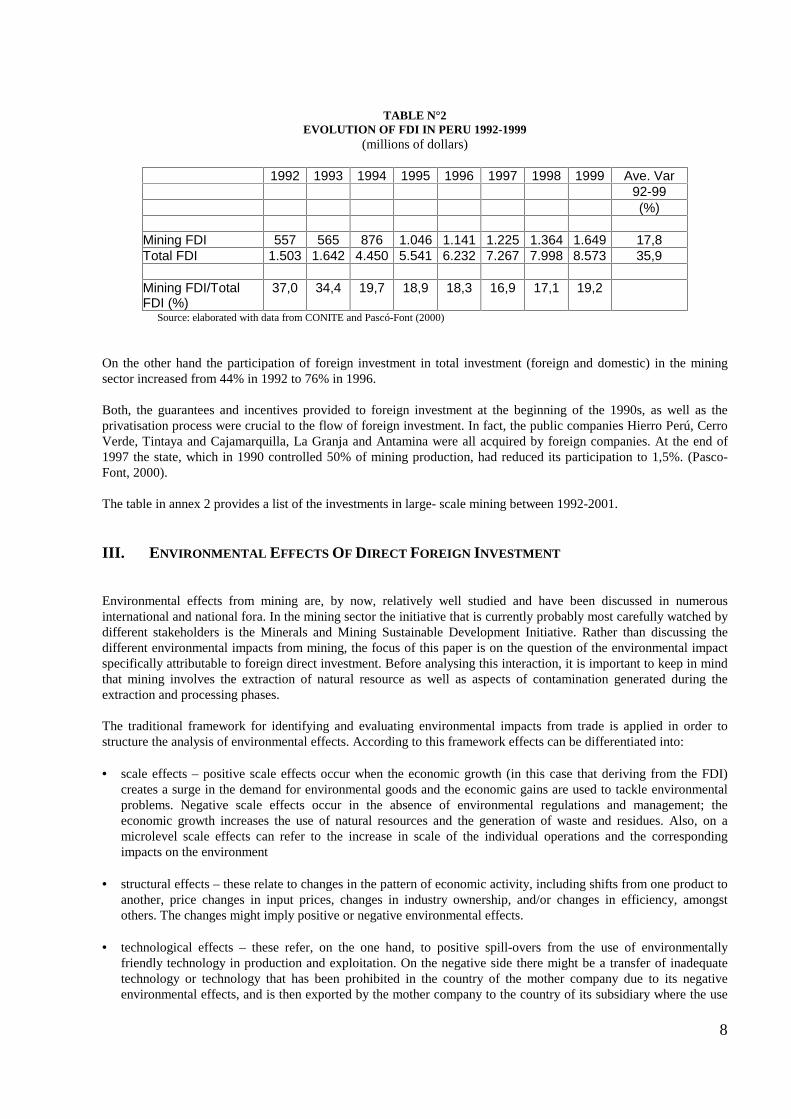
In 1997 33,4% of the value of mining production came from copper, followed by zinc (28,8%), gold (24,1%), silver(9,3%) and lead (4,4%) (Pascó-Font, 2000). The production of copper is carried out in large-scale, medium andsmall-scale operations. Large-scale mining accounts for 93% of national copper production, with Southern PeruCopper Corporation (SPCC) being the main copper production company in Peru. The other large mining companiesare BHP Tintaya, Compañía Minera Cerro Verde and Centromín Perú. Foreign capital participates in all thesecompanies.
The medium-scale mining is basically made up of nationally owned companies and contributes about 6% to nationalcopper production (Pascó-Font, 2000).
As can be seen in Graph N°4, the increase in copper production is concentrated in recent years. The 1980s werecharacterised by unfavourable macro-economic policies and a complicated political and social context.
GRAPH N°4COPPER PRODUCTION 1985-1997
0
5 0
10 0
15 0
20 0
25 0
30 0
35 0
40 0
45 0
50 0
1980
1982
1984
1986
1988
1990
1992
1994
1996
y e ar
thou
sand
s of
met
rics
tonn
es
Source: Anuario Minero del Perú, 1997
Investments
The tariff structure and multiple exchange system that prevailed in Peru until 1990 resulted in a cost disadvantage ofan average 40% for mining companies in Peru compared to their international competitors (Pascó-Font, 2000). This,together with the social and political instability, generated an unattractive scenario for long-term investments in themining sector, which had been relatively stagnant already since the beginning of the 70s.
The only private investment in the 70s was the development of Cuajone by SPCC in 1976, this being one of thereasons why SPCC was the only foreign company dedicated to the exploitation of natural resources which was notnationalised. The other mining projects carried out during this period (Cerro Verde, Tintaya, Cobriza) were all publicsector investments.
However, at the start of the 90s the Peruvian government initiated a series of structural reforms with the objective ofimproving investment conditions in the country. Milestones included: unification of exchange rate8; reduction andlater elimination of export taxes; tariff reform; adoption of legislation to promote private investment with theobjective of attracting foreign capital; and the privatisation process in the mining sector (Pasc-Font, 2000).
Table Nº2 presents the evolution of FDI in the mining sector. During 1992-1999, mining FDI increased on averageby 18% each year. However, growth of total FDI during in this period amounted to 35,9% annually. Thus, theparticipation of mining FDI in total FDI dropped from 37% in 1992 to 19,2% in 1999.
8 Previously, each sector had a different state-fixed exchange rate
8
TABLE N°2EVOLUTION OF FDI IN PERU 1992-1999
(millions of dollars)
1992 1993 1994 1995 1996 1997 1998 1999 Ave. Var 92-99 (%) Mining FDI 557 565 876 1.046 1.141 1.225 1.364 1.649 17,8Total FDI 1.503 1.642 4.450 5.541 6.232 7.267 7.998 8.573 35,9 Mining FDI/TotalFDI (%)
37,0 34,4 19,7 18,9 18,3 16,9 17,1 19,2
Source: elaborated with data from CONITE and Pascó-Font (2000)
On the other hand the participation of foreign investment in total investment (foreign and domestic) in the miningsector increased from 44% in 1992 to 76% in 1996.
Both, the guarantees and incentives provided to foreign investment at the beginning of the 1990s, as well as theprivatisation process were crucial to the flow of foreign investment. In fact, the public companies Hierro Perú, CerroVerde, Tintaya and Cajamarquilla, La Granja and Antamina were all acquired by foreign companies. At the end of1997 the state, which in 1990 controlled 50% of mining production, had reduced its participation to 1,5%. (Pasco-Font, 2000).
The table in annex 2 provides a list of the investments in large- scale mining between 1992-2001.
III. ENVIRONMENTAL EFFECTS OF DIRECT FOREIGN INVESTMENT
Environmental effects from mining are, by now, relatively well studied and have been discussed in numerousinternational and national fora. In the mining sector the initiative that is currently probably most carefully watched bydifferent stakeholders is the Minerals and Mining Sustainable Development Initiative. Rather than discussing thedifferent environmental impacts from mining, the focus of this paper is on the question of the environmental impactspecifically attributable to foreign direct investment. Before analysing this interaction, it is important to keep in mindthat mining involves the extraction of natural resource as well as aspects of contamination generated during theextraction and processing phases.
The traditional framework for identifying and evaluating environmental impacts from trade is applied in order tostructure the analysis of environmental effects. According to this framework effects can be differentiated into:
• scale effects – positive scale effects occur when the economic growth (in this case that deriving from the FDI)creates a surge in the demand for environmental goods and the economic gains are used to tackle environmentalproblems. Negative scale effects occur in the absence of environmental regulations and management; theeconomic growth increases the use of natural resources and the generation of waste and residues. Also, on amicrolevel scale effects can refer to the increase in scale of the individual operations and the correspondingimpacts on the environment
• structural effects – these relate to changes in the pattern of economic activity, including shifts from one product toanother, price changes in input prices, changes in industry ownership, and/or changes in efficiency, amongstothers. The changes might imply positive or negative environmental effects.
• technological effects – these refer, on the one hand, to positive spill-overs from the use of environmentally
friendly technology in production and exploitation. On the negative side there might be a transfer of inadequatetechnology or technology that has been prohibited in the country of the mother company due to its negativeenvironmental effects, and is then exported by the mother company to the country of its subsidiary where the use
9
has not yet been restricted. • regulatory / policy effects – these refer to potential effects on domestic environmental regulation. Positive impacts
would refer to pressures to improve regulation, and negative impacts refer to downward pressure due tocompetitiveness (“race to the bottom”) in order to attract more foreign investment9
Some general issues There are some general aspects to emphasize beyond the above-mentioned analytical framework: Before anything, it should be kept in mind that the differentiation between foreign and domestic investment hasbecome, by now, increasingly difficult. Different companies have various owners, and different operations are run, inturn, by different companies. Joint ventures are common and, given the large amount of capital required in miningoperations, are a necessity in the sector. Thus, in this context the FDI is becoming more and more blurred and cannotbe assessed easily through individual operations. The more open the economy is, differences between large domesticand foreign investment are becoming increasingly subtle. Having said this in the following it will be shown that thesesubtle differences can still be extremely important. It is impossible to provide an overall evaluation in the sectors about the effects of FDI. Authors, such as Pasco-font(2000) for the Peruvian case, have referred to the privatisation process, in which FDI has played an important role,stating that: “The net environmental effect of “this process” (in this case the privatisation process) is positive.”However, quantitative and qualitative data is missing to follow up such statements. According to our survey results, foreign investment operations and domestic operations have converged in theirenvironmental management practices over the last decade. Today all companies have environmental departments withan average of 4 employees, all companies have some sort of monitoring for water and air quality in place, but arelacking monitoring for soil quality; all companies have an environmental policy and written directives, and theaverage budget for environmental affairs amounts to 1-5% of the overall budget in both, national and foreigncompanies. This result compares to previous findings – such as Geisse (1990), or Borregaard et al. (1998) which emphasize thedifference in environmental performance between foreign and domestic companies in the 1980s and early 1990s. Theinvolvement of Chilean state-owned copper company CODELCO, alongside multinational mining companies, inimportant initiatives directed at improving the environmental performance in the sector – such as the Minerals andMining Sustainable Development Initiative – is an indication that validates, at least partly, the survey results. On the other hand there seem to remain some differences, reflected for example in the fact that so far it is onlyforeign owned companies that have certified in ISO 14001.10
Motivations behind environmental activities and preoccupation – such as existing environmental regulations,environmental awareness of civil society, past environmental abuses (historical burden) – are analysed in the lastchapter of this paper. Different factors can constitute significant conditioners to environmental effects of FDI. Forexample, whereas FDI exerts influence onto domestic environmental regulation, domestic environmental regulationalso influences the environmental effects of FDI. III.1. Scale Effects For both countries analysed the previous chapter has described the explosive expansion in the mining sector,primarily due to foreign investments. Undoubtedly, this expansion - in the Chilean case an expansion by factor 3 inthe decade of the 1990s - carries along significant environmental effects. Even the cleanest production process still
9 For amore detailed description of this framework and the analytical aspects see for example UNEP (1999), orOECD (1995) 10 In the Chilean case the ISO 14001 certified companies in the mining sector are: La Escondida (BHP), Candelaria(Phelps Dodge)
10
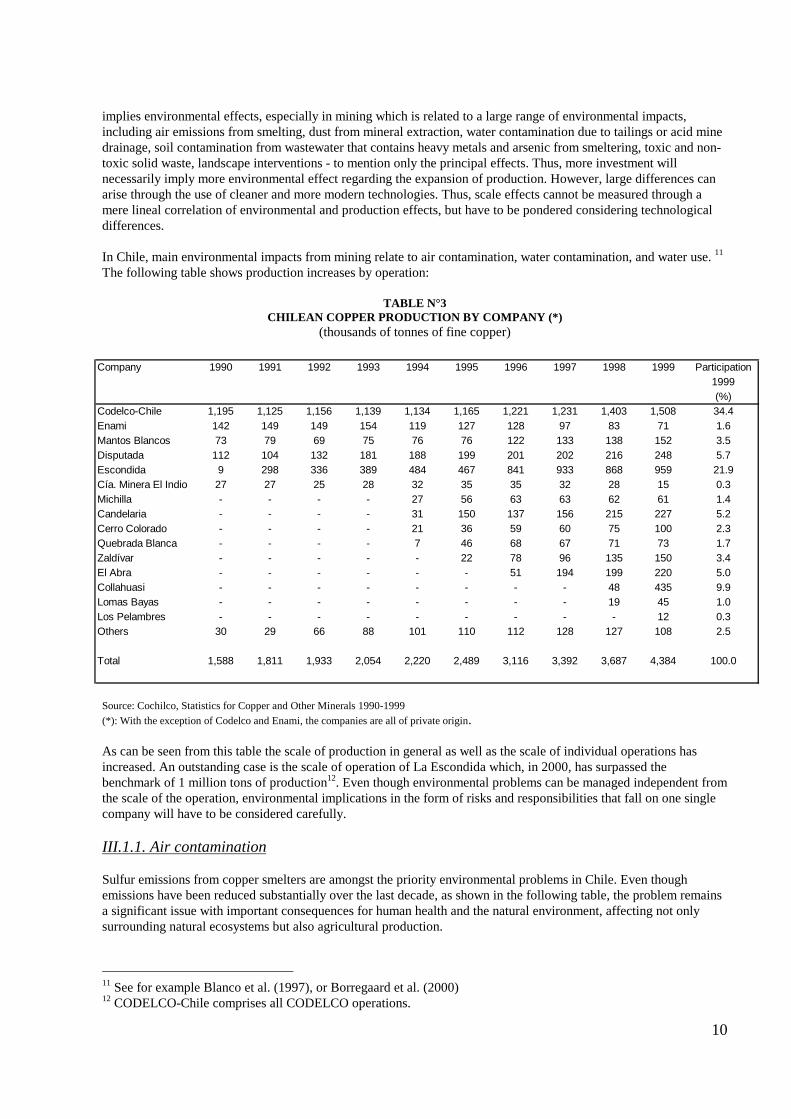
implies environmental effects, especially in mining which is related to a large range of environmental impacts,including air emissions from smelting, dust from mineral extraction, water contamination due to tailings or acid minedrainage, soil contamination from wastewater that contains heavy metals and arsenic from smeltering, toxic and non-toxic solid waste, landscape interventions - to mention only the principal effects. Thus, more investment willnecessarily imply more environmental effect regarding the expansion of production. However, large differences canarise through the use of cleaner and more modern technologies. Thus, scale effects cannot be measured through amere lineal correlation of environmental and production effects, but have to be pondered considering technologicaldifferences. In Chile, main environmental impacts from mining relate to air contamination, water contamination, and water use. 11
The following table shows production increases by operation:
TABLE N°3 CHILEAN COPPER PRODUCTION BY COMPANY (*)
(thousands of tonnes of fine copper)
Source: Cochilco, Statistics for Copper and Other Minerals 1990-1999
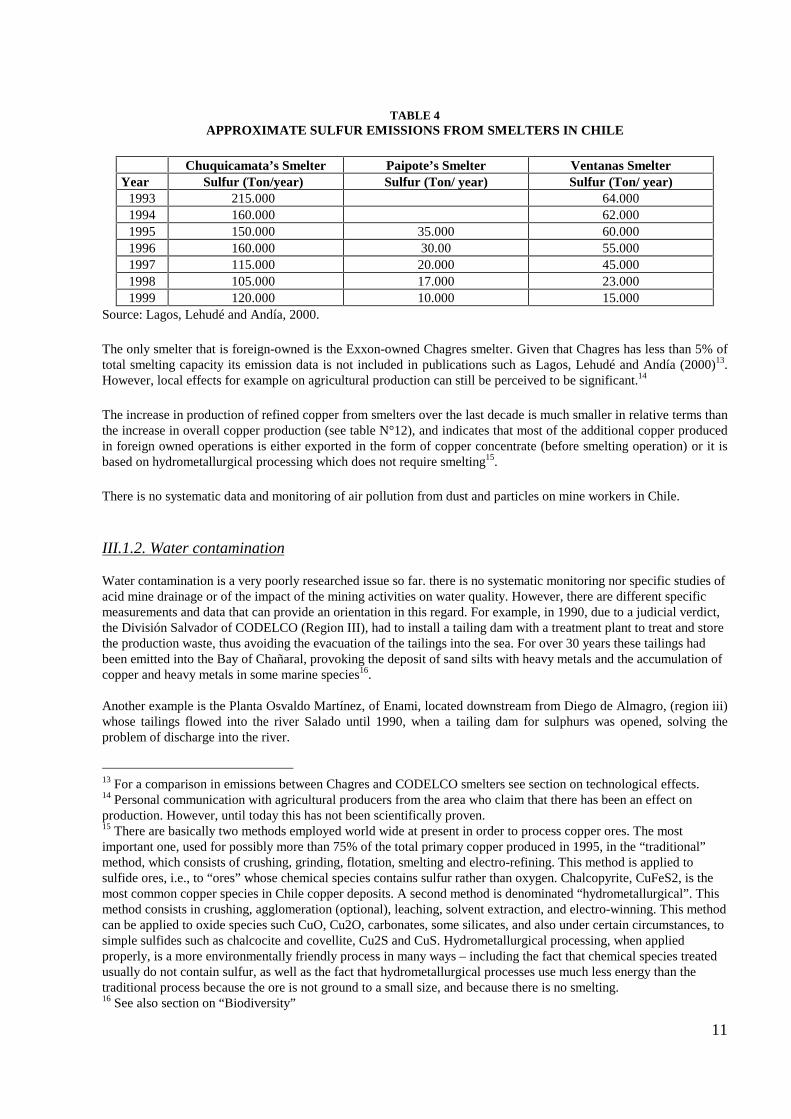
(*): With the exception of Codelco and Enami, the companies are all of private origin. As can be seen from this table the scale of production in general as well as the scale of individual operations hasincreased. An outstanding case is the scale of operation of La Escondida which, in 2000, has surpassed thebenchmark of 1 million tons of production12. Even though environmental problems can be managed independent fromthe scale of the operation, environmental implications in the form of risks and responsibilities that fall on one singlecompany will have to be considered carefully. III.1.1. Air contamination Sulfur emissions from copper smelters are amongst the priority environmental problems in Chile. Even thoughemissions have been reduced substantially over the last decade, as shown in the following table, the problem remainsa significant issue with important consequences for human health and the natural environment, affecting not onlysurrounding natural ecosystems but also agricultural production.
11 See for example Blanco et al. (1997), or Borregaard et al. (2000)12 CODELCO-Chile comprises all CODELCO operations.
Company 1990 1991 1992 1993 1994 1995 1996 1997 1998 1999 Participation1999(%)
Codelco-Chile 1,195 1,125 1,156 1,139 1,134 1,165 1,221 1,231 1,403 1,508 34.4Enami 142 149 149 154 119 127 128 97 83 71 1.6Mantos Blancos 73 79 69 75 76 76 122 133 138 152 3.5Disputada 112 104 132 181 188 199 201 202 216 248 5.7Escondida 9 298 336 389 484 467 841 933 868 959 21.9Cía. Minera El Indio 27 27 25 28 32 35 35 32 28 15 0.3Michilla - - - - 27 56 63 63 62 61 1.4Candelaria - - - - 31 150 137 156 215 227 5.2Cerro Colorado - - - - 21 36 59 60 75 100 2.3Quebrada Blanca - - - - 7 46 68 67 71 73 1.7Zaldívar - - - - - 22 78 96 135 150 3.4El Abra - - - - - - 51 194 199 220 5.0Collahuasi - - - - - - - - 48 435 9.9Lomas Bayas - - - - - - - - 19 45 1.0Los Pelambres - - - - - - - - - 12 0.3Others 30 29 66 88 101 110 112 128 127 108 2.5
Total 1,588 1,811 1,933 2,054 2,220 2,489 3,116 3,392 3,687 4,384 100.0
11
TABLE 4APPROXIMATE SULFUR EMISSIONS FROM SMELTERS IN CHILE
Chuquicamata’s Smelter Paipote’s Smelter Ventanas SmelterYear Sulfur (Ton/year) Sulfur (Ton/ year) Sulfur (Ton/ year)
1993 215.000 64.0001994 160.000 62.0001995 150.000 35.000 60.0001996 160.000 30.00 55.0001997 115.000 20.000 45.0001998 105.000 17.000 23.0001999 120.000 10.000 15.000
Source: Lagos, Lehudé and Andía, 2000.
The only smelter that is foreign-owned is the Exxon-owned Chagres smelter. Given that Chagres has less than 5% oftotal smelting capacity its emission data is not included in publications such as Lagos, Lehudé and Andía (2000)13.However, local effects for example on agricultural production can still be perceived to be significant.14
The increase in production of refined copper from smelters over the last decade is much smaller in relative terms thanthe increase in overall copper production (see table N°12), and indicates that most of the additional copper producedin foreign owned operations is either exported in the form of copper concentrate (before smelting operation) or it isbased on hydrometallurgical processing which does not require smelting15. There is no systematic data and monitoring of air pollution from dust and particles on mine workers in Chile. III.1.2. Water contamination Water contamination is a very poorly researched issue so far. there is no systematic monitoring nor specific studies ofacid mine drainage or of the impact of the mining activities on water quality. However, there are different specificmeasurements and data that can provide an orientation in this regard. For example, in 1990, due to a judicial verdict,the División Salvador of CODELCO (Region III), had to install a tailing dam with a treatment plant to treat and storethe production waste, thus avoiding the evacuation of the tailings into the sea. For over 30 years these tailings hadbeen emitted into the Bay of Chañaral, provoking the deposit of sand silts with heavy metals and the accumulation ofcopper and heavy metals in some marine species16.
Another example is the Planta Osvaldo Martínez, of Enami, located downstream from Diego de Almagro, (region iii)whose tailings flowed into the river Salado until 1990, when a tailing dam for sulphurs was opened, solving theproblem of discharge into the river.
13 For a comparison in emissions between Chagres and CODELCO smelters see section on technological effects.14 Personal communication with agricultural producers from the area who claim that there has been an effect onproduction. However, until today this has not been scientifically proven. 15 There are basically two methods employed world wide at present in order to process copper ores. The mostimportant one, used for possibly more than 75% of the total primary copper produced in 1995, in the “traditional”method, which consists of crushing, grinding, flotation, smelting and electro-refining. This method is applied tosulfide ores, i.e., to “ores” whose chemical species contains sulfur rather than oxygen. Chalcopyrite, CuFeS2, is themost common copper species in Chile copper deposits. A second method is denominated “hydrometallurgical”. Thismethod consists in crushing, agglomeration (optional), leaching, solvent extraction, and electro-winning. This methodcan be applied to oxide species such CuO, Cu2O, carbonates, some silicates, and also under certain circumstances, tosimple sulfides such as chalcocite and covellite, Cu2S and CuS. Hydrometallurgical processing, when appliedproperly, is a more environmentally friendly process in many ways – including the fact that chemical species treatedusually do not contain sulfur, as well as the fact that hydrometallurgical processes use much less energy than thetraditional process because the ore is not ground to a small size, and because there is no smelting.16 See also section on “Biodiversity”
12
Currently, mining activity still causes contamination in the rivers San José, Loa, (Region II), Limari, Cogotí (RegionIV) Aconcagua, Chacabuquito, Rapel (Region V) and the Alhué marsh and in the Pampa del Tamarugal (Region I) -Quebrada Cahuisa (Universidad de Chile, 1999).
One of the few studies on mining and water contamination, carried out by Universidad de Chile (1999), shows thatthe river Loa has consistently exceeded the regulated levels for arsenic in irrigation and drinking water. However,there is no apparent relationship between the copper production levels and the arsenic concentration in the watersdownstream of the river Loa. The only extremely severe case of water contamination due to large scale miningoperations has been the case of El Chañaral, in which tailings from the state-owned copper company CODELCOwere emitted directly and for many years into a bay close to the mining operations, a fact that has led to the exodus ofthe ecosystem in and around the bay, and has only been remedied after damage has been irreversibly done.17
III.1.3. Water use With regard to water use the additional pressure on environmental resources due to foreign investment can besignificant at the local or regional level. The situation of water use is critical in the Chilean mining regions which aremainly desert areas. Each water right bought up by mining companies implies an opportunity cost with regard to otherproductive activities. In the II and the III Region the mining sector consumes about 70 and 60% of the waterrespectively. The General Water Authority (1996) had calculated a 50% increase in water demand by the miningsector during 1993-2017, on the basis of existing and projected investments. On account of the increase in waterdemand from the mining sector in Northern Chile, a price increase in water use rights can be expected. Also, miningoperations often use underground water for exploitation. In this case it is important to determine whether theacquifers used are confined or nor. If the aquifer were confined, implying that there is no entry or exit of water, itsuse would correspond to exploitation of a non-renewable resource, implying a cost to future generations. It is not clear in how far technological improvements, such as the application of hydrometallurgical instead ofpyrometallurgical processes18, reduce the use of water. Not only the application of hydrometallurgical processes canlead to a significant reduction in the use of water, but also recycling contributes to the minimization of water use.According to our survey results, whereas most of the national companies recycle less than 10% of the water used, themajority of the foreign owned companies recycle more than 50% of the water. III.1.4. Other effects
Beyond the environmental impacts from production it is important to remember the issue of resource exploitation.Minerals are considered a non-renewable finite resource, especially at the local level. An increased pace of extractionleads to an accelerated depletion of the resource and an early cease of mining operations. As was seen in the previous chapter, the dependence on mining operations is significant in some areas, such as in theII Region in Chile. This can have serious consequences for the economic and social sustainability in the affectedareas.19 There have been several examples of mine operation closures in the past in the Region, one of the mostemblematic being the saltpetre operations in Chile which are now ghost towns and tourist attractions in the north ofChile. Many experts as well as local groups would argue that the key sustainability issue related to mining is the exhaustion
17 In another case, the recent contamination of the Loa river, cause-effect relationships could not be proven betweenoperations from CODELCO and the contamination. 18 Unit consumption figures vary between o,2 and 0,7m3/ton of mineral in hydrometallurgical processes and 0,5 to2,0 m3/ton of mineral in pyrometallurgical processes. 19 Even though copper companies in the II Region in Chile have, in the past, discovered always larger resources, thisphenomenon cannot be expected to everlasting. According to Borregaard et al. (2000) currently most large operationsplan to close between 2017 and 2030.
13
of the resource, closely linked to the question of local development.20 In general in Latin America there are no specialtaxes on mining operations to assure the economic, social and environmental sustainability of the mining regions aftermine closure, and there are few programs to ensure local development whilst the mines are still operational. Thus, itdepends currently on individual companies´ initiative whether local sustainability schemes are implemented. One ofthe first examples in the Region in which a company has taken the initiative and has established a scheme on a smallscale, is the Foundation La Escondida in the II Region in Chile. The Foundation operates on the basis of the interestsaccruing to an endowment made by Minera Escondida. The Foundation has thus an independent, perpetuateexistence.21 Having said this, to create a Foundation is not the only way to ensure long term sustainability. State-owned CODELCO is investing continuously large sums into local community development and has implementedprograms with indigenous and agricultural communities, guaranteeing sustainability beyond the mine´s operation inthe area.22 First studies show that foreign companies do not differ, on average, from domestic companies, neither inamounts of resources provided to the community23 nor in the quality of community relations, reflected for example bythe degree of participation of local groups in the design, and implementation of projects financed by the company anddirected at improvements of quality of life in the communities. Rather than long term agreements between thecompanies and the local community there is a tradition of paternalistic relationships between the company and thelocal community, something that will take time, effort and creativity to change.24 In the results of the Mining andMinerals Sustainable Development (MMSD) initiative the importance of the social role of the mining industry inlocal development and the necessity to make progress in this area is emphasized for the Latin American Region. The environmental impact and risks that remain behind after mine closure are also an important aspect to beconfronted. So far, none of the investors has a detailed, official mine closure plan,25 and very few a plan to try to re-establish conditions previous to the mining operation, landscape variation, and other effects related to the burden ofmonitoring very long term environmental risks. Again, there is thus a scale effect in terms of long term effects beyondmine closure. However, it has to be pointed out that, whereas foreign investment have a closure plan26, there is nonedomestic investment that has a closure plan a this stage. In Peru, “Up to a few years ago the environmental performance of the Peruvian mining sector has been very poor”.(p.24, Pasco-Font (2000)) The most significant environmental conflicts have been identified to be related to aircontamination around smelters and water contamination due to the absence of adequate tailing dams. 27
In the Peruvian case it is important to note that foreign investment basically implied the acquisition and amplificationof existing mining operations.28 Thus, increases in production have not been based on an expansion of operations butrather an improvement of existing operations. Pasco-Font (2000) states that approximately a 51% of the increase inproduction is due to the use of hydrometallurgical processes. Thus again, scale effects and technological changes gohand in hand. For the case of Southern Peru Copper Pasco-Font (2000) calculated scale effects, due to the increase inproduction of 110.000 tons of refined copper between 1990 and 1997, and technological effects, and came to theconclusion that technological effects outweighed scale effects substantially. There have not been any calculations forthe total Peruvian copper production, but Pasco-Font cites other examples of production increases with parallel
20 The preliminary results of the Mining and Minerals Sustainable Development Initiative (MMSD –www.iied.org/mmsd/) for Chile as well as for Peru indicate that the stakeholders in both countries attribute firstpriority to local development amongst all sustainable development issues. This confirms the finding of previous,more limited studies in scope (see for example Borregaard et al. (2000) 21 For a more detailed description of the Foundation see for example Ojeda,J.M. (2000)22 Ongoing work by the Mining Policy Research Initiative, Uruguay, together with the CIPMA, Chile: “Actividadesde Desarrollo Comunitario de Empresas Mineras y de Explotación de Recursos Naturales en América Latina y elCaribe”, March 2001 - August 2001, (forthcoming)See project undertaken by the Mining Policy Research Initiative, Uruguay – publication forthcoming23 In a very preliminary study Borregaard et al. (2000)) attempted to quantify the resources mining companies spendon the local community in Chile. Due to a lack of systematicity in the companies´ policies and accounting proceduresexact amounts could not be quantified – contributions consisted in financial (in general amounting to not more thanabout US$100.000,-per year) and in kind contributions.24 See project undertaken by the Mining Policy Research Initiative, Uruguay – publication forthcoming 25 Not yet obligatory in any of the two countries, but under elaboration. 26 In our survey, eight foreign companies (from a total of 10) state to have a closure plan . 27 See for example Tolmos (2000) or Pasco-font (2000) 28 An exception is the Antamina project which should enter in production in 2002.
14
investments into technological improvements. In the Chilean case, as foreign investment has not implied the acquisition of existing operations, but rather theinstallation of new operations, scale effects are likely to outweigh technological effects - only if there has been awide-spread adoption of cleaner technologies clearly attributable to FDI – that is use of clean technology in theforeign owned operations combined with significant spill-overs to the rest of the industry – could technologicaleffects and possibly structural effects compensate scale effects. This is analysed in the next sections. III.2. Structural Effects
Two structural effects from FDI in mining are worth mentioning regarding potential environmental effects:
• in Chile the relative increase in the production and export of copper concentrate versus refined copper.
• the increase in production and exports that has been identified to have led to a reduction in world market prices
The first of these could have positive environmental impacts given that smelting activities to obtain refined copperhave the above-mentioned effects regarding air contamination. However, at the same time, less refinement impliesless value added, less work force, and thus less community development, thus negatively affecting the environment inthe widest sense.
The second effect has been pointed out by authors such as Blanco et al. (1997) to induce structural changes regardingthe size structure of the mining companies. Economic viability of small-scale mining, faced with declining worldmarket prices, is in danger. In Chile there are government subsidies to small scale operations in times of low worldmarket prices. Environmental effects of small scale mining in Latin America have been analysed by authors such asMcMahon et al. (1998). According to the authors, “…on average artisanal and small scale mining is significantlydirtier per unit of output than other types of mining” (p.10)As to the policy of subsidizing the activity at times when world market prices are low, experts´ opinion is reflected inIENIM (1996): “…Solving the environmental and social problems associated with informal mining should focus onalleviating the worst aspects of the situation without subsidizing or otherwise prolonging uneconomic operations.”(p.74)
Ambiguity prevails regarding the social and community development effects from small scale mining – whereas onthe one hand it can provide more (at least perceived) net benefits to the local community, it can also imply culturaldamage due to entry or invasion of sensitive tribal lands, when small miners outnumber the local population and forma dominant sub-culture.29
III.3. Technology Effects Pasco-Font (2000) states that the foreign investments that have brought along environmentally friendliertechnologies, and that were basically motivated by reasons of competitiveness, on the international markets, havebeen a decisive factor in environmental improvement in the Peruvian mining sector. Examples of these investments into new technologies have included, amongst many others, US$ 445 million inmodernization in Southern Peru Copper, including US$ 135 million for a sulphuric acid plant30 and some additionalmillions for improvement of the tailing dams and other environmental projects. In the case of Sociedad Minera CerroVerde investments into new technologies have amounted to US$ 485 million during 1993-1998. Thus, theprivatisation process has implied a technological transformation process. The previously mentioned increased use ofhydrometallurgical processes implies lower environmental impacts than in traditional pyrometallurgical processes,basically due to a lower water use and no air emissions. The Chilean case is somewhat different. State-owned CODELCO still exists, and it was the state-owned company that
29 See McMahon et al. (1998) 30 According to Pasco-font (2000) Southern Peru Copper plans to invest into a Kennecott-Outokumpu FlashConverting Process by the year 2003, a technology which would reduce emissions to a minimum.
15
had to carry the burden of all investments necessary for technological adaptation in the operations that date fromdecades ago. Between 1994 and 1999s CODELCO has invested US$ 727 millions into environmental improvements,including technologies to reduce air emissions, investments into tailing dams and others. As Borregaard et al (1998)have stated, the introduction and use of environmentally friendly technology cannot be attributed directly to FDI.Many of the new technologies have been developed by Chilean companies - such as the Teniente Furnace - andothers such as hydrometallurgic processes have been adopted and adapted quickly by foreign and domesticscompanies alike. Experts state that currently there are no technological differences between new CODELCO operations and foreignowned companies. However, for older CODELCO operations differences are still evident. For example with regard toemissions Blanco et al. (1997) have analysed the performance of air emissions generated by Exxon-owned Chagresversus air emissions generated by Chilean owned operations. It was concluded from the analysis carried out that: · the emission levels of the refineries have been (or will be) reduced; · Codelco began to reduce the emissions from its refineries at the end of the 1980s and the start of the 1990s and
the most significant reductions are not expected until 2000; · Enami’s refineries were the last to implement reduction plans and until 1997 still did not show significant
emission reductions; · Exxon’s refinery have shown a significantly better environmental performance than the state-owned refineries.
This foundry began to carry out environmental investments in the mid-70s (with the construction of the firstsulphuric acid plant) and during the 1980s and 1990s the refinery undertook considerable environmentalimprovements. Its emissions per unit of refined copper are far lower than those of Codelco and Enami, averagingover the period considered a 30% of the emissions of Codelco and Enami.
With regard to “soft technologies” such as environmental management, whereas there have been large differences inenvironmental management between CODELCO and foreign –owned companies in the 1980s and early 1990s, aspointed out above, today these differences have become smaller. According to our survey results, today allcompanies, domestic and foreign, have a department of environment with an average of 4 employees. Both types ofcompanies declare to spend between 1 and 5% of their budget on environmental issues. Whether it was the foreigncompanies that induced these changes or whether it was something that would have occurred anyways will have to beleft to each one´s speculation. However, there still are some differences. For example, up to now the only ISO 14001certified mining companies in the two countries under analysis are foreign owned companies. Also, most foreigncompanies have an environmental risk prevention plan, as well as a mine closure plan31 - both of which domesticcompanies lack.
Some authors32 have also referred to management and budgetary structures in state companies which often do notpermit the required flexibility and dynamism to confront environmental challenges. It is clear that there have been considerable investments in technology, some of which have been driven primarily bycost reasons and increases in productivity, whilst others have had primarily environmental objectives.
In the Peruvian case investments in new technology have formed, by and large, part of the acquisition “packages”elaborated between the government and the foreign companies for the privatisation of the state-owned companies. AsPasco-Font explains: “The environmental problems of the state companies were responsible for the delay in theprivatisation process. The investors participating in the bidding wanted to assure some formal agreement with thestate to assume the historical environmental burden.” In this sense privatisation presented an opportunity to come toan agreement for the introduction of environmental improvement on the basis of a shared financial burden. The question of potential positive technologies spill-overs through FDI has been analysed by different authors andwould lead to the conclusion that these have been rather limited. For example, Kuramoto (2000) has described indetail the process of introduction of new technology in the case of the foreign owned Minera Yanacocha in Peru. Theauthor emphasizes that the operation uses the most advanced technologies, preventing contamination, stating that“The technologies applied in all the processes in Yanacocha are clean”. (p.39) However, on the other hand the authoralso points out that “The Yanacocha mine maintains very few production and commercial relations with the local
31 These closure plans are still rather basic.32 see for example Borregaard et al (1998)
16
agents.” (p.3), making it difficult that there is a transfer of technology that goes beyond the foreign owned mine´soperation. III.5. Regulatory Effects In both countries a parallel process of privatization, increase in foreign direct investment and improvement inenvironmental legislation can be observed. Without a more detailed analysis it is difficult to establish which comesfirst, the FDI or the improvement in legislation. However, there seems to be a direct interaction between the two. Inthe Chilean case Borregaard et al. (1998) have described in greater detail how investments by foreign miningcompanies have led to an upgrading of legislation, including pressure on the elaboration of an environmental impactassessment (EIA) system, as well as the enforcement of environmental standards and the enactment ofDecontamination Plans. Several authors33 have described how the foreign owned companies all elaboratedenvironmental impact assessment already at time when this system was not obligatory, and how they presumed tobecome the first pilot experiences with this system. Until 1995, the number of mining related EIA was close to 50,about one half of all EIA carried out in the country. As Lagos (1997) states, these mining EIA have used stricterstandards than those applied elsewhere in Chile and in many cases refer to aspects not even regulated by Chileanlegislation. An example of this are the standards required for tailing dams, which go far beyond the obsolete Chileanregulation of 1970.
Foreign mining companies not only applied international environmental assessment procedures, standards andmanagement practices, but also lobbied the Chilean authorities to get clear regulations defined. Pagani et al. (1992)state that the experience accumulated with the voluntary submission of environmental impact studies has beensignificant in the definition of the EIA system within the Framework Environmental Law.
Lagos (1997) argues that “internationalisation has brought external requirements, in the sense of raisingenvironmental standards, and completing and making more coherent the legislation on the subject”. According toLagos, “the contribution of foreign companies toward introducing the most modern environmental technology, interms of equipment, processes and management in Chile, has been instrumental for the domestic companies of thesector, as it has enabled the transfer of those technologies within the country, to the benefit of the national miningsector.”
O’Brien (1994) assigns Exxon —who acquired the Compañía Minera Disputada de Las Condes, CMD, in December1977— an important role. He states that Exxon had a clear idea of the need to comply with home standards evenwhere Chilean legislation left a void.
Jaime Solari, who had been the first environmental co-ordinator at the Mining Ministry, hired in 1990, clearlyemphasises the external influence on environmental management in the mining sector. He points out that his work andthe motivation for hiring him was based primarily on the concern for creating a clear regulatory framework forforeign investors, and to tackle the preoccupation as to what is needed in order to raise the environmentalperformance of the state companies to the same level as foreign competitors34. For the Peruvian case different authors35 have described the development of the new legislative framework for themining sector, including PAMA and EIAs. However, all authors emphasize the weakness of the Peruvian system ofenforcement and in that sense the limited impact of environmental regulation. At the same time Pasco-font (2000)states that: “Given that the principal actors in the copper industry are transnational companies, the institutional shortcomingshave not had significant effects. The foreign investors act with an environmental ethic that corresponds to worldstandards and in various cases they have applied environmental standards that go beyond Peruvian legislation.” In order to show the commitment of the international investors, Pasco-font (2000) cites the recent experience of EIAs
33 See for example Borregaard et al. (1998)34 Personal communication, May 1998. cited in Borregaard et al. (1998). 35 See for example Falla (2000) or Pasco-Font (2000)
17
with the mining company Antamina, which has to respect, beyond the domestic regulation, guidelines of the WorldBank, as well as the environmental and social policies of the foreign-owned mother company. Pasco-font emphasizesthe high standard of the EIA, but at the same time points out the fact that “…for now it is premature to evaluate theimpact these projects will have.” (p.27, Pasco-Font (2000)) In the Peruvian case it is not clear and has not been analysed in detail, in how far the foreign investment hasinfluenced the creation and improvement of environmental legislation. However, it can be expected that the highstandards by the foreign investors tend to put an upward pressure on environmental legislation in the country. III.6. Summary of environmental effects 1. In general, a large part of foreign investors in the mining sector attempt to apply latest technology and
environmental management.
2. Regarding environmental effects such as air contamination, effluents and water use the fore-mentioned point ismore valid than for sustainability issues such as local community development.
3. Scale effects are important regarding the scale of individual operations as well as the scale of overall production.Increasing scale puts increasing pressure on natural resources and imposes new regulatory challenges. The size ofinvestment implies the need for greater enforcement capacity (and certification schemes based on self-control orindependent control of a third party can compensate only to some extent this lack of enforcement capacity) Ingeneral, the countries under analysis are not prepared to confront the issue of exhaustability of the resource. Thereis a lack of policies aimed at assuring local and regional sustainability post extraction. This is a serious problem inthe context of FDI, and it cannot be left to individual companies to confront it. Beyond the question ofexhaustability of the mineral that is extracted, resources used as inputs are also affected. The use of scarce water iscausing problems with regard to biodiversity, and water use for human settlements.
4. If governments were to promote sustainability in the mining sector and promote the positive effects of foreigninvestment, potential technological spill overs will have to be enhanced.
5. Positive effects from FDI in the mining sector lie especially in the upward pressure on domestic regulation, asillustrated in the Chilean case regarding the Environmental Impact Assessment system as well as decontaminationplans.
6. Regarding the use of “soft” technology, environmental management in foreign companies is more formalized and
more oriented at certain visible benchmarks in foreign companies. Certification schemes play an important role inthis regard. The interface between the certification schemes and the local communities could be taken advantageof: on the one hand a greater involvement of local communities in the elaboration of criteria for certification has tobe guaranteed, and on the other hand special indications regarding company-community relations should receivespecial attention in the certification schemes. Certification is, on the other hand, not easily accessible to smallerowners, which can create exclusiveness and differentiation on the international market.
7. The existence or lack of a regulatory framework is important in several ways: on the one hand to attract foreigninvestment, on the other to close the gap between foreign and domestic investors in terms of environmentalmanagement, and finally to prevent environmental impacts. In general, there has been a mutual relationshipbetween the development of further environmental legislation and the arrival of foreign investment.
8. Specific opportunities refer to the possibility to confront the historical environmental burden when ownership ispassed from the state to private companies, as in the Peruvian case.
IV DOMESTIC AND INTERNATIONAL PRESSURES FOR IMPROVED PERFORMANCE
18
The factors that influence environmental behaviour of companies are key to analyse the interrelation between FDIand the environment and to develop policy recommendations. The knowledge about motivating factors behindenvironmental improvement is essential for the design and implementation of policies, programs or specificinstruments. Amongst the factors are international as well as national factors. The first can be international NGOs,consumers´ requirements, international financial markets, international industry associations, pressure by competitors,or environmental guidelines by the headquarters or parent company located abroad. National factors includeenvironmental regulations regarding foreign investment or, more often, production in general, environmental or otherNGOs, local image, pressure through the media, national industry associations, or local pressures by affected groups. Regarding our two country cases, looking at the past and current situation of the pressures for improvedenvironmental performance, these derive primarily from the international level, even though at the national there hasalso been some pressure. This is reflected in the literature, and can be confirmed in our survey results as well as ininterviews with the companies.
IV.1. Domestic Pressures
The relevance of a strong domestic regulatory framework is mentioned throughout the literature as one of the keyvariables to influence environmental effects from foreign investment, and is, by environmental NGOs, even regardedas a pre-condition for FDI. Our survey results confirm this relevance of domestic regulation, being considered bydomestic as well as the foreign investors as one of the key pressures on their environmental performance.
Theoretically environmental regulation applies to both, domestic and foreign investments, in the same way. However,in practice there can be differences.
In the Chilean case it calls the attention that Chagres, being the smelter with lowest emission levels, was the firstsmelter to be subjected to a decontamination plan under Chilean regulation in 1992. This was a sort of “voluntary”decontamination plan before the obligatory regulations concerning decontamination plans came into force some yearslater. Even though this treatment was not criticized by the Exxon-owned operation, it can be speculated that there waspressure on the foreign owned operation to be the first to be submitted to the regulation when it was still at apreliminary stage.
Environmental consciousness has only begun to develop and take on relevance in Latin-America since the end of the1980s or even the 90s. Increased environmental requirements imposed on investors by the local communities, aboveall in highly sensitive sectors such as mining and forestry, are a phenomenon that only recently has become morewide-spread. Whereas in Chile there are no NGOs or independent academic centres specialized in mining and itsenvironmental or social effects, in Peru there are several NGOs that have made the mining sector the focus of theirwork36.
In the case of the Peruvian mining sector, authors such as Baker (1997) have stated that, in the face of the privateinvestments in mining operations “…environmentalists within Peru and outside have called for companies to take acertain amount of responsibility in these cases (environmental issues).”
The importance of the “environmental deals” negotiated in the framework of the privatisation processes between thePeruvian government and the foreign investors should also not be sub-estimated. As seen in the previously shownnumbers the effects can be considerable.
IV.2. International pressures
International pressure derives from NGOs, international organisations, from clients and consumers, and from the
For example GRADE, http://www.grade.org.pe, o Sociedad Peruana de Derecho Ambiental,http://www.spda.org.pe
.
19
financial market (both, in form of the share holders, as well as in form of the capital market).
According to our survey results foreign mining companies in general attribute highest relevance to the guidelinesprovided by headquarters or the mother company. Several studies37 as well as our survey results point to theimportance of the environmental guidelines by mother companies. Borregaard et al.(1998) stated:
“The foreign mining companies, including smelters and copper exploitation, have adopted environmental policies andmanagement practices that go far beyond national regulations. This behaviour is explained by the fact that most ofthese companies have their headquarters in Canada, USA, England, Finland, Australia and South Africa, and have acommitment to applying their home standards in all their foreign investments.”
These guidelines are a reflection of the shareholders´ interest, the consumers´ and clients´ requirements, pressure byNGOs, as well as requirements by the credit agencies.
Pasco-Font (2000) states: “The multinational companies confront pressures of the large international NGOs in casethere are any environmental problems. ASARCO, one of the principal (foreign) owners of Southern Peru Copper, hasconfronted actions by international NGOs due to the environmental problems in Ilo”.
Whereas there has been growing interest and an evolving body of literature referring to social and environmentalresponsibility schemes in international financial markets, there is still very little understanding and knowledge abouthow these pressures work “on the ground”. In the case of mining FDI in Chile and Peru the literature does notprovide any evidence on these factors. However, it can be considered a potentially important element in the nearfuture .
Whereas major foreign investors generally operate with some participation of capital from International FinancialInstitutions (IFI) such as the International Finance Corporation (IFC) or major private commercial banks, mostdomestic operations are either self-financed or are financed through public funds or smaller domestic banks.
Social and environmental responsibility schemes that have been elaborated recently on the international financialmarket include the Dow Jones Sustainability Index, the Global Reporting Initiative, and the Social and EnvironmentalInvestment Funds.38 IFIs have their own environmental standards that go, in general, beyond the standards prevailingin Latin American countries. Major private commercial banks also require, as a general matter, strict performancecovenants, and compliance with World Bank or other internationally acceptable standards.39 However, as MartinWhittaker of Innovest put it recently: “The mainstream financial sector still has to be persuaded of the benefits ofaddressing sustainability.”40
The preoccupation of IFIs with the question of sustainability in the mining sector context is demonstrated in recentconferences and initiatives such as the “Finance Mining and Sustainability Conference” organized by the World Bankand the IFC in April 2001, UNEP´s Financial Institutions Initiative or the Agreement on Environmental Guidelinesfor Export Agencies which the OECD is elaborating for the end of 2001. One objective of these initiatives is topromote the use of positive and negative screens and best of sector approaches regarding sustainability performance.The initiatives are motivated by the consciousness of the significant impact of mining, especially regarding localeffects, and the greater risk this implies to investors.41 Shawn Mays, General Manager at WestPac Financial Services,points out that surveys of pension fund members show that human rights and environment are their two majorconcerns, thus he concludes: “Mining companies that do not address sustainability run the risk of increased cost ofcapital and loss of their license to operate.”42
37 See for example Lagos (1997) or Borregaard et al. (1997)38 The latter in general do not destine funds to mining investment, questioned by most investors regardingsustainability. For a discussion of Socially Responsible Investment see for example Robins (2001)39 See for example Urda (1997)40 intervention at World Bank/IFC Conference on “Finance Mining and Sustainability”, April 8th/9th 2001,Washington.41 James Bond, World Bank, at Conference 8th/9th of April 2001, Washington.42 intervention at World Bank/IFC Conference on “Finance Mining and Sustainability”, April 8th/9th 2001,Washington.
20
How important the social and environmental requirements are that are imposed on mining operations by theshareholders was demonstrated in the Chilean case with the operation Los Pelambres which depended on financingfrom the Catholic church, a financing that was held back until the country started its democratisation process in 1990.
In the case of the foreign mining operations in Chile, these depend primarily on self-financing. However, they dohave in general small participations of foreign commercial banks or IFIs.43 In the case of La Escondida the IFCparticipates with a 2,5% in the overall operation, a financing that was crucial to the initiation of the operation.44
Under the agreement with the IFC La Escondida has to carry out an annual environmental audit, an audit which isoriented at environmental regulation applied in the country and, where this does not exist, IFC environmentalstandards.
V. CONCLUSIONS
Overall the dividing lines between foreign and domestic investments have become increasingly blurred and so have theenvironmental impacts related to the different types of investment. Whereas one or two decades ago the difference inenvironmental management between foreign and domestic companies was, at times, significant45, today environmentalmanagement has become more alike. There are positive and negative cases amongst foreign as well as domesticcompanies. In very general terms, FDI, in the countries under scrutiny, has fared reasonably well with regard to morenarrowly defined environmental considerations.
The biggest challenge, however, lies in local sustainability effects. This is as of yet an unresolved topic that requiresurgent attention. FDI, due to its volatility and its, very often, large scale will have to assume a special responsibilitywith regard to assuring local sustainability that can last beyond the time of its operation. Foreign mining companieshave to develop clear strategies regarding the interaction with the local community, the identification of the localcommunity´s priorities, and the creation of long term partnerships with the local community. At the same time thisissue clearly raises requirements for public policy action. In the two countries under analysis there is a lack of publicpolicies to assure local sustainability around mining operations, even a lack of a clear natural resource policy andstrategy. The combination of the slow progress on this issue by even the more progressive investors, and the lack ofpublic policy in this area has led to an increasing wedge between globalisation and local concerns.
The second challenge refers to the need for the generation of information on environmental issues. In this paper wetried to recollect existing data and information, a task that had to be complemented by the survey and interviews,basically due to the lack of information. On some environmental issues there is no monitoring (such as soilcontamination), and on others there is hardly any information at all (such as acid mine drainage). EnvironmentalImpact Assessment of new investment projects can be used, in this context, as a longer term policy tool, ifrequirements for monitoring and the generation and accessibility of information become part of the agreementselaborated in the context of the Assessment. Only on the basis of easily accessible and verifiable information caninternational certification schemes or environmentally oriented stock market listings be relevant tools for monitoringthe environmental performance of FDI.
It is clear that both issues, local sustainability, and the lack of information, will require innovative strategies andadditional research to confront them. In different countries and different regions first approaches have been tested46.An exchange of experiences on these issues is urgently needed. Cooperation between companies, between companiesand the public sector, between companies and NGOs, and between the public sector and NGOs will be necessary inorder to make progress. Initiatives such as the Mining and Minerals for Sustainable Development47 program, the Non-ferrous Metals Consultative Forum for Sustainable Development, organized by the International Copper Study Group,
43 personal communication with Rick Killam, Placer Dome, and Andrés Camaño, La Escondida.44 David Humphreys, Río Tinto, in a paper prepared for an informal seminar on the mining and metals industry at theOECD in February 200045 See for example Borregaard et al. (1998) for the case of the Chilean mining sector.46 See for example the Thailand Business in Rural Development initiative, mentioned in Grieg-Gran (2001), or the taxcredit initiative in New Guinea, mentioned in Borregaard et al. (2000).47 See www.mmsd.org
21
the International Nickel Study Group and the International Lead and Zinc Study Group, or the UNEP´s MineralResources Forum, certainly help to create a dialogue between the different stakeholders and to start bridging theglobalisation-local sustainability gap, and should be strengthened.
To finish, this paper is only a first preliminary look at the evidence. More than answers, there are many open questions– the central one being:
• Where (and involving which stakeholders) does the burden to control mining sector investments´ social andenvironmental effects lie? Are there sufficient tools (including obligatory and voluntary) and resources available atthe international, national, but especially at the local level to provide guidance for improving the social andenvironmental performance?
Last but not least, many investment projects that are referred to in this paper are just being initiated, and it will dependto a great extent on the compliance with the commitments, voluntary and obligatory, short term and especially longterm, that have been announced and those that can still be obtained from the foreign investors, whether or not in thesetwo countries there is an overall positive or negative balance from FDI in the mining sector.
22
BIBLIOGRAPHY
Baker K. (1997), “Trade and Environment: Peru Mining” Vol. 7 Number 1, January 1997.
Banco Central de Chile: Serie Estadística de Crecimiento del PIB total y por sectores.
Banco Central de Reserva del Perú: Serie Estadística de Crecimiento del PIB total y por sectores.
Banco Central do Brasil: Serie Estadística de Crecimiento del PIB total y por sectores.
Blanco H. and Wautiez F. (1997), “Impactos Ambientales de la Liberalización Económica en el Sector MineroChileno”, Working paper document prepared by CIPMA for UNEP; CIPMA.
Borregaard et al (2000), “Confronting Sustainability in the Mining Sector: What Role for a Sustainability Fund?”,Working paper document prepared by CIPMA for UNEP, CIPMA
Borregaard N., Blanco H. y Wautiez F. (1998), “Exported-Led Growth and the Environment in Chile: an Analysis ofthe Induced Environmental Policy Response in the Mining Sector”, CIPMA.
Borregaard N. and Bradley T. (1999) “Análisis de Tres Sectores Exportadores Chilenos”, Ambiente y Desarrollo VolXV N°4, CIPMA.
CEPAL (1998), “La Inversión Extranjera en América Latina y el Caribe”.
CEPAL (1999), “La Inversión Extranjera en América Latina y el Caribe”.
Comisión Chilena del Cobre (COCHILCO) (2000), “Estadísticas del Cobre y Otros Minerales 1990-1999”, Santiago,Chile.
Comisión Nacional de Inversiones y Tecnologías Extranjeras (CONITE): Estadísticas sobre Inversión ExtranjeraDirecta en Perú.
Comité de Inversiones Extranjeras: Estadísticas sobre Inversión Extranjera en Chile.
DIRECMIN (2000), “Directorio Minero 1999”, Santiago, Chile.
Falla,J. (2000), “Environmental Policy in the Making: The Case of the Peruvian Mining Industry” CIPMA.Hyperforum: www.cipma.cl/hyperforum
Gentry B. (1999), “Foreign Direct Investment and the Environment: Boon or Bane”, Foreign Direct Investment andthe Environment, OECD.
General Water Authority (1996), DGA - Proyecciones de demanda por agua. Dirección General de Agua. Santiago.
Goldenman G. (1999), “The Environmental Implications of Foreign Direct Investment: Policy and InstitutionalIssues”, Foreign Direct Investment and the Environment, OECD.
Grieg-Gran,M. (2001) “Investment for Sustainable Development: The Public Private Interface”. In “The Future IsNow”, Volume 2, IIED.
Johnston D. (1999), “Foreign Direct Investment and the Environment: Challenges and Opportunities”, Foreign DirectInvestment and the Environment, OECD.
Kesler, S. E., (2000). Mineral Resources, Economics and the Environment. University of Michigan. html
Kuramoto J. (1999), “Las Aglomeraciones Productivas Alrededor de la Minería: El Caso de Minera Yanacocha SA”,Documento de Trabajo N° 27 GRADE.
23
Lagos, G. (1997), Developing national mining policies in Chile: 1974-96. Resources Policy, Vol.23, N.1/2, pp.51-69.
Lagos,G. and Andia,M. (2000) Situación de la Minería. in: Informe País. Universidad de Chile. Santiago 2000
McMahon,G., Evia,J.L., Pasco-Font,A., Sánchez,J.M. (1998), An environmental study of artisanal, small and médiummining in Bolivia, Chile and Peru. Mining Policy Research Initiative (MPRI), Uruguay.
Mining and Minerals Sustainable Development (2001 - forthcoming) Regional Report – Latin America. IIED –CIPMA – MPRI. London, Santiago, Montevideo
Ministerio de Energía y Minas (1997), “Anuario Minero del Perú, 1997”, Perú.
O’Brien, J. (1994). Undoing a Myth: Chile’s debt to Copper and Mining. A Publication by the International Councilon Metals and the Environment, Ottawa, Canada.
OECD (1998), “Foreign Direct Investment and Economic Development: Lessons From Six Emerging Economies”.Paris
OECD (2000) “OECD Benchmark Definition of Foreign Direct Investment”. 3rd edition. Paris
Ojeda,J.M. (2000) “Aprendizajes sobre la marcha en el entendimiento entre empresa y comunidad”, Ambiente yDesarrollo Vol. XVI, No.1,2, pp.36-41. CIPMA
Robins,N. (2001) “Reforming Foreign Capital Flows: The Role of Socially Responsible Investment”. Paper preparedfor “Equity for a Small Planet”, conference organised by IIED on the 12-13th of November, London, IIED.
Sánchez F., Ortiz G. y Moussa N. (1998) “Panorama Minero de América Latina: La Inversión en la Década de losNoventa”, CEPAL.
Urda Kassis,C. (1997) Financing Mineral Projects in Latin America. Paper at Conference “Mineral Development inLatin America”, organized by the Institute on Mineral Development in Latin America and the Rocky MountainMineral Law Foundation, Santiago 3rd and 4rth of November 1997
Zarsky L. (1999), “Havens, Halos and Spaghetti: Untangling the Evidence about Foreign Direct Investment and theEnvironment”, Foreign Direct Investment and the Environment, OECD.
24
ANNEX 1Questionnaire
SECCION I: INFORMACION GENERAL
Nombre del entrevistado: EMPRESAS EXTRANJERAS
Cargo:
Fono - Fax - E-mail:
Fecha
A. INFORMACION GENERAL
1. Nombre de la Compañía
2. Orígen del Capital de la Compañía
Nacional Extranjero Mixto Si es mixto, indicar % nacional: _______ y % extranjero: _______
3. Período de tiempo con operaciones en Chile
4. Producción total aproximada (ton/año)
SECCION 2: GESTION AMBIENTAL
B RESPUESTA A PROBLEMAS AMBIENTALES
B.1 Determinantes
5
5.15.25.35.45.55.65.75.85.95.105.115.125.135.145.155.165.17
Esta pregunta apunta a entender los factores que influencian las actividades ambientales de su compañía. Por favor indiquecuán importante son cada uno de los siguientes factores en determinar las actividades ambientales de su compañía. Mucha Ninguna
Influencia Influencia6 5 4 3 2 1
Empleados � � � � � �Legislación existente � � � � � �La amenaza de legislación futura � � � � � �Competidores � � � � � �Grupos ambientales locales y organizaciones no gubernamentales � � � � � �Grupos ambientales internacionales y organizaciones no gubernamentales � � � � � �El perfil local de la compañía� � � � � � �El perfil internacional de la compañía� � � � � � �Accionistas de la compañía � � � � � � �Presión pública� � � � � � �Pautas internas, generadas localmente � � � � � �Si es compañía internacional, pautas desde las oficinas centrales en otro país � � � � � �Asociaciones Locales de Compañías Mineras/Estándares industriales � � � � � �Asociaciones Internacionales de C. Mineras/Pautas para la industria � � � � �� �Presión local de las comunidades en áreas específicas � � � � �� �Otros: � � � � � �� �Otros: �������������������� � � � � ��
��������������������
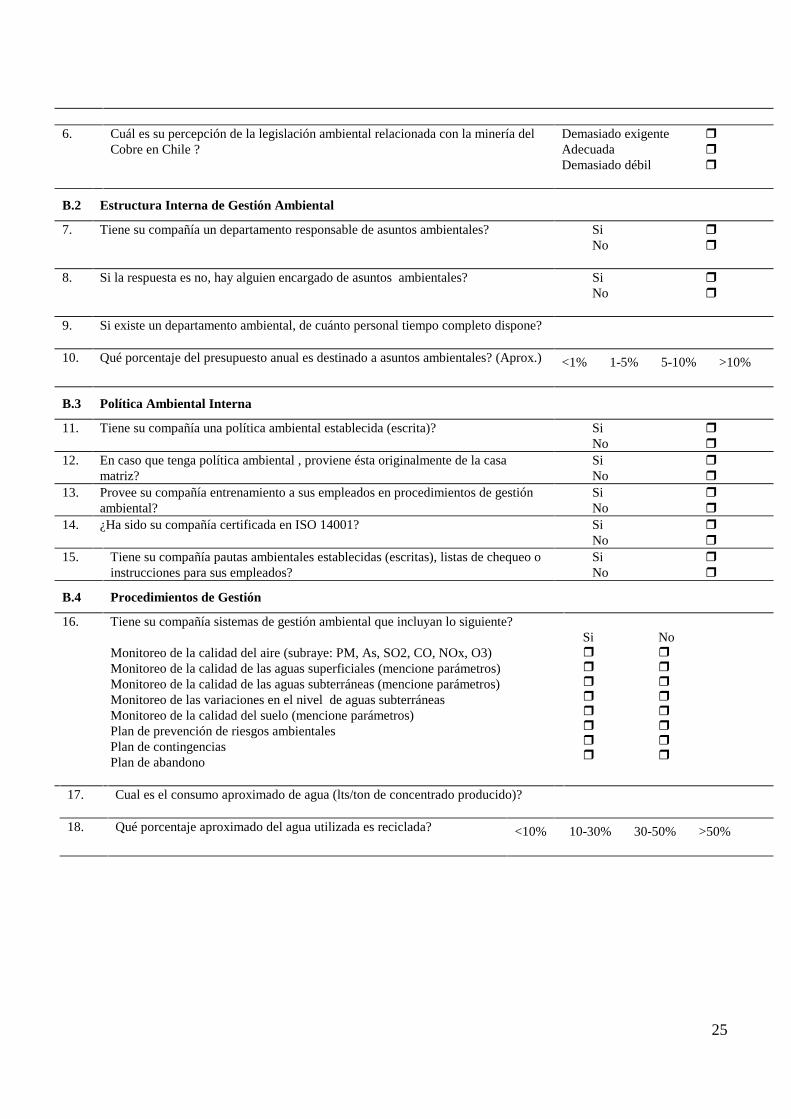
25
6. Cuál es su percepción de la legislación ambiental relacionada con la minería delCobre en Chile ?
Demasiado exigente �Adecuada �Demasiado débil �
B.2 Estructura Interna de Gestión Ambiental
7. Tiene su compañía un departamento responsable de asuntos ambientales? Si �No �
8. Si la respuesta es no, hay alguien encargado de asuntos ambientales? Si �No �
9. Si existe un departamento ambiental, de cuánto personal tiempo completo dispone?
10. Qué porcentaje del presupuesto anual es destinado a asuntos ambientales? (Aprox.) <1% 1-5% 5-10% >10%
B.3 Política Ambiental Interna
11. Tiene su compañía una política ambiental establecida (escrita)? Si �No �
12. En caso que tenga política ambiental , proviene ésta originalmente de la casamatriz?
Si �No �
13. Provee su compañía entrenamiento a sus empleados en procedimientos de gestiónambiental?
Si �No �
14. ¿Ha sido su compañía certificada en ISO 14001? Si �No �
15. Tiene su compañía pautas ambientales establecidas (escritas), listas de chequeo oinstrucciones para sus empleados?
Si �No �
B.4 Procedimientos de Gestión
16. Tiene su compañía sistemas de gestión ambiental que incluyan lo siguiente?
Monitoreo de la calidad del aire (subraye: PM, As, SO2, CO, NOx, O3)Monitoreo de la calidad de las aguas superficiales (mencione parámetros)Monitoreo de la calidad de las aguas subterráneas (mencione parámetros)Monitoreo de las variaciones en el nivel de aguas subterráneasMonitoreo de la calidad del suelo (mencione parámetros)Plan de prevención de riesgos ambientalesPlan de contingenciasPlan de abandono
Si No� �� �� �� �� �� �� �� �
17. Cual es el consumo aproximado de agua (lts/ton de concentrado producido)?
18. Qué porcentaje aproximado del agua utilizada es reciclada? <10% 10-30% 30-50% >50%
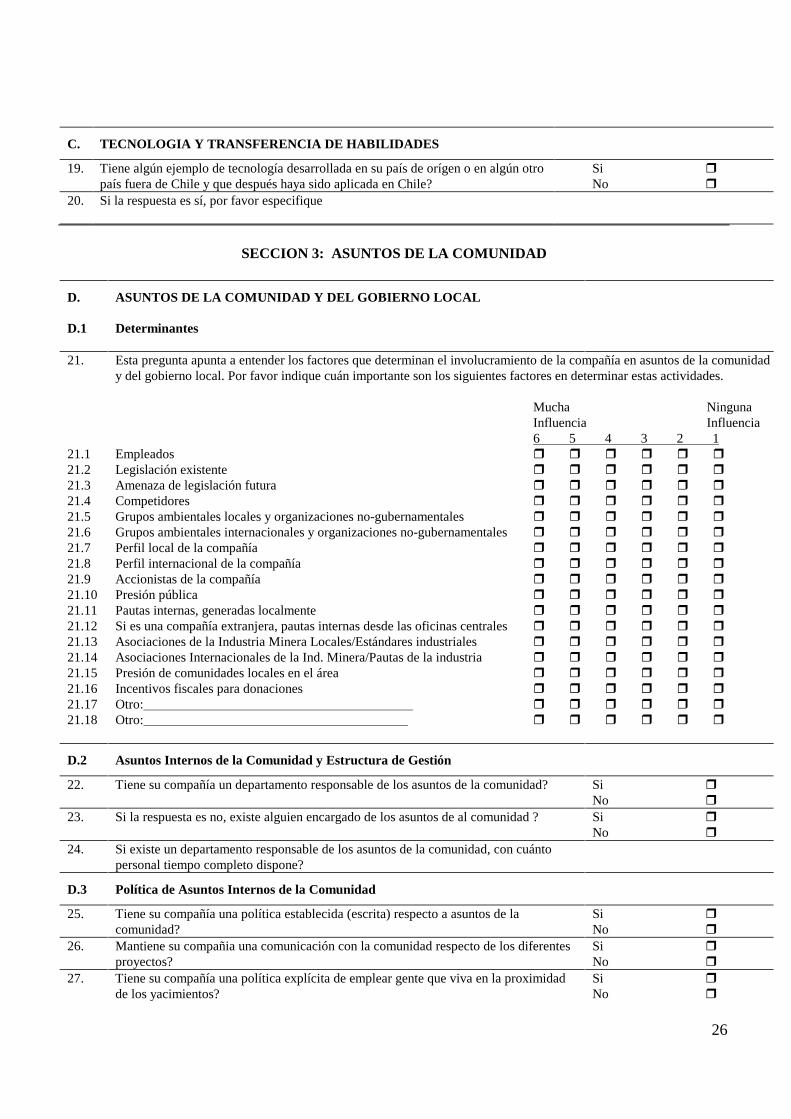
26
C. TECNOLOGIA Y TRANSFERENCIA DE HABILIDADES
19. Tiene algún ejemplo de tecnología desarrollada en su país de orígen o en algún otropaís fuera de Chile y que después haya sido aplicada en Chile?
Si �No �
20. Si la respuesta es sí, por favor especifique
SECCION 3: ASUNTOS DE LA COMUNIDAD
D.
D.1
ASUNTOS DE LA COMUNIDAD Y DEL GOBIERNO LOCAL
Determinantes
21.
21.121.221.321.421.521.621.721.821.921.1021.1121.1221.1321.1421.1521.1621.1721.18
Esta pregunta apunta a entender los factores que determinan el involucramiento de la compañía en asuntos de la comunidady del gobierno local. Por favor indique cuán importante son los siguientes factores en determinar estas actividades.
Mucha NingunaInfluencia Influencia
6 5 4 3 2 1Empleados � � � � � �Legislación existente � � � � � �Amenaza de legislación futura � � � � � �Competidores � � � � � �Grupos ambientales locales y organizaciones no-gubernamentales � � � � � �Grupos ambientales internacionales y organizaciones no-gubernamentales � � � � � �Perfil local de la compañía� � � � � � �Perfil internacional de la compañía� � � � � � �Accionistas de la compañía � � � � � � �Presión pública� � � � � � �Pautas internas, generadas localmente � � � � � �Si es una compañía extranjera, pautas internas desde las oficinas centrales � � � � � �Asociaciones de la Industria Minera Locales/Estándares industriales � � � � � �Asociaciones Internacionales de la Ind. Minera/Pautas de la industria � � � � �� �Presión de comunidades locales en el área � � � � �� �Incentivos fiscales para donaciones � � � � � �� �Otro:��������������������� � � � � �� �Otro:�������������������� � � � � �� �
D.2 Asuntos Internos de la Comunidad y Estructura de Gestión
22. Tiene su compañía un departamento responsable de los asuntos de la comunidad? Si �No �
23. Si la respuesta es no, existe alguien encargado de los asuntos de al comunidad ? Si �No �
24. Si existe un departamento responsable de los asuntos de la comunidad, con cuántopersonal tiempo completo dispone?
D.3 Política de Asuntos Internos de la Comunidad
25. Tiene su compañía una política establecida (escrita) respecto a asuntos de lacomunidad?
Si �No �
26. Mantiene su compañia una comunicación con la comunidad respecto de los diferentesproyectos?
Si �No �
27. Tiene su compañía una política explícita de emplear gente que viva en la proximidadde los yacimientos?
Si �No �
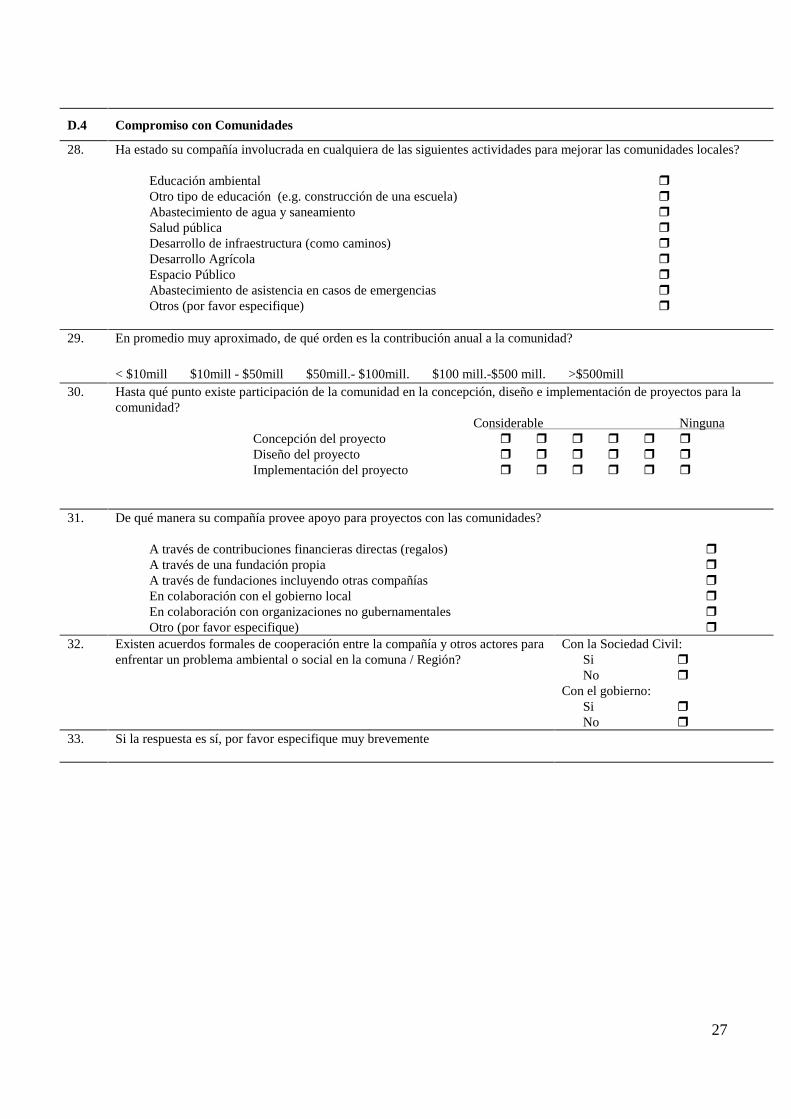
27
D.4 Compromiso con Comunidades
28. Ha estado su compañía involucrada en cualquiera de las siguientes actividades para mejorar las comunidades locales?
Educación ambiental �Otro tipo de educación (e.g. construcción de una escuela) �Abastecimiento de agua y saneamiento �Salud pública �Desarrollo de infraestructura (como caminos) �Desarrollo Agrícola �Espacio Público �Abastecimiento de asistencia en casos de emergencias �Otros (por favor especifique) �
29. En promedio muy aproximado, de qué orden es la contribución anual a la comunidad?
< $10mill $10mill - $50mill $50mill.- $100mill. $100 mill.-$500 mill. >$500mill 30. Hasta qué punto existe participación de la comunidad en la concepción, diseño e implementación de proyectos para la
comunidad?Considerable Ninguna
Concepción del proyecto� � � � � � �Diseño del proyecto� � � � � � �Implementación del proyecto � � � � � �
31. De qué manera su compañía provee apoyo para proyectos con las comunidades?
A través de contribuciones financieras directas (regalos) �A través de una fundación propia �A través de fundaciones incluyendo otras compañías �En colaboración con el gobierno local �En colaboración con organizaciones no gubernamentales �Otro (por favor especifique) �
32. Existen acuerdos formales de cooperación entre la compañía y otros actores paraenfrentar un problema ambiental o social en la comuna / Región?
Con la Sociedad Civil:Si �No �
Con el gobierno:Si �No �
33. Si la respuesta es sí, por favor especifique muy brevemente
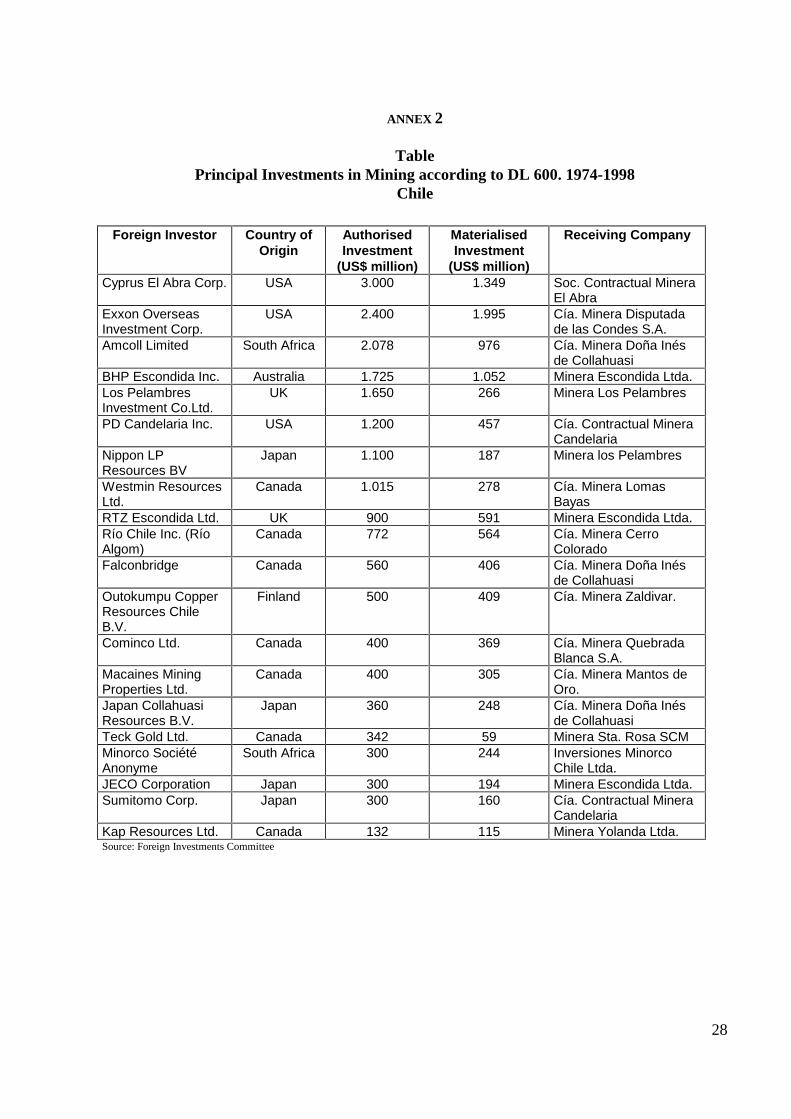
28
ANNEX 2
TablePrincipal Investments in Mining according to DL 600. 1974-1998
Chile
Foreign Investor Country ofOrigin
AuthorisedInvestment
(US$ million)
MaterialisedInvestment
(US$ million)
Receiving Company
Cyprus El Abra Corp. USA 3.000 1.349 Soc. Contractual MineraEl Abra
Exxon OverseasInvestment Corp.
USA 2.400 1.995 Cía. Minera Disputadade las Condes S.A.
Amcoll Limited South Africa 2.078 976 Cía. Minera Doña Inésde Collahuasi
BHP Escondida Inc. Australia 1.725 1.052 Minera Escondida Ltda.Los PelambresInvestment Co.Ltd.
UK 1.650 266 Minera Los Pelambres
PD Candelaria Inc. USA 1.200 457 Cía. Contractual MineraCandelaria
Nippon LPResources BV
Japan 1.100 187 Minera los Pelambres
Westmin ResourcesLtd.
Canada 1.015 278 Cía. Minera LomasBayas
RTZ Escondida Ltd. UK 900 591 Minera Escondida Ltda.Río Chile Inc. (RíoAlgom)
Canada 772 564 Cía. Minera CerroColorado
Falconbridge Canada 560 406 Cía. Minera Doña Inésde Collahuasi
Outokumpu CopperResources ChileB.V.
Finland 500 409 Cía. Minera Zaldivar.
Cominco Ltd. Canada 400 369 Cía. Minera QuebradaBlanca S.A.
Macaines MiningProperties Ltd.
Canada 400 305 Cía. Minera Mantos deOro.
Japan CollahuasiResources B.V.
Japan 360 248 Cía. Minera Doña Inésde Collahuasi
Teck Gold Ltd. Canada 342 59 Minera Sta. Rosa SCMMinorco SociétéAnonyme
South Africa 300 244 Inversiones MinorcoChile Ltda.
JECO Corporation Japan 300 194 Minera Escondida Ltda.Sumitomo Corp. Japan 300 160 Cía. Contractual Minera
CandelariaKap Resources Ltd. Canada 132 115 Minera Yolanda Ltda.Source: Foreign Investments Committee
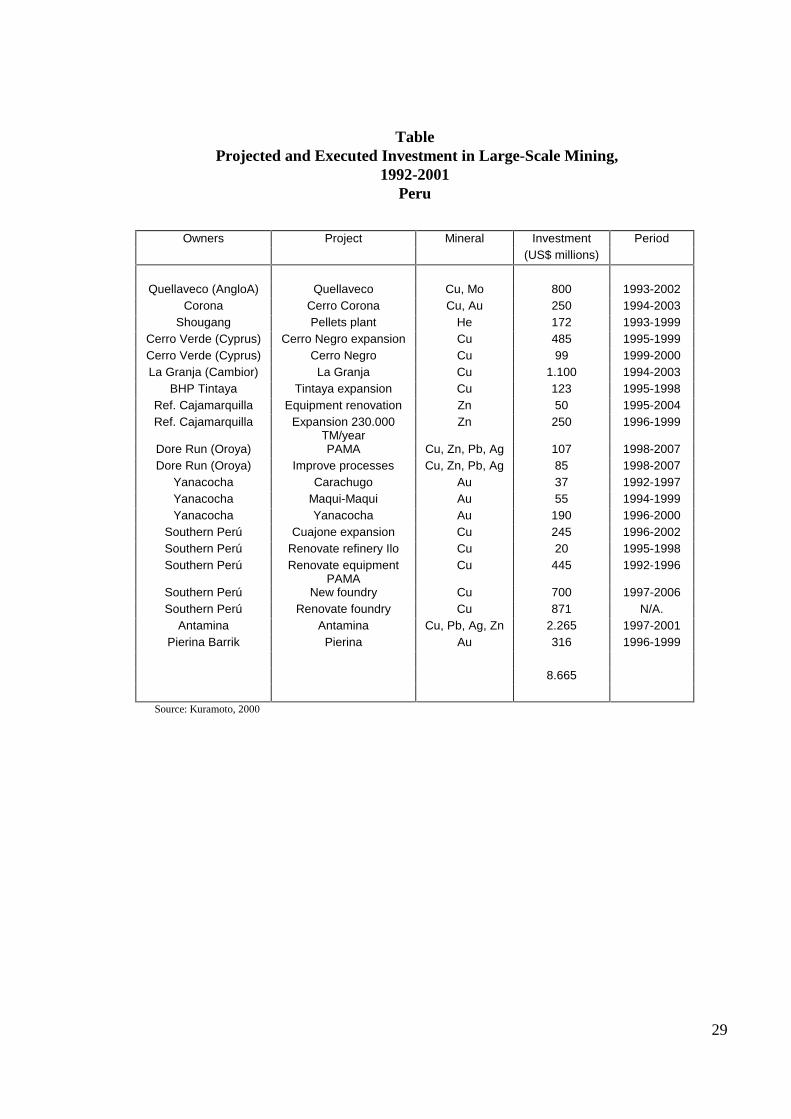
29
Table Projected and Executed Investment in Large-Scale Mining,
1992-2001Peru
Owners Project Mineral Investment Period(US$ millions)
Quellaveco (AngloA) Quellaveco Cu, Mo 800 1993-2002Corona Cerro Corona Cu, Au 250 1994-2003
Shougang Pellets plant He 172 1993-1999Cerro Verde (Cyprus) Cerro Negro expansion Cu 485 1995-1999Cerro Verde (Cyprus) Cerro Negro Cu 99 1999-2000La Granja (Cambior) La Granja Cu 1.100 1994-2003
BHP Tintaya Tintaya expansion Cu 123 1995-1998Ref. Cajamarquilla Equipment renovation Zn 50 1995-2004Ref. Cajamarquilla Expansion 230.000
TM/yearZn 250 1996-1999
Dore Run (Oroya) PAMA Cu, Zn, Pb, Ag 107 1998-2007Dore Run (Oroya) Improve processes Cu, Zn, Pb, Ag 85 1998-2007
Yanacocha Carachugo Au 37 1992-1997Yanacocha Maqui-Maqui Au 55 1994-1999Yanacocha Yanacocha Au 190 1996-2000
Southern Perú Cuajone expansion Cu 245 1996-2002Southern Perú Renovate refinery Ilo Cu 20 1995-1998Southern Perú Renovate equipment
PAMACu 445 1992-1996
Southern Perú New foundry Cu 700 1997-2006Southern Perú Renovate foundry Cu 871 N/A.
Antamina Antamina Cu, Pb, Ag, Zn 2.265 1997-2001Pierina Barrik Pierina Au 316 1996-1999
8.665
Source: Kuramoto, 2000