environmental data 2019 - 関西電力...<environmental data 2019> 3 status overview of our...
TRANSCRIPT

Environmental data2019

1<Environmental Data 2019>
(1)Specific data of environmental impact including electricity consumption in an office is grasped and reported in this report
⇒ 97.6%
<Explanation>It represents the ration of companies that are performing Eco-
Action among 79 consolidated subsidiaries (ratio of sales).
・<Calculation Method>
*Eco-ActionIt is the environmental action plan including the reducing office electricity consumption and office water consumption
■Reporting coverage of Kansai Electric Power and its 79 consolidated subsidiaries (as of the end of March 2019)
(Sales of Kansai Electric Power in FY 2018)+
(Sales of 41 consolidated subsidiaries in FY 2018 that are performing Eco-Action as of the end of March 2019)
(Sales of Kansai Electric Power in FY 2018 )+
(sales of 79 consolidated subsidiaries in FY 2018)
Reporting Coverage

2
<Data>

<Environmental Data 2019> 3
Status overview of our business activities and environmental load
Note1:This table contains non-consolidated figures for Kansai Electric Power Co., Inc only.Note2:Totals may not sum due to rounding.Note3:Thermal power generation figures do not include biomass power generation.
*1 Includes amounts of power for inside power plants*2 Includes CO2 originating from electricity purchased from other electric power companies*3 Emissions taking carbon credits into account*4 CO2 conversion*5 Net generation (generated amount – reduced amount)
<Environmental Data 2019> 4
Environmental accounting (KEPCO ①)
Note: Based on the Environmental Reporting Guidelines (FY2005 version) issued by the Ministry of the Environment. Depreciation is not calculated into expenses. Composite costs are tallied proportionally by one of three methods: (1)calculation of differences; (2) proportional division based on rational criteria; (3) proportional division based on criteria of expediency. Costs involved in generating nuclear power are calculated with the sum of individual measures to protect the environment taken as environmental conservation costs (radiation control and measurement, low-level radioactive waste processing, etc.). Figures may not add up due to rounding off.
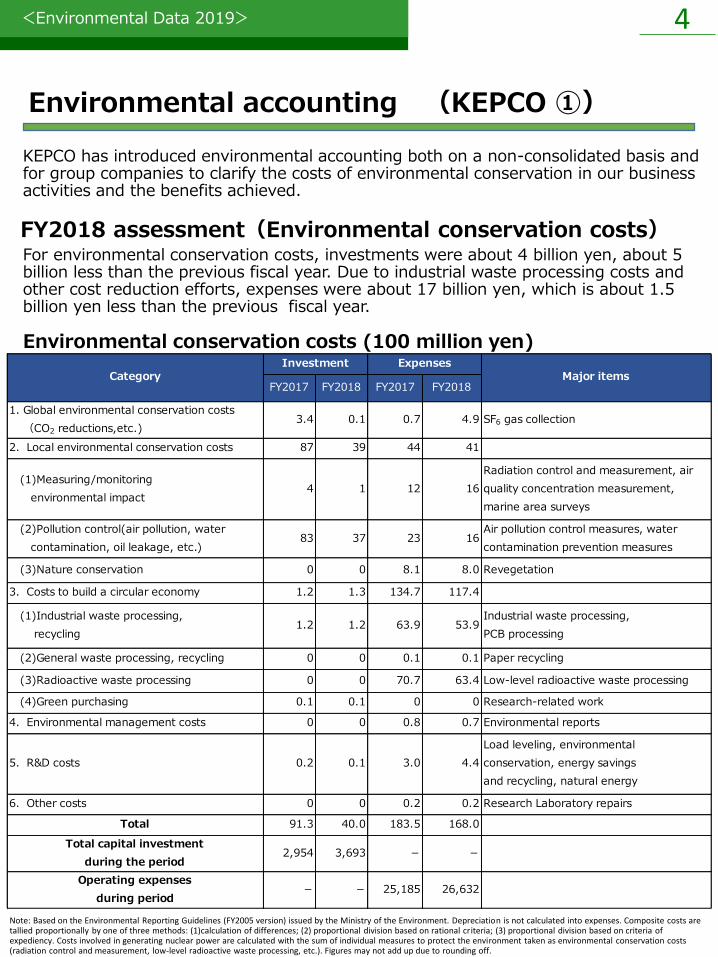
KEPCO has introduced environmental accounting both on a non-consolidated basis and for group companies to clarify the costs of environmental conservation in our business activities and the benefits achieved.
FY2018 assessment(Environmental conservation costs)
Environmental conservation costs (100 million yen)
1. Global environmental conservation costs
(CO2 reductions,etc.)3.4 0.1 0.7 4.9 SF6 gas collection
2.Local environmental conservation costs 87 39 44 41
(1)Measuring/monitoring
environmental impact4 1 12 16
Radiation control and measurement, air
quality concentration measurement,
marine area surveys
(2)Pollution control(air pollution, water
contamination, oil leakage, etc.)83 37 23 16
Air pollution control measures, water
contamination prevention measures
(3)Nature conservation 0 0 8.1 8.0 Revegetation
3.Costs to build a circular economy 1.2 1.3 134.7 117.4
(1)Industrial waste processing,
recycling1.2 1.2 63.9 53.9
Industrial waste processing,
PCB processing
(2)General waste processing, recycling 0 0 0.1 0.1 Paper recycling
(3)Radioactive waste processing 0 0 70.7 63.4 Low-level radioactive waste processing
(4)Green purchasing 0.1 0.1 0 0 Research-related work
4.Environmental management costs 0 0 0.8 0.7 Environmental reports
5.R&D costs 0.2 0.1 3.0 4.4
Load leveling, environmental
conservation, energy savings
and recycling, natural energy
6.Other costs 0 0 0.2 0.2 Research Laboratory repairs
Total 91.3 40.0 183.5 168.0
Total capital investment
during the period2,954 3,693 - -
Operating expenses
during period- - 25,185 26,632
FY2017 FY2018 FY2017 FY2018Category
Investment ExpensesMajor items
For environmental conservation costs, investments were about 4 billion yen, about 5 billion less than the previous fiscal year. Due to industrial waste processing costs and other cost reduction efforts, expenses were about 17 billion yen, which is about 1.5 billion yen less than the previous fiscal year.

<Environmental Data 2019> 5
Note: CO2 emissions: including from power supplied by other companies; CO2 emissions coefficient: by amount of power sold(after adjustment CO2 emission factors include deductions that reflect CO2 credits and other deductions, as well as environmental valueadjustments based on the purchasing system for surplus solar and the purchasing system for total amounts of renewable); SOx and NOx emissions: only KEPCO-generated power; SOx and NOx emissions coe cient: by amount of power generated by KEPCO thermal power plants
FY2018 assessment(Effects of environmental conservation)
Effects of environmental conservation
Environmental accounting (KEPCO ②)
CO2 emissions
(basic)
CO2 emissions intensity
(basic)
CO2 emissions
(after adjustment)
CO2 emissions intensity
(after adjustment)
SOx emissions (t) 2,734 2,351 ▲ 383
SOx emissions intensity (g/kWh) 0.039 0.037 ▲ 0.002
NOx emissions (t) 5,402 4,686 ▲ 716
NOx emissions intensity (g/kWh) 0.077 0.074 ▲ 0.003
Revegetation area (1,000 m2) 0 0 0
Industrial waste and other
emissions(1,000 t) 654 580 ▲ 74
Recycling rate for
industrial waste, etc(%) 99.9 99.8 ▲ 0.1
Low-level radioactive
waste processing(Rods) 1,451 2,701 1,250
3.Building a
circular
economy
(kg-CO2/kWh) 0.42 0.33 ▲ 0.09
2.Local
environmental
conservation
Air pollution control
Landscape integration
▲ 0.09
(10,000t-CO2) 4,800 3,900 ▲ 900
1.Global
environmental
conservation
(10,000t-CO2) 5,000 4,200 ▲ 800
(kg-CO2/kWh) 0.44 0.35
Category Item (unit) FY2017 FY2018Year-on-year
change
CO2 emissions intensity is expected to improve greatly compared to the previous fiscal year. As a “low carbon” leader, from fiscal 2017 through fiscal 2018, we resumed operation of Takahama Units 3 and 4 and Ohi Units 3 and 4, which had been confirmed to be safe, one after the other, and we have continued to endeavor for their safe and stable operation. These efforts contributed to greatly improving our CO2
emissions coefficient.
Furthermore, we reduced SOx and NOx emissions intensities compared to the previous fiscal year through the appropriate use of sulfur scrubbers and nitrogen scrubbers and other efforts.

<Environmental Data 2019> 6
Note: LIME2 integration coefficients developed by the National Institute of Advanced Industrial Science and Technology have been used for calculations since fiscal 2007.
Environmental efficiency
Economic benefits from environmental conservation measures (100 million yen)
FY2018 assessment(Economic benefits from environmental conservation measures)
Environmental efficiency graph
108 109 115 119
146
68 68 71 72 85
50
70
90
110
130
150
170
'13 '14 '15 '16 '17 (Fiscal year)
Environmental accounting (KEPCO ③)
40.0 34.9
Cost
savings
Cost savings from reuse and
recycling, etc.0.1 0.1
Cost savings from the purchase of
recycled items
Total
RevenueOperating revenues from
recycling, etc.39.9 34.8 Gain on sale of disused articles(recycling)
Category FY2017 FY2018 Major Items
Economic benefits decreased approximately 0.5 billion yen from the previous year due to a reduction in results from efforts that lead to cost savings.
Environmental efficiency (with FY1990 as the base year) is calculated to indicate the relationship between environmental load and economic value.
Environmental efficiency for fiscal 2018 include scores of 181 for electric power sold/composite index, which is an increase of 35 points from the previous fiscal year, and 107 for electric power sold/CO2 emissions, which is an increase of 23 points from the previous fiscal year. Main factors for this included reductions in CO2, SOx and NOx emissions intensities and a decrease in fuel consumption accompanying the resumption of nuclear power plant operation.

<Environmental Data 2019> 7
Environmental accounting (group companies)
Environmental conservation costs (million yen)
Environmental conservation effects (physical effects)
Economic benefits from environmental conservation effects (million yen)
FY2017 FY2018 FY2017 FY2018
Costs for pollution control Air, water and soil pollution prevention - - 35.4 32.5
Costs for resource recycling General and industrial waste processing and recycling 1.1 0.9 947.2 738.3
Costs for management
activities
Environmental protection efforts, environmental education
and related activities at business places and in their
neighborhoods
0 0 131.4 129.9
Costs for community
activities
Contributions to and support of environmental protection
activities and environmental protection organizations
outside the company
- - 4.9 7.6
Costs for research and
development
Research and development of products, for example, that
contribute to environmental protection- - 6.4 11.0
Costs related to
environmental damagesNatural restoration, damage compensation, etc. - - 0.3 0.3
Other costs - - 0.1 0.1
1.1 0.9 1,125.6 919.7Total
Category Major ItemsInvestment Expenses
Category Major Items FY2017 FY2018
Revenue Business income from recycling 1,206.5 1,133.8
Cost savings Cost savings from re-use and recycling, etc. 0.1 0.0
1,206.6 1,133.8Total
Category Items (unit) FY2017 FY2018
CO2 emissions (10,000 t-CO2) 34 29
SOx emissions (t) 0.3 0.3
NOx emissions (t) 24 18
Environmental management ISO or other external certifications(locations)* 95 98
Building a circular economy Industrial waste emissions (1,000 t) 181 136
Global and local
environmental conservation

<Environmental Data 2019> 8
Environment-related data
*1 The amount of greenhouse gases emitted in our entire supply chain is calculated in accordance with the Basic Guidelines on Accounting for Greenhouse Gas Emissions Throughout the Supply Chain(ver.2.3) issued by the Ministry of the Environment and the Ministry of Economy, Trade and Industry.
*2 The direct greenhouse gas emission amounts (scope 1) are totals of direct greenhouse gas emissions (CO2, SF6 and N2O from energy) reported (for the business) in accordance with the Warming Countermeasures Act and CO2 emissions from vehicle fuel not included in this reporting.
*3 The indirect greenhouse gas emission amounts (scope 2) are totals of CO2 emissions from electricity and heat purchased from others among those reported (for the business) in accordance with the Warming Countermeasures Act as indirect CO2 emissions.
*4 Indirect emissions not covered by Scope 1 or Scope 2(emissions by other companies related to the business activities of the subject company)*5 Price of purchased goods and services × Emission Factor [t-CO2 /million yen]*6 Price of capital goods [million yen]×Emission Factor 3.30 [t-CO2 /million yen]*7 Fuel consumption × Emission Factor [t-CCO2/each unit] + expenses for power purchased by other operators × Emission Factor*8 Fuel consumption × Emission Factor [t-CO2/each unit]*9 Waste disposal volume × emission factor + fuel consumption × emission factor*10 number of employees × emission factor*11(City classification-based)Σ(Number of employees × business days × emission factor)
○Initiatives contributing to the realization of a low-carbon society
2014 2015 2016 2017 2018 Unit
4,571 4,180 3,949 3,281 2,866 10,000 t-CO2
1.0 1.0 1.0 1.0 0.6 10,000 t-CO2
─ 1.4 1.4 860.9 800.1 10,000 t-CO2
─ ─ ─ 129.6 123.2
─ ─ ─ 80.0 102.6
─ ─ ─ 648.9 572.3
─ 0.1 0.1 0.1 0.1
─ 1.3 1.3 1.2 1.1
─ ─ ─ 0.3 0.3
─ ─ ─ 0.8 0.6
10,000 t-CO2
Category 7*11
Category 2*6
Category 3*7
Category 4*8
Category 5*9
Category 6*10
Fiscal year
Total direct GHG emissions (Scope1)*1*2
Indirect greenhouse gas emissions from energy
purchased and consumed (Scope2)*1*3
Other indirect greenhouse gas emission
amounts*1*4
Category 1*5

<Environmental Data 2019> 9
Environment-related data
※1 The amount of CO2 emissions is the amount produced from consumption of fuel used for power generation by thermal power plants and includes that for power purchased from other companies.
※2 The fiscal 2018 figures are provisional. The actual figures of the CO2 emissions coefficient will be officially announced by the government separately based on the Act on Promotion of Global Warming Countermeasures and other factors.
※3 After adjustment figures reflect, for example, adjustments for environmental value that accompany the feed-in tariff system for renewable energy.CO2 emissions amount = CO2 emissions amount(before adjustment) + feed-in tariff adjustment CO2 emissions amount,etc.
※4 CO2 emissions coefficient (end use) is the amount of CO2 emissions per kWh of Kansai Electric Power Company electricity used.・CO2 emissions coefficient (end use) (before adjustment) = amount of CO2 emissions (before adjustment) ÷ electricity sales volume・CO2 emissions coefficient (end use) (after adjustment) = amount of CO2 emissions (after adjustment) ÷ electricity sales volume
※5 Global CO2 emissions: IEA "CO2 Emissions From Fuel Combustion" 2015 Edition※6 Japan's CO2 emissions: Source: Greenhouse Gas Inventory Office of Japan (Center for Global Environmental Research, National Institute for Environmental Studies)※7 Sources for CO2 emissions and CO2 emission coefficients for the electric power industry are resources from the Industrial Structure Council and materials from the Natural
Resources and Energy Working Group of the Electric Power Council for a Low Carbon Society(ELCS).(Through fiscal 2014, the total of results of the Federation of Electrical Power Companies of Japan and volunteering PPS (power producer and supplier) companies are used. In fiscal 2015,the results of 39 companies that undertook business activities that fiscal year among member businesses of the ELCS are used.)
※8 Published in FY2010 results; figures are CO2 equivalents※9 Utilization rate of nuclear power facilities = amount of power generated÷(permitted output× calendar hours)×100※10 Net thermal efficiency of thermal power facilities = (amount of power transmitted × quantity of heat per kWh)
÷total amount of input heat(lowest heat value standard)×100
○Initiatives contributing to the realization of a low-carbon society
2014 2015 2016 2017 2018 Unit
7,141 6,487 6,179 5,018 4,200 10,000 t-CO2
7,029 6,331 5,989 4,822 3,900 10,000 t-CO2
0.531 0.509 0.509 0.435 0.350 kg-CO2/kWh
0.523 0.496 0.493 0.418 0.330 kg-CO2/kWh
323 323 - - -100 million
t-CO2
12.66 12.26 12.06 11.4 -100 million
t-CO2
CO2 emissions
(before carbon credits,etc.)4.70 4.44 4.32 4.11 -
CO2 emissions
(after carbon credits,etc.)4.69 4.41 4.30 4.11 -
CO2 emissions
(before carbon credits,etc.)
(by amount of electric power sold)
0.553 0.534 0.518 0.497 -
CO2 emissions
(after carbon credits,etc.)
(by amount of electric power sold)
0.552 0.531 0.516 0.496 -
N2O (dinitrogen oxide)※8
2.9 2.7 2.8 2.8 2.4 10,000 t-CO2
SF6 (sulfur hexafluoride)※8 5.0 4.4 4.8 4.6 5.1 10,000 t-CO2
0.0 1.0 0.0 18.0 54.6 %
46.5 46.6 47.6 48.3 49.0 %
100 million
t-CO2
kg-CO2/kWh
Global CO2 emissions※5
Japan's CO2 emissions※6
Electric
power
industry※7
Fiscal year
CO2 emissions (before adjustment)※1,※2
CO2 emissions (after adjustment)※2,※3
CO2 emissions coefficient (end use)(before adjustment)
(by amount of electric power sold)※2,※4
CO2 emissions coefficient (end use)(after adjustment)
(by amount of electric power sold)※2,※4
Greenhouse gases
other than CO2
Utilization rate of nuclear power facilities※9
Net thermal efficiency of thermal power facilities※10
Reference

<Environmental Data 2019> 10
※11 Figures reported to the government based on the Act on the Rational Use of Energy.(Fossil fuel used, purchased electricity, purchased heat)※12 Power distribution loss rate =[1-{(amount of power sold+amount of power at transformer substation) ÷(generated and purchased electric power - amount of power at KEPCO power plants)}]×100※13 Actual figures for FY2014 include equipment used by the company.※14 The scope for calculation of office electricity use and everyday water use has been revised.※15 Rate of introduction of low-pollution Vehicles = No. of low-pollution vehicles purchased ÷ Total no. of vehicles×100※16 CO2 emissions from office activities = amount of electricity used×CO2 emissions coefficient after carbon credits, etc.
CO2 emissions from everyday water use = amount of everyday water used × emissions coefficientCO2 emissions from vehicle use = amount of vehicle fuel used × coefficient by type of fuel
○Initiatives contributing to the realization of a low-carbon society
Environment-related data
2014 2015 2016 2017 2018 Unit
760,782 701,316 675,113 554,656 550,865 1,000GJ
212,641 196,009 188,668 154,892 137,509
34.8 34.2 36.1 34.2 33.4
Total costs of energy consumption※12 1,757,072 1,203,739 985,199 986,834 1,052,099 million yen
Coal 4,034 3,871 4,163 4,288 3,455 1,000 t
Heavy oil 332 193 275 157 136 1,000 kL
Crude oil 4,240 3,366 1,358 345 194 1,000 kL
LNG 8,824 8,319 8,686 7,287 6,734 1,000 t
Wood pellets 17 18 18 16 2
1,000 kL
(equivalent
in heavy oil)
Other 0.1 0.6 460 361 288
1,000 kL
(equivalent
in heavy oil)
- 61 - 37 87 tU
0 1,744 1500 500 900 kW
5.4 5.2 5.5 4.4 5.1 %
0.1 0.1 0.1 0.1 0.2 t
0.1 0.1 0.1 0.0 0.2 t
0.0 0.0 0.0 0.1 0.1 t
98.8 99.1 99.3 99.6 98.5 %
99.5 99.1 99.6 99.3 99.3 %
each year 36,500 31,464 9,080 500 3890
Cumulative total※14 66,890 98,354 107,434 107,934 111,824
11,662 11,000 11,000 11,000 11,000
153 0 0 0 0
0 0 0 0 0
Office electricity use※15 79 78 80 77 78 GWh
Everyday water use※15 461 424 454 452 425 1,000 m3
Vehicle fuel costs 10.73 11.13 11.13 11.31 11.4 km/L
Vehicle fuel use(gasoline) 2.6 2.3 2.2 2.1 2.0 1,000 kL
Vehicle fuel use(diesel) 0.5 0.3 0.3 0.3 0.3 1,000 kL
Copier paper use 839 908 961 809 772 t
86.1 86.2 86.4 90.0 91.3 %
Office electricity 4.2 3.9 3.9 3.3 2.5805 10,000 t-CO2
Everyday water 0.01 0.01 0.01 0.01 0.01 10,000 t-CO2
Vehicle fuel 0.7 0.6 0.6 0.6 0.5 10,000 t-CO2
●Fuel cell batteries
Energy and
resource savings
(Office division)
Low-pollution vehicle introduction rate※16
CO2 emissions
from office
activities※17
SF6 collection rate
●Upon inspection
●Upon removal
Making efforts for
renewable energy
developmentkW
●Solar power generation
●Wind power generation
Hydroelectric power station replacement
Power distribution loss rate※13
SF6 gas emissions
●(Repeated)Upon inspection
●(Repeated)Upon removal
Non-renewable fuels purchased and consumed
(kWh conversion)GWh
Steam/heating/cooling and other energy (non-
renewable) purchased (kWh conversion)
Thermal fuel
consumption
Fuel for nuclear power generation
(weight of pre-irradiated uranium)
Total energy use※11
Fiscal year

<Environmental Data 2019> 11
※1 Industrial waste recycling rate = [(Industrial waste and other emissions - Amount of landfill disposal) ÷ (Industrial waste and other emissions)]×100※2 Processing at pole-mounted transformer case recycling center was completed in July 2015.※3 Excluding desalinated seawater
○Initiatives contributing to the realization of a recycling-oriented society
Environment-related data
2014 2015 2016 2017 2018 Unit
698.6 670.2 707.9 653.6 580.0 1,000 t
3.4 4.0 4.4 5.5 8.3
474.3 443.8 480.6 438.3 387.0
143.2 141.9 141.1 130.3 107.9
27.4 28.8 28.0 28.6 25.3
21.0 23.8 18.3 16.5 18.2
21.7 20.6 28.9 29.1 23.9
2.5 2.2 2.6 1.8 1.3
2.4 2.2 2.4 2.2 3.0
1.0 0.8 0.8 0.9 0.9
5.1 6.0 5.4 6.0 12.6
56.8 58.0 59.4 55.4 56.0
1.2 0.9 1.8 0.9 0.9 1,000 t
0.12 0.10 0.33 0.06 0.09
0.74 0.47 0.34 0.19 0.48
0.11 0.03 0.02 0.03 0.03
0.00 0.00 0.00 0.00 0.00
0.07 0.09 0.07 0.05 0.10
0.05 0.10 0.55 0.19 0.05
0.13 0.14 0.52 0.42 0.14
1.19 0.94 1.36 0.52 0.77
697.4 669.3 706.1 652.7 579.1 1,000 t
55.6 57.1 58.0 54.8 55.2 1,000t
99.8 99.9 99.7 99.9 99.8 %
100 100 100 100 100 %
Insulating oil 7.7 7.7 - - - 10,000kL
Transformer cases 22.7 about 24 - - - 10,000 units
Total net fresh water consumption※3 6.76 6.86 6.25 5.35 5.19 1,000,000 m3
0.40 0.36 0.29 0.36 0.40
0.00 0.00 0.00 0.00 0.00
Total municipal water supplies 6.36 6.50 5.96 4.99 4.79 1,000,000 m3
4.31 4.53 4.30 3.85 3.70
2.05 1.97 1.66 1.14 1.09
2.45 2.55 2.62 2.63 2.74 1,000,000 m3
River water1,000,000 m3
Groundwater
Amount of industrial water used (for power generation) 1,000,000 m3
Amount of service water used (for power generation)
Seawater (desalinated)
Amount of industrial waste recycling
(Repeated) Amount except for ash, gypsum, and special
controlled industrial waste
Industrial waste recycling rate※1
(Repeated) Ash and gypsum waste recycling rate※1
Low-concentration PCB industrial waste
Amount processed※2
(utility pole transformers)
●Glass/ceramic scraps
(Thermal insulation scraps,insulator scraps,etc.)
1,000 t
●sludge(Wastewater processing sludge,etc.)
●Demolition debris
●Cinders
●Waste plastic
●Metal scraps
●Other
●(Repeated)Amount except for ash, gypsum, and special
controlled industrial waste
●Glass/ceramic scraps(Thermal insulation scraps,insulator
scraps, etc.)
●Waste oil
●Waste plastic
●Other
●(Repeated)Amount except for ash, gypsum, and special
controlled industrial waste
Amount of industrial waste for landfill disposal
Fiscal year
Amount of industrial waste and other emissions
(Repeated)Special controlled industrial waste
1,000 t
●Soot particles (Heavy/crude oil ash, coal ash,etc.)
●Sludge (Desulfogypsum,wastewater processing sludge,etc.)
●Cinders
●Demolition debris(Waste concrete utility poles,etc.)
●Metal scraps
<Environmental Data 2019> 12
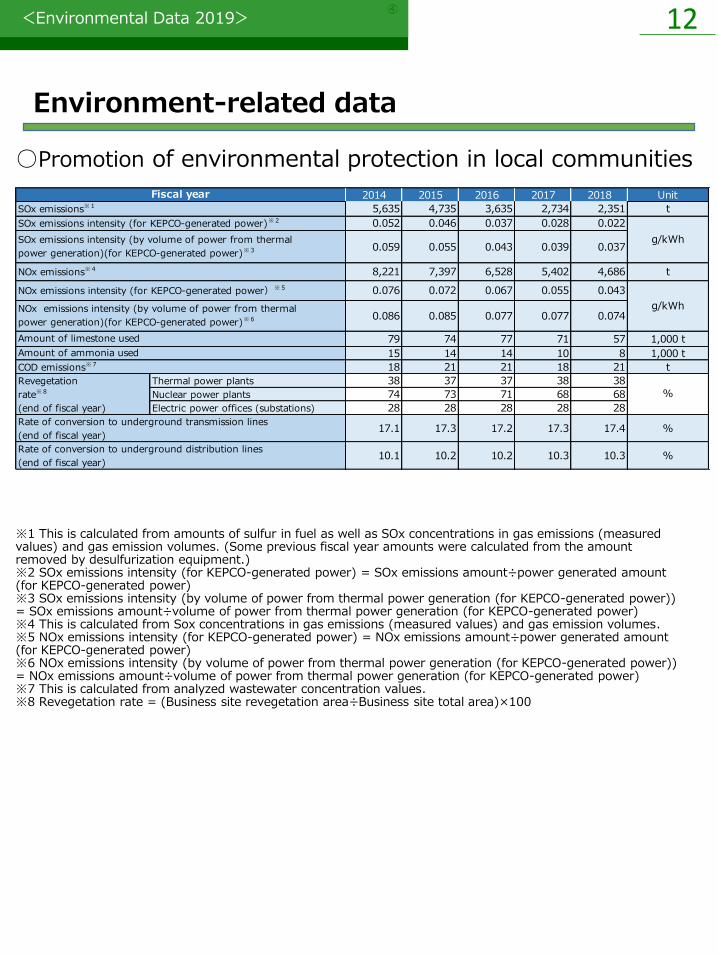
※1 This is calculated from amounts of sulfur in fuel as well as SOx concentrations in gas emissions (measured values) and gas emission volumes. (Some previous fiscal year amounts were calculated from the amount removed by desulfurization equipment.)※2 SOx emissions intensity (for KEPCO-generated power) = SOx emissions amount÷power generated amount (for KEPCO-generated power)※3 SOx emissions intensity (by volume of power from thermal power generation (for KEPCO-generated power)) = SOx emissions amount÷volume of power from thermal power generation (for KEPCO-generated power)※4 This is calculated from Sox concentrations in gas emissions (measured values) and gas emission volumes.※5 NOx emissions intensity (for KEPCO-generated power) = NOx emissions amount÷power generated amount (for KEPCO-generated power)※6 NOx emissions intensity (by volume of power from thermal power generation (for KEPCO-generated power)) = NOx emissions amount÷volume of power from thermal power generation (for KEPCO-generated power)※7 This is calculated from analyzed wastewater concentration values.※8 Revegetation rate = (Business site revegetation area÷Business site total area)×100
○Promotion of environmental protection in local communities
Environment-related data
2014 2015 2016 2017 2018 Unit
5,635 4,735 3,635 2,734 2,351 t
0.052 0.046 0.037 0.028 0.022
0.059 0.055 0.043 0.039 0.037
8,221 7,397 6,528 5,402 4,686 t
NOx emissions intensity (for KEPCO-generated power)※5 0.076 0.072 0.067 0.055 0.043
0.086 0.085 0.077 0.077 0.074
79 74 77 71 57 1,000 t
15 14 14 10 8 1,000 t
18 21 21 18 21 t
Thermal power plants 38 37 37 38 38
Nuclear power plants 74 73 71 68 68
Electric power offices (substations) 28 28 28 28 28
17.1 17.3 17.2 17.3 17.4 %
10.1 10.2 10.2 10.3 10.3 %
Rate of conversion to underground transmission lines
(end of fiscal year)
Rate of conversion to underground distribution lines
(end of fiscal year)
g/kWhNOx emissions intensity (by volume of power from thermal
power generation)(for KEPCO-generated power)※6
Amount of limestone used
Amount of ammonia used
COD emissions※7
Revegetation
rate※8
(end of fiscal year)
%
NOx emissions※4
Fiscal year
SOx emissions※1
SOx emissions intensity (for KEPCO-generated power)※2
g/kWhSOx emissions intensity (by volume of power from thermal
power generation)(for KEPCO-generated power)※3

<Environmental Data 2019> 13
Notes : ●The chart show total values reported in compliance with the PRTR Law●"0"indicates no emissions or transfers at targeted business site●"<0.1"indicates less than 0.1 t/year emissions, etc.●"-" indicates no business sites targeted for totaling●Significant figures are displayed in two digits
○Management of chemical substances (PRTR)
Environment-related data
2014 2015 2016 2017 2018
2-aminoethanol 0.0 - - 0.0 -
Asbestos (specified) 0.0 0.0 0.0 0.0 0.0
Ethylbenzene 6.2 12.0 11.0 3.8 4.7
Ferric chloride 0.0 0.0 0.0 0.0 0.0
Xylene 12.0 16.0 17.0 5.4 6.5
HCFC-225 - 0.0 - - -
Styrene - 2.0 1.5 - -
Dioxins (specified)0.28
(mg-TEQ/year)
0.54
(mg-TEQ/year)
0.66
(mg-TEQ/year)
0.35
(mg-TEQ/year)
0.065
(mg-TEQ/year)
1,2,4-trimethylbenzene - 0.0 0.0 1.9 <0.1
Toluene 12.0 11.0 7.2 5.9 4.9
Hydrazine <0.1 <0.1 <0.1 <0.1 <0.1
n-Hexane 5.9 4.6 0.7 - -
Benzenes (specified) 2.4 1.9 0.8 0.2 0.1
Boron compound 0.0 0.0 0.0 0.0 -
PCB - 0.0 0.0 - 0.0
Methylnaphthalene 3.3 3.4 3.2 2.4 1.4
Bromotrifluoromethane - - - - 0.0
poly(oxyethylene)nonylphe
nyl ether- - - - 0.0
Name of targeted
chemical substance
Emissions (t/year)
2014 2015 2016 2017 2018
2-aminoethanol 8.9 - - 4.1 -
Asbestos (specified) 5.1 3.4 1.3 4.7 6.8
Ethylbenzene 0.0 0.0 0.0 0.0 0.0
Ferric chloride 3.0 0.0 0.0 0.0 1.0
Xylene 0.0 <0.1 0.0 0.0 0.0
HCFC-225 - 2.2 - - -
Styrene - 0.0 0.0 - -
Dioxins (specified)0.0050
(mg-TEQ/year)
0.000079
(mg-TEQ/year)
0.046
(mg-TEQ/year)
0.039
(mg-TEQ/year)
0.030
(mg-TEQ/year)
1,2,4-trimethylbenzene - 0.0 0.0 0.0 0.0
Toluene 0.0 0.0 0.0 0.0 0.0
Hydrazine 3.1 3.0 0.9 2.5 0.0
n-Hexane 0.0 0.0 0.0 - -
Benzenes (specified) 0.0 0.0 0.0 0.0 0.0
Boron compound 6.7 7.3 6.3 8.4 -
PCB - 13 1.6 - 4.7
Methylnaphthalene <0.1 0.0 0.0 0.0 <0.1
Bromotrifluoromethane - - - - 0.0
poly(oxyethylene)nonylphe
nyl ether- - - - 0.0
Name of targeted
chemical substance
Amount moved (t/year)

<Environmental Data 2019> 14
*1 Millisieverts (effective dose): unit indicating the degree of radiation's effect on the human body*2 Becquerel: Unit of radioactivity (one becquerel is defined as one nucleus decaying per second, representing the rate at which radioactive material emits radiation)*3 Notes 4-7 are for the storage status at power plants*4 This is the amount of solid low-level radioactive waste produced in the fiscal year.*5 This is the total of amount of solid waste with low-level radioactivity reduced through incineration, for example, and transported out of facilities in the fiscal year.*6 This is the net increase of solid waste with low-level radioactivity calculated by deducting the amount reduced from the amount generated in the fiscal year.*7 Cumulative amount of low-level solid radioactive waste*8 Totals might not match due to rounding after conversion to drum equivalent.
○Radioactive substances, radioactive waste
Environment-related data
2014 2015 2016 2017 2018 Unit
Mihama Nuclear Power Station N.D. N.D. <0.001 N.D. N.D.
Takahama Nuclear Power Station <0.001 <0.001 N.D. N.D. N.D.
Ohi Nuclear Power Station N.D. N.D. N.D. N.D. N.D.
Mihama Nuclear Power Station N.D. N.D. N.D. N.D. N.D.
Takahama Nuclear Power Station N.D. N.D. N.D. N.D. N.D.
Ohi Nuclear Power Station N.D. N.D. N.D. N.D. N.D.
Mihama Nuclear Power Station <0.001 <0.001 <0.001 <0.001 <0.001
Takahama Nuclear Power Station <0.001 <0.001 <0.001 <0.001 <0.001
Ohi Nuclear Power Station <0.001 <0.001 <0.001 <0.001 <0.001
Mihama Nuclear Power Station N.D. N.D. 2.7.E+09 N.D. N.D.
Takahama Nuclear Power Station 2.3.E+08 2.5.E+08 N.D. N.D. N.D.
Ohi Nuclear Power Station N.D. N.D. N.D. N.D. N.D.
Mihama Nuclear Power Station N.D. N.D. N.D. N.D. N.D.
Takahama Nuclear Power Station N.D. N.D. N.D. N.D. N.D.
Ohi Nuclear Power Station N.D. N.D. N.D. N.D. N.D.
Mihama Nuclear Power Station N.D. N.D. N.D. N.D. N.D.
Takahama Nuclear Power Station N.D. N.D. N.D. N.D. N.D.
Ohi Nuclear Power Station N.D. N.D. N.D. N.D. N.D.
15,756 14,318 13,750 15,863 11,800
4,888 4,978 4,302 5,000 4,828
6,368 4,471 5,002 5,722 4,396
4,500 4,869 4,446 5,141 2,576
18,082 20,298 16,348 14,412 9,099
5,710 6,583 4,514 5,424 3,907
6,152 7,402 6,984 4,354 3,460
6,220 6,313 4,850 4,634 1,732
-2,326 -5,980 -2,598 1,451 2,701
-822 -1,605 -212 -424 921
216 -2,931 -1,982 1,368 936
-1,720 -1,444 -404 507 844
104,735 98,756 96,159 97,610 100,311
27,491 25,887 25,675 25,251 26,172
46,832 43,901 41,919 43,287 44,223
30,412 28,968 28,565 29,072 29,916
Radioactive gaseous
waste discharged
(iodine)
Becquerel※2
Fiscal year
Gaseous
waste
Evaluated dose values
for the public in the
vicinity of power plants
(inert gases)
Millisieverts※1
Evaluated dose values
for the public in the
vicinity of power plants
(iodine)
Millisieverts※1
Liquid
waste
Evaluated dose values
for the public in the
vicinity of power plants
Millisieverts※1
Radioactive gaseous
waste discharged
(inert gas)
Becquerel※2
Radioactive gaseous
waste discharged
(excluding tritium)
Becquerel※2
Radioactive solid nuclear waste generated (200-L drums)※4
Equivalent
in drumsMihama Nuclear Power Station
Takahama Nuclear Power Station
Ohi Nuclear Power Station
Amount of solid radioactive waste generated-amount of
solid radioactive waste reduced (200-L drum can equivalent)※6
Equivalent
in drumsMihama Nuclear Power Station
Takahama Nuclear Power Station
Ohi Nuclear Power Station
Radioactive solid nuclear waste shrinkage (200-L drums)※5
Equivalent
in drumsMihama Nuclear Power Station
Takahama Nuclear Power Station
Ohi Nuclear Power Station
Radioactive solid nuclear waste cumulative amount stored
(200-L drums)※7、8
Equivalent
in drumsMihama Nuclear Power Station
Takahama Nuclear Power Station
Ohi Nuclear Power Station
<Environmental Data 2019> 15
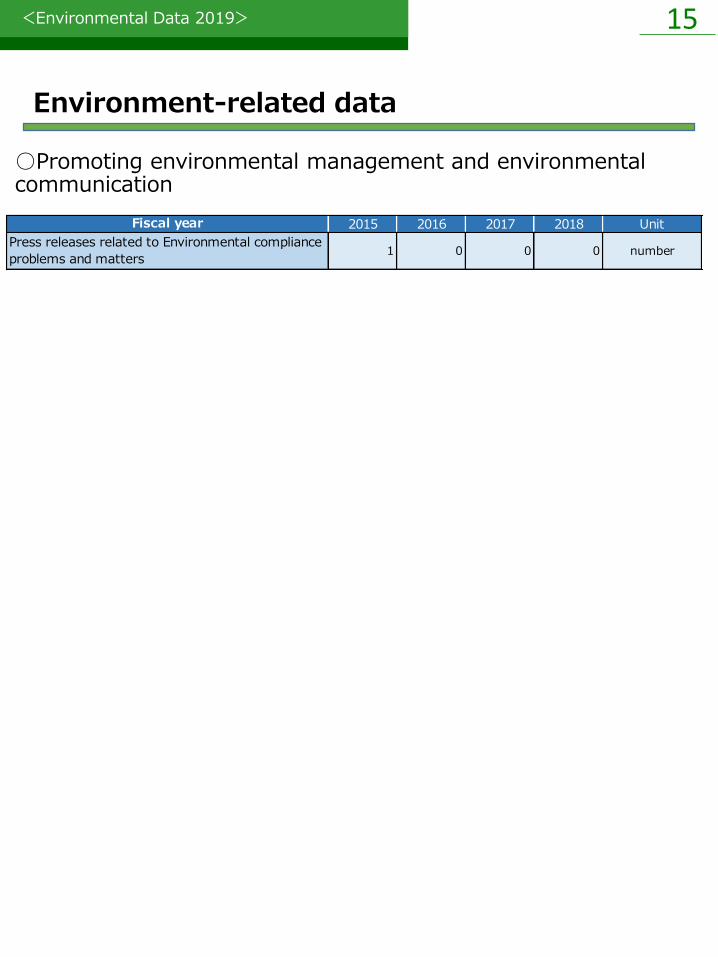
○Promoting environmental management and environmental communication
Environment-related data
2015 2016 2017 2018 Unit
1 0 0 0 number
Fiscal year
Press releases related to Environmental compliance
problems and matters

<Environmental Data 2019> 16
Environmental protection records at thermal power plants ①
※1 Regulation in rules for the execution of ordinances to protect and nurture the environment of Kyoto Prefecture※2 Regulated value of Osaka City sewer ordinance execution rules
Tanagawa No. 2
Power Station
Nanko
Power Station
Miyazu Energy
Research Center
Kansai International
Airport Energy Center
Maizuru
Power Station
Heavy/crude oil L Heavy/crude oil Kerosene Coal
Air Pollution Control Law
(total amount regulation)- 98 306
※1 13 515※1
Agreed value - - 112 - 255
Actual value Stopped - Stopped - 180
Agreed value 9.3 - - - -
Actual value Stopped - - - -
Agreed value 3,020 - 492×103m3N - 1,523×103m3N
Actual value Stopped - Stopped - 774.9×10³m3N
Air Pollution Control Law
(total amount regulation)- 255 - - -
Agreed value - - 58 - 244
Actual value Stopped 36 Stopped - 210
Agreed value 7.2 1.8 - - -
Actual value Stopped 1.4 - - -
Agreed value 2,100 400 244×103m3N - 1457×103m3N
Actual value Stopped 165 Stopped - 1421.8×103m
3N
Air Pollution Control Law 0.07 0.03 0.05 0.05 0.1
Agreed value 0.02 Not emitted 0.014 - 0.009
Actual value Stopped - Stopped - ※5 0.005
No.1
drain outlet
No.2
drain outlet
Agreed value 5.8~8.6 - 5.8~8.6 - 5.8~8.6
Actual value 7.9 7.4 Stopped 7.9 6.0~7.9 - 6.2~7.9
Water pollution laws
and regulations12 160 160 - 160 - 160
Agreed value 15 - 15 - 15
Actual value 1.7 1.9 Stopped - 8.0 - 6.6
Water pollution laws
and regulations55 - - - -
Agreed value 14 - 20.8 - 22
Actual value Stopped - 0.7 - 5.71
Water pollution laws
and regulations90 600※2 200 - 200
Agreed value 20 - 20 - 15
Actual value Stopped 7 1 - 5
Water pollution laws
and regulations3 4※2 5 - 5
Agreed value 1 - 1 - 1
Actual value Stopped <1.0 <0.5 - <1.0
5.8~8.6
-
Chemical oxygen
demand
Highest concentration
(mg/L) -
Pollution load amount
(kg/d)
388.4
-
- 5.0~9.0
Water
quality
related
Hydrogen ion concentration index
Water pollution laws
and regulations5.8~8.6 5.0~9.0
※2
-
<5
Amount of
inclusion of
normal hexane
extractable
substances
Highest concentration
(mg/L)
2
-
<1
5.0~9.0
15.8
Amount of
suspended
solids
Highest concentration
(mg/L)
50
591
Soot particlesEmission concentration
(g/m3N)
0.04
0.02
<0.002
Nitrogen oxide
Amount emitted hourly
(m3N/h)
625
-
45.8
Amount emitted daily
(t/d)
7.7
2.0
Amount emitted annually
(t/y)
1,420
ItemSakaiko
Power Station
Main fuel L
Air quality
related
Sulfur oxide
Amount emitted hourly
(m3N/h)
84
-
-
Amount emitted daily
(t/d)
10.1
-
Amount emitted annually
(t/y)
940
-
<Environmental Data 2019> 17
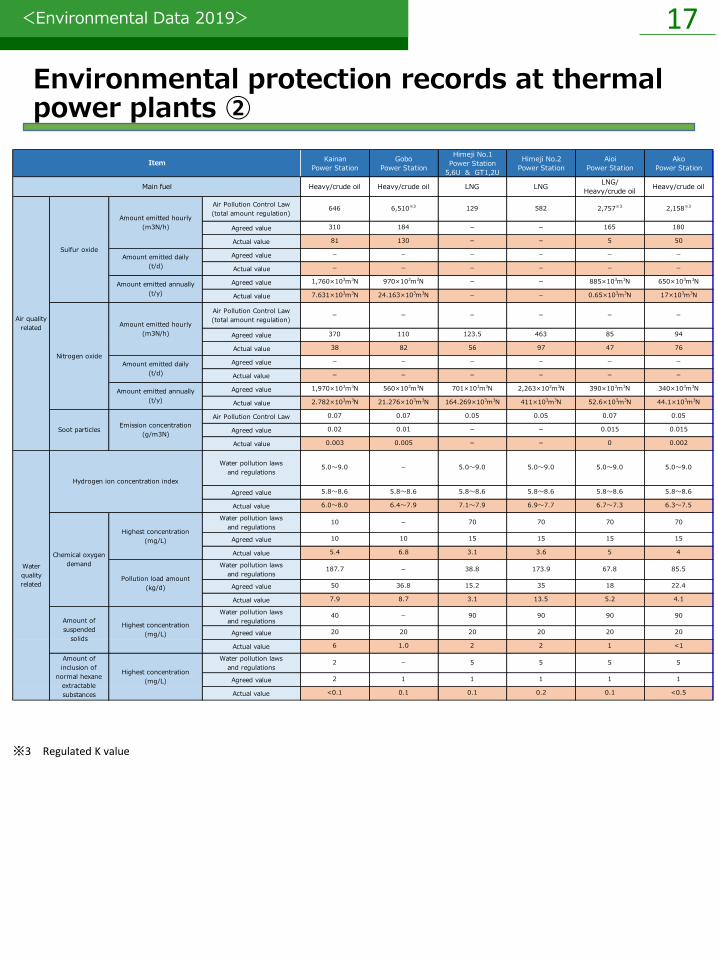
※3 Regulated K value
Environmental protection records at thermal power plants ②
Kainan
Power Station
Gobo
Power Station
Himeji No.1
Power Station
5,6U & GT1,2U
Himeji No.2
Power Station
Aioi
Power Station
Ako
Power Station
Heavy/crude oil Heavy/crude oil LNG LNGLNG/
Heavy/crude oilHeavy/crude oil
Air Pollution Control Law
(total amount regulation)646 6,510※3 129 582 2,757※3 2,158※3
Agreed value 310 184 - - 165 180
Actual value 81 130 - - 5 50
Agreed value - - - - - -
Actual value - - - - - -
Agreed value 1,760×103m3N 970×103m3N - - 885×103m3N 650×103m3N
Actual value 7.631×10³m3N 24.163×10³m3N - - 0.65×10³m3N 17×103m3N
Air Pollution Control Law
(total amount regulation)- - - - - -
Agreed value 370 110 123.5 463 85 94
Actual value 38 82 56 97 47 76
Agreed value - - - - - -
Actual value - - - - - -
Agreed value 1,970×103m3N 560×103m3N 701×103m3N 2,263×103m3N 390×103m3N 340×103m3N
Actual value 2.782×10³m3N 21.276×10³m3N 164.269×10³m3N 411×103m3N 52.6×10³m3N 44.1×10³m3N
Air Pollution Control Law 0.07 0.07 0.05 0.05 0.07 0.05
Agreed value 0.02 0.01 - - 0.015 0.015
Actual value 0.003 0.005 - - 0 0.002
Agreed value 5.8~8.6 5.8~8.6 5.8~8.6 5.8~8.6 5.8~8.6 5.8~8.6
Actual value 6.0~8.0 6.4~7.9 7.1~7.9 6.9~7.7 6.7~7.3 6.3~7.5
Water pollution laws
and regulations10 - 70 70 70 70
Agreed value 10 10 15 15 15 15
Actual value 5.4 6.8 3.1 3.6 5 4
Water pollution laws
and regulations187.7 - 38.8 173.9 67.8 85.5
Agreed value 50 36.8 15.2 35 18 22.4
Actual value 7.9 8.7 3.1 13.5 5.2 4.1
Water pollution laws
and regulations40 - 90 90 90 90
Agreed value 20 20 20 20 20 20
Actual value 6 1.0 2 2 1 <1
Water pollution laws
and regulations2 - 5 5 5 5
Agreed value 2 1 1 1 1 1
Actual value <0.1 0.1 0.1 0.2 0.1 <0.5
5.0~9.0 5.0~9.0
Chemical oxygen
demand
Highest concentration
(mg/L)
Pollution load amount
(kg/d)
5.0~9.0 - 5.0~9.0 5.0~9.0
Water
quality
related
Hydrogen ion concentration index
Water pollution laws
and regulations
Amount of
inclusion of
normal hexane
extractable
substances
Highest concentration
(mg/L)
Amount of
suspended
solids
Highest concentration
(mg/L)
Soot particlesEmission concentration
(g/m3N)
Nitrogen oxide
Amount emitted hourly
(m3N/h)
Amount emitted daily
(t/d)
Amount emitted annually
(t/y)
Item
Main fuel
Air quality
related
Sulfur oxide
Amount emitted hourly
(m3N/h)
Amount emitted daily
(t/d)
Amount emitted annually
(t/y)

<Environmental Data 2019> 18
Kansai Electric Power Group Environmental Action Policy
Based on our Kansai Electric Power Group CSR Action Charter, as an energy business that has a deep connection to the environment, we are formulating the Kansai Electric Power Group Environmental Action Policy as the environmental management policy to be pursued by our group over the medium and long terms. We are realizing this policy through deliberations by our Environmental Board chaired by our Executive Officer in charge of environmental affairs.
As issues that should be considered in the conduct of our business activities, the Kansai Electric Power Group Environmental Action Policy expresses four main focuses that should be followed in our efforts, including “initiatives contributing to the realization of a low-carbon society.”

19<Environmental Data 2019>
Eco Action (FY 2019 published version)

20<Environmental Data 2019>
Eco Action (FY2019 published version)【 Group-wide Items】

21<Environmental Data 2019>
Eco Action results (FY2014~FY2018)
※1 The fiscal 2018 figures are provisional. The actual figures of the CO2 emissions coefficient will be officially announced by the government separately based on the Act on Promotion of Global Warming Countermeasures and other factors.
※2 CO2 emissions coefficient (end use) (after adjustment) = amount of CO2 emissions (after adjustment) ÷ electricity sales volume
※3 Net thermal efficiency of thermal power facilities = (amount of power transmitted × quantity of heat per kWh)÷total amount of input heat(lowest heat value standard)×100
※4 Power distribution loss rate =[1-{(amount of power sold+amount of power at transformer substation)÷(generated and purchased electric power - amount of power at KEPCO power plants)}]×100
※5 Industrial waste recycling rate = [(Industrial waste and other emissions - Amount of landfill disposal)÷(Industrial waste and other emissions)]×100
※6 number of high-voltage transformers, condensers and other electrical equipment that were subcontracted to the Japan Environmental Storage & Safety Corporation (JESCO)
※7 SOx emissions factor (for KEPCO-generated power) = SOx emissions amount÷power generated amount (for KEPCO-generated power)
※8 SOx emissions factor (by volume of power from thermal power generation (for KEPCO-generated power)) =SOxemissions amount÷volume of power from thermal power generation (for KEPCO-generated power)
※9 NOx emissions factor (for KEPCO-generated power) = NOx emissions amount÷power generated amount (for KEPCO-generated power)
※10 NOx emissions factor (by volume of power from thermal power generation (for KEPCO-generated power)) =NOx emissions amount÷volume of power from thermal power generation (for KEPCO-generated power)
Item 2014 2015 2016 2017 2018
Advancing efforts to control CO2
emissions
CO2 emission factor (end use)
(after adjustment)(by amount of
electric power sold)※1,※2
0.523kg CO2/kWh 0.496kg CO2/kWh 0.493kg CO2/kWh 0.418kg CO2/kWh 0.33kg CO2/kWh
Renewable energy development3 locations
36,500kW
2 locations
30,220kW
2 locations
7,580kW
1 location
500kW
3 locations
3,890kW
Renewable energy purchased 2.85billion kWh 4.00 billion kWh 4.83billion kWh 5.85 billion kWh 5.72 billion kWh
Promotion of hydroelectric power
construction- - - 2 2
Participation in renewable energy
investment projects- - - 1 2
Developing country support efforts
under GSEP framework- - - 2 1
Maintaining and improving the thermal
efficiency of thermal power plants(lower
heating value base)
Thermal efficiency※3 46.5% 46.6% 47.6% 48.3% 49.0%
Reducing transmission and distribution
loss
transmission and distribution loss
rate※45.4% 5.2% 5.5% 4.4% 5.1%
Promoting use of innovative forms of
energy among customers and
communities
Smart meters deployed 1.4million/year
1.6million/year
(cumulative 5.55
million)
1.95million/year
(cumulative 7.5
million)
1.82million/year
(cumulative 9.32
million)
progress rate:
about 72%
1.26million/year
(cumulative 10.58
million)
progress rate:
about 81%
Upon inspection 98.8% 99.1% 99.3% 99.6% 98.5%
Upon removal 99.5% 99.1% 99.6% 99.3% 99.3%
Maintaining industrial waste recycling
rateIndustrial waste recycling rate※5 99.8% 99.9% 99.7% 99.9% 99.8%
Proper processing of PCB wastes(before
the legal dead line)
Amount of high-concentration PCB
processed(cumulative total)※64,064 4,763 4,834 5,073 5,241
SOx emissions factor (for KEPCO-
generated power)※70.052g/kWh 0.046g/kWh 0.037g/kWh 0.028g/kWh 0.022g/kWh
SOx emissions factor (by volume of
power from thermal
power generation)(for KEPCO-
generated power)※8
0.059g/kWh 0.055g/kWh 0.043g/kWh 0.039g/kWh 0.037g/kWh
NOx emissions factor (for KEPCO-
generated power)※90.076g/kWh 0.072g/kWh 0.067g/kWh 0.055g/kWh 0.043g/kWh
NOx emissions factor (by volume of
power from thermal
power generation)(for KEPCO-
generated power)※10
0.086g/kWh 0.085g/kWh 0.077g/kWh 0.077g/kWh 0.074g/kWh
Developing and utilizing renewable
energy sources further
Contributing to the realization of low
carbon societies through overseas power
generation businesses
Limiting SF6 emissions(calender year
basis)(gas recovery rate upon
inspection/remival of equipment)
Maintaining sulfer oxide(SOx)emission
factors
Maintaining nitrogen oxide(NOx)
emission factors

<Environmental Data 2019> 22
Low carbon target
We announced the following environmental targets in the Kansai Electric Power Group Medium-term Management Plan (2019-2021).
Low carbon target in the Kansai Electric Power Group Medium Management Plan (2019-2021)
・ We will seek to achieve 600 million kW of renewable installed capacity by 2030s, of which more than 200 million kW will be newly developed in Japan and abroad.
・We will keep the top spot for the amount of CO2-free power generation in Japan, and halve CO2 emissions associated with power generation in Japan in FY2030 (compared to in FY2013) .

<Environmental Data 2019> 23
Biodiversity policy ①
Biodiversity Action Guidelines by the Japanese Electric Utility IndustryFrom the past, we have endeavored to minimize impacts on biodiversity and sustainably utilize the benefits derived from biodiversity in our electric power business. Now, we have established Biodiversity Action Guidelines by the Japanese Electric Utility Industry to clarify the direction of these efforts.Based on these guidelines, we seek to undertake sustainable business activities as we appreciate the benefits of nature.
Action Philosophy: As an electric company, we appreciate the benefits of nature and seek to undertake
sustainable business activities.I. Seek the supply of power that considers global scale environmental impacts, including global warming, which affects biodiversity① Recognize the importance of biodiversity and the benefits of nature, and consider the impacts of the installation
and operation of facilities on ecosystems and communities in Japan and abroad.② Strive to reduce CO2 emissions intensity by, for example, increasing the use of nuclear power and renewable
energy sources as well as improving the thermal efficiency .③ Strive to reduce emissions of greenhouse gases in facility construction, procurement, transportation, and the like.
II. Steadily implement environmental preservation measures that contribute to biodiversity while endeavoring in activities that contribute to society④ Appropriately identify and analyze impacts on biodiversity from business activities and strive to preserve
biodiversity.⑤ Strive to contribute to society through environmental preservation activities, including greening efforts that are
suitable to local characteristics.III. Work toward the formation of a recycling-oriented society that is conducive to biodiversity⑥ Continue 3R (reduce, reuse and recycle) activities, including the effective use of resources and the reduction of
final waste disposal, and strive for the preservation of biodiversity and sustainable use of resources.IV. Endeavor to use technologies and conduct research and development that contribute to biodiversity⑦ Promote the use of technologies and the conduct of research and development that contribute to the sustainable
use and preservation of biodiversity.V. Along with advancing coordination related to biodiversity with local communities, widely publicize and share information about efforts for biodiversity.⑧ Promote cooperation with local people, local governments, research institutes and other stakeholders.⑨ Work to publicize and share easy-to-understand information about business activities that consider biodiversity.
VI. Promote voluntary activities that deepen social awareness related to biodiversity⑩ Work toward making environmental education for employees.⑪ Contribute to increasing the awareness of society about biodiversity.
■Policies related to business activities that consider the conservation of biodiversity
At the Kansai Electric Power Company, as an electric company, we are advancing efforts based on the “Biodiversity Action Guidelines by the Japanese Electric Utility Industry” established by the Federation of Electric Power Companies of Japan. In addition, as the Kansai Electric Power Group, we also recognize the importance of biodiversity, and we are undertaking “business activities that consider preservation of biodiversity” as stipulated in our Environmental Action Policy. In the installation and alteration of power plants in areas with important biodiversity, we avoid and minimize impacts on the natural environment and biodiversity as well as investigate restoration through compensation as necessary in accordance with environmental impact assessment acts.

<Environmental Data 2019> 24
Biodiversity policy ②
Efforts for Biodiversity Action Guidelines by the Japanese Electric Utility Industry II-④As an effort in fiscal 2018, we conducted surveys of important biodiversity sites around power plants (nuclear, thermal, renewable energy and hydroelectric power) using the World Database on Protected Areas, and verified locations that qualify as natural protected areas (IUCN categories I–VI).
As a result, we confirmed that nine hydroelectric power plants in the Kurobe River
watershed are considered category II.In the area around the Kurobe Dam, we have already been undertaking protection
of native species, for example, to protect the natural environment. We will continue to advance sustained efforts for this purpose in the future.
Electric buses run along the Tateyama Kurobe Alpine Route that connects Nagano Prefecture and Toyama Prefecture. Along with not emitting exhaust gases, these vehicles rarely startle animals with their sound because they run extremely quietly.
Kurobe Dam, which is situated in a national park, receives one million visitors annually. At Ogizawa Station, which is the entrance to the Nagano Prefecture side, the seeds of plants that do not naturally grow in Kurobe sometimes get brought over on the soles of the shoes of tourists. Thus, seed removal mats have been placed at the station ticket gates to prevent the influx of non-native species. The removed seeds are collected with a vacuum cleaner and incinerated.
Seed-removing floor mat
■Protecting native species around Kurobe Dam

<Environmental Data 2019> 25
Biodiversity policy ③
Examples of specific efforts related to Biodiversity Action Guidelines by the Japanese Electric Utility Industry II-④
Environmental assessment procedures (for power plants)
National government (Ministry of Economy, Trade and Industry)
Business operatorResidents and local
governments
Screening
Scoping
Assessment
Draft Environmental
Impact Statement
Environmental Impact
Statement
Authorization
Decision
Assessment unnecessary
Assessment necessary
NotificationType 2 business
Type 1 business
Prefectural governor opinions
Resident opinions
Prefectural governor opinions
Public inspectionCreation of scoping documents
Selection of scoping documents
Review
Notification
Recommendation
Execution of assessment (Investigation, prediction and evaluation / Examination of environmental protection measures
Opinions by the Ministry of the Environment
Review Creation of draft environmental impact
statement
Notification
Recommendation
Public inspection
Resident opinions
Prefectural governor opinions
ReviewNotification
Decision notification / change orders
Creation of environmental impact
statement
Submission and public inspection Prefectural governor
and resident
review
Start of construction
Construction PlanApproval and change orders
Application and notification
Execution of environmental impact assessmentAn environmental impact assessment system estimates and evaluates impacts on the environment of business activities and investigates necessary countermeasures before the execution of large-scale development projects. In Japan, the system based on the Environmental Impact Assessment Law stipulates subject business survey items, procedure protocols, and other requirements.
In suitably implementing environmental impact assessment for power plant construction (including new and expansion) in the electric power business, along with utilizing the extensive knowledge that we had accumulated before the establishment of this law, we are, for example, listening to the opinions and recommendations of local residents, regional organizations and the national government. Furthermore, through environmental protection measures based on the opinions of experts and others, we are making efforts to minimize impacts on the natural environment and biodiversity as well as restore natural environments.

<Environmental Data 2019> 26
Biodiversity policy ④
Examples of specific efforts related to Biodiversity Action Guidelines by the Japanese Electric Utility Industry V-⑧
In order to make forests that are similar to nature at power plants in short amounts of time, we are trying to create environments that protect the original biodiversity of the region by selecting cultivated tree saplings that are suited to the region, and planting different species densely in close proximity.
Moreover, in order to maintain natural forests, as we look to the guidance of experts, we are undertaking continuous efforts to preserve biodiversity, including measures to further diversify species and eliminate invasive species.
Natural forest creation
In Toyooka City, Hyogo Prefecture, released oriental white storks, which are designated a Special Natural Treasure in Japan, sometimes make their nests on utility poles and steel towers. Not only are there concerns about accidents, but there are also fears that storks could be electrocuted. For these reasons, we patrol carefully, removing nests as quickly as possible and conducting measures to discourage them from coming near utility poles in cooperation with the University of Hyogo and the Hyogo Park of the Oriental White Stork. In these ways, we are both protecting the storks and maintaining the safety and stability of the power supply.
Protecting oriental white storks
Power lines with colored markers
Storks nesting on top of a utility pole
Oriental white storks being raised