entrepreneurial learning, the ipo decision, and the …
TRANSCRIPT
NBER WORKING PAPER SERIES
ENTREPRENEURIAL LEARNING, THE IPO DECISION, AND THE POST-IPODROP IN FIRM PROFITABILITY
Lubos PastorLucian Taylor
Pietro Veronesi
Working Paper 12792http://www.nber.org/papers/w12792
NATIONAL BUREAU OF ECONOMIC RESEARCH1050 Massachusetts Avenue
Cambridge, MA 02138December 2006
All authors are at the Graduate School of Business, University of Chicago. Pastor and Veronesi arealso affiliated with the CEPR and NBER. We thank Ray Ball, Doug Diamond, Michael Halling (discussant),John Heaton, Gene Kandel, Peter Kondor, and the audiences at the University of Chicago and the ViennaSymposia in Asset Management for helpful comments. The views expressed herein are those of theauthor(s) and do not necessarily reflect the views of the National Bureau of Economic Research.
© 2006 by Lubos Pastor, Lucian Taylor, and Pietro Veronesi. All rights reserved. Short sections oftext, not to exceed two paragraphs, may be quoted without explicit permission provided that full credit,including © notice, is given to the source.
Entrepreneurial Learning, the IPO Decision, and the Post-IPO Drop in Firm ProfitabilityLubos Pastor, Lucian Taylor, and Pietro VeronesiNBER Working Paper No. 12792December 2006JEL No. G1,G3
ABSTRACT
We develop a model in which an entrepreneur learns about the average profitability of a private firmbefore deciding whether to take the firm public. In this decision, the entrepreneur trades off diversificationbenefits of going public against benefits of private control. The model predicts that firm profitabilityshould decline after the IPO, on average, and that this decline should be larger for firms with morevolatile profitability and firms with less uncertain average profitability. These predictions are supportedempirically in a sample of 7,183 IPOs in the U.S. between 1975 and 2004.
Lubos PastorGraduate School of BusinessUniversity of Chicago5807 South Woodlawn AveChicago, IL 60637and [email protected]
Lucian TaylorGraduate School of BusinessUniversity of Chicago5807 S Woodlawn AveChicago, IL [email protected]
Pietro VeronesiGraduate School of BusinessUniversity of Chicago5807 South Woodlawn AvenueChicago, IL 60637and [email protected]
1. Introduction
The decision to go public is one of the most important decisions made by privately held firms.
This decision can have various motives, such as to diversify the entrepreneur’s holdings, to
raise capital for investment, to exploit favorable market conditions, to facilitate acquisitions,
to improve the liquidity of the firm’s shares, to find the firm’s market value, and to make the
firm more visible. One complicating factor in the IPO decision is that the private firm’s future
cash flow is highly uncertain. This uncertainty makes it difficult for both the entrepreneur
and the outside investors to value the private firm. We examine the effect of this uncertainty
on the decision to go public and on firm profitability around the IPO.
We develop a model of the optimal IPO decision in the presence of learning about average
profitability. In the model, the profitability of a private firm mean-reverts around an un-
known mean and agents learn about this mean by observing realized profits. There are two
types of risk-averse agents: investors, who are well diversified, and an entrepreneur, whose en-
tire wealth is tied up in the private firm. The entrepreneur suffers from under-diversification
but enjoys benefits of private control. If he takes his firm public, he forfeits the private
benefits but achieves better diversification by investing the IPO proceeds in publicly-traded
stocks and bonds. It is optimal for the entrepreneur to take his firm public when the market
value of the firm (value to investors) exceeds the private value of the firm (value to the
entrepreneur). We show that an IPO is more likely for firms with higher expected and cur-
rent profitability, more volatile profitability, more uncertain average profitability, and lower
benefits of private control.
In this model, it is optimal for an IPO to take place when the firm’s expected future
profitability is sufficiently high. The entrepreneur’s benefits of private control are derived
from assets in place rather than from future growth opportunities. The firm’s private value
is therefore less sensitive to expected future profitability than the firm’s market value is.
When expected profitability rises, the market value rises faster than the private value, and
when expected profitability rises high enough, it becomes optimal for the firm to be owned
publicly (by investors) rather than privately (by the entrepreneur).
The model predicts that firm profitability should drop after the IPO, on average, and
that this drop should be larger for firms with more volatile profitability and firms with less
uncertain average profitability. These predictions follow from the endogeneity of the IPO
and from learning. For an IPO to take place, the agents’ expected profitability must go up
before the IPO, as explained in the previous paragraph. According to Bayes’ rule, agents
revise their expectations upward only if they observe realized profitability that is higher than
1
expected. As a result, realized profitability exceeds expected future profitability at the time
of the IPO, and hence profitability is expected to drop after the IPO. The implications for
volatility and uncertainty also follow from the basic properties of Bayesian updating. These
results come through most clearly in the context of a toy model in Section 2.
To analyze the implications of our model, we calibrate the model and compute the ex-
pected post-IPO drop in profitability for a wide range of plausible parameter values, using
a closed-form solution for this expected drop. We incorporate the endogeneity of the IPO
by computing expectations conditional on an IPO being optimal. We also incorporate the
endogeneity of the private firm’s existence, recognizing that for some sets of parameter values
it is not optimal for the entrepreneur to start the private firm in the first place. The results
show that the basic intuition from the toy model applies to our richer model as well.
We test the model’s predictions empirically in a sample of 7,183 IPOs in the U.S. between
1975 and 2004. Our evidence supports the model. Firm profitability, measured as return
on equity (ROE), declines significantly after the IPO. The average decline in quarterly ROE
is 2.7% after one year and 4.3% after three years. A post-IPO decline in profitability has
already been reported by Degeorge and Zeckhauser (1993), Jain and Kini (1994), Mikkelson,
Partch, and Shah (1997), and Pagano, Panetta, and Zingales (1998) but our sample is much
larger.1 More important, we also find that the post-IPO decline is larger for stocks with
more volatile profitability and firms with less uncertain average profitability. These findings,
which do not seem to appear in the literature, are consistent with our model.
While the volatility of profitability can be estimated directly from realized profits, un-
certainty about average profitability is more difficult to measure. The common proxies for
uncertainty also proxy for volatility. To separate uncertainty from volatility, we estimate
the stock price reaction to earnings announcements, which should be stronger for firms with
higher uncertainty and lower volatility. We find that firms with weaker price reactions tend
to experience larger post-IPO drops in ROE, as predicted by the model.
The model also predicts that firm profitability increases before the IPO. We do not
test this prediction due to the lack of pre-IPO data, but supporting evidence is provided
by Degeorge and Zeckhauser (1993) who study 62 reverse LBOs that went public between
1983 and 1987. They find that profitability increases sharply before LBOs return to public
ownership and decreases thereafter, consistent with our model.
1Degeorge and Zeckhauser (1993) analyze 62 reverse leveraged buyouts (LBOs) in 1983–1987, Jain andKini (1994) study 682 IPOs in 1976–1988, Mikkelson, Partch, and Shah (1997) examine 283 IPOs in 1980–1983, and Pagano, Panetta, and Zingales (1998) investigate 69 Italian IPOs in 1982–1992.
2
Our model generates a rise and fall in profitability around the IPO without asymmetric
information. In contrast, many IPO models assume that the entrepreneur has private infor-
mation about her own firm (e.g., Chemmanur and Fulghieri, 1999). Asymmetric information
may well explain some of the observed post-IPO declines in profitability, but it is not clear
how it would generate higher declines for firms with more volatile profits and firms with less
uncertain average profits. Another possible explanation for the profitability pattern is earn-
ings management. Teoh, Welch and Wong (1998) argue that firms opportunistically inflate
their earnings through discretionary accruals shortly before going public. However, firms
that are willing to manipulate their earnings around the IPO are likely to manipulate them
after the IPO as well. Such firms are likely to smooth their post-IPO earnings, given the
apparent market preference for less volatile earnings.2 Therefore, the earnings management
hypothesis would seem to predict that the post-IPO decline in profitability should be larger
for firms with less volatile post-IPO earnings, but we find the opposite result.3
The key motive for an IPO in our model is diversification. This motive is empirically im-
portant according to Bodnaruk, Kandel, Massa, and Simonov (2006), who study all Swedish
IPOs in 1995–2001 and find that firms held by less diversified shareholders are more likely to
go public. In the model of Benninga, Helmantel, and Sarig (2005), the IPO decision is also
driven by the tradeoff between diversification benefits and private benefits, but there are
important differences between their paper and ours. First, the models are different: in their
model, there is no learning, the cash flow process is different (binomial with known up and
down probabilities), and so are the agents’ preferences. Second, Benninga et al do not ex-
amine post-IPO profitability, which is the subject of our analysis. Finally, their contribution
is theoretical whereas ours is both theoretical and empirical.
This paper is also related to the theory of “rational IPO waves” of Pastor and Veronesi
(2005). In their model, the entrepreneur observes time-varying market conditions before
deciding when to go public. IPO waves arise because many entrepreneurs find it optimal
to go public after market conditions improve (e.g., after the equity premium falls).4 Unlike
in that model, we hold market conditions constant, for simplicity, and focus instead on
learning about the private firm itself. In our model, unlike in theirs, observing the private
firm’s profits allows the agents to learn about the firm’s average future profitability. In their
model, the IPO proceeds are invested in the firm to start production, whereas in our model,
2For example, Graham, Harvey and Rajgopal (2005) survey 401 financial executives and find that morethan three quarters of them would give up economic value in exchange for smooth earnings.
3Ball and Shivakumar (2006) argue that the evidence of Teoh et al is unreliable and that IPO firmsactually supply more conservative and higher-quality financial reports than other firms.
4Consistent with this argument, CFOs identify overall stock market conditions as “the single most im-portant determinant of timing” of an IPO in Brau and Fawcett’s (2006) survey.
3
they are invested in stocks and bonds for diversification reasons. Finally, while they focus
on optimal IPO timing, we focus on the dynamics of profitability around the IPO.
The paper is organized as follows. Section 2. presents a toy model that illustrates how
learning affects the post-IPO dynamics of profitability. Section 3. develops the full model.
Section 4. analyzes the dynamics of profitability implied by the full model, with a focus on
the expected post-IPO drop in profitability. Section 5. presents an empirical test of the main
implications of the model. Section 6. concludes. All proofs are in the Appendix.
2. A Toy Model
In this section, we present a simple model that illustrates the effect of learning on the behavior
of profitability after an IPO. There are two periods, 0 and 1, in which an entrepreneur decides
whether to take his private firm public. This decision is made based on a cutoff rule: an IPO
takes place if the firm’s expected profitability exceeds a given cutoff. (This type of rule is
shown to be optimal in the full model in Section 3.) Let ρ denote the cutoff, which is known,
and ρ denote the firm’s average profitability, which is unknown.
At time 0, the entrepreneur’s prior beliefs about ρ are given by the normal distribution,
ρ ∼ N(ρ0, σ
20
). (1)
At time 1, the entrepreneur observes a signal about average profitability ρ, namely realized
profitability ρ, whose distribution conditional on ρ is given by
ρ ∼ N(ρ, σ2
ρ
). (2)
Result 1. Firm profitability is expected to fall after an IPO at time 1.
To prove this result, we first compute the entrepreneur’s posterior beliefs after observing
the signal. Using Bayes’ rule, the posterior distribution of ρ is given by
ρ | ρ ∼ N(ρ, σ2
), (3)
whereρ = w0ρ0 + (1 − w0)ρ (4)
w0 =1/σ2
0
1/σ20 + 1/σ2
ρ
. (5)
An IPO takes place at time 1 if expected profitability exceeds the cutoff ρ:
ρ > ρ . (6)
4
Since the IPO takes place at time 1, there is no IPO at time 0, so that
ρ0 < ρ . (7)
Combining equations (6) and (7), we have ρ > ρ0. It then follows from equation (4) that
ρ > ρ . (8)
In words, for an IPO to take place at time 1, realized profitability ρ must exceed expected
future profitability ρ. As a result, the post-IPO profitability is expected to be lower than ρ.
At time 0, the expected post-IPO drop in profitability is E0(ρ − ρ | IPO at time 1) > 0.
To simplify the algebraic exposition, add the assumption that ρ0 = 0.
Result 2. The post-IPO drop in profitability is expected to be large when the volatility of
profitability (σρ) is high and when prior uncertainty about average profitability (σ0) is low.
To prove this result, rewrite equation (4) as
ρ − ρ = w0 (ρ − ρ0) . (9)
The assumption ρ0 = 0 implies ρ > 0, so the expected percentage drop in profitability is
E0
(ρ − ρ
ρ| IPO at time 1
)= w0. (10)
From equation (5), w0 increases with σρ and decreases with σ0. As a result, the expected
percentage drop in profitability after the IPO is high when profitability is highly volatile and
when there is low uncertainty about average profitability.
The intuition behind both results is simple. For an IPO to take place at time 1, expected
profitability must go up between times 0 and 1, so realized profitability at time 1 must exceed
expected profitability to “pull it up” via Bayesian updating. Since realized profitability
exceeds expected profitability at the IPO, profitability is expected to fall after the IPO
(Result 1). If volatility is higher, realized profitability is a less precise signal, so it must rise
by more to pull expected profitability above the IPO cutoff. Similarly, if uncertainty is lower,
realized profitability must rise by more to overcome stronger prior beliefs. In both cases, the
gap between realized and expected profitability widens, so the post-IPO drop in profitability
is larger (Result 2). This intuition applies not only to the percentage drop but also to the
absolute drop in profitability. Note that our arguments rely only on the endogeneity of the
IPO decision (equation (6)), the endogeneity of the private firm’s existence before the IPO
(equation (7)), and Bayesian updating (equation (3)).
5
In the next section, we develop a richer model with more realistic dynamics for prof-
itability and additional assumptions about agent preferences and investment opportunities.
In that model, we show that a version of the IPO rule in equation (6) is optimal, with
an endogenous cutoff ρ that depends on uncertainty and volatility. The endogeneity of ρ
complicates the analysis, but we show that Results 1 and 2 hold also in the full model for
plausible parameter values. For the reader’s convenience, the full model uses some of the
same notation as the toy model to denote the same concepts, but none of the above equations
apply outside of Section 2.
3. The Full Model
We consider an economy with two types of agents, investors and an entrepreneur. The agents
can invest in two assets, risky public equity (“stocks”) and a risk-free bond (“bonds”). A
third asset, risky private equity, can be created by the entrepreneur at time 0.
At time 0, investors are endowed with a large amount of stocks and bonds. The en-
trepreneur is endowed with a patent-protected technology and the initial wealth W0. To pro-
duce a stream of profits, the technology requires an initial lump-sum investment of B0 = W0.
The entrepreneur has three choices at time 0: start a private firm that implements the tech-
nology, sell the patent, or discard the patent. If the entrepreneur chooses to start a firm,
he invests his wealth in the technology and begins producing. He also acquires an option to
take the firm public at a future time τ , 0 < τ < T . We assume that τ is exogenously given,
for simplicity, and that this is the only time when an IPO can take place. If the entrepreneur
chooses to go public at time τ , he sells the firm to investors for its fair market value.5 The
entrepreneur’s decisions at times 0 and τ are irreversible.
The firm owning the patent-protected technology uses capital Bt to produce earnings at
the rate Yt. The firm’s profitability ρt = Yt/Bt follows the mean-reverting process
dρt = φ (ρ − ρt) dt + σρ,1dX1,t + σρ,2dX2,t, 0 ≤ t ≤ T, (11)
where ρ denotes average profitability, φ denotes the speed of mean reversion, and X1,t and
X2,t are uncorrelated Brownian motions that capture systematic (X1,t) and firm-specific
(X2,t) shocks to firm profitability.6 The firm reinvests all of its earnings. The patent expires
at time T , at which point the firm’s market value equals the book value, MT = BT .7
5In reality, the entrepreneur often retains a substantial part of equity after an IPO. Assuming that theentrepreneur sells the whole firm simplifies both the calculations and the exposition. We believe that noneof our qualitative results would change if we allowed the entrepreneur to retain some equity.
6Empirically, firm profitability is mean-reverting, e.g., Beaver (1970) and Fama and French (2000).7See Pastor and Veronesi (2003) for a more detailed justification of the terminal value assumption.
6
Both the entrepreneur and investors are fully rational utility-maximizing agents. Investor
preferences are characterized by a pricing kernel πt, which follows the stochastic process
dπt
πt= −rdt − σπ,1dX1, (12)
where r is the risk-free rate and dX1 is perfectly correlated with the return on public equity.
The entrepreneur’s preferences at time t are given by
max Et
[∫ T
te−β(u−t) c1−γ
u
1 − γdu + ηe−β(T−t)W
1−γT
1 − γ
](13)
where cu denotes consumption, γ > 1 is the local curvature of the utility function, β is the
intertemporal discount, η is a constant, and WT is the entrepreneur’s terminal wealth. For
simplicity, we assume that the entrepreneur retires at time T (when the patent expires).
As long as the entrepreneur owns the private firm, he consumes benefits of private control.
These benefits include any costs saved by a firm that is not publicly traded (e.g., the costs
of separating ownership from control, reporting costs, administrative costs, auditing costs,
etc.) as well as benefits commonly referred to as private benefits of control (e.g., Dyck and
Zingales, 2004). We distinguish benefits of private control from private benefits of control
because the latter benefits can be consumed not only by entrepreneurs but also by managers
of publicly traded firms. There are no benefits of private control if the firm is owned by
(disperse) investors. For simplicity, we assume that the consumption flow from benefits of
private control is proportional to the size of the firm as measured by assets in place,
ct = αBt, (14)
and that the entrepreneur consumes nothing else while managing the private firm. The
entrepreneur cannot alter this consumption path by borrowing or lending.8
There is no asymmetric information. Average profitability ρ in equation (11) is unknown
to all agents, investors and entrepreneurs alike. All other parameters are known. Agent
beliefs about ρ at time t = 0 are represented by the normal prior distribution,
ρ ∼ N(ρ0, σ
20
). (15)
All agents observe realized profitability ρt as well as πt and they update their beliefs about
ρ dynamically following Bayes’ rule.
Under the assumptions detailed above, we solve for the following:
8Allowing limited borrowing and lending would not alter our basic intuition (and hence the conclusions)but it would significantly complicate the calculations.
7
(a) The dynamics of the agents’ beliefs about ρ (Section 3.1.)
(b) The value of the firm to investors (Section 3.2.)
(c) The value of the firm to the entrepreneur (Section 3.3.)
(d) The conditions under which the entrepreneur finds it optimal to take the firm public
at time τ (Section 3.4.)
(e) The conditions under which the entrepreneur finds it optimal to start a private firm at
time 0 (Section 3.5.)
(f) The dynamics of firm profitability after the IPO (Section 4.)
3.1. Learning
Following standard results on Bayesian updating in continuous time, the agents’ posterior
beliefs about average profitability ρ at time t are summarized by the normal distribution,
ρ ∼ N(ρt, σ
2t
), (16)
where the posterior mean and variance evolve over time according to
dρt = σ2t
φ
σρ,2dX2,t (17)
σ2t =
1
1σ20
+(
φσρ,2
)2t, (18)
and dX2,t is a Brownian motion defined as the normalized expectation error of the idiosyn-
cratic shock. See Lemma 1 of Pastor and Veronesi (2003).
3.2. Value of the Firm to Investors (“Market Value”)
The outside investors value the firm as the present value of the terminal payoff BT . Given
the investors’ preferences, the market value of the firm at any time t is given by Mt =
Et [πTBT ]/πt, where πt follows the process in equation (12) and Bt follows the process
dBt = ρtBtdt. (19)
Our assumptions allow us to obtain a closed-form solution for the firm’s market value:
Mt = Bt eQ0(T−t)+Q1(T−t)ρt+Q2(T−t)ρt+12Q2(T−t)2σ2
t , (20)
where the functions of time Q0 (s), Q1 (s), Q2 (s), and Q3 (s) are given in the Appendix.
This result corresponds to Proposition 2 of Pastor and Veronesi (2003). At this point, the
overlap with Pastor and Veronesi (2003) ends.
8
3.3. Value of the Firm to the Entrepreneur
At time τ , the entrepreneur must decide whether to take his private firm public. This deci-
sion is made by comparing two utility values:
1. The utility resulting from selling the firm in an IPO at time τ and investing the pro-
ceeds in stocks and bonds until time T
2. The utility resulting from owning the firm between times τ and T
We compute the two utility values in Sections 3.3.1. and 3.3.2., respectively.
3.3.1. Utility Value of Selling the Firm in an IPO
If the entrepreneur sells the firm at time τ , he receives the fair market value Mτ given
in equation (20) and invests Mτ in publicly-traded stocks and bonds. To compute the
utility value of selling the firm, we first compute the utility value of any generic amount
of wealth Wt under the assumption that this wealth is invested in stocks and bonds. This
task is made simple by the fact that we have complete markets, in which the stock and
bond investment opportunities are captured by the state price density πt in equation (12).
Cox and Huang (1989) show that the dynamic maximization problem of an agent deciding
between consumption and investment at time t can be written in a static form as
maxc,WT
Et
[∫ T
te−β(u−t) c1−γ
u
1 − γdu + ηe−β(T−t)W
1−γT
1 − γ
]
subject to the static budget constraint
Et
[∫ T
t
πu
πtcudu +
πT
πtWT
]≤ Wt.
The optimal consumption stream and final wealth are given by
cu =(
πu
πt
)− 1γ
λ− 1γ e−
βγ
(u−t) and WT =(
πT
πt
)− 1γ
λ− 1γ η
1γ e−
βγ
(T−t),
where λ is the constant Lagrange multiplier from the maximization problem. The resulting
value function for the intertemporal utility is given in the following proposition.
Proposition 1: Let Wt denote the entrepreneur’s financial wealth, which can be allocated
to stocks or bonds in any proportions. The value function from optimal investment is
V (Wt, t) = maxEt
[∫ T
te−β(u−t) c1−γ
u
1 − γdu + ηe−β(T−t)W
1−γT
1 − γ|Wt
]
=W 1−γ
t
1 − γ
(1 + η
1γ 1−γ
γ
(r − β
1−γ+ 1
21γσ2
π,1
))e
1−γγ (r− β
1−γ+ 1
21γ
σ2π,1)(T−t) − 1
1−γγ
(r − β
1−γ+ 1
21γσ2
π,1
)
γ
(21)
Thus, selling the firm at time τ gives the entrepreneur utility equal to V (Mτ , τ ).
9
3.3.2. Utility Value of Keeping the Firm Private
If the entrepreneur decides not to go public at time τ , he will continue consuming benefits of
private control and his final wealth will be equal to BT . Thus, according to equations (13)
and (14), his utility is given by
V O (Bτ , τ ) = Eτ
[∫ T
τe−β(u−τ) (αBu)
1−γ
1 − γdu + ηe−β(T−τ) B
1−γT
1 − γ
].
This utility is characterized explicitly in the following proposition.
Proposition 2: The utility from owning the firm from time τ to time T is given by
V O (Bτ , τ ) =B1−γ
τ
1 − γ
{α1−γ
∫ T
τZO
(ρτ , ρτ , σ
2τ ;u − τ
)du + ηZO
(ρτ , ρτ , σ
2τ ;T − τ
)}, (22)
where the function ZO is given in the Appendix.
3.4. The IPO Decision
The IPO decision reflects the tradeoff between diversification benefits of going public and
benefits of private control. The entrepreneur will sell the firm at time τ if the utility from
investing the IPO proceeds in stocks and bonds is higher than the utility from continuing to
run the firm and consume private benefits. The entrepreneur will go public if and only if
V (Mτ , τ ) > V O (Bτ , τ ) , (23)
where V (Mτ , τ ) is given in Proposition 1 and V O (Bτ , τ ) is given in Proposition 2. Let
Pτ = V −1(V O (Bτ , τ ) , τ
)(24)
define the firm’s “private value” at time τ . (The entrepreneur is indifferent between owning
the private firm and having Pτ dollars optimally invested in stocks and bonds.) We can then
restate condition (23) as Mτ > Pτ . That is, an IPO takes place if and only if the firm’s
market value exceeds the private value.
Proposition 3: An IPO takes place at time τ if and only if
f (T − τ, στ , σρ) < α1−γ∫ T
τZ (ρτ , ρτ , στ , σρ;u − τ ;T )du, (25)
where f (T − τ, στ , σρ) and Z (ρτ , ρτ , στ , σρ;u − τ ;T ) are functions given in the Appendix.
Note that f is decreasing in both στ and σρ,2, Z is increasing in both ρτ and ρτ , and Z > 0.
10
Corollary 1: An IPO at time τ is more likely when
(a) benefits of private control, α, are lower
(b) uncertainty about average profitability, στ , is higher
(c) the idiosyncratic component of the volatility of profitability, σρ,2, is higher
(d) current and/or expected profitability, ρτ and ρτ , are higher
Part (a) follows immediately from the fact that private benefits can be consumed by the
entrepreneur but not by the disperse group of investors. Mathematically, the right-hand side
of (25) decreases with α but the left-hand side does not depend on α.
The intuition behind parts (b) and (c) is also simple. If the firm is privately owned, higher
uncertainty στ or idiosyncratic volatility σρ,2 make the entrepreneur’s future consumption
more volatile. The risk-averse entrepreneur dislikes this volatility because he is not diversified
(formally, V O is decreasing in both στ and σρ,2), and the only way he can diversify is by
selling the firm in an IPO. Since investors are well diversified, they are in a better position to
bear the risk associated with the private firm’s cash flow process. (The firm can be thought of
as small relative to the investors’ other holdings since πt in equation (12) does not depend on
στ or σρ,2.) In fact, if the firm is publicly owned, its market value in equation (20) increases
with both uncertainty and idiosyncratic volatility, due to the convexity effect discussed in
Pastor and Veronesi (2003, 2006). In short, parts (b) and (c) follow because the entrepreneur
dislikes uncertainty and idiosyncratic volatility but investors don’t.
For most plausible parameter values, part (c) holds not only for idiosyncratic volatility
σρ,2 but also for total volatility σρσ′ρ = σ2
ρ,1 + σ2ρ,2. When σρ,2 increases, the left-hand side
of (23) increases while the right-hand side decreases, making an IPO more likely. When
σρ,1 increases, both sides of (23) tend to decrease because systematic volatility generally
reduces market value. The right-hand side typically decreases by more, so an IPO is usually
more likely also after σρ,1 increases. Combining the effects of σρ,1 and σρ,2, we find for most
parameter values that an IPO is more likely when total volatility σρσ′ρ is higher.
Although the right-hand side of (25) is always positive, the left-hand side becomes nega-
tive when uncertainty and/or volatility are sufficiently high. That is, for any α, there exist
levels of uncertainty and volatility above which an IPO always takes place.
Part (d) follows from the fact that the right-hand side of (25) is increasing in both ρτ
and ρτ (because ∂Z/∂ρτ > 0 and ∂Z/∂ρτ > 0) while the left-hand side is independent
of both quantities. Put differently, the market value of the firm increases with ρτ and ρτ
more rapidly than the private value does. The effect of expected future profitability, ρτ , is
11
stronger and easier to explain. Recall from equation (14) that benefits of private control are
derived from assets in place (Bt) rather than from future growth opportunities. The firm’s
private value is therefore less sensitive to ρτ than the firm’s (more forward-looking) market
value is. Increases in ρτ push up the private value (because Bt grows at the rate of ρt) but
they push up the market value even more. Therefore, higher ρτ makes an IPO more likely:
The entrepreneur becomes more willing to forego private benefits in exchange for financial
wealth, because doing so moves him to a more valuable consumption path.
The new consumption path is more valuable in part because it is smoother over the
entrepreneur’s lifetime. When ρτ increases, the entrepreneur expects higher consumption in
the future. He wants to smooth his consumption by consuming more today but he cannot;
his consumption is given by private benefits in equation (14). If ρτ is sufficiently high, the
entrepreneur’s consumption path under private ownership becomes so unattractively steep
that he finds it optimal to sell the firm. After cashing out in an IPO, the entrepreneur can
smooth his consumption by trading stocks and bonds.
3.4.1. The Endogenous Cutoff Rule for an IPO
Next, we modify the condition in Proposition 3 to obtain an equivalent condition that resem-
bles the cutoff rule in the toy model in Section 2. Define ‘excess profitability’ as xτ = ρτ − ρτ .
The condition (25) can be restated in terms of xτ as follows:
f (T − τ, στ , σρ) < h (xτ , ρτ ) ≡ α1−γ∫ T
τZ(xτ , ρτ , σ
2τ , u − τ, T
)du, (26)
where Z (xτ , ρτ , στ , σρ, u − τ, T ) is a function similar to Z (see Appendix). We show in
the Appendix that h (xτ , ρτ ) is monotonically increasing in xτ and ρτ . Assuming that
f (T − τ, στ , σρ) is sufficiently large, we can define the cutoff ρ (xτ ; στ , σρ) such that
h(xτ , ρ (xτ ; στ , σρ)
)= f (T − τ, στ , σρ) .
If f (T − τ, στ , σρ) is too low for such a cutoff to exist, we set ρ (xτ ; στ , σρ) = −∞.
Corollary 2: An IPO takes place at time τ if and only if
ρτ > ρ (xτ ; στ , σρ) . (27)
In words, an IPO takes place if expected profitability is sufficiently high. This rule is similar
to the cutoff rule assumed in the toy model in Section 2. except that the cutoff ρ (xτ ; στ , σρ)
here is endogenous: it depends on the model parameters including uncertainty and volatility,
and it is also decreasing in xτ . (If the current excess profitability xτ is high, the expected
12
long-run profitability ρτ need not be as high for an IPO to occur.) The intuition behind
Corollary 2 is the same as that behind Corollary 1(d). When ρτ rises, the market value rises
faster than the private value because the former value is more sensitive to ρτ . When ρτ rises
sufficiently, it becomes optimal for the firm to be owned publicly rather than privately.9
In Section 4., we use Corollary 2 to compute the expected drop in profitability after an
IPO, or Et
[xτ |ρτ > ρ (xτ ; στ , σρ)
]. But first, we step back to time 0. Having characterized
the optimal decision at time τ , we can solve for the optimal decision at time 0.
3.5. The Decision to Start a Private Firm
In this section, we solve for the conditions under which the entrepreneur finds it optimal to
start a private firm at time 0. These conditions restrict the parameter space, allowing us to
incorporate the endogeneity of the private firm’s existence in the following section.
At time t = 0, the entrepreneur has three choices:
(A) Start a private firm. (Invest W0 in the technology to start production, keep the firm.)
(B) Sell the patent to investors. (Invest W0 in the technology to start production, sell it
to investors for its fair market value M0, invest M0 in stocks and bonds.)
(C) Discard the patent. (Invest W0 in stocks and bonds.)
The entrepreneur makes a utility-maximizing choice between (A), (B), and (C). Under
choice (C), his expected utility is V (B0, 0), where V is given in Proposition 1 (recall that
B0 = W0). Under choice (B), his utility is V (M0, 0), where M0 comes from equation (20).
Under choice (A), his expected utility, which we denote by V O0 (B0, 0), is given by
V O0 (B0, 0) = E0
[∫ T
0e−βt c1−γ
t
1 − γdt + ηe−βT W 1−γ
T
1 − γ
](28)
= E0
[∫ τ
0e−βt (αBt)
1−γ
1 − γdt
]+ e−βτE0
[V (Mτ , τ ) |ρτ > ρ
]Pr(ρτ > ρ
)
+ e−βτE0
[V O (Bτ , τ ) |ρτ < ρ
]Pr(ρτ < ρ
),
where “Pr” stands for “probability” as of time 0. There are three terms on the right-hand
side. The first term reflects the benefits of private control that the entrepreneur consumes
while running the firm between times 0 and τ . The second term is the present value of
9Ours is unlikely to be the only mechanism that can deliver a cutoff rule for an IPO. For example, considera model a la Leland and Pyle (1977) in which an entrepreneur seeking IPO financing must signal high effortto outside investors. It seems plausible for high average profitability to serve as a signal of high effort,which could make an IPO optimal if average profitability exceeds a cutoff. Our primary interest is in theimplications of the cutoff rule, however this rule is rationalized, for firm profitability around the IPO.
13
expected utility conditional on an IPO taking place at time τ , which happens if and only if
ρτ > ρ (see Corollary 2). Recall that in an IPO, the entrepreneur sells the firm to investors
for Mτ and invests the proceeds in stocks and bonds. The third term is the utility obtained
if no IPO takes place, in which case the entrepreneur remains non-diversified after time
τ but continues enjoying private benefits until time T . The calculation of V O0 (B0, 0) in
equation (28) is challenging, but we have obtained a closed-form solution. Since the formula
for V O0 (B0, 0) takes up a full page of text, we relegate it to the Appendix.
The necessary and sufficient condition for (A) to be the optimal choice is
V O0 (B0, 0) > max {V (M0, 0) , V (B0, 0)} . (29)
This is the condition that we impose in the calibration. Due to the complicated formula for
V O0 (B0, 0), this condition is not transparent. To gain more insight into the decision at time
0, we examine a simpler sufficient condition for (A) to be the optimal choice:
V O (B0, 0) > max {V (M0, 0) , V (B0, 0)} . (30)
This condition is identical to condition (29) except that V O0 (B0, 0) is replaced by V O (B0, 0).
The left-hand side of condition (30) is the entrepreneur’s expected utility from running
the private firm between times 0 and T . If the inequality (30) holds, then choice (A) is
superior to both (B) and (C) even without taking into account the value of the entrepreneur’s
option to sell the firm at time τ . This option makes choice (A) more attractive, so that
V O0 (B0, 0) > V O (B0, 0), making condition (30) sufficient but not necessary. We do not use
condition (30) for anything other than providing intuition through the following corollary.
Corollary 3: Condition (30) is more likely to be satisfied if
(a) benefits of private control, α, are higher
(b) uncertainty about average profitability, σ0, is lower
(c) the idiosyncratic component of the volatility of profitability, σρ,2, is lower
The entrepreneur is more likely to start a private firm if benefits of private control are larger
and if the cash flow stream is more stable. The intuition is similar to that behind Corollary 1.
When private benefits increase, private value increases relative to market value because these
benefits can be consumed by the entrepreneur but not by the outside investors. Private value
also increases relative to market value when uncertainty and volatility decrease, because the
entrepreneur is not diversified whereas the investors are. However, the negative effects of
uncertainty and volatility are likely to be mitigated by the fact that uncertainty and volatility
increase the value of the IPO option that is omitted from condition (30).
14
4. Profitability Dynamics Around an IPO
In this section, we analyze the evolution of profitability around an IPO. Without conditioning
on an IPO, profitability ρt follows the simple mean-reverting process in equation (11) and
expected profitability ρt follows the martingale process in equation (17). Conditioning on
an IPO changes the dynamics of ρt and ρt in an interesting way, as we show below.
4.1. Endogeneity of an IPO
To analyze the profitability dynamics around an IPO, we simulate many paths of shocks from
the model, and then we average the profitability paths across those simulations in which it
is optimal for an IPO to take place. Such an approach produces the model-implied expected
pattern in profitability while incorporating the endogeneity of the IPO decision.
Table 1 reports the baseline parameter values used in the simulations. The parameters
for the profitability process (σρ,1, σρ,2, and φ) are taken from Pastor and Veronesi (2003) who
estimate them from the return on equity data of all U.S. public firms in 1962–2000. We also
choose the same risk-free rate r = 0.03 per year, the same pricing kernel volatility σπ = 0.6,
and the same horizon T = 15 years as Pastor and Veronesi. These authors report the grand
median of profitability of 0.11 per year for public firms. For a typical private firm, the
average profitability ρ should be lower than 0.11 because only private firms whose average
profitability is perceived to be sufficiently high go public in the model. Therefore, we choose
a lower prior mean of ρ, ρ0 = 0.07. We set the prior uncertainty equal to σ0 = 0.05, so the
two-standard-deviation prior bounds for ρ are −0.03 and 0.17 per year. We pick τ = 5 years,
which is close to the median age of IPO firms in the 1990s (Loughran and Ritter, 2004). We
choose risk aversion γ = 2 and the subjective discount rate β = 0.03. We consider two values
of initial profitability, ρ0 = ρ0 = 0.07 and ρ0 = 0. The latter choice is motivated by the fact
that private firms typically do not produce any profits when they are started. Measuring the
benefits of private control is difficult. We choose α = 0.10, a round number.10 Later on, we
analyze the sensitivity of our results to α and we also average across many plausible values
of α when analyzing the expected post-IPO drop in profitability.
We conduct simulations as follows. First, we draw ρ from its prior distribution in equa-
tion (15). Starting from ρ0, we simulate the realizations of ρt between times 0 and T by
discretizing the process (11) and randomly drawing the Brownian shocks dX1,t and dX2,t.
Analogously, we simulate the realizations of the pricing kernel πt from the process (12).
Given the series of ρt and πt, we compute the dynamics of the posterior beliefs from equa-
10Benninga et al (2005) use a range of private benefits centered on 10% of cash flow in their simulations.
15

tions (17) and (18). We then check whether the IPO condition (23) is satisfied at time τ . If
it is, we keep the simulated path; otherwise we discard it. We repeat this procedure until
we generate 10,000 simulated paths for which an IPO occurred at time τ .
Figure 1 plots the average paths of realized profitability (ρt; solid line) and expected
profitability (ρt; dashed line), where the averages are computed across the 10,000 simulations
in which an IPO takes place at time τ = 5. Given the large number of simulations, these
paths represent the expected patterns in ρt and ρt conditional on an IPO. In Panel A, the
initial profitability ρ0 = ρ0; in Panel B, ρ0 = 0. In both panels, the figure shows that realized
profitability ρt rises sharply before the IPO and declines after the IPO, on average. Expected
profitability ρt also rises before the IPO but it remains flat after the IPO.
To understand the pattern in expected profitability, ρt, recall from Corollary 2 that in
order for an IPO to take place at time τ , ρτ must exceed a cutoff: ρτ > ρ. Ex ante, ρt
is a martingale (equation (17)), but the ex-post conditioning on ρτ > ρ implies that ρt is
expected to increase before the IPO. Indeed, in Figure 1, ρt rises from 0.07 to almost 0.09
between times 0 and τ . After the IPO, there is no more conditioning on an ex post event,
so ρt is constant in expectation due to its martingale property.
The pattern in realized profitability, ρt, is also intuitive. As discussed above, expected
profitability ρt increases before the IPO, on average. In a rational model of learning, an
expectation is revised upward only if the realization is higher than expected. To cause
upward revisions in ρt, realized profitability must rise faster than expected under its mean-
reverting process. This is why ρt rises so sharply before the IPO.
Why does ρt typically fall after the IPO? We answer in two steps: first, we explain why
it is likely that ρτ > ρτ , and second, why ρτ > ρτ implies a post-IPO decline in ρt. First,
as argued above, ρt must rise before the IPO to cause upward revisions in ρt so that ρτ
can exceed the IPO cutoff. When ρ0 = ρ0 (Panel A), realized profitability must rise above
expected profitability in order to “pull it up” via Bayesian updating, making ρτ > ρτ very
likely. When ρ0 = 0 (Panel B), ρt must rise faster than expected given its rate of mean
reversion. Given the parameter values in Table 1, ρt rises so fast that it “catches up” with
ρt (i.e., ρt = ρt) before time τ . After that point, the only way for ρt to pull ρt higher toward
the cutoff is for ρt to rise above ρt. Again, ρτ > ρτ seems likely. Second, ρτ > ρτ means that
ρτ exceeds its expected long-run mean, ρτ , at the time of the IPO. Since ρt has no expected
drift after the IPO, ρτ > ρτ implies that ρt is expected to fall after the IPO.
Note that the same basic pattern in ρt can obtain even in the absence of learning, simply
16
as a result of mean reversion in profitability and the endogeneity of the IPO decision.11 The
case of no learning is a special case of our framework in which average profitability ρ is a
known constant, so that ρt = ρ and σt = 0 for all t. In that case, it is useful to restate the
condition (26) in terms of ρτ . Since h (xτ , ρτ ) is monotonically increasing in xτ , there exists
a cutoff ρ (ρ) such that an IPO takes place at time τ if and only if ρτ exceeds this cutoff:
ρτ > ρ (ρ) . (31)
For many plausible parameter values, this cutoff is larger than ρ0, ρ > ρ0, which implies that
ρt must rise between times 0 and τ to exceed ρ. Whether ρt falls after the IPO is not clear
but for many parameter values it does. If ρ > ρ then ρt is almost guaranteed to fall after
the IPO in the long run because its value at the IPO exceeds its long-run mean: ρτ > ρ > ρ.
Even if ρ is smaller than ρ but not much smaller, ρt will fall after the IPO, on average.
Also note that if we average ρt and ρt across the simulations in which no IPO takes place
at time τ , the resulting patterns are opposite to those in Figure 1: ρt falls before time τ and
stays constant after time τ , on average, and ρt also falls before time τ but rises slowly after
time τ , mean-reverting toward the higher value of ρt.
We also examine the sensitivity of the profitability pattern to changes in the baseline
parameters from Table 1. We change one parameter at a time, rerun the simulations, compute
averages across the simulations in which an IPO took place, and plot the resulting average
paths of ρt in Figure 2. For comparison, the solid line plots the baseline case, already
described in Figure 1. The dash-dot line plots ρt for a higher value of private benefits,
α = 0.11. The pattern in realized profitability is more pronounced than in the baseline case:
a steeper pre-IPO increase in ρt is followed by a larger post-IPO decrease. As α increases,
the private value of the firm increases but the market value does not, so the entrepreneur
becomes less willing to sell the firm in an IPO (see Corollary 1). To induce the entrepreneur
to sell, ρt must rise by more than in the baseline case because it must exceed a higher hurdle
in Corollary 2. A larger increase in ρt can only be induced by a larger increase in ρt, hence ρt
rises by more than in the baseline case. Given the basic properties of Bayesian updating, the
pre-IPO increase in ρt must also be larger than the pre-IPO increase in ρt, so the post-IPO
decline in ρt (toward its long-run mean ρt) is steeper.
The dotted line plots ρt for a lower value of prior uncertainty, σ0 = 0.04. The post-IPO
fall in ρt is slightly larger than in the baseline case. This result is driven by learning: when
uncertainty is lower, prior beliefs about ρ are stronger, so ρt must rise higher relative to ρt in
11Similar mean-reversion arguments have been proposed by Degeorge and Zeckhauser (1993) for reverseLBOs and by Li, Livdan, and Zhang (2006) for SEOs. Mean reversion does not have the same predictionsas learning, e.g., it does not predict a larger post-IPO drop in ROE for firms with lower uncertainty.
17
order to pull ρt above any given IPO cutoff. One complication is that this cutoff endogenously
depends on uncertainty. Lower uncertainty makes private ownership more valuable to the
entrepreneur (Corollary 1), which raises the IPO cutoff for ρt. The higher cutoff typically
amplifies the post-IPO drop in profitability.12
The dashed line plots ρt for more volatile profitability, which we obtain by increasing
both σρ,1 and σρ,2 to 0.065. The rise and fall in ρt are steeper than in the baseline case. The
main reason for this result is learning: higher volatility makes ρt a less precise signal about
ρ, so ρt must rise higher relative to ρt in order to pull ρt above a given IPO cutoff. We also
recognize that this cutoff endogenously depends on volatility. When σρ,2 increases, the firm’s
private value is reduced relative to its market value, making an IPO more attractive, thus
reducing the IPO cutoff. The cutoff also depends on σρ,1, but this dependence is ambiguous.
Overall, the dependence of the cutoff on volatility typically weakens the tent-shape pattern
in ρt around the IPO. In subsequent analysis, we work with total volatility of profitability,
in part because the empirical separation of σρ,1 from σρ,2 is difficult and in part because the
theoretical effect of σρ,1 on the IPO decision is ambiguous.
4.2. Endogeneity of the Private Firm’s Existence
In Section 4.1., we analyze IPO profitability for plausible sets of parameter values. Some
parameter sets are inadmissible, though, because the condition (29) is not satisfied, meaning
that it is not optimal to start a private firm at time 0. For example, it is optimal to start the
private firm for the parameters in Panels A of Figures 1 and 2, but not for the parameters in
Panels B (where it is optimal to discard the patent at time 0). This consideration can affect
the expected post-IPO drop in profitability. For example, Figure 2 shows that this drop is
lower if private benefits are lower. However, if private benefits are too low, it is not optimal
for the entrepreneur to start a private firm at time 0. Therefore, private firms characterized
by very low benefits of private control do not exist, and the fact that the post-IPO drop
would be low for such firms is nothing more than an intellectual curiosity.
In this section, we account for the endogeneity of the private firm’s existence by averaging
results across sets of parameters for which it is optimal to start a private firm at time 0.
The quantity whose average we calculate is the expected post-IPO drop in profitability. We
compute this expectation in closed form and analyze its dependence on the key parameters,
12Interestingly, uncertainty has an ambiguous effect on the long-run expectation of ρt, which is equal toE(ρτ |ρτ > ρ). On one hand, lower uncertainty raises the IPO cutoff ρ, which pushes E(ρτ |ρτ > ρ) up. Onthe other hand, for any given cutoff, lower uncertainty pushes E(ρτ |ρτ > ρ) down due to basic properties ofthe truncated normal distribution (because the dispersion of ρτ is smaller). The relative importance of thetwo effects depends on the sensitivity of ρ to uncertainty. In Figure 2, the second effect prevails.
18

uncertainty and volatility. The expected post-IPO drop in profitability is given by
Et [ρτ − ρτ |IPO at τ ] = Et
[xτ |ρτ > ρ (xτ ; στ , σρ)
], (32)
where xτ = ρτ − ρτ and the IPO condition is from Corollary 2. Since xt mean-reverts around
zero, a positive expected value of xτ implies that xτ is expected to fall after the IPO, so that
ρτ is expected to fall toward the expectation of its long-run mean, ρτ . We do not focus on
the expected percentage drop as in equation (10) because profitability can be negative.
Proposition 4: At time t < τ , the expected post-IPO drop in profitability is given by
Et [ρτ − ρτ |IPO at τ ] =e−φ(τ−t)xt −
∫xτN (k (xτ , τ ; t, xt, ρt, σ
2t ))Φ (xτ ;µx, σ
2x) dxτ
1 −∫N (k (xτ , τ ; t, xt, ρt, σ2
t ))Φ (xτ ;µx, σ2x) dxτ
(33)
where N (.) is the cumulative density function of the standard normal distribution and
Φ (.;µx, σ2x) is the probability density function of the normal distribution with mean µx and
variance σ2x. The formulas for k (.), µx, and σ2
x are given in the Appendix.
Proposition 4 provides a closed-form expression for the expected post-IPO drop in prof-
itability. The expected drop depends mostly on uncertainty, volatility, and τ − t. Since this
dependence is too complicated to be characterized analytically, we examine it by computing
the expected drop as of time t = 0 for a wide range of parameter values. We vary uncertainty
σ0 from 0 to 10% per year, and both components of volatility, σρ,1 = σρ,2, from 1% to 10%
per year. We average the results across a range of values for benefits of private control, α,
and the prior mean, ρ0 (because these two parameters seem the hardest to choose a priori).
We assume that α is uniformly distributed in [5%, 15%] and ρ0 is uniformly distributed in
[−20%, 40%]. We take ρ0 = 0 and the remaining parameters are from Table 1. For each
set of parameters, we check whether the condition (29) is satisfied; if it is, we compute the
expected post-IPO drop in profitability following Proposition 4 with t = 0 and τ = 5. For
each combination of uncertainty and volatility, we average the expected drops across all
values of α and ρ0 for which the condition (29) is satisfied. This calculation produces the
expected drop that accounts not only for the endogeneity of the IPO decision but also for
the endogeneity of the private firm’s existence and for uncertainty about α and ρ0.
Table 2 shows the results. Almost all entries in Panel A are positive, confirming that
the expected post-IPO drop in profitability is generally positive. The expected drop can be
as large as 23.5% per year, which obtains for σ0 = 2% and σρ,1 = σρ,2 = 10%. However,
there exist parameter values for which the expected drop is zero or even slightly negative;
when profitability exhibits very little volatility (σρ,1 = σρ,2 = 1%), we expect profitability to
increase after the IPO, although only by less than 1%. The reason is that when volatility
is low, signals are precise, so learning is fast and ρt rises rapidly toward the IPO cutoff.
19
Realized profitability ρt, which is initiated at ρ0 = 0, may not “catch up” with ρt, in which
case we have ρτ < ρτ at time τ , after which we expect an increase in profitability.
Panel A also shows that the expected drop in profitability tends to be high when volatility
is high and when uncertainty is low, as expected from Sections 2. and 4.1. The volatility
pattern is stronger and it obtains even for σ0 = 0 when the main force is mean reversion in
profitability. Both effects are non-monotonic, though. For example, when volatility increases
from 9% to 10%, the expected drop decreases in some cases, as it does when uncertainty
drops below 2%. This non-monotonicity is largely due to the endogeneity of the private firm’s
creation at time 0. For example, when uncertainty is higher, a private firm is less likely to be
created at time 0, at least according to the sufficient condition (Corollary 3). The firms that
are created tend to compensate for the higher uncertainty with higher values of α, for which
the drop is generally larger. This firm-selection effect contributes to the reversal of the basic
pattern in Table 2 for the lowest values of σ0. The firm-selection effect is complicated, in part
because we do not have explicit comparative statics for the necessary and sufficient condition
(29); we can only partially characterize the sufficient condition (Corollary 3). Panel A of
Table 2 provides an imperfect but useful substitute for this intractable theoretical analysis.
The basic patterns in the table confirm the implications of the toy model.
In addition to some sets of parameters being inadmissible due to failing the condition
(29), other sets of parameters seem implausible because they imply unrealistic properties
for the dynamics of the firm’s market value. To analyze these properties, Panel B of Table
2 reports the average volatility of the firm’s stock returns and Panel C reports the average
expected excess return on the firm’s stock. Both averages are computed as in Panel A,
across all admissible values of α and ρ0, conditional on an IPO at time τ and also on
the creation of a private firm at time 0. Note that the expected excess return, which is
given by Q1(T − t)σρ,1σπ, does not depend on uncertainty. Panels B and C show that
many combinations of volatility and uncertainty in which volatility exceeds 3% produce
reasonable properties for stock returns, with return volatility ranging from 14% to 45% per
year and the expected excess return ranging from 5.9% to 14.8% per year. However, lower
values of the volatility of profitability seem implausible. For example, for σρ,1 = σρ,2 = 1%,
return volatility ranges from only 3.5% to 6.6% and the expected excess return is only 1.5%.
These values seem unrealistically low, suggesting that profitability must be more volatile
than σρ,1 = σρ,2 = 1% per year. Since the expected drop in Panel A is non-positive only
for the lowest values of the volatility of profitability, this additional return-based evidence
strengthens the conclusion that the expected drop is positive in this model.
20
Table 3 is a counterpart of Table 2 with τ = 5 replaced by τ = 7.13 The results are quite
similar to those in Table 2. Although the expected drop is generally smaller than in Table
2, it is overwhelmingly positive. The only exceptions occur for the smallest values of the
volatility of profitability, which seem implausible because they produce stock returns whose
volatility is less than 10% per year and whose mean is less than 3% in excess of the risk-free
rate. Although there are some non-monotonicities due to the private-firm selection at time
0, the expected drop generally increases with volatility and decreases with uncertainty.
5. Empirical Analysis
In this section we test the main predictions of our model: Firm profitability drops after the
IPO on average, and this decline is larger for firms with more volatile profitability and lower
uncertainty about average profitability.
5.1. Data
Our data sources include CRSP, Compustat, IBES, SDC, and Jay Ritter’s IPO database.
Our sample contains 7,183 firms that had IPOs in the U.S. from 1975–2004. We include
an IPO firm in the sample if it meets all of the following criteria: (1) it appears in either
Jay Ritter’s 1975-1984 IPO database or in SDC’s U.S. Public Common Stock New Issues
database with an offer date between 1/1/1985 and 12/31/2004; (2) it had a firm-commitment
IPO; (3) it is not a closed-end fund, trust, unit, ADR, ADS, or REIT; and (4) the IPO’s
offer price was at least one dollar per share.
Guided by the model, we measure profitability as earnings scaled by the book value of
equity, or return on equity (ROE). ROEi,s is computed for firm i in the fiscal quarter that is
s quarters after the IPO. The dependent variable in our tests is ROEi,s−ROEi,0, the change
in ROE over the first s quarters after firm i’s IPO. ROE equals income before extraordinary
items available for common stock plus deferred taxes, divided by book equity. We calculate
earnings using quarterly Compustat data, and book value using both quarterly and annual
Compustat data. Further details on the construction of ROEi,s are in the Appendix.
We estimate the volatility of ROE by the standard deviation of quarterly ROE over a
five-year period after the IPO. Specifically, V OL(i; s0), or V OL(s0) for short, is the standard
deviation of ROEi,s in quarters s = s0, ..., s0 +19, assuming that at least 12 observations are
available. We use two values of s0. The natural choice is s0 = 0 because V OL(0) uses data as
13In the full sample of Loughran and Ritter (2004), the median firm age at the IPO is 7 years.
21
close to the IPO as possible. Under this choice, some of the earnings data used to compute
V OL(0) are also used to compute the dependent variable, ROEi,s −ROEi,0. Although there
is no obvious bias, firms with large post-IPO increases or decreases in ROE are likely to have
large values of V OL(0). To address this concern, we also use s0 = s+1. There is no overlap
between the earnings data used to calculate V OL(s + 1) and ROEi,s − ROEi,0.
5.2. Separating Uncertainty from Volatility
To test the model’s prediction regarding uncertainty, we need a proxy. Commonly used prox-
ies for uncertainty such as firm age, size, return volatility, or analyst coverage are inadequate
here because they proxy not only for uncertainty but also for the volatility of profitability,
which has an opposite theoretical effect on the post-IPO drop in profitability. In general,
firms with high uncertainty also tend to have high volatility, which presents an estimation
challenge. However, we have found an empirical proxy whose value should be high when
uncertainty is high and when volatility is low: the stock price reaction to post-IPO earnings
announcements. In fact, we can link this proxy directly to our model.
Corollary 4: If the model’s assumptions hold and, in addition, σρ,1 = 0, then
dRt −Et [dRt] = M(σρ,2, σ
20;φ, t
)(dρt − Et [dρt]) , (34)
where
M(σρ,2, σ
20;φ, t
)= Q1 (T − t) + Q2 (T − t)φ
σ2t
σ2ρ,2
. (35)
The quantity M represents the stock price reaction to earnings surprises. M is positive
(i.e., earnings surprises and the associated abnormal returns have the same sign), increasing
in uncertainty (σt), and decreasing in volatility (σρ,2). The intuition is clear. Realized
earnings are a noisy signal about average future profitability. Upon observing a given signal,
investors update their beliefs about the firm value more when they are more uncertain and
when the signal is less noisy (i.e., when earnings are less volatile).
Our model predicts that firms with higher values of M have smaller post-IPO drops in
profitability, because such firms have higher uncertainty, lower volatility, or both (holding
φ and t constant). Once we control for profit volatility, the regression of ROEi,s − ROEi,0
on Mi can be interpreted as a test of the model’s prediction regarding uncertainty. The
theoretical motivation for M is only approximate because Corollary 4 requires σρ,1 = 0.
This assumption is unrealistic but its violation need not impair the usefulness of M by much
because we estimate M in short periods around firm-level earnings announcements, during
22
which firm-specific earnings news is likely to be the main driver of unexpected stock returns.
While we are aware that M is not a perfect proxy, we find it satisfactory to use an empirical
proxy that is directly motivated by the theoretical model being tested.
We estimate Mi for each IPO firm i based on earnings announcement data. On the
left-hand side of equation (34), we interpret dRt − Et [dRt] as the abnormal return due to
an earnings announcement. We measure this quantity by ARit, the cumulative return of
stock i in excess of stock i’s industry’s return starting one trading day before the firm’s t-th
post-IPO earnings announcement and ending one trading day after the same announcement.
Quarterly earnings announcement dates are from IBES. Daily stock returns are from CRSP,
and daily returns of 49 value-weighted industry portfolios are from Ken French’s website.
On the right-hand side of equation (34), we interpret dρt − Et [dρt] as unexpected quarterly
profitability, which we compute as (EPSit − E [EPSit]) /BEit. EPSit denotes the quarterly
earnings per share of firm i announced in its t-th post-IPO earnings announcement, from
the IBES unadjusted actuals file. E [EPSit] is the mean of all analyst forecasts of EPSit
using IBES’s last pre-announcement set of forecasts for the given fiscal quarter. BEit is book
equity per share of firm i, using the most recent pre-announcement measurement.
To estimate Mi, we compute two measures, ERC1(i) and ERC2(i), which we refer to as
the “earnings response” coefficients, or ERCs. First, we compute
RCit =ARit
(EPSit − E [EPSit]) /BEit, (36)
excluding observations where the denominator equals zero. From equation (34), RCit is a
proxy for Mi. Since RCit is quite noisy (especially if the denominator is close to zero),
we winsorize the highest 5% and lowest 5% of RCit observations, and we also average the
quarterly RCit’s over the first three years after the IPO to increase precision:
ERC1(i) =1
13
12∑
t=0
RCit. (37)
We compute ERC1(i) only if there are at least six valid observations of RCit. To define
ERC2(i), consider the following regression over the five-year period after the IPO:
(EPSit − E [EPSit]) /BEit = γi0 + γi1ARit + εit, t = 0, 1, ..., 20. (38)
According to equation (34), γi1 = 1/Mi but we do not measure Mi as 1/γi1 because γi1 can
be close to zero, producing outliers in 1/γi1. Instead, we define
ERC2(i) = −γi1, (39)
23
with a minus sign so that large earnings responses are associated with large values of ERC2.
Unlike ERC1, ERC2 is not a direct estimate of M , but it preserves the same cross-sectional
ranking. We make earnings surprises the dependent variable in equation (38) to mitigate the
attenuation bias, since we believe there is more measurement error in earnings surprises than
in abnormal returns. Since equation (34) indicates γi0 = 0, we estimate the regressions in
(38) without the intercept. We require at least 10 observations to estimate these regressions.
Before running the regressions, we winsorize the highest and lowest 5% values of both ARit
and (EPSit − E [EPSit]) /BEit across all firms and quarters t = 0, 1, ..., 32. ERC2 is similar
to the earnings response coefficient of Easton and Zmijewski (1989) and others.
5.3. Summary Statistics
Table 4 reports some summary statistics. The three-year change in ROE, ROEi,12−ROEi,0,
can be computed for 3,964 firms. The mean and median of ROEi,12 − ROEi,0 are both
negative, consistent with the model’s prediction. In addition, ROEi,12 − ROEi,0 is nega-
tively correlated with the volatility of ROE and positively correlated with the ERCs. These
correlations foreshadow our main empirical results.
Profitability in the quarter of the IPO, ROEi,0, can be calculated for 5,795 of the 7,183
firms in our sample.14 The median ROEi,0 is 1.84% per quarter (or 7.4% per year), but
the mean is only -0.79%, indicating a left-skewed distribution of ROE. This left skewness
has been documented by Fama and French (2004) who attribute this pattern to small IPOs
that are highly unprofitable. The low ROEi,0 seems inconsistent with our model. In the
model, the realized ROE typically exceeds expected long-run ROE at the IPO (this is why
ROE declines after the IPO), so we would expect the ROE of IPOs to exceed the ROE of
comparable non-IPO firms. Supporting evidence is provided by Jain and Kini (1994) who
find that when firms go public, they are more profitable than the median firm in the same
industry. To reconcile Jain and Kini’s evidence with ours, note that their sample period
is 1976–1988, which is roughly the first half of our sample (1975–2004). Fama and French
(2004) show that IPO profitability declined in the 1990s. Indeed, in our sample, the medians
of ROEi,0 in three sub-periods, 1975–1984, 1985–1994, and 1995–2004, are 3.36%, 2.57%,
and 0.40%, respectively (the corresponding means are 2.24%, 0.23%, and -2.83%). The low
ROEi,0 in Table 4 is thus driven by the most recent sub-period, which was unusual in many
aspects. For example, in the late 1990s, firms went public at a younger age than ever before
(Loughran and Ritter, 2004). It is not surprising that such young firms are less profitable
than the more mature firms that went public in the earlier decades.
14In contrast, ROE for the quarter immediately preceding the IPO quarter can be computed for only 31firms, so we cannot test the model’s prediction that profitability increases shortly before the IPO.
24
Our model can be extended to accommodate the low ROEi,0 in the 1990s. The model
assumes that ROE mean-reverts around a constant mean ρ, but in reality, this mean is likely
to rise while the firm is very young. The start-up costs of a private firm often predictably
exceed revenues, making ROE mean-revert around a negative mean ρt for t close to zero.
Over time, ρt increases until it stabilizes as the firm matures. As long as the unknown value
of ρt varies deterministically, our basic mechanism works also in this extended model. An
IPO occurs if the perception of ρτ , ρτ , is sufficiently high. To push ρτ up, realized profits
must be higher than expected, which typically leads to ρτ > ρτ , which in turn induces a
drop in ρt immediately after time τ . After the initial post-IPO decline, ρt either stabilizes or
rises, depending on the extent to which ρt rises after time τ . When τ is low, ρτ is lower than
in our model and it can even be negative. As a result, ρτ = ROEi,0 can also be negative,
especially if τ (firm age at the IPO) is low, as it was in the late 1990s. To summarize, this
realistic extension of our model, in which ρt increases while the private firm is very young,
has the same basic implications while allowing ROEi,0 to be low and even negative.
Back to Table 4, ERC1 and ERC2 can be computed for almost 40% of firms. (IBES
coverage begins in 1982 and is poor for most of the 1980s.) The mean of ERC1 shows that
a 1% earnings surprise (scaled by book equity) is associated with a 3.13% abnormal stock
return, on average. Theoretically, earnings surprises and stock returns should have the same
sign, so ERC1 should be positive and ERC2 negative. However, ERC1 is negative for 33%
of firms, and ERC2 is positive for 22% of firms. These unexpected signs are probably due to
measurement error in expected earnings and non-earnings related news. The cross-sectional
means of ERC1 and ERC2 do have the predicted signs and high statistical significance.
Since ERC1 and ERC2 proxy for uncertainty divided by volatility, we expect them to be
negatively correlated with the volatility of ROE, and they indeed are. However, ERC1
and ERC2 are almost uncorrelated with each other. This unexpected result is due to the
observations of ERC1 and ERC2 that do not have the predicted signs (i.e., ERC1 < 0 and
ERC2 > 0).15 When these observations are excluded, the correlation increases. We define
ERC+1 and ERC−
2 in the same way as ERC1 and ERC2, except we delete observations with
ERC1 < 0 and ERC2 > 0, respectively. The correlation between ERC+1 and ERC−
2 is 0.3.
Figure 3 plots the change in ROE, ROEi,s − ROEi,0, in event time following the IPO.
The top panel shows that average ROE drops steadily after the IPO, leveling off after about
eight quarters. The median change in ROE, plotted in the middle panel, is also negative but
15Under the assumptions that deliver equation (34), ERC1 and ERC2 are approximate estimates of Mand −1/M , respectively, so ERC2 ≈ −1/ERC1. The function f(x) = −1/x is monotonically increasing forx > 0 (which is the predicted sign of ERC1), making x and f(x) perfectly positively correlated, but thepresence of negative values of x (i.e., values of ERC1 with unpredicted signs) destroys this relation since weobserve both branches of the hyperbola instead of just the branch with x > 0 and f(x) < 0.
25

smaller in magnitude than the mean change. The 75th percentile line shows that for more
than a quarter of firms, ROE actually increases following the IPO. This is not inconsistent
with the model, which makes predictions only about the average post-IPO change in ROE.
The bottom panel shows the mean change in ROE in the sub-samples of firms that had IPOs
in 1975–1984, 1985–1994, and 1995–2004. The patterns are remarkably similar across the
three sub-samples, and they are also similar to the model-implied pattern in Figure 1.
Figure 4 compares the post-IPO average changes in ROE between firms with high and
low values of volatility and the ERCs. We split all firms into two equally large sub-samples
based on whether the firms’ V OL(0) is larger or smaller than the cross-sectional median of
V OL(0), and we do the same for ERC1. (The results based on V OL(13) and ERC2 lead
to the same conclusions.) We calculate each sub-sample’s mean change in ROE at various
horizons. We plot these changes in Panels A and B and we also plot their differences,
along with 95% confidence intervals, in Panels C and D. Panels A and C show that mean
profitability drops for both high- and low-V OL(0) firms, the drop is significantly larger for
firms with high V OL(0), and the difference grows with the horizon. Similarly, Panels B and
D show that mean profitability drops for both high- and low-ERC1 firms, the drop is larger
for low-ERC1 firms, and the difference generally grows with the horizon. Both results are
consistent with the model. However, since ERC1 depends on both uncertainty and volatility,
it is unclear which of the two variables drives the difference between the high- and low-ERC1
firms. In the following section, we attempt to disentangle these effects by including both
volatility and the ERCs in a multiple regression.
5.4. Regression Analysis
We estimate the following regression across all IPO firms with available data:
ROEi,s − ROEi,0 = Xiβ + εi, (40)
where the vector Xi contains a constant and various combinations of our measures of ROE
volatility and earnings response. We consider two horizons, s = 4 and s = 12 quarters. In
each specification, we use as many observations as possible, so the sample is not necessarily
the same across specifications. We estimate β by ordinary least squares and calculate its
standard error by clustering the regression residuals in calendar time.16
Table 5 shows the results. First, we estimate the unconditional mean change in ROE over
16We allow non-zero correlations between the residuals of firms whose IPOs were s/2 or fewer quartersapart in calendar time. Specifically, we assume that E [εiεj ] is equal to σ2 for i = j and to σ2
t for i 6= j,where t is the number of quarters between i and j’s IPOs. For t ≤ s/2, we estimate σ2
t from the relevantsubset of the estimated OLS residuals; for t > s/2, we set σ2
t = 0.
26
the first 4 and 12 post-IPO quarters, respectively. The average value of ROEi,4 − ROEi,0
is -2.68% per quarter (t = −11.2) and the average value of ROEi,12 − ROEi,0 is -4.29% per
quarter (t = −16.2). On average, firm profitability clearly drops after the IPO, consistent
with the model and also with the earlier empirical studies.
Second, we test the model’s prediction that ROE drops more for firms with more volatile
ROE. Indeed, the slope coefficients on both V OL(0) and V OL(s+1) are negative and highly
statistically significant, with t-statistics exceeding 7.4 in absolute value at both horizons. The
relation is also economically significant: a one-standard-deviation cross-sectional increase in
V OL(0) is associated with a 1.74% per quarter larger four-quarter drop in ROE and a 5.01%
per quarter larger twelve-quarter drop in ROE (not tabulated). The corresponding numbers
for V OL(s + 1) are 1.48% and 1.88% per quarter, respectively.
Third, we test the prediction that ROE drops more for firms with smaller earnings re-
sponse measures. Indeed, we observe positive slope coefficients on ERC1 and ERC2 in all
four specifications (two horizons, two ERCs), and three of the four coefficients are statisti-
cally significant. A one-standard-deviation decrease in ERC1 is associated with a 0.69% per
quarter larger four-quarter drop in ROE and a 0.97% larger twelve-quarter drop in ROE.
The corresponding numbers for ERC2 are 0.20% and 0.58%, respectively.
Fourth, since firms with smaller ERC1 and ERC2 should have either lower uncertainty
or higher volatility or both, we attempt to isolate the impact of uncertainty by including
controls for volatility. In these multiple regressions, the slope coefficients on volatility remain
negative and highly significant. The slope coefficients on ERC1 and ERC2 are positive in
all eight specifications (two horizons, two ERCs, two volatility measures), but only three of
these coefficients are statistically significant, and barely so. These results are consistent with
the model’s uncertainty prediction, but the evidence is not overwhelming.
The ERCs may contain substantial estimation error due to mismeasurement of investors’
earnings expectations and to non-earnings-related news. This error is likely to affect espe-
cially the coefficient estimates that do not have the predicted signs (i.e., ERC1 < 0 and
ERC2 > 0); in fact, this error is the most likely reason why these signs are opposite to what
basic economics would predict. Therefore, we repeat the tests from Table 5 using ERC+1
and ERC−2 , the ERCs that exclude observations that do not have the predicted signs.
Table 6 is an equivalent of Table 5 with ERC1 and ERC2 replaced by ERC+1 and ERC−
2 .
First, consider the simple regressions of ROEi,s − ROEi,0 on either ERC+1 or ERC−
2 . The
results show that ROE drops more for firms with smaller ERCs, and the evidence is even
stronger than in Table 5: the slope coefficients on ERC+1 and ERC−
2 are significantly positive
27
in all four univariate specifications, with t-statistics ranging from 2.30 to 6.68. Second,
consider the same regressions but control for the volatility of ROE. The slope coefficients
on ERC+1 and ERC−
2 are positive in all specifications, and five of the eight coefficients
are statistically significant. These results are stronger than in Table 5; for example, the t-
statistic for ERC2 in the last specification increases from 1.97 in Table 5 to 4.77 in Table 6.17
This increase in significance suggests that the decrease in precision resulting from a smaller
number of observations is more than offset by the increase in precision resulting from using
the ERCs that contain less measurement error. These results support the model’s prediction
that the post-IPO drop in ROE should be larger for firms with less uncertainty.
We conduct additional robustness tests. First, it makes little difference whether we use
the median instead of the mean of analyst forecasts when estimating E [EPSit], or whether
we require at least two forecasts to compute the mean. Second, changing the number of
post-IPO quarters over which ERC1 and ERC2 are computed leads to similar results. The
tradeoff is that as we use more quarters, the ERCs become less noisy but we also lose
more observations and we need to assume that observations several years after the IPO are
equally informative about uncertainty and volatility at the time of the IPO. Third, changing
the horizon over which we measure the post-IPO drop in ROE to two years or four years
does not change any of our conclusions. Fourth, we obtain very similar results when we free
up the intercept in the regression (38) used to estimate ERC2, and also when we redefine
ERC2 as the slope in the reverse regression of abnormal returns on earnings surprises. Fifth,
in the regression used to calculate ERC2, we include an additional regressor, the cumulative
stock return starting one day after IBES records the analyst forecasts and ending two trading
days before the earnings announcement. The idea is to soak up some of the news that comes
out before the earnings announcement but after analysts form their forecasts (about two
weeks earlier, on average). The resulting modification of ERC2 enters our regressions with
the same sign but slightly lower statistical significance than the original ERC2. However,
the modified ERC2 has the predicted sign less often than the original ERC2, so including
the additional regressor seems to reduce rather than increase precision. Sixth, controlling
for firm-level sample estimates of the mean reversion coefficient φ leads to exactly the same
conclusions. Overall, our empirical evidence seems reasonably robust.
17We obtain similar results when we winsorize the ERCs with unpredicted signs at zero instead of elimi-nating them. The slope coefficients on the ERCs are significantly positive in all four univariate specifications,and they are also positive in all eight specifications that control for the volatility of ROE, with four of theeight coefficients being statistically significant.
28
6. Conclusions
This paper develops a model of the optimal IPO decision, analyzes the model’s novel pre-
dictions, and tests these predictions empirically. In the model, two types of agents, well-
diversified investors and an under-diversified entrepreneur, both learn about the average
profitability of a private firm by observing realized profits. There is no asymmetric informa-
tion. The entrepreneur making the IPO decision faces a tradeoff between benefits of private
control and diversification benefits of going public. It is optimal for the entrepreneur to take
his firm public if the firm’s market value exceeds the firm’s private value. We show that an
IPO takes place if the agents learn that the firm’s average profitability is sufficiently high.
The model predicts that firm profitability should decline after the IPO, on average, and that
this decline should be larger for firms with more volatile profitability and firms with less
uncertain average profitability. We test these predictions empirically and find significant
support for them in the data. High volatility and high uncertainty tend to go together, but
we separate them by estimating the stock price reaction to earnings announcements, which
should be strong when uncertainty is high and when volatility is low.
In the model, IPO firms cannot return to private ownership, but the model’s logic seems
relevant for the going private decision (e.g., Zingales, 1995, Benninga et al, 2005, Bharath
and Dittmar, 2006). Reversing our arguments for going public, a firm is taken private if
the benefits of private control exceed the diversification benefits of public ownership, which
happens when the agents learn that average profitability is sufficiently low. Such an extension
of our model would predict that firms tend to experience declines in profitability before going
private and increases in profitability after going private. Consistent with the first prediction,
Halpern et al (1999) find that stock returns before leveraged buyouts are unusually low. We
leave this model extension as well as its empirical testing for future research.
There is no role for venture capitalists (VCs) in our simple model. It would be interesting
to add VCs to the model and analyze their effect on the IPO decision. Lerner (1994) is an
early empirical study on the effect of VCs on the IPO timing. A simpler way to extend
the model is to relax the assumption that the time of the IPO decision is given. This
extension can be solved numerically in a way analogous to solving for the optimal time to
exercise an American option. (Pastor and Veronesi (2005) follow this route in a related
framework in their analysis of IPO waves.) The key implications of the model are preserved
in that (more complex) framework. The entrepreneur chooses to go public immediately
after expected profitability exceeds a cutoff, which happens after unexpected increases in
profitability. Profitability is expected to decline after the IPO due to the same effects of
learning and mean reversion that we describe here. This extension also generates IPO waves
29
among firms in industries that recently became more profitable, as well as industry-wide
post-wave declines in profitability. We do not pursue this extension formally because our
focus is on learning whose implications come through also in the simpler model.
Our model assumes that the entrepreneur sells the entire private firm in an IPO. It would
be interesting to extend the model to allow the entrepreneur to sell only a fraction of the
firm. Such a model might allow one to solve for the optimal fraction to be sold in an IPO,
and to relate this fraction to the firm’s characteristics and to its post-IPO performance.
Although our model is designed for IPOs, it has some relevance for seasoned equity
offerings (SEO) as well. If a shareholder owns a substantial fraction of a firm’s shares,
she faces a similar tradeoff as our entrepreneur: issuing equity makes the shareholder more
diversified while reducing her control over the firm. Following the logic of the model, the
shareholder may find it optimal to issue more equity after a sufficiently large improvement
in profitability and, as a result, profitability should subsequently fall for the same reasons
as in the model. Indeed, Loughran and Ritter (1997) find that firm profitability tends to
increase before an SEO and decline thereafter, exactly as the model would imply. It would be
interesting to test whether this pattern in profitability around SEOs is related to volatility,
uncertainty, and to the fraction of equity held by the firm’s largest shareholder.
Loughran and Ritter (1997) also argue that “The most salient feature concerning firms’
equity issuance behavior is that most firms issue equity after large stock price increases.”
For example, Asquith and Mullins (1986) and Loughran and Ritter (1995) report that firms
engaging in SEOs tend to exhibit high stock returns prior to the SEO. This empirical fact
is also consistent with our model. In the model, an issue of equity is induced by recent
unexpected increases in profitability, which should coincide with high stock returns. We
cannot test this prediction on IPOs since pre-IPO stock returns are obviously unavailable, but
the SEO evidence seems comforting. Also note that our model makes no unusual predictions
regarding the post-issue stock returns, which are actively debated in the literature.18 We
have nothing to add to this debate. In our model, expected stock returns are not anomalous;
they are determined by the covariances between returns and the stochastic discount factor.
We analyze operating performance rather than stock performance.
18For example, Ritter (1991) and Loughran and Ritter (1995) show that stock returns of firms that recentlywent public are lower on average than returns of seasoned firms, while Brav and Gompers (1997) and Brav,Geczy, and Gompers (2000) argue that most IPOs are small growth stocks and such stocks have had lowreturns regardless of whether they recently went public. Degeorge and Zeckhauser (1993) find that afterthey go public, reverse LBOs actually have slightly higher stock returns than comparison firms.
30
Appendix.
Detailed Definitions of the Empirical Measures.
Profitability, ROEis, equals [Iis + DTis]/BEis. The subscript s denotes the s-th fiscalquarter after the fiscal quarter of firm i’s IPO. The fiscal quarter containing the IPO isquarter zero. Iis equals the income before extraordinary items available for common stock(Compustat quarterly item 25) for firm i in quarter s. DTis equals deferred taxes fromincome account (Compustat quarterly item 35); we impute a zero value if this item is missing.BEis is the book value of equity of firm i in quarter s. BEis is calculated either from theprevious fiscal quarter, previous fiscal year, current fiscal quarter, or current fiscal year,taken in that order depending on availability. Following Fama and French (1993), bookvalue of equity equals stockholders’ equity plus deferred taxes minus book value of preferredstock. If any of these three items is missing, then book value of equity is treated as missing.We treat negative or zero values of BE as missing. Stockholders’ equity equals either “totalstockholders’ equity” (quarterly item 60, annual item 216), “total common equity” (quarterlyitem 59, annual item 60) + “carrying value of preferred stock” (quarterly item 55, annualitem 130), “total assets” (quarterly item 44, annual item 6) - “total liabilities” (quarterlyitem 54, annual item 181), or missing, in that order depending on availability. Deferred taxesequals “deferred tax and investment tax credit” (quarterly item 52, annual item 35), or ifthat is missing, then zero. Annual book value of preferred stock equals either “redemptionvalue of preferred stock” (annual item 56), “liquidating value of preferred stock” (annual item10), “carrying value of preferred stock” (annual 130), or zero, in that order depending onavailability. Quarterly book value of preferred stock equals “book value of preferred stock”(quarterly item 55), or zero if item 55 is missing. We eliminate firm-quarter observationswhere ROEis is outside [-100%, +100%].
Abnormal stock return, ARit, is the cumulative return of stock i in excess of stock i’s in-dustry, starting one day before the stock’s t-th post-IPO earnings announcement and endingone day after the same announcement. Since the industry portfolios were constructed usingCompustat SIC codes, we link firms to industries using the most recent annual CompustatSIC code (item 324), soonest future Compustat annual SIC code, most recent CRSP SICcode (SICCD), or soonest future CRSP SIC code, in that order depending on availability.Earnings announcement date is variable REPDATS from the IBES unadjusted actuals file.
Earnings per share, EPSit, is the quarterly EPS of firm i announced in its t-th post-IPOearnings announcement (variable VALUE in the IBES unadjusted actuals file). E [EPSit]is the mean of all analyst forecasts of EPSit using IBES’s last pre-announcement set of fore-casts for the given fiscal quarter (variable MEANEST in the IBES unadjusted summary file).We eliminate observations for which the earnings announcement date is more than 60 daysafter the most recent set of earnings forecasts (roughly 1% of observations are eliminated).
31
Theoretical Results.
This appendix contains the formulas that we refer to in the text. The proofs of all propo-sitions are contained in the Technical Appendix that is available on the authors’ websites.
Market value: Let σπ = (σπ,1, σπ,2) and σρ = (σρ,1, σρ,2). In equation (20), we have
Q0 (s) = −rs +σρσ
′ρ
2φ2Q3 (s) −
σπσ′ρ
φQ2 (s) ; Q1 (s) =
1
φ
(1 − e−φs
)> 0;
Q2 (s) = s − Q1 (s) > 0; Q3 (s) = s +1 − e−2φs
2φ− 2Q1 (s) .
Proposition 2: The utility from owning the firm from τ to T is given by (22), where
ZO(ρt, ρt, σ
2t ; s)
= eQ0(s)+(1−γ)Q1(s)ρt+(1−γ)Q2(s)ρt+12(1−γ)2Q2(s)
2 σ2t (41)
in which Qi (.) are given above and Q0 (s) = −βs + (1 − γ)2 σρσ′ρ
2φ2 Q3 (s).
Proposition 3: An IPO takes place if and only if condition (25) is satisfied, where
f (T − τ, στ , σρ) = e(1−γ)
(−(r− β
1−γ )(T−τ)+γσρσ′
ρ
2φ2 Q3(T−τ)−σπσ′
ρφ
Q2(T−τ)
)+ 1
2γ(1−γ)Q2(T−τ)2σ2
τg (T − τ )−η
Z (ρτ , ρτ , στ ;u− τ ;T ) = eQ0(u−τ ;T )+(1−γ)Q1(u−τ ;T )ρτ +(1−γ)Q2(u−τ ;T )ρτ + 12(1−γ)2Q3(u−τ ;T )σ2
τ
Above,
g (T − t) =
(1 + η
1γ 1−γ
γ
(r − β
1−γ+ 1
21γσ2
π,1
))e
1−γγ (r− β
1−γ+ 1
21γ
σ2π,1)(T−t) − 1
1−γγ
(r − β
1−γ+ 1
21γσ2
π,1
)
γ
and
Q0 (u− τ ;T ) = Q0 (u − τ ) − Q0 (T − τ )
Q1 (u− τ ;T ) = Q1 (u − τ ) − Q1 (T − τ ) < 0
Q2 (u− τ ;T ) = Q2 (u − τ ) − Q2 (T − τ ) < 0
Q3 (u− τ ;T ) = Q2 (u − τ )2 − Q2 (T − τ )2 < 0
IPO decision: An IPO takes place if and only if condition (26) holds, where
Z (xτ , ρτ , στ , u− τ, T ) = eQ0(u−τ,T )+(1−γ)(Q1(u−τ,T )xτ+(u−T )ρτ)+ 12(1−γ)2Q3(u−τ,T )σ2
τ
Proposition 4: The expected drop in profitability is given in equation (33), where
k(xτ , τ ; t, xt, ρt, σ
2t
)=
ρ (xτ) − ρt − a (t, τ ; σ2t )(xτ − e−φ(τ−t)xt
)
√(σ2
t − σ2τ)(1 − b (t, τ ; σ2
t )2) (42)
32
µx = e−φ(τ−t)xt; σ2x =
1 − e2φ(τ−t)
2φ
(σ2
ρ,1 + σ2ρ,2
)+(e−2φ(τ−t)σ2
t − σ2τ
)(43)
and a (t, τ ; σ2t ) and b (t, τ ; σ2
t ) are given by
a(t, τ ; σ2
t
)=
σ2τ − e−φ(τ−t)σ2
t
1−e2φ(τ−t)
2φ
(σ2
ρ,1 + σ2ρ,2
)+ (e−2φ(τ−t)σ2
t − σ2τ)
b(t, τ ; σ2
t
)=
σ2τ − e−φ(τ−t)σ2
t√1−e2φ(τ−t)
2φ
(σ2
ρ,1 + σ2ρ,2
)+ (e−2φ(τ−t)σ2
t − σ2τ)√
σ2t − σ2
τ
Proposition 5: The value function at time 0 is given in equation (28), where
V O0 (B0, 0) =
B1−γ0
1 − γ×{α1−γ
∫ τ
0ZO
(ρ0, ρ0, σ
2τ ;u
)du
+e−βτ[g (T − τ ) eG0(τ,T )+G1(τ,T )x0+G2(τ,T )ρ0Hy
(x0, ρ0, σ
20, τ, T
)
+∫ T
τα1−γeG0(τ,u)+G1(τ,u)x0+G2(τ,u)ρ0Hn
(x0, ρ0, σ
20, τ, u
)du
+ηeG0(τ,T )+G1(τ,T )x0+G2(τ,T )ρ0Hn(x0, ρ0, σ
20, τ, T
)]}
where
Hy(x0, ρ0, σ
20, τ, u
)=
∫eG3(τ,u)xτ
(1 −N
(k2
(xτ , τ, u; 0, x0, ρ0, σ
20
)))Φ(xτ ;µx (x) , σ2
x (t, τ ))dx
Hn(x0, ρ0, σ
20, τ, u
)=
∫eG3(τ,u)xτN
(k2
(xτ , τ, u; 0, x0, ρ0, σ
20
))Φ(xτ ;µx (x) , σ2
x (t, τ ))dxτ
k2
(xτ , τ, u;x0, ρ0, σ
20
)= k
(xτ , τ ; 0, x0, ρ0, σ
20
)−(1 − γ) a2 (τ, u)
√(σ2
0 − σ2τ)(1 − b (0, τ ; σ2
0)2)
and Gi(τ, u), i = 0, .., 3, G0(τ, u), and a2(τ, u) are given in the Technical Appendix.
33
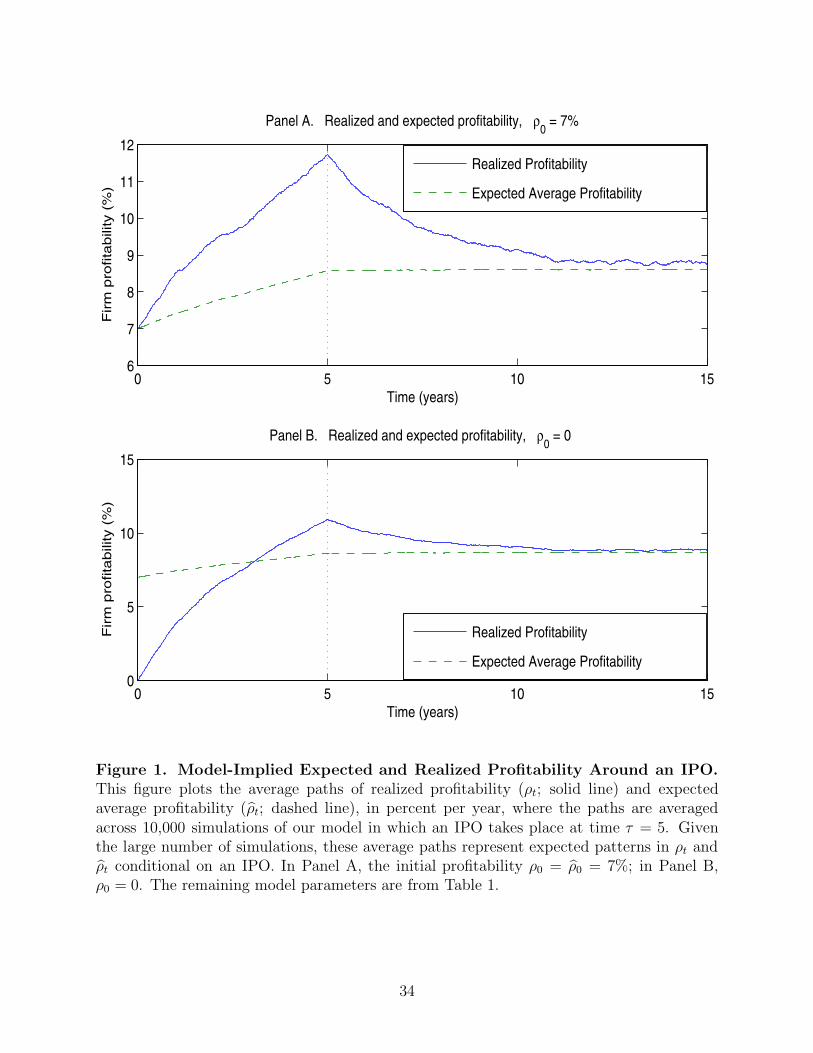
0 5 10 156
7
8
9
10
11
12
Time (years)
Firm
pro
fita
bili
ty (
%)
Panel A. Realized and expected profitability, ρ0 = 7%
Realized Profitability
Expected Average Profitability
0 5 10 150
5
10
15
Time (years)
Firm
pro
fita
bili
ty (
%)
Panel B. Realized and expected profitability, ρ0 = 0
Realized Profitability
Expected Average Profitability
Figure 1. Model-Implied Expected and Realized Profitability Around an IPO.This figure plots the average paths of realized profitability (ρt; solid line) and expectedaverage profitability (ρt; dashed line), in percent per year, where the paths are averagedacross 10,000 simulations of our model in which an IPO takes place at time τ = 5. Giventhe large number of simulations, these average paths represent expected patterns in ρt andρt conditional on an IPO. In Panel A, the initial profitability ρ0 = ρ0 = 7%; in Panel B,ρ0 = 0. The remaining model parameters are from Table 1.
34
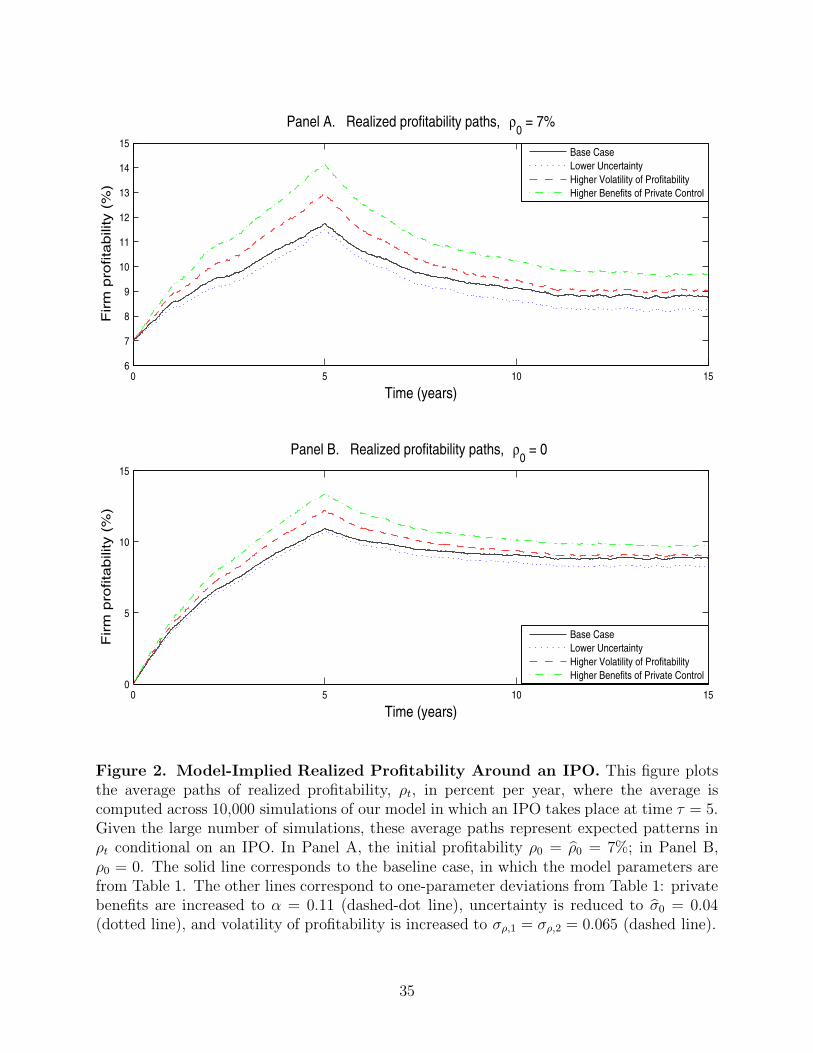
0 5 10 156
7
8
9
10
11
12
13
14
15
Time (years)
Firm
pro
fita
bili
ty (
%)
Panel A. Realized profitability paths, ρ0 = 7%
Base CaseLower UncertaintyHigher Volatility of ProfitabilityHigher Benefits of Private Control
0 5 10 150
5
10
15
Time (years)
Firm
pro
fita
bili
ty (
%)
Panel B. Realized profitability paths, ρ0 = 0
Base CaseLower UncertaintyHigher Volatility of ProfitabilityHigher Benefits of Private Control
Figure 2. Model-Implied Realized Profitability Around an IPO. This figure plotsthe average paths of realized profitability, ρt, in percent per year, where the average iscomputed across 10,000 simulations of our model in which an IPO takes place at time τ = 5.Given the large number of simulations, these average paths represent expected patterns inρt conditional on an IPO. In Panel A, the initial profitability ρ0 = ρ0 = 7%; in Panel B,ρ0 = 0. The solid line corresponds to the baseline case, in which the model parameters arefrom Table 1. The other lines correspond to one-parameter deviations from Table 1: privatebenefits are increased to α = 0.11 (dashed-dot line), uncertainty is reduced to σ0 = 0.04(dotted line), and volatility of profitability is increased to σρ,1 = σρ,2 = 0.065 (dashed line).
35
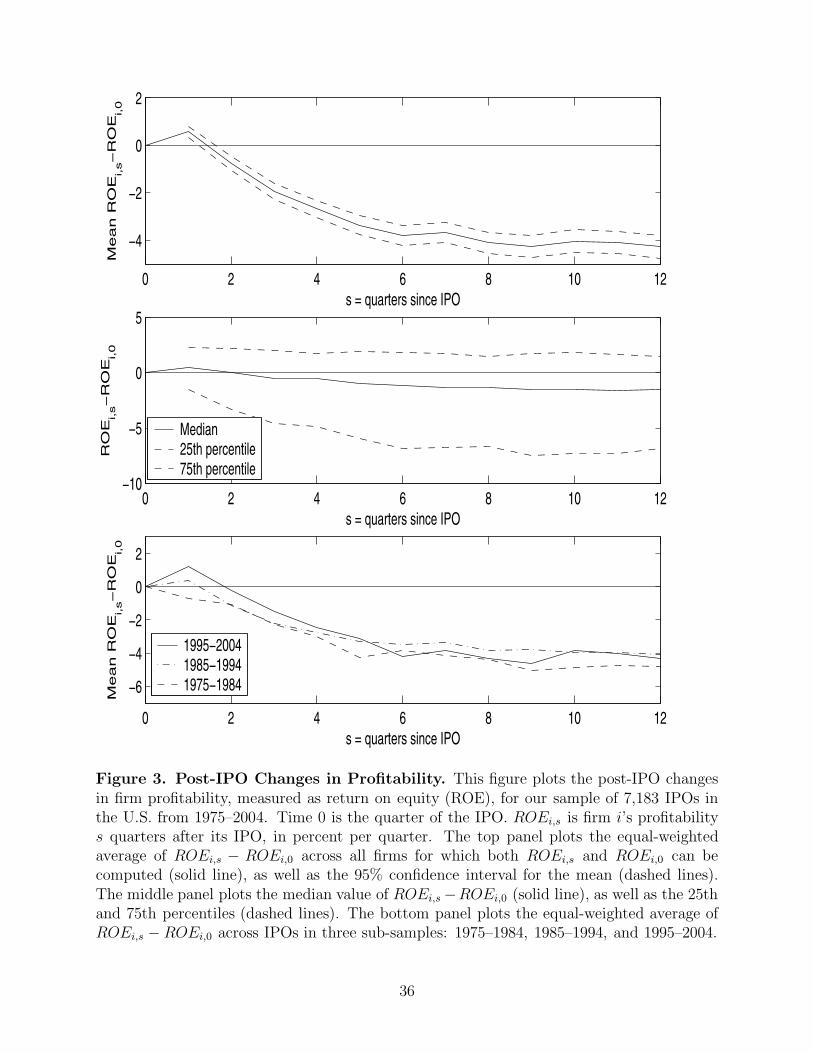
0 2 4 6 8 10 12
−4
−2
0
2M
ea
n R
OE
i,s−
RO
Ei,0
s = quarters since IPO
0 2 4 6 8 10 12−10
−5
0
5
RO
Ei,s−
RO
Ei,0
s = quarters since IPO
Median25th percentile75th percentile
0 2 4 6 8 10 12
−6
−4
−2
0
2
Me
an
RO
Ei,s−
RO
Ei,0
s = quarters since IPO
1995−20041985−19941975−1984
Figure 3. Post-IPO Changes in Profitability. This figure plots the post-IPO changesin firm profitability, measured as return on equity (ROE), for our sample of 7,183 IPOs inthe U.S. from 1975–2004. Time 0 is the quarter of the IPO. ROEi,s is firm i’s profitabilitys quarters after its IPO, in percent per quarter. The top panel plots the equal-weightedaverage of ROEi,s − ROEi,0 across all firms for which both ROEi,s and ROEi,0 can becomputed (solid line), as well as the 95% confidence interval for the mean (dashed lines).The middle panel plots the median value of ROEi,s −ROEi,0 (solid line), as well as the 25thand 75th percentiles (dashed lines). The bottom panel plots the equal-weighted average ofROEi,s − ROEi,0 across IPOs in three sub-samples: 1975–1984, 1985–1994, and 1995–2004.
36
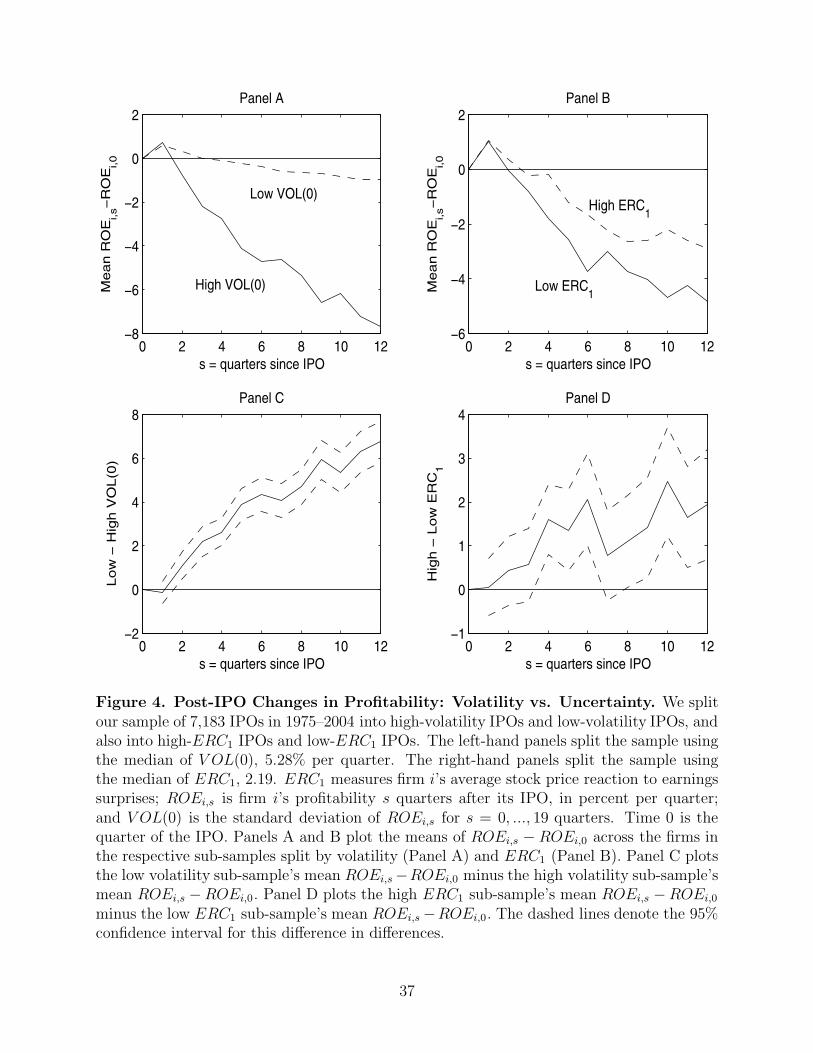
0 2 4 6 8 10 12−8
−6
−4
−2
0
2M
ean R
OE
i,s−
RO
Ei,0
s = quarters since IPO
Panel A
0 2 4 6 8 10 12−2
0
2
4
6
8
Low
− H
igh V
OL(0
)
s = quarters since IPO
Panel C
0 2 4 6 8 10 12−6
−4
−2
0
2
Mean R
OE
i,s−
RO
Ei,0
s = quarters since IPO
Panel B
0 2 4 6 8 10 12−1
0
1
2
3
4H
igh −
Low
ER
C1
s = quarters since IPO
Panel D
High VOL(0)
Low VOL(0)
Low ERC1
High ERC1
Figure 4. Post-IPO Changes in Profitability: Volatility vs. Uncertainty. We splitour sample of 7,183 IPOs in 1975–2004 into high-volatility IPOs and low-volatility IPOs, andalso into high-ERC1 IPOs and low-ERC1 IPOs. The left-hand panels split the sample usingthe median of V OL(0), 5.28% per quarter. The right-hand panels split the sample usingthe median of ERC1, 2.19. ERC1 measures firm i’s average stock price reaction to earningssurprises; ROEi,s is firm i’s profitability s quarters after its IPO, in percent per quarter;and V OL(0) is the standard deviation of ROEi,s for s = 0, ..., 19 quarters. Time 0 is thequarter of the IPO. Panels A and B plot the means of ROEi,s − ROEi,0 across the firms inthe respective sub-samples split by volatility (Panel A) and ERC1 (Panel B). Panel C plotsthe low volatility sub-sample’s mean ROEi,s −ROEi,0 minus the high volatility sub-sample’smean ROEi,s −ROEi,0. Panel D plots the high ERC1 sub-sample’s mean ROEi,s −ROEi,0
minus the low ERC1 sub-sample’s mean ROEi,s −ROEi,0. The dashed lines denote the 95%confidence interval for this difference in differences.
37
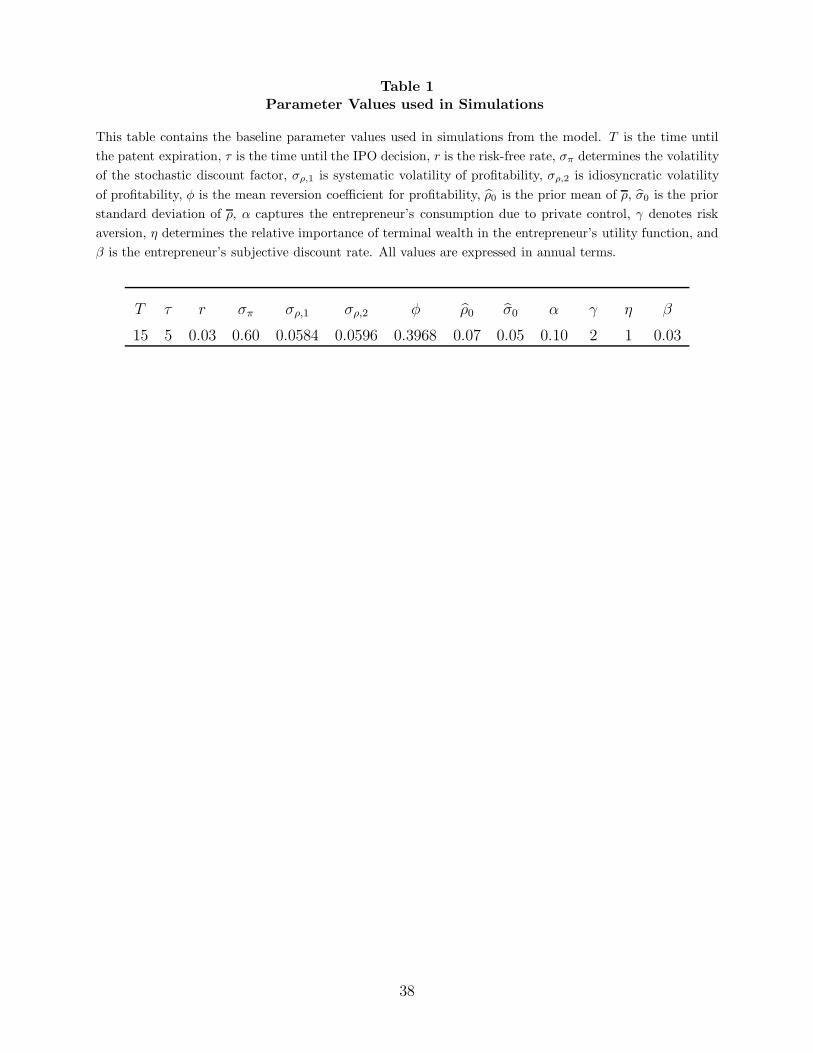
Table 1Parameter Values used in Simulations
This table contains the baseline parameter values used in simulations from the model. T is the time untilthe patent expiration, τ is the time until the IPO decision, r is the risk-free rate, σπ determines the volatilityof the stochastic discount factor, σρ,1 is systematic volatility of profitability, σρ,2 is idiosyncratic volatilityof profitability, φ is the mean reversion coefficient for profitability, ρ0 is the prior mean of ρ, σ0 is the priorstandard deviation of ρ, α captures the entrepreneur’s consumption due to private control, γ denotes riskaversion, η determines the relative importance of terminal wealth in the entrepreneur’s utility function, andβ is the entrepreneur’s subjective discount rate. All values are expressed in annual terms.
T τ r σπ σρ,1 σρ,2 φ ρ0 σ0 α γ η β
15 5 0.03 0.60 0.0584 0.0596 0.3968 0.07 0.05 0.10 2 1 0.03
38
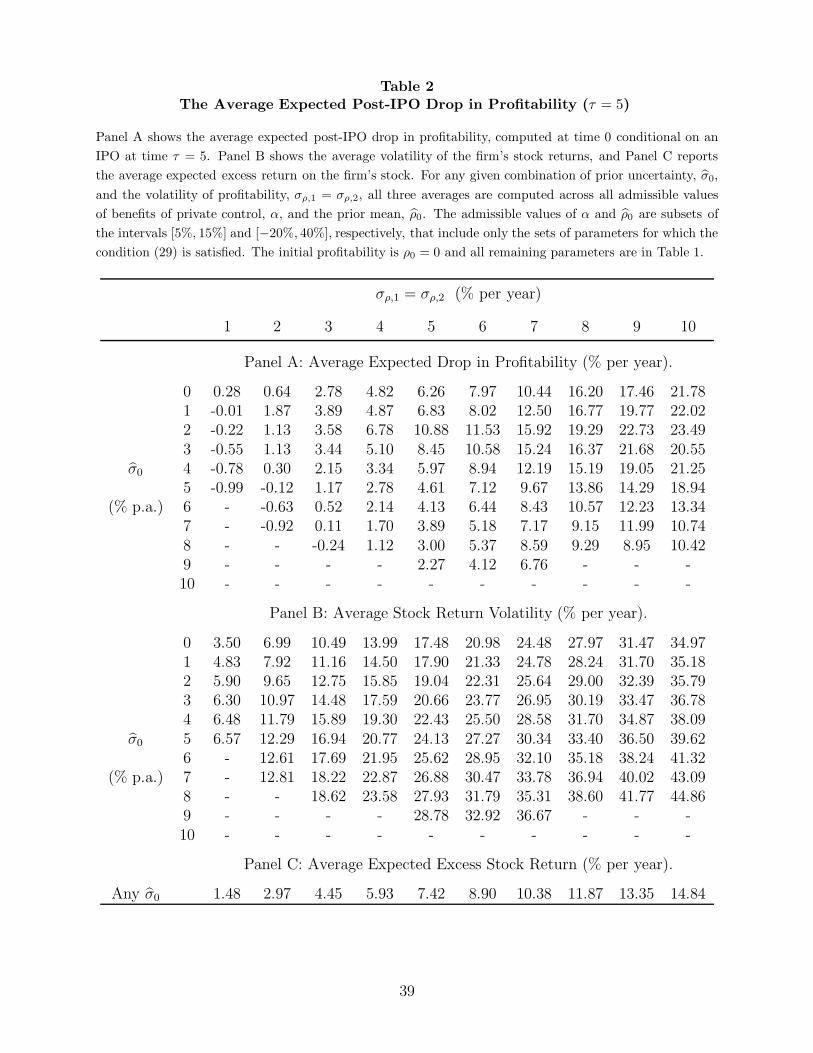
Table 2The Average Expected Post-IPO Drop in Profitability (τ = 5)
Panel A shows the average expected post-IPO drop in profitability, computed at time 0 conditional on anIPO at time τ = 5. Panel B shows the average volatility of the firm’s stock returns, and Panel C reportsthe average expected excess return on the firm’s stock. For any given combination of prior uncertainty, σ0,and the volatility of profitability, σρ,1 = σρ,2, all three averages are computed across all admissible valuesof benefits of private control, α, and the prior mean, ρ0. The admissible values of α and ρ0 are subsets ofthe intervals [5%, 15%] and [−20%, 40%], respectively, that include only the sets of parameters for which thecondition (29) is satisfied. The initial profitability is ρ0 = 0 and all remaining parameters are in Table 1.
σρ,1 = σρ,2 (% per year)
1 2 3 4 5 6 7 8 9 10
Panel A: Average Expected Drop in Profitability (% per year).
0 0.28 0.64 2.78 4.82 6.26 7.97 10.44 16.20 17.46 21.781 -0.01 1.87 3.89 4.87 6.83 8.02 12.50 16.77 19.77 22.022 -0.22 1.13 3.58 6.78 10.88 11.53 15.92 19.29 22.73 23.493 -0.55 1.13 3.44 5.10 8.45 10.58 15.24 16.37 21.68 20.55
σ0 4 -0.78 0.30 2.15 3.34 5.97 8.94 12.19 15.19 19.05 21.255 -0.99 -0.12 1.17 2.78 4.61 7.12 9.67 13.86 14.29 18.94
(% p.a.) 6 - -0.63 0.52 2.14 4.13 6.44 8.43 10.57 12.23 13.347 - -0.92 0.11 1.70 3.89 5.18 7.17 9.15 11.99 10.748 - - -0.24 1.12 3.00 5.37 8.59 9.29 8.95 10.429 - - - - 2.27 4.12 6.76 - - -10 - - - - - - - - - -
Panel B: Average Stock Return Volatility (% per year).
0 3.50 6.99 10.49 13.99 17.48 20.98 24.48 27.97 31.47 34.971 4.83 7.92 11.16 14.50 17.90 21.33 24.78 28.24 31.70 35.182 5.90 9.65 12.75 15.85 19.04 22.31 25.64 29.00 32.39 35.793 6.30 10.97 14.48 17.59 20.66 23.77 26.95 30.19 33.47 36.784 6.48 11.79 15.89 19.30 22.43 25.50 28.58 31.70 34.87 38.09
σ0 5 6.57 12.29 16.94 20.77 24.13 27.27 30.34 33.40 36.50 39.626 - 12.61 17.69 21.95 25.62 28.95 32.10 35.18 38.24 41.32
(% p.a.) 7 - 12.81 18.22 22.87 26.88 30.47 33.78 36.94 40.02 43.098 - - 18.62 23.58 27.93 31.79 35.31 38.60 41.77 44.869 - - - - 28.78 32.92 36.67 - - -10 - - - - - - - - - -
Panel C: Average Expected Excess Stock Return (% per year).
Any σ0 1.48 2.97 4.45 5.93 7.42 8.90 10.38 11.87 13.35 14.84
39

Table 3The Average Expected Post-IPO Drop in Profitability (τ = 7)
Panel A shows the average expected post-IPO drop in profitability, computed at time 0 conditional on anIPO at time τ = 7. Panel B shows the average volatility of the firm’s stock returns, and Panel C reportsthe average expected excess return on the firm’s stock. For any given combination of prior uncertainty, σ0,and the volatility of profitability, σρ,1 = σρ,2, all three averages are computed across all admissible valuesof benefits of private control, α, and the prior mean, ρ0. The admissible values of α and ρ0 are subsets ofthe intervals [5%, 15%] and [−20%, 40%], respectively, that include only the sets of parameters for which thecondition (29) is satisfied. The initial profitability is ρ0 = 0 and all remaining parameters are in Table 1.
σρ,1 = σρ,2 (% per year)
1 2 3 4 5 6 7 8 9 10
Panel A: Average Expected Drop in Profitability (% per year).
0 0.09 1.14 2.94 5.15 6.87 9.24 10.78 13.25 13.69 12.921 -0.15 0.62 2.34 4.61 6.39 8.72 10.42 12.82 14.77 12.782 -0.01 1.42 2.57 3.96 6.01 7.39 9.26 11.74 13.81 13.403 -0.14 0.85 2.03 4.17 4.83 6.32 9.16 9.94 13.59 12.27
σ0 4 -0.22 0.46 1.73 2.27 4.04 5.91 8.03 9.16 12.87 14.715 -0.28 0.30 1.13 2.27 3.57 5.25 6.95 10.05 10.37 14.09
(% p.a.) 6 - 0.00 0.80 1.95 3.61 5.33 6.82 8.30 9.51 10.387 - -0.10 0.63 1.87 3.60 4.76 7.04 7.95 10.29 9.048 - - 0.52 1.57 3.12 5.09 7.93 8.61 8.47 10.509 - - - - 2.70 4.20 6.57 - - -10 - - - - - - - - - -
Panel B: Average Stock Return Volatility (% per year).
0 3.42 6.83 10.25 13.66 17.08 20.49 23.91 27.32 30.74 34.151 4.23 7.47 10.72 14.03 17.38 20.75 24.12 27.51 30.91 34.312 4.72 8.45 11.73 14.94 18.17 21.44 24.74 28.06 31.40 34.763 4.88 9.09 12.68 15.99 19.20 22.41 25.64 28.89 32.16 35.464 4.95 9.44 13.37 16.91 20.23 23.46 26.67 29.88 33.10 36.34
σ0 5 4.98 9.64 13.84 17.63 21.13 24.47 27.72 30.93 34.14 37.356 - 9.76 14.16 18.17 21.88 25.36 28.71 31.97 35.19 38.40
(% p.a.) 7 - 9.84 14.37 18.57 22.47 26.12 29.59 32.94 36.22 39.458 - - 14.53 18.87 22.93 26.74 30.35 33.81 37.17 40.469 - - - - 23.30 27.26 31.00 - - -10 - - - - - - - - - -
Panel C: Average Expected Excess Stock Return (% per year).
Any σ0 1.45 2.90 4.35 5.80 7.24 8.69 10.14 11.59 13.04 14.49
40
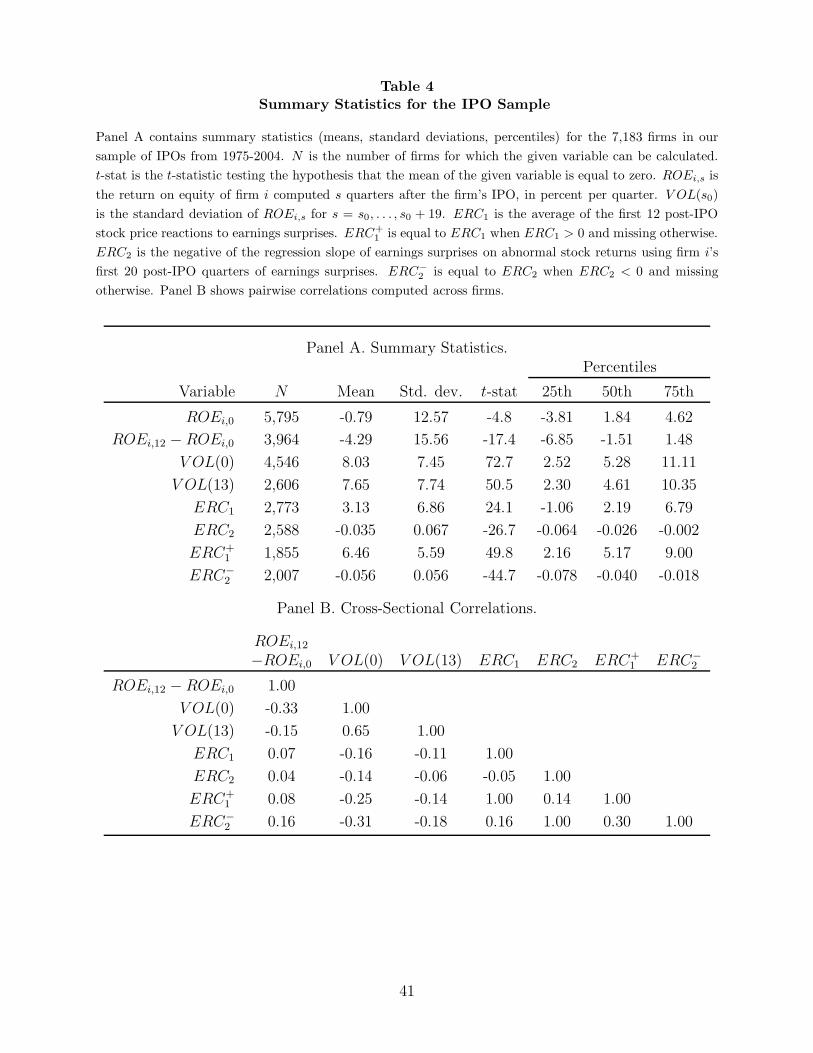
Table 4Summary Statistics for the IPO Sample
Panel A contains summary statistics (means, standard deviations, percentiles) for the 7,183 firms in oursample of IPOs from 1975-2004. N is the number of firms for which the given variable can be calculated.t-stat is the t-statistic testing the hypothesis that the mean of the given variable is equal to zero. ROEi,s isthe return on equity of firm i computed s quarters after the firm’s IPO, in percent per quarter. V OL(s0)is the standard deviation of ROEi,s for s = s0, . . . , s0 + 19. ERC1 is the average of the first 12 post-IPOstock price reactions to earnings surprises. ERC+
1 is equal to ERC1 when ERC1 > 0 and missing otherwise.ERC2 is the negative of the regression slope of earnings surprises on abnormal stock returns using firm i’sfirst 20 post-IPO quarters of earnings surprises. ERC−
2 is equal to ERC2 when ERC2 < 0 and missingotherwise. Panel B shows pairwise correlations computed across firms.
Panel A. Summary Statistics.Percentiles
Variable N Mean Std. dev. t-stat 25th 50th 75th
ROEi,0 5,795 -0.79 12.57 -4.8 -3.81 1.84 4.62
ROEi,12 − ROEi,0 3,964 -4.29 15.56 -17.4 -6.85 -1.51 1.48
V OL(0) 4,546 8.03 7.45 72.7 2.52 5.28 11.11
V OL(13) 2,606 7.65 7.74 50.5 2.30 4.61 10.35
ERC1 2,773 3.13 6.86 24.1 -1.06 2.19 6.79
ERC2 2,588 -0.035 0.067 -26.7 -0.064 -0.026 -0.002
ERC+1 1,855 6.46 5.59 49.8 2.16 5.17 9.00
ERC−2 2,007 -0.056 0.056 -44.7 -0.078 -0.040 -0.018
Panel B. Cross-Sectional Correlations.
ROEi,12
−ROEi,0 V OL(0) V OL(13) ERC1 ERC2 ERC+1 ERC−
2
ROEi,12 − ROEi,0 1.00
V OL(0) -0.33 1.00
V OL(13) -0.15 0.65 1.00
ERC1 0.07 -0.16 -0.11 1.00
ERC2 0.04 -0.14 -0.06 -0.05 1.00
ERC+1 0.08 -0.25 -0.14 1.00 0.14 1.00
ERC−2 0.16 -0.31 -0.18 0.16 1.00 0.30 1.00
41
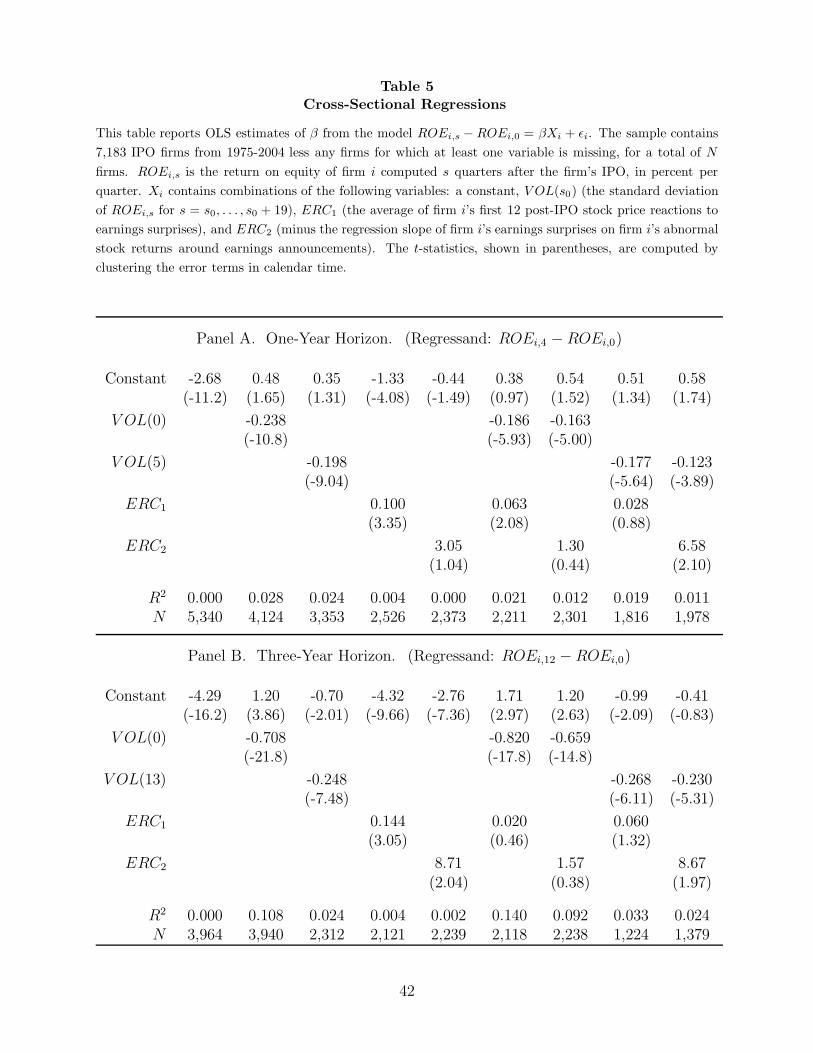
Table 5Cross-Sectional Regressions
This table reports OLS estimates of β from the model ROEi,s − ROEi,0 = βXi + εi. The sample contains7,183 IPO firms from 1975-2004 less any firms for which at least one variable is missing, for a total of N
firms. ROEi,s is the return on equity of firm i computed s quarters after the firm’s IPO, in percent perquarter. Xi contains combinations of the following variables: a constant, V OL(s0) (the standard deviationof ROEi,s for s = s0, . . . , s0 + 19), ERC1 (the average of firm i’s first 12 post-IPO stock price reactions toearnings surprises), and ERC2 (minus the regression slope of firm i’s earnings surprises on firm i’s abnormalstock returns around earnings announcements). The t-statistics, shown in parentheses, are computed byclustering the error terms in calendar time.
Panel A. One-Year Horizon. (Regressand: ROEi,4 − ROEi,0)
Constant -2.68 0.48 0.35 -1.33 -0.44 0.38 0.54 0.51 0.58(-11.2) (1.65) (1.31) (-4.08) (-1.49) (0.97) (1.52) (1.34) (1.74)
V OL(0) -0.238 -0.186 -0.163(-10.8) (-5.93) (-5.00)
V OL(5) -0.198 -0.177 -0.123(-9.04) (-5.64) (-3.89)
ERC1 0.100 0.063 0.028(3.35) (2.08) (0.88)
ERC2 3.05 1.30 6.58(1.04) (0.44) (2.10)
R2 0.000 0.028 0.024 0.004 0.000 0.021 0.012 0.019 0.011N 5,340 4,124 3,353 2,526 2,373 2,211 2,301 1,816 1,978
Panel B. Three-Year Horizon. (Regressand: ROEi,12 − ROEi,0)
Constant -4.29 1.20 -0.70 -4.32 -2.76 1.71 1.20 -0.99 -0.41(-16.2) (3.86) (-2.01) (-9.66) (-7.36) (2.97) (2.63) (-2.09) (-0.83)
V OL(0) -0.708 -0.820 -0.659(-21.8) (-17.8) (-14.8)
V OL(13) -0.248 -0.268 -0.230(-7.48) (-6.11) (-5.31)
ERC1 0.144 0.020 0.060(3.05) (0.46) (1.32)
ERC2 8.71 1.57 8.67(2.04) (0.38) (1.97)
R2 0.000 0.108 0.024 0.004 0.002 0.140 0.092 0.033 0.024N 3,964 3,940 2,312 2,121 2,239 2,118 2,238 1,224 1,379
42

Table 6Cross-Sectional Regressions, Excluding ERCs with Unpredicted Signs
This table reports OLS estimates of β from the model ROEi,s − ROEi,0 = βsXi + εi. The sample contains7,183 IPO firms from 1975-2004 less any firms for which at least one variable is missing, for a total of N
firms. ROEi,s is the return on equity of firm i computed s quarters after the firm’s IPO, in percent perquarter. Xi contains combinations of the following variables: a constant, V OL(s0) (the standard deviationof ROEi,s for s = s0, . . . , s0 + 19), ERC+
1 (the average of firm i’s first 12 post-IPO stock price reactions toearnings surprises, excluding negative values), and ERC−
2 (minus the regression slope of firm i’s earningssurprises on firm i’s abnormal stock returns around earnings announcements, excluding positive values). Thet-statistics, shown in parentheses, are computed by clustering the error terms in calendar time.
Panel A. One-Year Horizon. (Regressand: ROEi,4 − ROEi,0)
Constant -2.68 0.48 0.35 -1.76 -0.07 -0.55 0.68 -0.43 0.66(-11.2) (1.65) (1.31) (-4.87) (-0.18) (-1.08) (1.62) (-0.86) (1.65)
V OL(0) -0.238 -0.092 -0.167(-10.8) (-2.46) (-4.23)
V OL(5) -0.198 -0.118 -0.098(-9.04) (-3.26) (-2.64)
ERC+1 0.164 0.111 0.101
(3.87) (2.51) (2.24)
ERC−2 9.09 3.97 11.34
(2.30) (0.93) (2.69)
R2 0.000 0.028 0.024 0.009 0.003 0.011 0.014 0.016 0.013N 5,340 4,124 3,353 1,692 1,847 1,484 1,789 1,230 1,554
Panel B. Three-Year Horizon. (Regressand: ROEi,12 − ROEi,0)
Constant -4.29 1.20 -0.70 -4.60 -0.83 1.26 1.51 -0.86 0.19(-16.2) (3.86) (-2.01) (-8.51) (-1.78) (1.58) (3.21) (-1.54) (0.38)
V OL(0) -0.708 -0.688 -0.545(-21.8) (-12.4) (-10.6)
V OL(13) -0.248 -0.230 -0.157(-7.48) (-5.01) (-3.41)
ERC+1 0.203 0.001 0.045
(3.08) (0.01) (0.78)
ERC−2 36.48 18.55 25.52
(6.68) (3.34) (4.77)
R2 0.000 0.108 0.024 0.007 0.025 0.106 0.083 0.031 0.036N 3,964 3,940 2,312 1,425 1,747 1,424 1,747 832 1,094
43

REFERENCES
Asquith, Paul, and David W. Mullins, 1986, “Equity issues and offering dilution”, Journalof Financial Economics 15, 61–89.
Ball, Ray, and Lakshmanan Shivakumar, 2006, “Earnings quality at initial public offerings”,Working paper, University of Chicago.
Beaver, William H., 1970, “The time series behavior of earnings”, Journal of AccountingResearch 8, 62–89.
Benninga, Simon, Mark Helmantel, and Oded Sarig, 2005, “The timing of initial publicofferings”, Journal of Financial Economics 75, 115–132.
Bharath, Sreedhar T., and Amy K. Dittmar, 2006, “To Be or Not to Be (Public)”, Workingpaper, University of Michigan.
Bodnaruk, Andriy, Eugene Kandel, Massimo Massa, and Andrei Simonov, 2006, “Share-holder diversification and the decision to go public”, Review of Financial Studies, forth-coming.
Brau, James C., and Stanley E. Fawcett, 2006, “Initial public offerings: An analysis of theoryand practice”, Journal of Finance 61, 399–436.
Brav, Alon, Christopher C. Geczy, and Paul A. Gompers, 2000, “Is the Abnormal ReturnFollowing Equity Issuances Anomalous?”, Journal of Financial Economics 56, 209-249.
Brav, Alon, and Paul A. Gompers, 1997, “Myth or reality? The long-run underperformanceof initial public offerings: Evidence from venture and nonventure capital-backed compa-nies”, Journal of Finance 52, 1791–1821.
Chemmanur, Thomas J., and Paolo Fulghieri, 1999, “A Theory of the Going-Public Deci-sion,” Review of Financial Studies 12, 249–279.
Cox, John C., and Chi-fu Huang, 1989, “Optimal consumption and portfolio choices whenasset prices follow a diffusion process”, Journal of Economic Theory 49, 33–83.
Degeorge, Francois, and Richard Zeckhauser, 1993, “The reverse LBO decision and firmperformance: Theory and evidence”, Journal of Finance 48, 1323–1348.
Dyck, Alexander, and Luigi Zingales, 2004, “Private Benefits of Control: An InternationalComparison”, Journal of Finance 59, 537–600.
Easton, Peter D., and Mark E. Zmijewski, 1989, “Cross-Sectional Variation in the StockMarket Response to the Announcement of Accounting Earnings,” Journal of Accountingand Economics 11, 117–141.
Fama, Eugene F. and Kenneth R. French, 1993, “Common risk factors in the returns onstocks and bonds”, Journal of Financial Economics 33, 3–56.
Fama, Eugene F., and Kenneth R. French, 2000, “Forecasting profitability and earnings”,Journal of Business 73, 161–175.
44

Fama, Eugene F. and Kenneth R. French, 2004, “New Lists: Fundamentals and SurvivalRates”, Journal of Financial Economics 72, 229–269.
Graham, John R., Cam Harvey, and Shiva Rajgopal, 2005, “The Economic Implications ofCorporate Financial Reporting”, Journal of Accounting and Economics 40, 3–73.
Halpern, Paul, Robert Kieschnick, and Wendy Rotenberg, 1999, “On the heterogeneity ofleveraged going private transactions,” Review of Financial Studies 12, 281–309.
Jain, Bharat A., and Omesh Kini, 1994, “The post-issue operating performance of IPOfirms”, Journal of Finance 49, 1699–1726.
Leland, Hayne E., and David H. Pyle, 1977, “Informational asymmetries, financial structure,and financial intermediation”, Journal of Finance 32, 371–387.
Lerner, Joshua, 1994, “Venture capitalists and the decision to go public”, Journal of Finan-cial Economics 35, 293–316.
Li, Erica X. N., Dmitry Livdan, and Lu Zhang, 2006, “Optimal market timing”, Workingpaper, University of Rochester.
Loughran, Tim, and Jay R. Ritter, 1995, “The new issues puzzle”, Journal of Finance 50,23–51.
Loughran, Tim, and Jay R. Ritter, 1997, “The operating performance of firms conductingseasoned equity offerings”, Journal of Finance 52, 1823–1850.
Loughran, Tim, and Jay R. Ritter, 2004, “Why has IPO underpricing changed over time?”,Financial Management 33, 5–37.
Mikkelson, Wayne H., M. Megan Partch, and Kshitij Shah, 1997, “Ownership and operatingperformance of companies that go public”, Journal of Financial Economics 44, 281–307.
Pagano, Marco, Fabio Panetta, and Luigi Zingales, 1998, “Why do companies go public? Anempirical analysis”, Journal of Finance 53, 27–64.
Pastor, Lubos, and Pietro Veronesi, 2003, “Stock valuation and learning about profitability”,Journal of Finance 58, 1749–1789.
Pastor, Lubos, and Pietro Veronesi, 2005, “Rational IPO waves”, Journal of Finance 60,1713–1757.
Pastor, Lubos, and Pietro Veronesi, 2006, “Was there a Nasdaq bubble in the late 1990s?”,Journal of Financial Economics 81, 61–100.
Ritter, Jay R., 1991, “The long-run performance of initial public offerings”, Journal ofFinance 46, 3–27.
Teoh, Siew Hong, Ivo Welch, and T. J. Hong, 1998, “Earnings management and the long-runmarket performance of initial public offerings ”, Journal of Finance 53, 1935–1974.
Zingales, Luigi, 1995, “Insider ownership and the decision to go public”, Review of EconomicStudies 62, 425–448.
45