enterprise risk management initiative report · enterprise risk management initiative report office...
TRANSCRIPT
Enterprise Risk Management Initiative Report Office of Risk Management November2012

This page is intentionally left blank.

EnterpriseRiskManagementInitiativeReport
3 Office of Risk Management
Table of Contents
1. EXECUTIVE SUMMARY ........................................................................................................... 5
2. PROJECT CHARGE .................................................................................................................... 7
3. BACKGROUND .......................................................................................................................... 8
3.1 ERM Concepts & Framework ......................................................................................................... 8
3.2 A Successful ERM Program ........................................................................................................... 9
3.3 ERM Benefits and Challenges ........................................................................................................ 9
4. PROCESS ................................................................................................................................... 11
4.1 ERM Orientation ........................................................................................................................... 12
4.2 Risk Identification ......................................................................................................................... 12
4.3 Risk Assessment ........................................................................................................................... 12
4.4 Risk Descriptions .......................................................................................................................... 15
4.5 Limitations .................................................................................................................................... 16
5. RESULTS ................................................................................................................................... 17
5.1 Risk Ranking – Impact / Likelihood Assessment ......................................................................... 17
5.2 Risk Ranking - Strategic Risk Evaluation ..................................................................................... 19
5.3 Risk Ranking Comparison ............................................................................................................ 21
6. RECOMMENDATIONS ............................................................................................................ 22
6.1 Recommended Next Steps ............................................................................................................ 22
APPENDICES ........................................................................................................................................... i
Appendix 1 ERM Representatives .................................................................................................. ii
Appendix 2 Risk Model ................................................................................................................. iv
Appendix 3 Sample Risk Survey .................................................................................................... v
Appendix 4 ERM Group Session Workshop ................................................................................ vii
Appendix 5 Risk Profile .................................................................................................................. x
Appendix 6 Risk Ranking Comparison ........................................................................................ xiv
Appendix 7 Heat Map from PricewaterhouseCoopers (PwC) ..................................................... xvi
Appendix 8 Risk Register from Education Advisory Board ....................................................... xvii
Appendix 9 Preliminary Risk Description .................................................................................... xx
Appendix 10 Glossary .................................................................................................................. xxvi

This page is intentionally left blank.

EnterpriseRiskManagementInitiativeReport
5 Office of Risk Management
1. EXECUTIVE SUMMARY Enterprise Risk Management is a coordinated approach to assess, analyze, mitigate and monitor risks and opportunities that affect the achievement of the University’s strategic objectives. Unlike traditional risk management, Enterprise risk management (ERM) focuses on strategy and expands the traditional risk-management process to include all risks not just those associated with accidental losses. It is intended to move organizations away from a fragmented, ad hoc and reactive process to one that actively communicates risks across divisions and identifies enterprise wide solutions.
The Office of Risk Management was charged with beginning the process of developing an ERM framework including the creation of an initial risk profile for the University. This risk profile was developed in collaboration with 52 senior managers representing major functional areas from across the campus. The process was designed to increase participant’s awareness and knowledge of ERM, result in the identification and assessment of institutional risks, and facilitate discussion of those risks across organizational boundaries. Process included five steps as summarized below.
1. ERM orientation facilitated by Dr. Paul Walker, consultant and professor of Enterprise Risk Management at the University of Virginia.
2. Electronic Survey of representatives that identified 196 risks
3. Combining and categorizing risks to create initial risk profile
4. 2nd electronic survey to identify top 32 risks
5. Series of four workshops to rank risks using two methodologies - an impact / likelihood assessment and a strategic risk evaluation that focused on the transformational outcomes identified in the strategic plan.
The ERM group sessions assessed the top 32 risks, as identified during the survey process, using two methodologies. The first, or primary method, was based on the estimated likelihood and impact (financial, reputational, and health) of the event. The second, referred to as a strategic risk
ERM Group Session Workshop
Electronic Survey II: Risk Ranking
Initial Risk Profile
Electronic Survey I: Risk Identification
ERM Orientation

EnterpriseRiskManagementInitiativeReport
Office of Risk Management 6
evaluation, ranked risks based on potential for impacting the four transformational outcomes identified in the UMD Strategic Plan. While the impact / likelihood assessment is used as a primary risk assessment approach, the strategic risk evaluation provides additional perspective on how these risks were viewed by the working groups.
Recommendations
This project was an initial step in the development of an ERM system. Based on this effort it is recommended that the process of developing and implementing an ERM system continues using the recommendations below as a starting point.
1. Conduct a risk identification and prioritization exercise for senior leadership.
2. Establish an institutional risk philosophy emphasizing that the University accepts that successful risk taking is necessary for the University to achieve its objectives and that the University seeks to be risk-aware but not risk-averse.
3. Establish roles and responsibilities for risk management including the role of a Risk Officer and a Risk Oversight Group.
4. Implement process for ongoing high level monitoring of critical risks
5. Incorporate principles of ERM at the development stage for new University initiatives.
METHODOLOGY 1: LIKELIHOOD & IMPACT
METHODOLOGY 2: STRATEGIC RISK EVALUATION
Rank Risk Theme Risk Theme 1 Facility Maintenance and Renewal Recruitment and Retention 2 Criminal Activities Stagnated Salaries and Pay Disparities 3 IT Security State Budget Reduction 4 State Budget Reduction Facility Maintenance and Renewal 5 Emergency Management Campus Experience 6 Growing Student Population Criminal Activities 7 Education Innovation Extramural Funding from Federal Agencies 8 Campus Experience Culture of “Risk Aversion” 9 Hyper-Bureaucratization Technology Infrastructure and Unification of
Applications 10 Stagnated Salaries & Pay Disparities Education Innovation

EnterpriseRiskManagementInitiativeReport
7 Office of Risk Management
2. PROJECT CHARGE
2.1 Purpose
Enterprise Risk Management is a coordinated approach to assess, analyze, mitigate and monitor risks and opportunities that affect the achievement of the University’s strategic and financial objectives. Historically, risks have been viewed as something to avoid or eliminate. Enterprise Risk Management (ERM) takes a broader view to evaluate risks and opportunities. It should be thought of as a tool or approach to improve decision making and resource allocation rather than as a separate administrative process.
2.2 Charge
The Office of Risk Management was charged with beginning the process of developing a culture of ERM and creating an initial risk profile for the University. Specifically we were asked to:
• Identify representatives from each of the major functional areas of the University
• Conduct information sessions to raise the representatives’ understanding of ERM
• Ensure the process encouraged and facilitated conversations across divisional boundaries
• Identify and rank the top risks facing the University
• Make recommendations for further development of ERM at UMD

EnterpriseRiskManagementInitiativeReport
Office of Risk Management 8
3. BACKGROUND In the 1980’s, long before the Sarbanes-Oxley Act of 2002 (SOX), several significant failures occurred as a result of high-risk financing strategies. These failures, among others, have placed a greater focus on improving overall risk management practices for organizations of all types, including institutions of higher learning. Several organizations related to educational institutions, such as the National Association of College and University Business Officers (NACUBO) and the Association of College and University Auditors (ACUA), have recognized the need for more effective risk management practices. These organizations have tracked ERM - related process in the broader corporate sector to transfer many of those concepts to institutions of higher education.
3.1 ERM Concepts & Framework
Risk can be defined as any issue that impacts an institutions ability to meet its objectives. Enterprise Risk Management provides a framework for managing risk, and involves identifying particular events or circumstances (risks and opportunities) relevant to the organization's objectives; assessing them in terms of likelihood and magnitude of impact; determining a response strategy and monitoring progress. By anticipating, identifying and addressing risks and opportunities the institution is able to provide a reasonable assurance regarding the achievement of the entity’s objectives.
The Risk Management Framework developed by the joint committee formed by Australia and New Zealand, and revised by University Risk Management and Insurance Association (URMIA) provides a succinct overview of the ERM process and supporting elements.

EnterpriseRiskManagementInitiativeReport
9 Office of Risk Management
3.2 A Successful ERM Program
As ERM is a process, implementation of this process requires time, patience and persistence. Success of the program relies upon:
Top level support – senior leadership must create an ERM culture by setting a clear mandate for ERM within the University
Clear roles and responsibilities and assigned accountability for critical risks
Establishing an effective process and follow-through for identifying, assessing, mitigating, and monitoring of critical risks
Linking ERM to strategic planning and decision making
Sufficient resources – Ensure sufficient resources and staff to develop underlying processes, policies, and procedures
Establishing a risk aware culture with strong campus buy-in – risk awareness / policies become embedded in all layers of the university rather than being viewed as an issue for Risk Management
3.3 ERM Benefits and Challenges
Benefits – Some of the many reasons for implementing an ERM structure are:
To effectively manage risks and opportunities through better alignment of limited resources.
To sustain competitive advantage over competition
Improved communication about risk among senior leaders and Regents which lead to more informed decisions, better allocation of resources and stronger governance practices
To improve strategic planning efforts
To solidify the institution’s integrity and reputation
To avoid financial surprises
To be able to respond effectively when a significant event occurs
To respond effectively to the increasing number and diversity of risks

EnterpriseRiskManagementInitiativeReport
Office of Risk Management 10
Challenges – Some of the challenges faced with an ERM structure are:
Devising a straight forward way to explain ERM to people with widely different skills, experience and interest regardless of business function or experience with risk management
Getting non-risk managers to move beyond their definition of managing risk as a safety program or an insurance/workers’ compensation program into a broader understanding of risk management as a set of principles and tools that can be applied to reach program goals
With limited resources and the current economic climate, old patterns of reactive crisis management for managing the crisis may resurface
Establishing a common risk language or glossary
Identifying and describing the risks in a risk inventory
Implementing a risk-ranking methodology to prioritize risks within and across functions
Establishing ownership for particular risks and responses
Developing action plans to ensure the risks are appropriately managed
Monitoring the results of actions taken to mitigate risk

EnterpriseRiskManagementInitiativeReport
11 Office of Risk Management
4. PROCESS The chart below represents the basic structure and process used by the University of Maryland to initiate the Enterprise Risk Management system. It can be also summarized into 3 major steps - risk identification, risk assessment, and risk recommendation. This section will have a detailed discussion on how our structure and process fit into the 3 steps and what are the methodologies used to build the university’s risk profile.
ERM Group Session Workshop
4 different group sessions with approximately 12 senior managers to assess 8 randomized risks from the top 32 risks identified
Electronic Survey 2: Risk Ranking
Risk Ranking Survey is sent to senior operational management to identifiy top 32 risks from the ERM Group Session discussions
Initial Risk Profile
Office of Risk Management compiled risks from the first survey and classified 71 risks into 7 categories.
Electronic Survey I: Risk Identification
Collected 196 risks identified from the cross functional group of senior operational management
UMD ERM Orientation
Introduced the concept of Enterprise Risk Management for 52 senior level managers and established goals and objectives and defined key ERM terms

EnterpriseRiskManagementInitiativeReport
Office of Risk Management 12
4.1 ERM Orientation
The Office of Risk Management initiated this project with an ERM orientation session for the 52 senior level managers who had agreed to act as “ERM representatives” for their operational area (see Appendix 1 for list of representatives). The session was facilitated by Dr. Paul Walker, consultant and professor of Enterprise Risk Management at the University of Virginia. It included an overview and discussion about ERM concepts, terms, goals and objectives as well as the role attendees had within the University’s ERM initiative. Orientation topics included an overview of ERM and best practices; and critical components of the ERM process: risk identification, assessment, mitigation and monitoring.
4.2 Risk Identification
UMD’s initial Risk Identification effort involved an on-line survey sent to the ERM representatives. Each representative was to provide 3-5 significant risks that could affect the University’s ability to achieve its objectives. Participants were provided a copy of the executive summary of the University’s strategic plan and encouraged to identify risks that they believed could impact accomplishment of the strategic initiatives and objectives identified in that document. See “Appendix 3 Sample Risk Survey”.
The ERM Risk Identification Survey identified 196 risks generated by the cross-functional senior management representatives. Submitted risks that were the same or similar in nature were combined, and 71 risks were finalized as UM Risk Profile (see “Appendix 3 Risk Profile”). The Office of Risk Management established 7 categories in which to separate the identified risks. Those categories included (A) Academics & Higher Education, (O) Campus Operations, (F) Financial, (H) Human Resources, (C) Compliance and Integrity, (I) Information Technology, and (M) Macro. See “Appendix 2 Risk Model” for more information on these categories.
4.3 Risk Assessment
4.3.1 Risk Ranking
A second online survey to rank the risks was sent to each representative. Each was asked to choose and rank the top 3 risks in each of the 7 categories and then identify the most critical risk from all of the number 1 risks chosen from each category.
Risk scores were calculated as follows:
3 2 1
A = counts of the risks ranked as # 1 among the surveys submitted
EnterpriseRiskManagementInitiativeReport
13 Office of Risk Management
B = counts of the risks ranked as #2 among the surveys submitted C = counts of the risks ranked as # 3 among the surveys submitted
Based on the risks scores, the number of times each risk was listed as being one of the top 3 overall risks, and number of risks under each category a list of 32 risks were identified for further discussion and assessment during the Group Sessions as described below. See “Appendix 3 Sample Risk Surveys” for more information about how the survey was designed.
4.3.2 ERM Group Session – Risk Assessment
The Office of Risk Management held 4 separate ERM Group Session Workshops, using two different approaches for risk assessment – Impact / likelihood assessment and strategic risk evaluation. See “Appendix 4 ERM Group Session Workshop” for detailed information on the planning and organization of the group sessions.
Impact / Likelihood Assessment
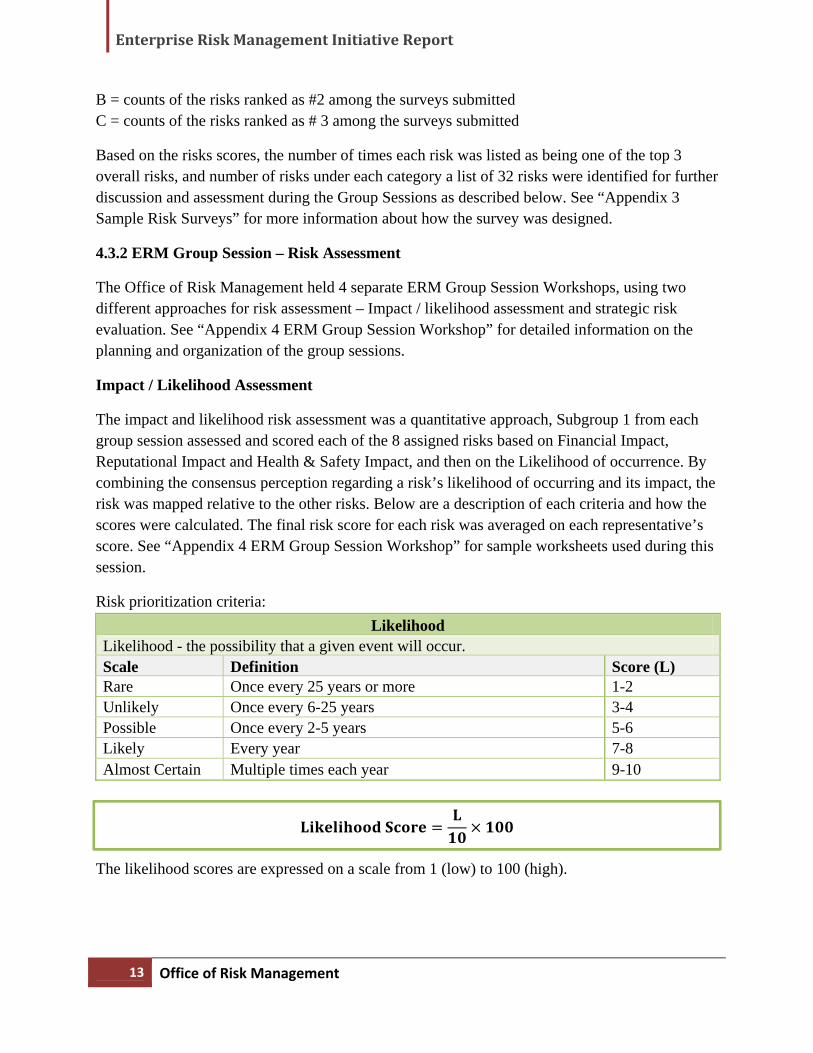
The impact and likelihood risk assessment was a quantitative approach, Subgroup 1 from each group session assessed and scored each of the 8 assigned risks based on Financial Impact, Reputational Impact and Health & Safety Impact, and then on the Likelihood of occurrence. By combining the consensus perception regarding a risk’s likelihood of occurring and its impact, the risk was mapped relative to the other risks. Below are a description of each criteria and how the scores were calculated. The final risk score for each risk was averaged on each representative’s score. See “Appendix 4 ERM Group Session Workshop” for sample worksheets used during this session.
Risk prioritization criteria:
Likelihood Likelihood - the possibility that a given event will occur. Scale Definition Score (L) Rare Once every 25 years or more 1-2 Unlikely Once every 6-25 years 3-4 Possible Once every 2-5 years 5-6 Likely Every year 7-8 Almost Certain Multiple times each year 9-10
The likelihood scores are expressed on a scale from 1 (low) to 100 (high).

EnterpriseRiskManagementInitiativeReport
Office of Risk Management 14
Risk prioritization criteria: Risk Impact
Financial Financial - includes physical and/or financial losses and damages to campus physical and environmental assets; events that affect profitability and efficiency, including loss of assets, and technology risks. Scale Definition Score (F) Catastrophic > $7M 9-10 Disastrous > $3M to $7M 7-8 Serious > $500K to $3M 5-6 Minor > $10K to $500K 3-4 Insignificant < $10K 1-2
Health and Safety Health and Safety - includes the possibility of injury, illness or death to the University community members, visitors or guests; events that affect the wellbeing of the community. Scale Definition Score (I) Catastrophic Multiple serious injuries or death 9-10 Disastrous Life-threatening injuries or illness 7-8 Serious Non-life-threatening injuries 5-6 Minor First aid only 3-4 Insignificant No medical treatment required 1-2
Reputational Reputational- includes events that affect the reputation and public perception of the University, including political issues and negative occurrences on campus.
Scale Definition Score (R) Catastrophic Significant negative external impact, long term 9-10 Disastrous Negative external impact, long term 7-8 Serious Negative external impact, short term 5-6 Minor Negative internal impact, long term 3-4 Insignificant Negative internal impact, short term 1-2
The impact scores are expressed on a scale from 1 (low) to 100 (high).
Risk Assessment Results:
The risk scores are also expressed on a scale from 1 (low) to 100 (high).

EnterpriseRiskManagementInitiativeReport
15 Office of Risk Management
Strategic Risk Evaluation
The strategic risk evaluation was the second methodology used for assessing risks during the group sessions. It was designed to explicitly link risks to the strategic objectives of the University and is intended to provide a different perspective as compared to likelihood and impact risk assessment methodology. See “Appendix 5 ERM Group Session Workshop” for sample worksheets used during this session.
Subgroup 2 from each group session assessed the risks based on the potential effect each had on the achievement of the 4 Transformational Outcomes (A Magnet for Exceptional Students, An International Center, A Vibrant Surrounding Community, A Catalyst for Economic Development and A Healthier Society) of the UM Strategic Plan (See the attached Strategic Risk Evaluation Worksheet in the Appendices).
Representatives in Subgroup II were asked to pick and rank the top 3 risks for each of the transformational outcomes among the set of 8 risks they were assigned. The risk score was calculated as follows:
3 2 1
A = counts of the risks ranked as # 1 among the group B = counts of the risks ranked as #2 among the group C = counts of the risks ranked as # 3 among the group
The final score of the risks were averaged by the number of representatives presented in each group session.
4.4 Risk Descriptions
Once results were calculated, the combined groups collectively provided risk descriptions on the top 1 or 2 critical risks identified by the two Subgroups. The discussion included examples of risk events identified with the critical risk, the identification of the primary risk owner(s), identification of the current controls in place, recommendations of possible risk response strategies, and suggestions of how the risk(s) might be monitored in the future. See “Appendix 9 Preliminary Risk Description” for a list of preliminary risk description on the top risks as a basis for risk recommendations.
EnterpriseRiskManagementInitiativeReport
Office of Risk Management 16
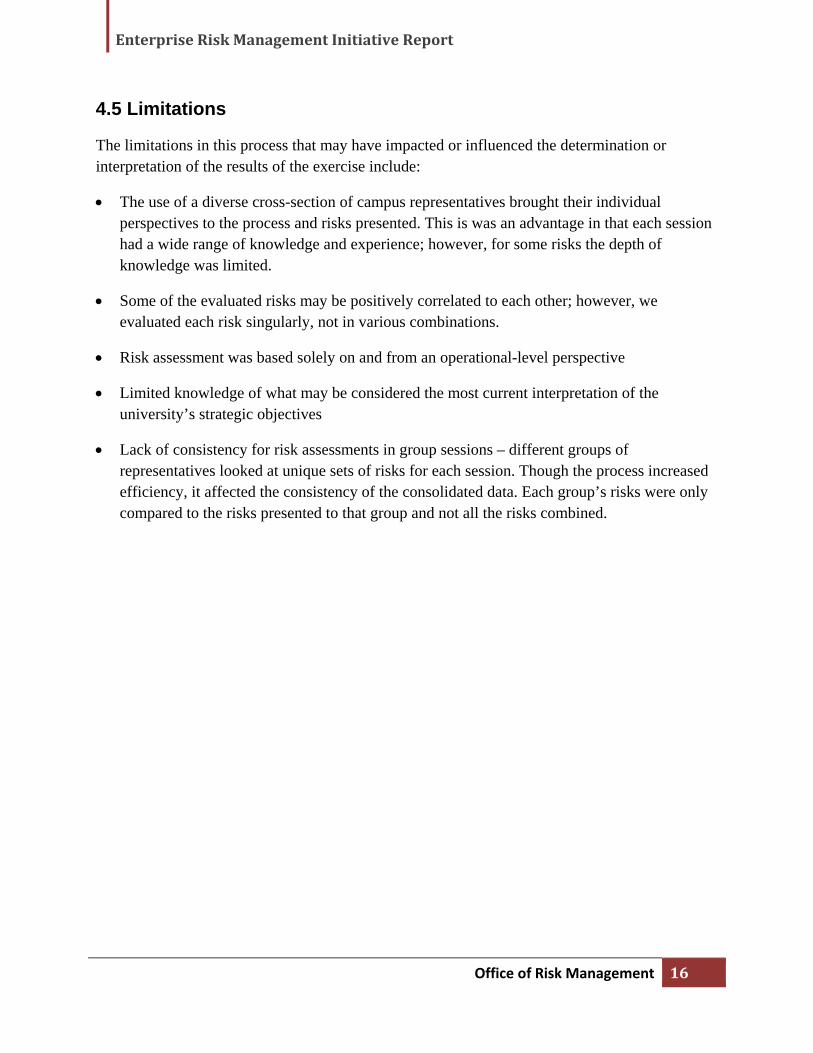
4.5 Limitations
The limitations in this process that may have impacted or influenced the determination or interpretation of the results of the exercise include:
The use of a diverse cross-section of campus representatives brought their individual perspectives to the process and risks presented. This is was an advantage in that each session had a wide range of knowledge and experience; however, for some risks the depth of knowledge was limited.
Some of the evaluated risks may be positively correlated to each other; however, we evaluated each risk singularly, not in various combinations.
Risk assessment was based solely on and from an operational-level perspective
Limited knowledge of what may be considered the most current interpretation of the university’s strategic objectives
Lack of consistency for risk assessments in group sessions – different groups of representatives looked at unique sets of risks for each session. Though the process increased efficiency, it affected the consistency of the consolidated data. Each group’s risks were only compared to the risks presented to that group and not all the risks combined.
EnterpriseRiskManagementInitiativeReport
17 Office of Risk Management
5. RESULTS The ERM Group Sessions conducted risk assessments through two different approaches as already mentioned on the “Process” section – impact / likelihood assessment, and strategic risk evaluation. While the impact / likelihood assessment is used as a primary risk assessment approach, the strategic risk evaluation provides a strategic perspective. This section covers the risk rankings resulted from the two assessments and also a comparison of the two rankings from each approach. Also “Appendix 8 Preliminary Risk Description” provided sample descriptions on top risks identified by the groups from the Group Sessions.
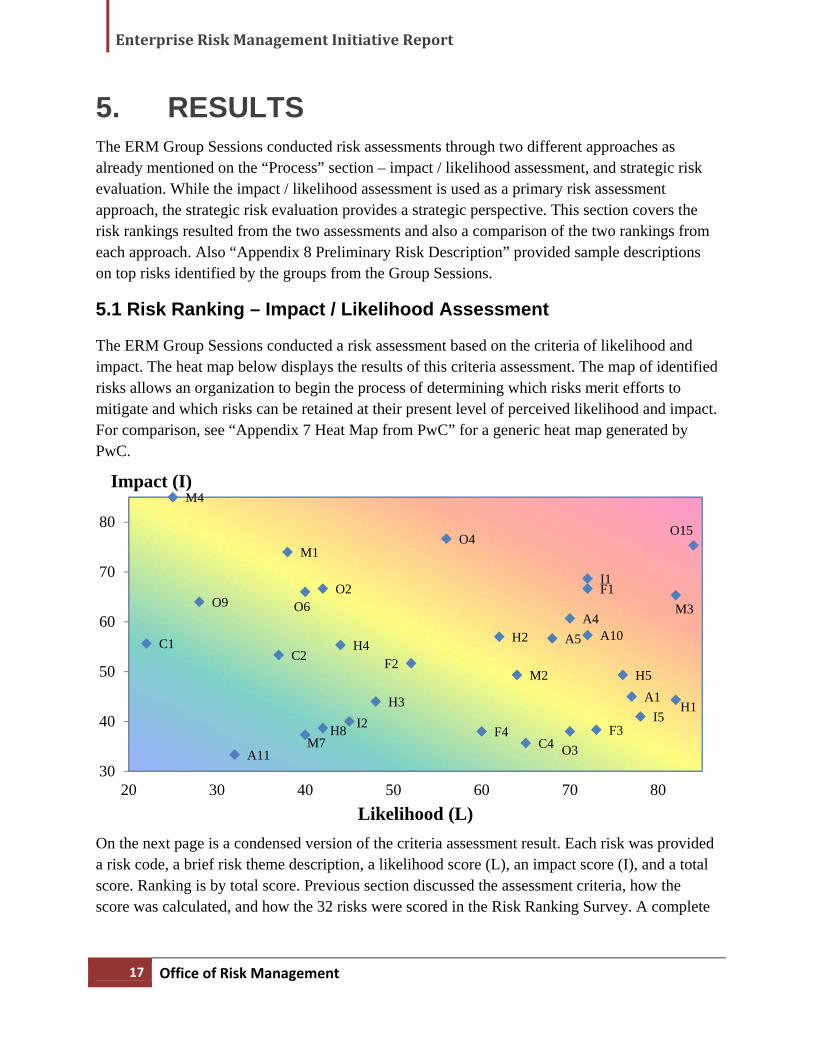
5.1 Risk Ranking – Impact / Likelihood Assessment
The ERM Group Sessions conducted a risk assessment based on the criteria of likelihood and impact. The heat map below displays the results of this criteria assessment. The map of identified risks allows an organization to begin the process of determining which risks merit efforts to mitigate and which risks can be retained at their present level of perceived likelihood and impact. For comparison, see “Appendix 7 Heat Map from PwC” for a generic heat map generated by PwC.
On the next page is a condensed version of the criteria assessment result. Each risk was provided a risk code, a brief risk theme description, a likelihood score (L), an impact score (I), and a total score. Ranking is by total score. Previous section discussed the assessment criteria, how the score was calculated, and how the 32 risks were scored in the Risk Ranking Survey. A complete
O15
M3
I1F1
O4
A4A10A5
H5
H1
H2
A1
I5
M2
M1
O2
F3
F2
O3
H4
C4F4
M4
H3
C2
O6
I2
O9
H8M7
C1
A1130
40
50
60
70
80
20 30 40 50 60 70 80
Impact (I)
Likelihood (L)

EnterpriseRiskManagementInitiativeReport
Office of Risk Management 18
list of the categorized risks with risk codes can be found in “Appendix 5 Risk Profile”. For comparison, see “Appendix 8 Risk Register from Education Advisory Board” for a list of institutional risks generated be Education Advisory Board.
Risk Ranking – Impact / Likelihood Assessment
Rank Code Risk Theme L I Score
1 O15 Facility Maintenance and Renewal 84 75 63
2 M3 Criminal Activities 82 65 54
3 I1 IT Security 72 69 49
4 F1 State Budget Reduction 72 67 48
5 O4 Emergency Management 56 77 43
6 A4 Growing Student Population 70 61 42
7 A10 Education Innovation 72 57 41
8 A5 Campus Experience 68 57 39
9 H5 Hyper-Bureaucratization 76 49 37
10 H1 Stagnated Salaries and Pay Disparities 82 44 36
11 H2 Recruitment and Retaining 62 57 35
11 A1 Student Fees and Tuition 77 45 35
13 I5 Technology Infrastructure and Unification of Applications 78 41 32
13 M2 Weather Incident 64 49 32
15 M1 Natural Disaster 38 74 28
15 O2 Incidents in Key Academic Building 42 67 28
15 F3 Resource Reallocation 73 38 28
18 F2 Extramural Funding from Federal Agencies 52 52 27
18 O3 Curriculum Setting / Program Offering 70 38 27
20 O6 Laboratory Accident 40 66 26
21 H4 Sexual Harassment, Discrimination and Retaliation 44 55 24
22 C4 Academic Honesty and Integrity 65 36 23
22 F4 Fraud 60 38 23
24 M4 Mass Casualty Event 25 85 21
24 H3 Succession Planning 48 44 21
26 C2 CPSR failure (CPSR: a federal audit of our purchasing system) 37 53 20
27 I2 Cyber-Attack 45 40 18
27 O9 Minors on Campus 28 64 18
29 H8 Culture of “Risk Aversion” 42 39 16
30 M7 Loss of Power 40 37 15
31 C1 Accreditation 22 56 12
32 A11 Competition 32 33 11

EnterpriseRiskManagementInitiativeReport
19 Office of Risk Management
5.2 Risk Ranking - Strategic Risk Evaluation
The ERM Group Session also conducted a strategic risk evaluation. The list below is a condensed version of the result of linkage between the risks and the 4 transformational outcomes shown as O-1, O-2, O-3, and O-4 in the chart. (See Appendix 6 for a more detailed risk assessment result.) The codes represent the following:
O-1: a magnet for exceptional students O-2: an international center O-3: a vibrant surrounding community O-4: a catalyst for economic development and a healthier society.
This approach is designed to link the top 32 risks back to the strategic objectives, and a different result should be expected if the process starts from generating list of risks for each transformational outcome.
Risk Ranking - Strategic Risk Evaluation
Rank Code Risk Theme O-1 O-2 O-3 O-4 Score 1 H2 Recruitment and Retention 24 30 60 60 174 2 H1 Stagnated Salaries and Pay Disparities 6 29 30 30 94 3 F1 State Budget Reduction 27 17 22 28 93 4 A5 Campus Experience 22 14 28 28 92 4 O15 Facility Maintenance and Renewal 26 30 14 22 92 6 F2 Extramural Funding from Federal Agencies 8 10 20 20 58 6 M3 Criminal Activities 10 14 30 4 58 8 H8 Culture of “Risk Aversion” 20 10 4 18 52
9 I5 Technology Infrastructure and Unification of Applications
3 19 17 11 50
10 A10 Education Innovation 15 23 0 5 43 11 A1 Student Fees and Tuition 27 0 7 6 40 12 A4 Growing Student Population 6 6 12 12 36 13 I1 IT Security 13 7 2 8 30 14 H3 Succession Planning 0 2 12 13 27 15 F4 Fraud 0 0 23 0 23 16 F3 Resource Reallocation 9 6 0 7 21 17 O3 Curriculum Setting / Program Offering 7 6 0 6 19 18 H5 Hyper-Bureaucratization 2 12 0 5 18 19 O9 Minors on Campus 0 0 10 6 16 20 C1 Accreditation 9 1 0 0 10 21 H4 Sexual Harassment, Discrimination and Retaliation 0 0 0 6 6 21 M1 Natural Disaster 0 0 6 0 6 23 O4 Emergency Management 3 0 2 0 5 24 O6 Laboratory Accident 4 0 0 0 4 25 M7 Loss of Power 0 0 0 0 0
EnterpriseRiskManagementInitiativeReport
Office of Risk Management 20
25 M4 Mass Casualty Event 0 0 0 0 0 25 C4 Academic Honesty and Integrity 0 0 0 0 0 25 A11 Competition 0 0 0 0 0 25 I2 Cyber-Attack 0 0 0 0 0 25 O2 Incidents in Key Academic Building 0 0 0 0 0 25 M2 Weather Incident 0 0 0 0 0
25 C2
CPSR failure (CPSR: a federal audit of our purchasing system)
0 0 0 0 0
EnterpriseRiskManagementInitiativeReport
21 Office of Risk Management
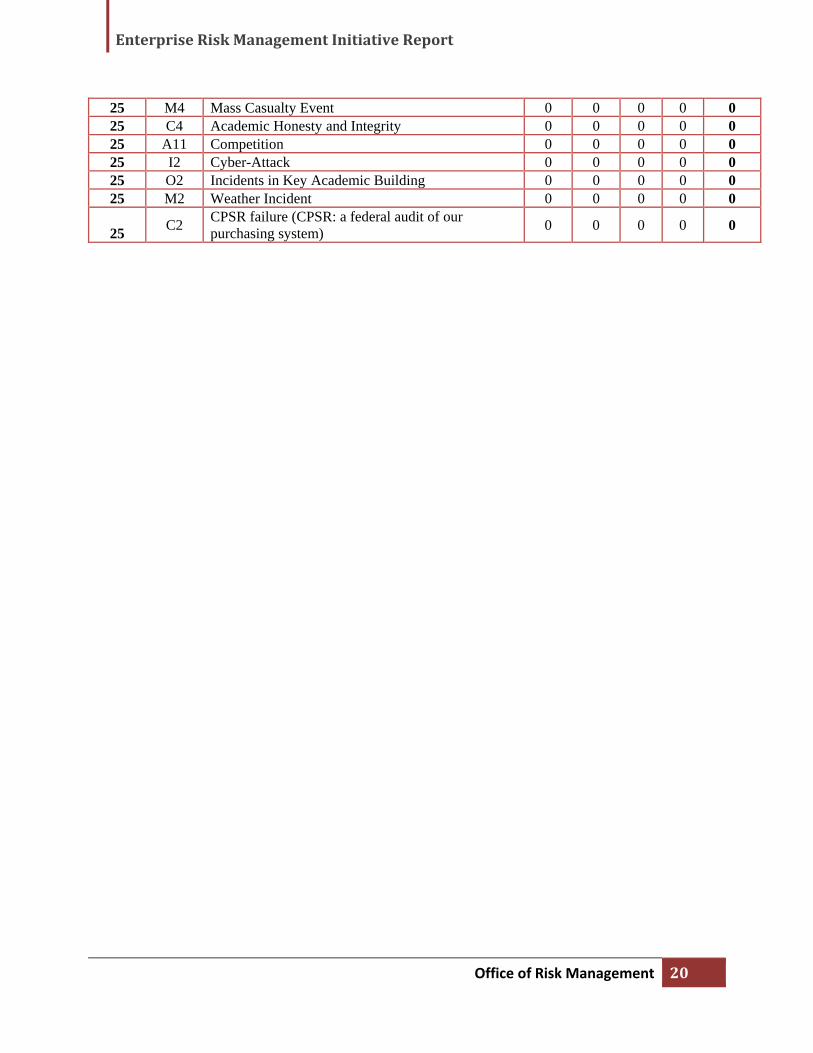
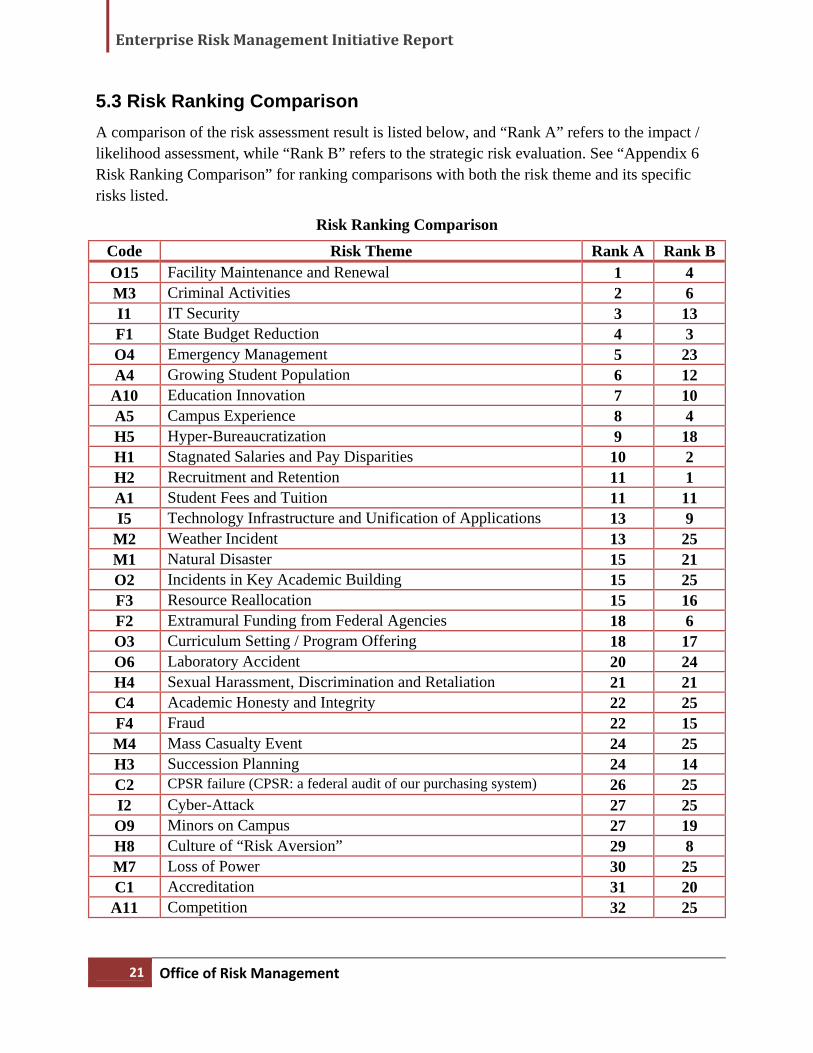
5.3 Risk Ranking Comparison
A comparison of the risk assessment result is listed below, and “Rank A” refers to the impact / likelihood assessment, while “Rank B” refers to the strategic risk evaluation. See “Appendix 6 Risk Ranking Comparison” for ranking comparisons with both the risk theme and its specific risks listed.
Risk Ranking Comparison
Code Risk Theme Rank A Rank B O15 Facility Maintenance and Renewal 1 4 M3 Criminal Activities 2 6 I1 IT Security 3 13 F1 State Budget Reduction 4 3 O4 Emergency Management 5 23 A4 Growing Student Population 6 12 A10 Education Innovation 7 10 A5 Campus Experience 8 4 H5 Hyper-Bureaucratization 9 18 H1 Stagnated Salaries and Pay Disparities 10 2 H2 Recruitment and Retention 11 1 A1 Student Fees and Tuition 11 11 I5 Technology Infrastructure and Unification of Applications 13 9
M2 Weather Incident 13 25 M1 Natural Disaster 15 21 O2 Incidents in Key Academic Building 15 25 F3 Resource Reallocation 15 16 F2 Extramural Funding from Federal Agencies 18 6 O3 Curriculum Setting / Program Offering 18 17 O6 Laboratory Accident 20 24 H4 Sexual Harassment, Discrimination and Retaliation 21 21 C4 Academic Honesty and Integrity 22 25 F4 Fraud 22 15 M4 Mass Casualty Event 24 25 H3 Succession Planning 24 14 C2 CPSR failure (CPSR: a federal audit of our purchasing system) 26 25 I2 Cyber-Attack 27 25 O9 Minors on Campus 27 19 H8 Culture of “Risk Aversion” 29 8 M7 Loss of Power 30 25 C1 Accreditation 31 20 A11 Competition 32 25
EnterpriseRiskManagementInitiativeReport
Office of Risk Management 22
6. RECOMMENDATIONS
6.1 Recommended Next Steps
The University has taken an initial step in the development of an ERM system. Based on this effort, we recommend that the process of developing and implementing an ERM system continue using the recommendations below as a starting point. A prerequisite for a successful ERM program is visible support and engagement by senior administrators. Improvements in risk identification and mitigation at the operational level are valuable in their own right but ERM focuses on strategic level decision making and resource allocation by senior leadership.
1. Conduct a risk identification and prioritization exercise for senior leadership. This is intended to familiarize everyone with the concept of ERM and build upon work already completed to further develop the University’s risk profile. There are a number of options with regards to the structure and focus of the exercise. Broadly speaking, options include a (1) overall risk identification and prioritization exercise based on likelihood and impact, (2) focus on risks specific to one or more strategic initiatives or objectives, (3) brainstorming exercise with emphasis on “black swan” events, or (4) some combination of these. Regardless of the exact structure it should be seen as an opportunity to build understanding and consensus regarding UMD’s risk appetite and risk tolerance.
2. Establish an institutional risk philosophy emphasizing that the University accepts that successful risk taking is necessary for achieving its objectives and that the University seeks to be risk-aware but not risk-averse. This philosophy should reflect that ERM is a tool for improved decision making and resource allocation not a separate, one-time administrative process.
3. Establish roles and responsibilities for risk management. The responsibility for identifying and mitigating risks falls primarily on operational managers and it is important that ERM is understood to be an enhancement to what we already do rather than a new process. That being said there are new roles that would need to be filled in order to implement ERM.
Risk Officer: This person is responsible for coordinating and managing the ERM process and providing support and guidance on risk identification and mitigation efforts. This person would be expected to be the “cheerleader” for ERM and work to develop and improve the effectiveness of the program over time. Note that some institutions identify a senior administrator as the “Senior Risk Officer” with a University Risk Manager or related position focusing on day-to-day risk management operations.

EnterpriseRiskManagementInitiativeReport
23 Office of Risk Management
Risk Oversight Group: This could be a new committee for risk oversight or it can be an existing multidisciplinary group, such as the Administrative Council, that can serve in an oversight capacity. This group would be expected to provide guidance to the Risk Officer, be engaged in the risk prioritization process, and identify “critical risks” (see recommendation #4 - Ongoing Monitoring).
4. Initiate process of ongoing monitoring of critical risks. For Critical Risks, as identified by Risk Oversight Group or senior leadership, identify risk owner(s) and assign responsibility for risk assessment, mitigation and monitoring. This would be an ongoing process involving annual or periodic reporting on critical risks so that over time there would be clear “ownership” and risk mitigation strategies for all top risks.
5. Incorporate principles of ERM into the development of new strategic initiatives – Establish expectation that the risk management process be incorporated in the development of significant new initiatives. This means asking the questions “what needs to go right in order to achieve this objective?” and what could go wrong that would prevent us from achieving the stated objective?” Those risks identified would be assessed and then mitigated and monitored as needed to ensure objectives are met.

This page is intentionally left blank.

Appendices
i Office of Risk Management
APPENDICES
Appendix 1 ERM Representatives ....................................................................................... ii
Appendix 2 Risk Model ...................................................................................................... iv
Appendix 3 Sample Risk Survey ......................................................................................... v
Appendix 4 ERM Group Session Workshop ..................................................................... vii
Appendix 5 Risk Profile ....................................................................................................... x
Appendix 6 Risk Ranking Comparison ............................................................................ xiv
Appendix 7 Heat Map from PricewaterhouseCoopers (PwC) .......................................... xvi
Appendix 8 Risk Register from Education Advisory Board ........................................... xvii
Appendix 9 Preliminary Risk Description ......................................................................... xx
Appendix 10 Glossary ....................................................................................................... xxvi

Appendices
Office of Risk Management ii
Appendix 1 ERM Representatives
Kurt Klier Campus Recreation ServicesWallace Eddy Campus Recreation ServicesPatrick Perfetto Conference & Visitor ServicesGerry Sneeringer Division of Information Tech.Laura Anderson Wright Legal Affairs OfficeDenise Clark Office of VP ResearchJoseph M. Smith Office of VP ResearchMary Hummel Student AffairsMike King University RelationsJohn Farley Administration & Finance Carol Baumann Business ServicesSusan Nash Business ServicesAlan Sactor Department of Environment SafetyJanet S. Peterson Department of Environment SafetyJeysha Rhodes Department of Environment SafetyMary Dorman Department of Environment SafetyPhyllis Dailey Department of Environment SafetySusan Gilson Department of Environment SafetyBill Olen Facilities ManagementBrenda Testa Facilities ManagementCarlo Colella Facilities ManagementHarry Teabout III Facilities ManagementJack Baker Facilities ManagementJohn Vucci Facilities ManagementKen Riebert Facilities ManagementKristen Kostecky Facilities ManagementLaura Wildesen Facilities ManagementJim Stirling Procurement & SupplyDavid Bruce Mitchell Public SafetyHoward Blake Public SafetyCarolyn Trimble UHRCatherine Donohoe Education AbroadPatty Woodwell Graduate SchoolDavid Rivard LibrariesSusan-Ellis Dougherty Office of International ServicesBarbara Gill Office of Undergrad AdmissionsBev Rodgerson Office of the Provost

Appendices
iii Office of Risk Management
Elizabeth Beise Office of the ProvostJuan Uriagereka Office of the ProvostMona Levine Office of the ProvostCarol Corneilse Office of the Provost - DiversityDoug Roberts Undergraduate StudiesDan Ramia College of Agriculture & Natural ResourcesJulie Wright College of Arts & HumanitiesAnn Holmes College of Behavioral and Social Sciences Carolyn Schupbach College of Behavioral and Social Sciences Dean Kitchen College of Computer, Mathematical, and Natural SciencesKathleen Angeletti College of EducationKathleen Fominaya College of Information StudiesEmily Hartz College of JournalismIngrid Farrell School of ArchitectureJanet H. Robertson School of EngineeringMaureen Meyer School of EngineeringMarcio Alves De Oliveira School of Public HealthWilliam Powers School of Public PolicyKaren Mitchell Shady GroveLee Comstock Smith School of Business

Appendices
Office of Risk Management iv
•Competitor•Student Needs•Educational Innovation•Regulatory•Academic Support•Admissions•Diversity•Study Abroad•Campus Experience
Academics & Higher Education
•Accreditation Compliance
•Intellectual Property•Research Compliance•Institutional Standards / Policies
Compliance & Integrity
•Safety•Security•Facilities Management•Business Interruption•Sustainability•Research
Campus Operations
•Funding/Resource Allocation
•Conflicts of Interest•Budget & Strategic Planning
•Fraud•Debt•Financial ReportingFinancial & Economics
•Diversity•Recruitment & Retention
•Culture•Sucession Planning•Benefits / Salaries
Human Resources
•IT Infrastructure•Data Integrity•Information Security•User Support
Information Technology
•Natural Disaster•Weather Incident•Criminal Activities•Economy•Political•Terrorism•Stakeholders & Public
Macro Scale
Appendix 2 Risk Model

Appendices
v Office of Risk Management
Appendix 3 Sample Risk Survey
Survey 1: Risk Identification Survey
Listed below is a graphic of the Risk Identification Survey used. The survey was created via “Survey Monkey”. Survey representatives were asked to identify 3-5 risks. Survey responses for each risk were to include:
List 3-5 major risks that you believe could prevent the university from achieving its strategic objectives.
Explain or give some examples of each risk identified. Score the impact for each risk identified, and explain why that risk impact score was given. Score the likelihood for the risk identified, and explain why that likelihood score was given. Comments/Questions
Page 1 Page 2

Appendices
Office of Risk Management vi
Survey 2: Risk Ranking Survey
Listed below is a graphic of the Risk Ranking Survey. This survey was created through Excel. Survey representatives had to rank the top 3 risks from 7 different categories and then rank the top 3 risks from the number 1 risk identified in each of the 7 categories..
Page 1
Page 2
Rank Code Risk
1 Fill No need to fill
2 Fill No need to fill
3 Fill No need to fill
Code Risk
A1 Inability to maintain affordability due to increasing student fees and tuition
A2 Inability to enroll a diverse student body
A3 Inappropriate influence or intrusion into admission outcomes
A4 Lack of faculty, staff and infrastructure to support growing student population
A5 Inability to recruit or retain faculty, staff or students due to dissatisfaction with campus experience and/or surrounding community
A6 Safety of faculty and students working and volunteering off-campus
A7 Safety of faculty and students working, studying, and volunteering overseas
A8 Inability to maintain desired levels of teaching quality
A9 Inability to retain/graduate students due to inadequate academic/advising support
A13 Extensive national regulation of undergraduate education making it harder for UMD to distinguish itself as a “flagship” campus
A15 Hazing or other inappropriate group behavior leading to fatality or serious injury
A16 Inability to ensure online/overseas education programs meet institutional academic standards
A14Campus expectations associated with the new general education programs create hardships for the professional schools. Insufficient seat sections to meet the campus demand for the new general education curriculum.
Academics & Higher Education
Please pick top three risks from the risk list below that you believe keep our university from achieving its mission; its research, teaching and strategic initiatives, and rank them from 1 to 3 (1 as most important), with both the impact and likelihood of the risks considered.
Note: you only need to pick from the drop list of column "Code", and the "Risk" column will be automatically filled.
A12Political environment will increasingly insist that education be focused on “practical” skills at the expense of a traditional liberal arts curriculum
A10University failing to move quickly enough to expand beyond traditional, site-based delivery of instruction to more flexible, learner-selected options (e.g. online)
A11 Competition - Universities around the world will “catch up” with American universitiesstudents who choose to study outside the U.S.

Appendices
vii Office of Risk Management
Intro Risk Assessment
•Subgroup I : Likelihood/Impact Assessment
•Subgroup II: Strategic Objectives & Critical Risk Matrix
Break Group Discussion
•Discuss assessment results from each subgroup
Risk Description
•Prioritize 1-2 critical risk for continual discussion
Top 32 Risks 8 Risks Ranking 1-2 Critical Risks
20 min 60 min 5 -10 20 min 40 min
Appendix 4 ERM Group Session Workshop
Group Session Organization
Four (4) work group sessions were held on different dates. Each group gathered 12-13 people from the original 52 senior managers, and was randomly assigned 8 risks from the top 32 risks identified in the Risk Ranking Survey. The assignment was to rank the 8 risks.
The group of 12-13 was split into two subgroups of 5-7 participants in each group. Subgroup I used impact / likelihood criteria to assess and score risks, while Subgroup II scored each risk against the Strategic Plan Outcomes.
Following separate discussion, each Subgroup was brought together to discuss the results of their deliberations, identify the top 1-2 risks and collectively in open discussion, provide a risk description.
Group Session Timeline/Process
People: 5 -7 each subgroup
People: 12 – 13 each group
Risk: 8 each group for risk assessment
People: ~ 52
Risk: Top 32
Working group
Group A
9/11/2012
Subgroup I
Subgroup II
Group B
9/12/2012
Subgroup I
Subgroup II
Group C
9/13/2012
Subgroup I
Subgroup II
Group D
9/21/2012
Subgroup I
Subgroup II

Appendices
Office of Risk Management viii
Worksheet Sample 1 – Risk Criteria Assessment
There were 4 worksheets for Risk Criteria Assessment. The “Financial” risk criteria worksheet is displayed below. The other risk criteria worksheets that were used included “Health and Safety”, “Reputation”, and “Likelihood and Impact”.
Financial
Financial - includes physical and/or financial losses and damages to campus physical and environmental assets; events that affect profitability and efficiency, including loss of assets, and technology risks.
Scale Catastrophic Disastr
ous Serious Minor Insignificant
Definition > $7M > $3M to $7M
> $500K to $3M
> $10K to $500K
< $10K
Score 9-10 7-8 5-6 3-4 1-2
Score the potential financial impact of each event from 1 to 10 based on the scale above:
Code Risk Score
A4 Lack of faculty, staff and infrastructure to support growing student population
A5
Inability to recruit or retain faculty, staff or students due to dissatisfaction with campus experience and/or surrounding community
M4 Mass casualty event from an active shooter or terrorist attack
H2 Inability to Recruit and Retain Top Faculty, Staff and Senior Administrators
C2
CPSR failure – The CPSR is a federal audit of our purchasing system. Receipt of federal grants and contracts would be jeopardized if we were to fail.
I2 Cyber-attack resulting in data loss or equipment malfunction.
F2
Extramural funding from federal agencies - flat or declining federal research funding coupled with increased competition for grants
O2 Explosion, fire or other large scale occurrence in key academic building.

Appendices
ix Office of Risk Management
Worksheet Sample 2 – Strategic Risk Evaluation
There were 4 worksheets used for Strategic Risk Evaluation. The “Transformational Outcome 2 : an International Center” Risk Evaluation worksheet is displayed below. The other risk evaluation worksheets that were used included “Transformational Outcome 1: A Magnet for Exceptional Students”, “Transformational Outcome 3: A Vibrant Surrounding Community”, and “Transformational Outcome 4: A Catalyst for Economic Development and a Healthier Society”.
Strategic Risk Evaluation Worksheet
Transformational Outcome 2 An International Center: Maryland will be an international center, the state’s window to the world and a catalyst for educational, research, and scholarly partnerships around the globe. Washington, D.C., is a world city. Within its orbit, the University of Maryland will be a world as well as a world-class university. We will attract the most brilliant minds from all corners, send our students abroad for exceptional learning experiences, and expand our connections and partnerships with public and private organizations in more than 75 countries and on all seven continents. Our faculty will extend the boundaries of knowledge and understanding in a wide range of fields. They will address issues of critical importance and worldwide impact.
Risk List
A4 Lack of faculty, staff and infrastructure to support growing student population
A5 Inability to recruit or retain faculty, staff or students due to dissatisfaction with campus experience and/or surrounding community
M4 Mass casualty event from an active shooter or terrorist attack
H2 Inability to Recruit and Retain Top Faculty, Staff and Senior Administrators
C2 CPSR failure – The CPSR is a federal audit of our purchasing system. Receipt of federal grants and contracts would be jeopardized if we were to fail.
I2 Cyber-attack resulting in data loss or equipment malfunction.
F2 Extramural funding from federal agencies - flat or declining federal research funding coupled with increased competition for grants
O2 Explosion, fire or other large scale occurrence in key academic building.
Step 1: Please pick 4 most critical risks affecting the achievement of this strategic outcome.
A4 A5 M4 H2 C2 I2 F2 O2
Step 2: After discussion, please decide again the 3 most critical risks affecting the achievement of this strategic outcome, and rank them (1 as most critical).
Rank 1 2 3
Risk Code

Appendices
Office of Risk Management x
Appendix 5 Risk Profile
Campus Operations
O1 Residence hall fire resulting in student death(s)
O2 Explosion, fire or other large scale occurrence in key academic building.
O3
The University's existing administrative systems impede the campus' ability to offer flexible, innovative curricular/programmatic options in a timely fashion. Programmatic offerings that fall beyond the realms of traditional formats are difficult to implement for logistical reasons.
O4 Failure to implement and test adequate emergency preparedness measures and post-event contingency plans
O5 Failure of the University to provide adequate security in classrooms for students/faculty by not providing door locks for each classroom.
O6 Laboratory accident that results in serious injury or fatality (explosion, fire, chemical/bio/radiation exposure, etc.)
O7 Regulatory infractions significant enough for UMCP to lose (or have suspended) its license for the use of radioactive materials, irradiator operation, research reactor.
O8 Occupational fatality (electrocution, fall from height or other work-related incident)
O9 Personal or physical injury to minors on campus resulting from inadequate controls (background checks, clear policies and procedures, etc.)
O10 Failure to adequately invest in utility systems to keep pace with growth of University and limited life span of existing equipment.
O11 Not allowing controversial speakers and/or protest rallies resulting in the University being perceived as suppressing free speech or ideas.
O12 Inability to adequately protect student- athlete health and safety (e.g., heat stroke, concussions, etc.)
O13 Excessive force by campus police that may result in severe injury and/or death
O14 Inability to meet presidential sustainability targets
O15 Inadequate funding to keep pace with facility maintenance renewal leading to increased failure of building systems and poor visual appearance and functionality.

Appendices
xi Office of Risk Management
Academics & Higher Education
A1 Inability to maintain affordability due to increasing student fees and tuition
A2 Inability to enroll a diverse student body
A3 Inappropriate influence or intrusion into admission outcomes
A4 Lack of faculty, staff and infrastructure to support growing student population
A5 Inability to recruit or retain faculty, staff or students due to dissatisfaction with campus experience and/or surrounding community
A6 Safety of faculty and students working and volunteering off-campus
A7 Safety of faculty and students working, studying, and volunteering overseas
A8 Inability to maintain desired levels of teaching quality
A9 Inability to retain/graduate students due to inadequate academic/advising support
A10 University failing to move quickly enough to expand beyond traditional, site-based delivery of instruction to more flexible, learner-selected options (e.g. online)
A11 Competition - Universities around the world will “catch up” with American universities students who choose to study outside the U.S.
A12 Political environment will increasingly insist that education be focused on “practical” skills at the expense of a traditional liberal arts curriculum
A13 Extensive national regulation of undergraduate education making it harder for UMD to distinguish itself as a “flagship” campus
A14 Campus expectations associated with the new general education programs create hardships for the professional schools. Insufficient seat sections to meet the campus demand for the new general education curriculum.
A15 Hazing or other inappropriate group behavior leading to fatality or serious injury
A16 Inability to ensure online/overseas education programs meet institutional academic standards
Compliance & Integrity
C1 Loss of accreditation or membership in prestigious academic associations (e.g., Middle States Commission of Higher Education, American Association of Universities
C2 CPSR failure – The CPSR is a federal audit of our purchasing system. Receipt of federal grants and contracts would be jeopardized if we were to fail.
C3 Misuse of donor’s funds
C4 Violation of academic honesty and integrity polices
C5 Non-compliance with U.S. Immigration regulation
C6 University records not retained in accordance with record retention policy
Appendices
Office of Risk Management xii
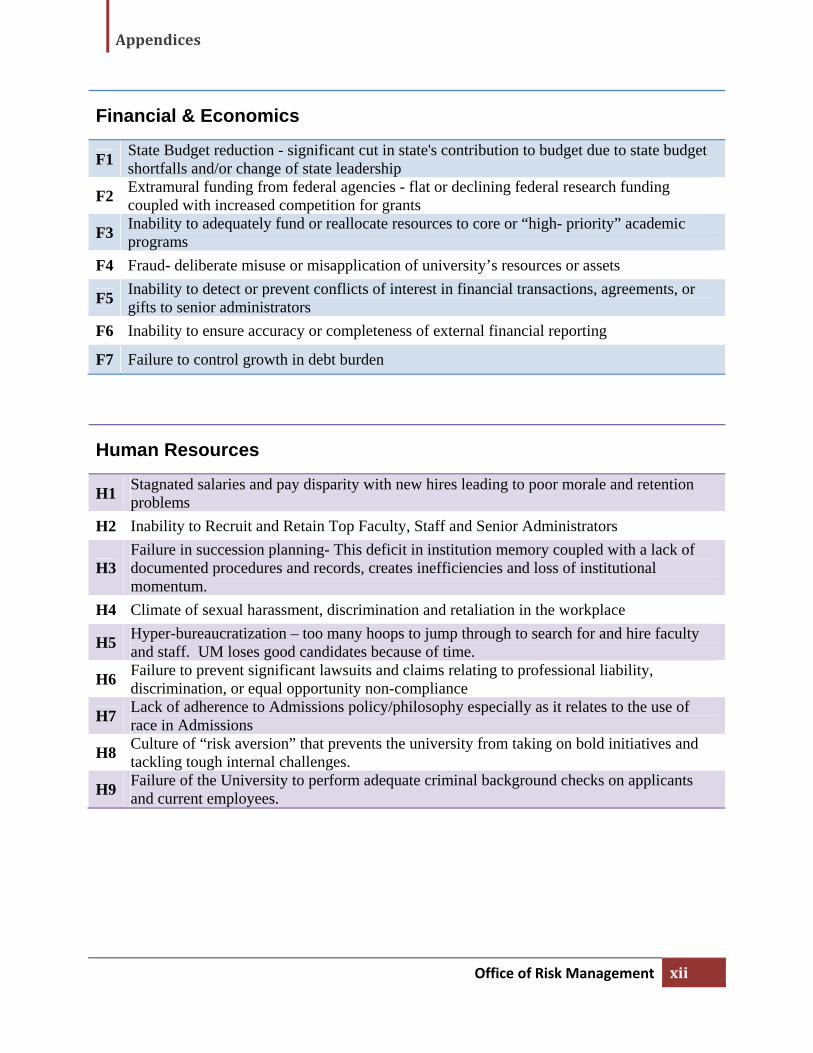
Financial & Economics
F1 State Budget reduction - significant cut in state's contribution to budget due to state budget shortfalls and/or change of state leadership
F2 Extramural funding from federal agencies - flat or declining federal research funding coupled with increased competition for grants
F3 Inability to adequately fund or reallocate resources to core or “high- priority” academic programs
F4 Fraud- deliberate misuse or misapplication of university’s resources or assets
F5 Inability to detect or prevent conflicts of interest in financial transactions, agreements, or gifts to senior administrators
F6 Inability to ensure accuracy or completeness of external financial reporting
F7 Failure to control growth in debt burden
Human Resources
H1 Stagnated salaries and pay disparity with new hires leading to poor morale and retention problems
H2 Inability to Recruit and Retain Top Faculty, Staff and Senior Administrators
H3 Failure in succession planning- This deficit in institution memory coupled with a lack of documented procedures and records, creates inefficiencies and loss of institutional momentum.
H4 Climate of sexual harassment, discrimination and retaliation in the workplace
H5 Hyper-bureaucratization – too many hoops to jump through to search for and hire faculty and staff. UM loses good candidates because of time.
H6 Failure to prevent significant lawsuits and claims relating to professional liability, discrimination, or equal opportunity non-compliance
H7 Lack of adherence to Admissions policy/philosophy especially as it relates to the use of race in Admissions
H8 Culture of “risk aversion” that prevents the university from taking on bold initiatives and tackling tough internal challenges.
H9 Failure of the University to perform adequate criminal background checks on applicants and current employees.

Appendices
xiii Office of Risk Management
Information Technology
I1 IT security breaches leading to disclosure of confidential information
I2 Cyber-attack resulting in data loss or equipment malfunction.
I3 Inability to offer cutting edge and robust technology service in a way that enables and facilitates scholarly activity and creativity
I4 Inability to maintain or replace obsolete systems/technology in timely manner
I5 Inadequate investment in technology infrastructure and unification of applications
I6 Inability to prevent unauthorized modification of data
I7 Inability to deliver satisfactory user support
Macro Scale
M1 Natural Disaster (e.g., hurricane, tornado, earthquake, etc.)
M2 Weather Incident – snow, ice storm, flooding, etc. that would close the university for an extended period of time
M3 Criminal Activities – violent crime on or near to campus
M4 Mass casualty event from an active shooter or terrorist attack
M5 Political unrest in other countries affecting our faculty, students, research and scholarship
M6 Disease outbreak – norovirus outbreak on campus
M7 Loss of Power for an extended period of time
M8 Global pandemic – widespread infection on and beyond the campus
M9 Accidental environmental release of an infectious agent
M10 Terrorist assault on nuclear reactor or high security containment laboratory
M11 Not communicating our mission to the State and the general public

Appendices
Office of Risk Management xiv
Appendix 6 Risk Ranking Comparison
Code Risk Theme Risk Rank
A Rank
B O15 Facility
Maintenance and Renewal
Inadequate funding to keep pace with facility maintenance renewal leading to increased failure of building systems and poor visual appearance and functionality.
1 4
M3 Criminal Activities Criminal Activities – violent crime on or near to campus 2 6 I1 IT Security IT security breaches leading to disclosure of confidential
information 3 13
F1 State Budget Reduction
State Budget reduction - significant cut in state's contribution to budget due to state budget shortfalls and/or change of state leadership
4 3
O4 Emergency Management
Failure to implement and test adequate emergency preparedness measures and post-event contingency plans
5 23
A4 Growing Student Population
Lack of faculty, staff and infrastructure to support growing student population
6 12
A10 Education Innovation
University failing to move quickly enough to expand beyond traditional, site-based delivery of instruction to more flexible, learner-selected options (e.g. online)
7 10
A5 Campus Experience
Inability to recruit or retain faculty, staff or students due to dissatisfaction with campus experience and/or surrounding community
8 4
H5 Hyper-Bureaucratization
Hyper-bureaucratization – too many hoops to jump through to search for and hire faculty and staff. UM loses good candidates because of time.
9 18
H1 Stagnated Salaries and Pay Disparities
Stagnated salaries and pay disparity with new hires leading to poor morale and retention problems
10 2
H2 Recruitment and Retaining
Inability to Recruit and Retain Top Faculty, Staff and Senior Administrators
11 1
A1 Student Fees and Tuition
Inability to maintain affordability due to increasing student fees and tuition
11 11
I5 Technology Infrastructure and Unification of Applications
Inadequate investment in technology infrastructure and unification of applications
13 9
M2 Weather Incident Weather Incident – snow, ice storm, flooding, etc. that would close the university for an extended period of time
13 25
M1 Natural Disaster Natural Disaster (e.g., hurricane, tornado, earthquake, etc.) 15 21 O2 Incidents in Key
Academic Building Explosion, fire or other large scale occurrence in key academic building.
15 25
F3 Resource Reallocation
Inability to adequately fund or reallocate resources to core or “high- priority” academic programs
15 16
F2 Extramural Funding from Federal Agencies
Extramural funding from federal agencies - flat or declining federal research funding coupled with increased competition for grants
18 6

Appendices
xv Office of Risk Management
Code Risk Theme Risk Rank
A Rank
B O3 Curriculum Setting
/ Program Offering The University's existing administrative systems impede the campus' ability to offer flexible, innovative curricular/programmatic options in a timely fashion. Programmatic offerings that fall beyond the realms of traditional formats are difficult to implement for logistical reasons.
18 17
O6 Laboratory Accident
Laboratory accident that results in serious injury or fatality (explosion, fire, chemical/bio/radiation exposure, etc.)
20 24
H4 Sexual Harassment, Discrimination and Retaliation
Climate of sexual harassment, discrimination and retaliation in the workplace 21 21
C4 Academic Honesty and Integrity
Violation of academic honesty and integrity polices 22 25
F4 Fraud Fraud- deliberate misuse or misapplication of university’s resources or assets
22 15
M4 Mass Casualty Event
Mass casualty event from an active shooter or terrorist attack
24 25
H3 Succession Planning
Failure in succession planning- This deficit in institution memory coupled with a lack of documented procedures and records, creates inefficiencies and loss of institutional momentum.
24 14
C2 CPSR failure CPSR failure – The CPSR is a federal audit of our purchasing system. Receipt of federal grants and contracts would be jeopardized if we were to fail.
26 25
I2 Cyber-Attack Cyber-attack resulting in data loss or equipment malfunction.
27 25
O9 Minors on Campus Personal or physical injury to minors on campus resulting from inadequate controls (background checks, clear policies and procedures, etc.)
27 19
H8 Culture of “Risk Aversion”
Culture of “risk aversion” that prevents the university from taking on bold initiatives and tackling tough internal challenges.
29 8
M7 Loss of Power Loss of Power for an extended period of time 30 25 C1 Accreditation Loss of accreditation or membership in prestigious
academic associations (e.g., Middle States Commission of Higher Education, American Association of Universities
31 20
A11 Competition Competition - Universities around the world will “catch up” with American universities students who choose to study outside the U.S.
32 25

Appendices
Office of Risk Management xvi
Appendix 7 Heat Map from PricewaterhouseCoopers (PwC)
Student Billing
Enrollment
Grow
th M
anagement
Safety & Crim
e
Compliance
& Accreditation
Student Advisem
ent
Student Organizations
(Club Sports)Capital Program
M
anagement
Accountancy/Costing Consistency (R
esearch)Effort R
eporting
Data
IntegrityR
esearch Com
pliance
Annual Performance
Evaluation Process
Branding & M
arketing
Comm
unity R
elations
Admissions
Standards
Hardw
are/Software
Obsoiescence
Building/Grounds
Maintenance
General Com
pliance
Clarity of Accountability &
Responsibility
Student Healthcare
& Counseling
Non-Traditional
InvestmentStudent Affairs
Managem
ent
Residence H
alls
Financial Aid Com
plianceFinancial Aid Strategy
Campaign
Managem
entSub-R
ecipient M
onitoring
Student Record
Managem
ent & Available/
Financial System
Developm
ent Strategy
Lab Safety/Environmental
Health &
Safety
Gift
Processing
Donor R
elations
Alumni Com
munications
& R
elations
Off-Cam
pus Housing
(Non-U
niversity Ow
ned)
High
Medium
Low
Impact
Likelihood
LowM
ediumH
igh
Co-Op
ProgramH
ealth Care Costs
Appendices
xvii Office of Risk Management
Appendix 8 Risk Register from Education Advisory Board
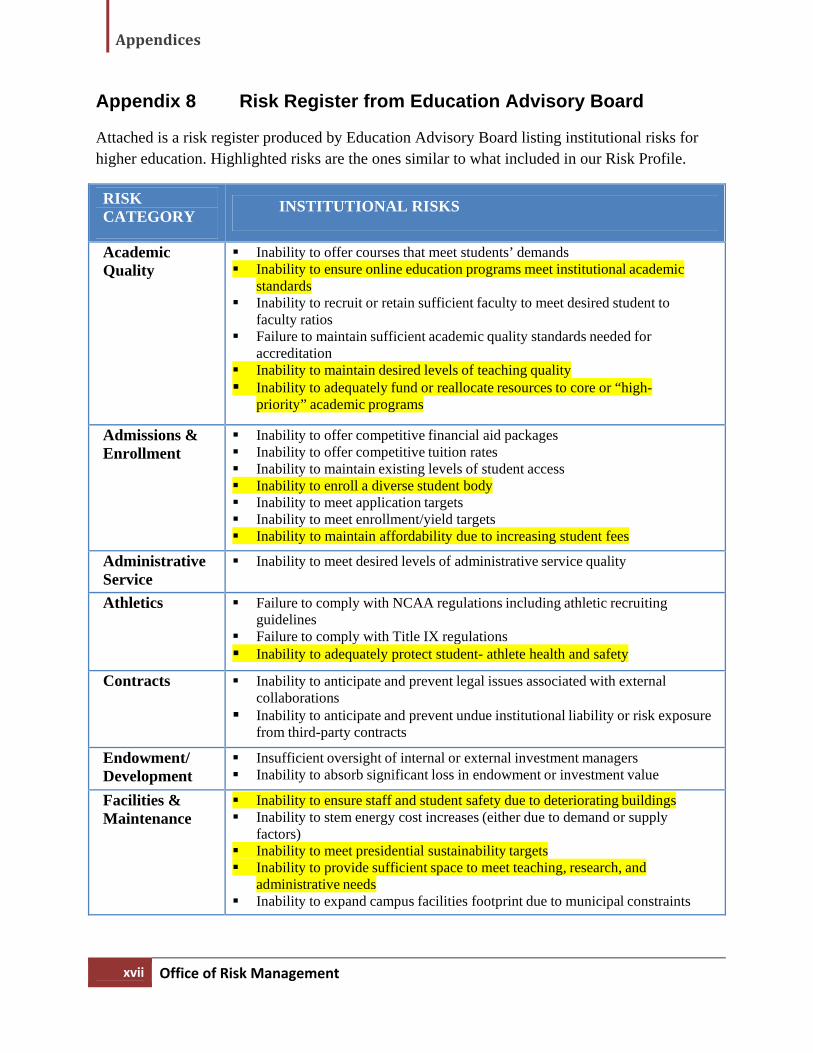
Attached is a risk register produced by Education Advisory Board listing institutional risks for higher education. Highlighted risks are the ones similar to what included in our Risk Profile.
RISK CATEGORY
INSTITUTIONAL RISKS
Academic Quality
Inability to offer courses that meet students’ demands Inability to ensure online education programs meet institutional academic
standards Inability to recruit or retain sufficient faculty to meet desired student to
faculty ratios Failure to maintain sufficient academic quality standards needed for
accreditation Inability to maintain desired levels of teaching quality Inability to adequately fund or reallocate resources to core or “high-
priority” academic programs
Admissions & Enrollment
Inability to offer competitive financial aid packages Inability to offer competitive tuition rates Inability to maintain existing levels of student access Inability to enroll a diverse student body Inability to meet application targets Inability to meet enrollment/yield targets Inability to maintain affordability due to increasing student fees
Administrative Service
Inability to meet desired levels of administrative service quality
Athletics Failure to comply with NCAA regulations including athletic recruiting guidelines
Failure to comply with Title IX regulations Inability to adequately protect student- athlete health and safety
Contracts Inability to anticipate and prevent legal issues associated with external collaborations
Inability to anticipate and prevent undue institutional liability or risk exposure from third-party contracts
Endowment/ Development
Insufficient oversight of internal or external investment managers Inability to absorb significant loss in endowment or investment value
Facilities & Maintenance
Inability to ensure staff and student safety due to deteriorating buildings Inability to stem energy cost increases (either due to demand or supply
factors) Inability to meet presidential sustainability targets Inability to provide sufficient space to meet teaching, research, and
administrative needs Inability to expand campus facilities footprint due to municipal constraints

Appendices
Office of Risk Management xviii
RISK CATEGORY
INSTITUTIONAL RISKS
Financial & Economic
Inability to detect or prevent conflicts of interest in financial transactions, agreements, or gifts to senior administrators
Occupational fraud; deliberate misuse or misapplication of university’s resources or assets
Inability to fund new strategic initiatives due to legacy budgeting model Inability to cope with unexpected revenue shortfall / budget reductions Failure of online degree programs to meet financial targets Inability to manage/absorb rising health care costs Inability to adequately fund all desired programs due to fund diffusion across
multiple objectives Declining institutional financial flexibility due to reduction in financial
reserves Inability to meet liquidity targets against market fluctuations Failure to control growth in debt burden Inability to meet debt covenant requirements Inability to ensure accuracy or completeness of external financial reporting Inability to fund progress on deferred maintenance queue Inability to manage or react to fluctuations in currency exchange rates
Human Resources
Failure to prevent significant lawsuits and claims relating to professional liability, discrimination, or equal opportunity non-compliance
Inability to recruit and retain top faculty, staff and senior administrators Inability to meet targets in staff and faculty diversity Inability to offer a competitive benefits package Inability to retain faculty and staff due to employee dissatisfaction Failure to secure favorable collective bargaining outcomes
Information Technology
Inability to prevent unauthorized modification of data Failure to recover from system loss or extended downtime in a timely
manner Inability to ensure physical infrastructure security Inability to maintain or replace obsolete systems/technology in timely
manner Inability to grow it resources and data center capacity to meet campus
needs Inability to provide accurate and timely updates of core information
systems to administrative areas Inability to deliver satisfactory user support Failure to comply with information security and privacy regulations Inability to complete mission-critical it projects in a timely manner

Appendices
xix Office of Risk Management
RISK CATEGORY
INSTITUTIONAL RISKS
Public Safety
& Hazard
Failure to implement and test adequate emergency preparedness measures and post-event contingency plans
Inability to ensure safety of faculty and students working and volunteering off- campus
Inability to ensure safety of faculty and students working, studying, and volunteering overseas
Failure to prevent significant lawsuits and claims relating to workers’ compensation
Excessive force by campus policy that may result in severe injury and/or death
Research and Grants
Inability to detect or prevent major breaches in research integrity and ethics
Inability to detect or prevent conflicts of interest stemming from third-party contracts
Failure to comply with applicable human/animal subject regulations Inability to prevent intellectual property infringement Export control violations
Student Life Inability to ensure that student mental health challenges are adequately addressed
Inability to recruit or retain students due to student dissatisfaction with campus experience
Failure to adequately serve and promote student groups
Student Success Inability to meet retention targets Inability to retain/graduate students due to lack of early warning systems Inability to retain/graduate students due to inadequate academic/advising
support
Appendices
Office of Risk Management xx
Appendix 9 Preliminary Risk Description
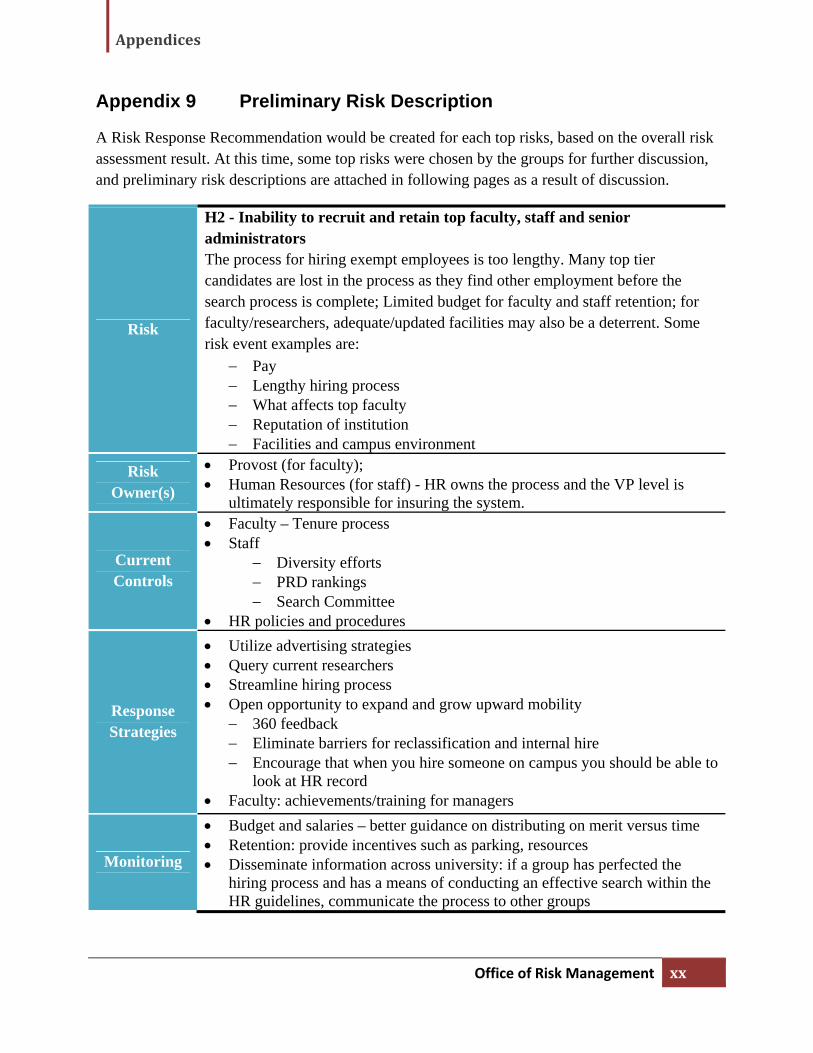
A Risk Response Recommendation would be created for each top risks, based on the overall risk assessment result. At this time, some top risks were chosen by the groups for further discussion, and preliminary risk descriptions are attached in following pages as a result of discussion.
Risk
H2 - Inability to recruit and retain top faculty, staff and senior administrators The process for hiring exempt employees is too lengthy. Many top tier candidates are lost in the process as they find other employment before the search process is complete; Limited budget for faculty and staff retention; for faculty/researchers, adequate/updated facilities may also be a deterrent. Some risk event examples are:
Pay Lengthy hiring process What affects top faculty Reputation of institution Facilities and campus environment
Risk Owner(s)
Provost (for faculty); Human Resources (for staff) - HR owns the process and the VP level is
ultimately responsible for insuring the system.
Current Controls
Faculty – Tenure process Staff
Diversity efforts PRD rankings Search Committee
HR policies and procedures
Response Strategies
Utilize advertising strategies Query current researchers Streamline hiring process Open opportunity to expand and grow upward mobility
360 feedback Eliminate barriers for reclassification and internal hire Encourage that when you hire someone on campus you should be able to
look at HR record Faculty: achievements/training for managers
Monitoring
Budget and salaries – better guidance on distributing on merit versus time Retention: provide incentives such as parking, resources Disseminate information across university: if a group has perfected the
hiring process and has a means of conducting an effective search within the HR guidelines, communicate the process to other groups

Appendices
xxi Office of Risk Management
Risk
H1 - Stagnated salaries and pay disparity with new hires leading to poor morale and retention problems Salary compression resulting from offering competitive market salaries to newly hired faculty and staff while internal experienced faculty and staff salaries fall behind, creating significant inequities, poor morale and poor retention of skilled and valuable employees. Some risk event examples are:
Lack of consistency in organizational structure New hires are coming in with higher salaries than those who have been
with the university on top of no COLA or merit for years Title and pay disparity – reorganization of units, colleges merge together
– pay and responsibilities are different while titles are the same BOR policies need to be updated UM is last amongst our peers to pay faculty Discretion is often used as a shield for real discrimination
Risk Owner(s)
Human Resources/Departments (for staff) Academic Affairs – (for faculty)
Current Controls
HR review: new positions, salary reclassification and salary adjustments get reviewed against BOR policies
Salaries validated against the market; Market forces dictate faculty salary PRD System Faculty salary ranges do exist within the colleges and require approval
within Academic Affairs. Those salaries that go beyond the range require approval from the Provost.
Response Strategies
Improving transparency – having more information helps morale. Being able to understand pay bands/salary range; making sure staff employees know where they fall and how to move in the system; clarity on how the system works. Establish merit committees with criteria disclosed, within departments for faculty.
PRD System re-evaluated as a tool Recalibrate existing salaries when hiring new people; Increase flexibility
with new hires and recalibrate the salaries of current employees. Move money strategically; reallocate merit to correct disparities. Increased flexibilities with bonuses. Find creative ways to give monies to
entice faculty (e.g., upgrade labs, provide a research assistant, etc.) Succession planning
Monitoring
For staff – monitor with peers – review unit by unit and department by department to see if there is salary compression

Appendices
Office of Risk Management xxii
Risk
F1 - Significant cut in State’s contribution to budget due to State budget
shortfalls and/or change of State leadership
The continuing budget cuts distributed to the campus units prevents
development and/or even maintenance of our current regular activities. Some
risk event examples are:
Losing donor’s dollars that are tied to contingency of capital project
funding and follow through
Academic departments must give up faculty lines every year when
budget cuts come in
Risk
Owner(s)
President (primary)
VPA&F
Provost and Deans (allocate resources and manage budget)
Current
Controls
Outreach to legislators
Provide strategic reallocation of dollars to start small pilots in order to be
able to apply for extramural funding
Budget process – strategize about our cost structure
Transparency
Response
Strategies
For those senior administrators with fiduciary responsibility (from the
President to Dept. Chairs) – share best practices and provide training on
finance and how to do budgeting
When there is adequate funding – create contingencies
Leverage new technology to reduce operating costs
Monitoring
When there’s a decrease in budget, we try to show legislators how it
negatively impacts our programming
Financial reserves (fund balance) shared

Appendices
xxiii Office of Risk Management
Risk
A4 - Lack of faculty, staff and infrastructure to support growing student population The University does want to recruit more top students but does not want to necessarily increase enrollment. UM cannot grow more without funding and will not grow without funding. It’s better to keep a steady state on student enrollment. Some risk event examples are:
Need better projections on enrollments
Not enough faculty to open enough course sections to meet demand
Lack of adequate advising staff due to understaffing
Lack of technology to meet demands for new ways of teaching
Lack of adequate classroom/lab facilities to meet demand
Lack of adequate housing to increase student enrollment
If more students, then funding is needed to increase UM police jurisdiction in City of College Park.
Risk Owner(s)
Provost (primary), VPA&F, VPSA, and other VPs
Current Controls
Admissions, IRPA (Institutional Research Planning & Assessment): key factors for statistical projections
Facilities Council: where adequate space is assessed
Finance Committee
Response Strategies
Online courses to provide access without needing bricks and mortar – blended culture creases an engaged community
Better enrollment projections
More money
Monitoring
Facilities Council: facility oversight
Enrollment Management Group: how many students will apply, how many we accept – projections
Finance Committee – use money wisely
Office of the Provost – oversight program quality with increasing student population
New General Education requirement
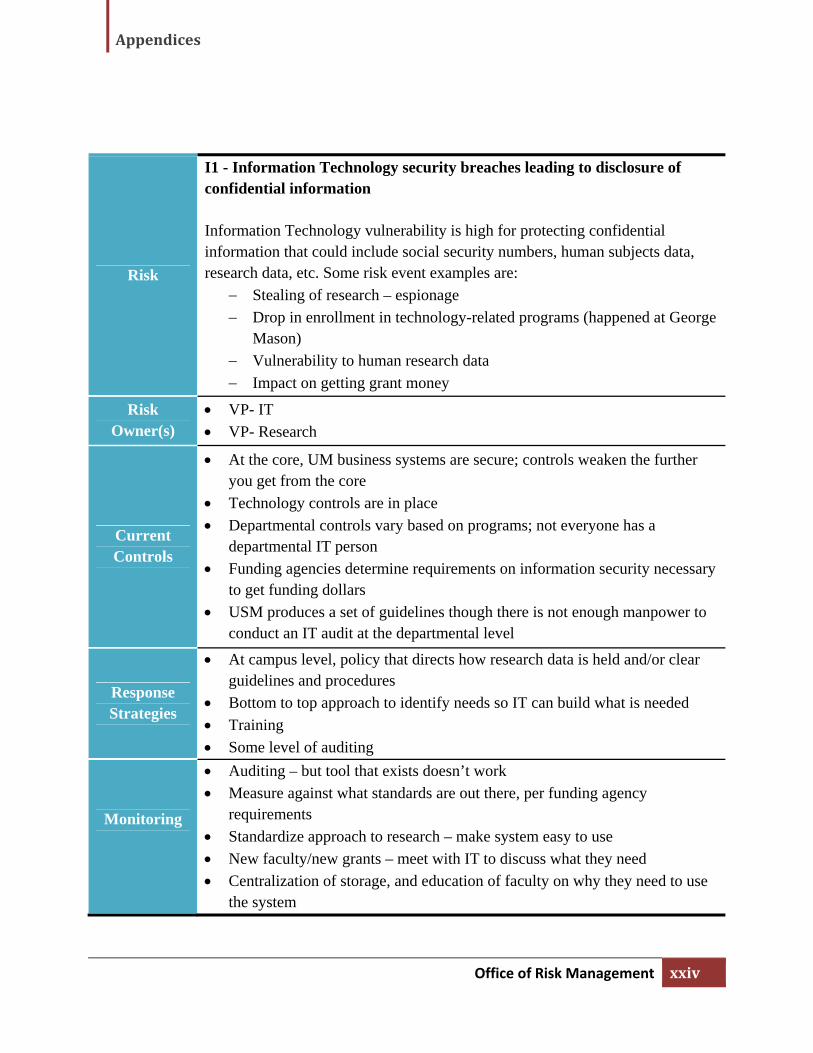
Appendices
Office of Risk Management xxiv
Risk
I1 - Information Technology security breaches leading to disclosure of confidential information Information Technology vulnerability is high for protecting confidential information that could include social security numbers, human subjects data, research data, etc. Some risk event examples are:
Stealing of research – espionage
Drop in enrollment in technology-related programs (happened at George Mason)
Vulnerability to human research data
Impact on getting grant money
Risk Owner(s)
VP- IT
VP- Research
Current Controls
At the core, UM business systems are secure; controls weaken the further you get from the core
Technology controls are in place
Departmental controls vary based on programs; not everyone has a departmental IT person
Funding agencies determine requirements on information security necessary to get funding dollars
USM produces a set of guidelines though there is not enough manpower to conduct an IT audit at the departmental level
Response Strategies
At campus level, policy that directs how research data is held and/or clear guidelines and procedures
Bottom to top approach to identify needs so IT can build what is needed
Training
Some level of auditing
Monitoring
Auditing – but tool that exists doesn’t work
Measure against what standards are out there, per funding agency requirements
Standardize approach to research – make system easy to use
New faculty/new grants – meet with IT to discuss what they need
Centralization of storage, and education of faculty on why they need to use the system

Appendices
xxv Office of Risk Management
Risk
O15 - Inadequate funding to keep pace with facility maintenance renewal
leading to increased failure of building systems and poor visual appearance
and functionality
There are buildings on campus that have not been upgraded since the 1970’s.
HVAC systems in some buildings are inefficient and at times unreliable. In
many facilities, the mechanical infrastructure supporting the facility has
exceeded its life expectancy. Superficially allocating resources to the visible
(painting walls, flowers, furnishings, etc.) does not provide a core strong
infrastructure backbone. Failure to adequately upgrade facilities also increases
the risk of loss of research and equipment. Some risk event examples are:
UM loses top faculty, researchers and grad students (high school
students say the chemistry labs in the high schools are better)
Can’t do state-of-the-art research in 1950’s infrastructure with steam
radiators and still be able to control for temperature and humidity
Risk Owner(s)
Provost (primary)
Associate VP-Facilities Management
Current Controls
On-going tracking of deferred maintenance and deferred maintenance log
Respond to high priority issues tactfully rather than strategically
Collaborative funding – departments having the money to maintain facilities
versus Facilities Management decisions based on need and resources
Response Strategies
Identify priorities on basis of resource allocation and hold management
accountable
Preventative Maintenance
Do less but do it well
Need some level of ownership at local level – have departments be more
accountable and establish a mechanism to support them
Monitoring
Deferred maintenance list
Inspections, backlogs, communications, prioritizing resources

Appendices
Office of Risk Management xxvi
Appendix 10 Glossary
Enterprise Risk Management (ERM): Enterprise Risk Management is an integrated process designed to assess and manage the risks that threaten an organization’s ability to achieve its strategic objectives.
Framework: A framework is a real or conceptual structure intended to serve as a support or guide for the building of something that expands the structure into something useful.
Enterprise Risk Management Framework – The ERM Framework set by the Board of Regents and/or the Executive Leadership, defines essential components, suggests a common language, and provides clear direction and guidance for enterprise risk management
Essential ERM Framework Elements include:
Clear strategies and objectives
Risk identification
Risk assessment
Risk response
Risk communication & monitoring
Risk Appetite: Risk Appetite is an organization’s tolerance for risk. The broad amount of risk a college or university is willing to accept in pursuit of its mission or vision. The measurement of risk appetite may be evaluated qualitatively or quantitatively.
Risk Tolerance: Risk Tolerance is the acceptable level of risk relative to the achievement of an objective. Risk Assessment: Risk Assessment is determining the impact of an identified risk on the institution. Risk Assessment Activities:
Risk identification—the qualitative determination of significant risks that can potentially impact the institution’s achievement of its financial and/or strategic objectives. This is often done through structured interviews of key personnel by internal or external experts.
Risk prioritization—the ranking of risks on a scale, such as frequency and/or severity (See Risk Mapping).
Impact/Significance/Severity: Impact is the result or effect of an event. The impact of an event can be positive or negative relative to the university’s strategic objectives. There can be a range of possible impacts associated with any single event.
Likelihood: Likelihood is the possibility that a given event will occur.
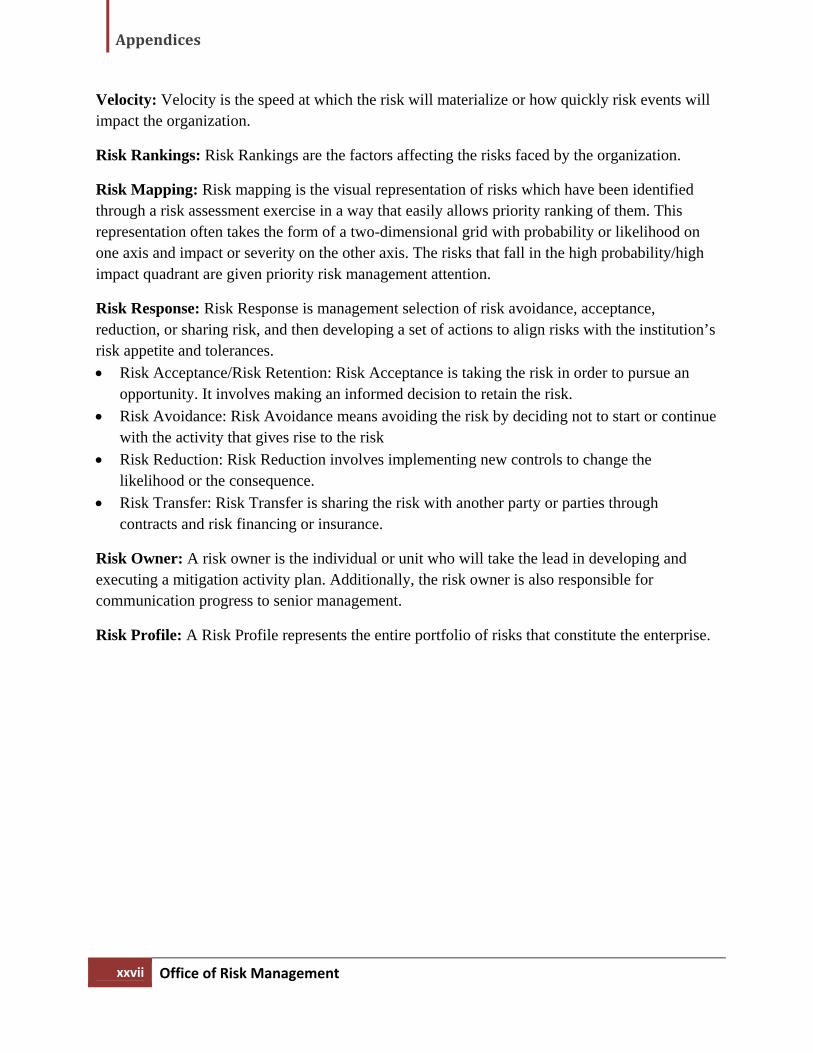
Appendices
xxvii Office of Risk Management
Velocity: Velocity is the speed at which the risk will materialize or how quickly risk events will impact the organization.
Risk Rankings: Risk Rankings are the factors affecting the risks faced by the organization.
Risk Mapping: Risk mapping is the visual representation of risks which have been identified through a risk assessment exercise in a way that easily allows priority ranking of them. This representation often takes the form of a two-dimensional grid with probability or likelihood on one axis and impact or severity on the other axis. The risks that fall in the high probability/high impact quadrant are given priority risk management attention.
Risk Response: Risk Response is management selection of risk avoidance, acceptance, reduction, or sharing risk, and then developing a set of actions to align risks with the institution’s risk appetite and tolerances.
Risk Acceptance/Risk Retention: Risk Acceptance is taking the risk in order to pursue an opportunity. It involves making an informed decision to retain the risk.
Risk Avoidance: Risk Avoidance means avoiding the risk by deciding not to start or continue with the activity that gives rise to the risk
Risk Reduction: Risk Reduction involves implementing new controls to change the likelihood or the consequence.
Risk Transfer: Risk Transfer is sharing the risk with another party or parties through contracts and risk financing or insurance.
Risk Owner: A risk owner is the individual or unit who will take the lead in developing and executing a mitigation activity plan. Additionally, the risk owner is also responsible for communication progress to senior management.
Risk Profile: A Risk Profile represents the entire portfolio of risks that constitute the enterprise.


ERM Project Team
John N. Farley Assistant Vice-President Division of Administration & Finance University of Maryland [email protected] (301) 405-2546 Donna McMahon Assistant Director & UM Risk Manager Office of Risk Management Department of Environmental Safety University of Maryland [email protected] 301-405-3979 Paul L. Walker, Ph.D., CPA ERM Consultant, Professor of Accounting McIntire School of Commerce University of Virginia
Russell Furr Director Dept. of Environmental Safety & Risk Management University of Maryland [email protected] (301) 405-3099 Anna (Cheng) Wang Enterprise Risk Management Graduate Assistant Office of Risk Management Department of Environmental Safety University of Maryland [email protected] (301) 405-3960 Lawrence Bodin, Ph.D. Professor Emeritus of Management Science Smith School of Business University of Maryland