enrollment management advisory council -...
TRANSCRIPT

1
Enrollment Management Advisory Council May 18, 2016
Minutes
Report from Chair
Minutes and presentations from previous meetings are available on the EMAC website
Update on search for Associate Vice Chancellor for Enrollment Management o The committee is meeting 5/18 to review the candidate pool. Seven candidates appear in the
list of top applicants recommended by the consultant.
Task Force on Recruitment and Retention of Latino Students o Jose Vargas-Vila and Becky Porter delivered the report to Kathy Johnson 5/17 o There was a strong sense of a need for an individual or office to serve as a focus for Latino
students. We recognize there are a good number of activities underway on the campus, but they lack coordination. IUPUI needs a point person to bring these efforts together.
o As the budget request from Task Force for Black Students was for diversity generally, no specific additional funding was sought by the Latino Task Force. The need for resources will be identified as campus administration reviews the recommendations and determines strategies for implementation.
o Kathy Johnson and the cabinet will review the report over the summer. It will start to be shared with different groups and with EMAC at a future point.
o The Task Force on the Recruitment and Retention of Latino Faculty and Staff will report in September.
Summer EMAC meetings o These are being left on the calendar for the time-being and Mary Beth Myers will determine if
there is a pressing issue to bring group together or just communicate electronically. Indiana College Readiness Report
ICHE has released its latest report (2014 high school graduates).
One item in the report will have a growing impact in the future on our credit hour production. o More of half the 2014 graduates in the report had AP or dual credit. The number of students
and amount of credits they bring will continue to increase, impacting our gateway courses particularly in Liberal Arts and Science.
o ICHE is continuing to push the early college concept in an effort to encourage students to complete an associate’s degree while in high school. For students who are not in early college high schools, there is advocacy for providing students with the opportunity to complete the statewide 30 credit General Education Core.
See chart below
On a related point, IU is trying to develop a definition for transfer students that is common among all of the campuses. We want to keep students who complete college courses while in high school to remain coded as beginners.
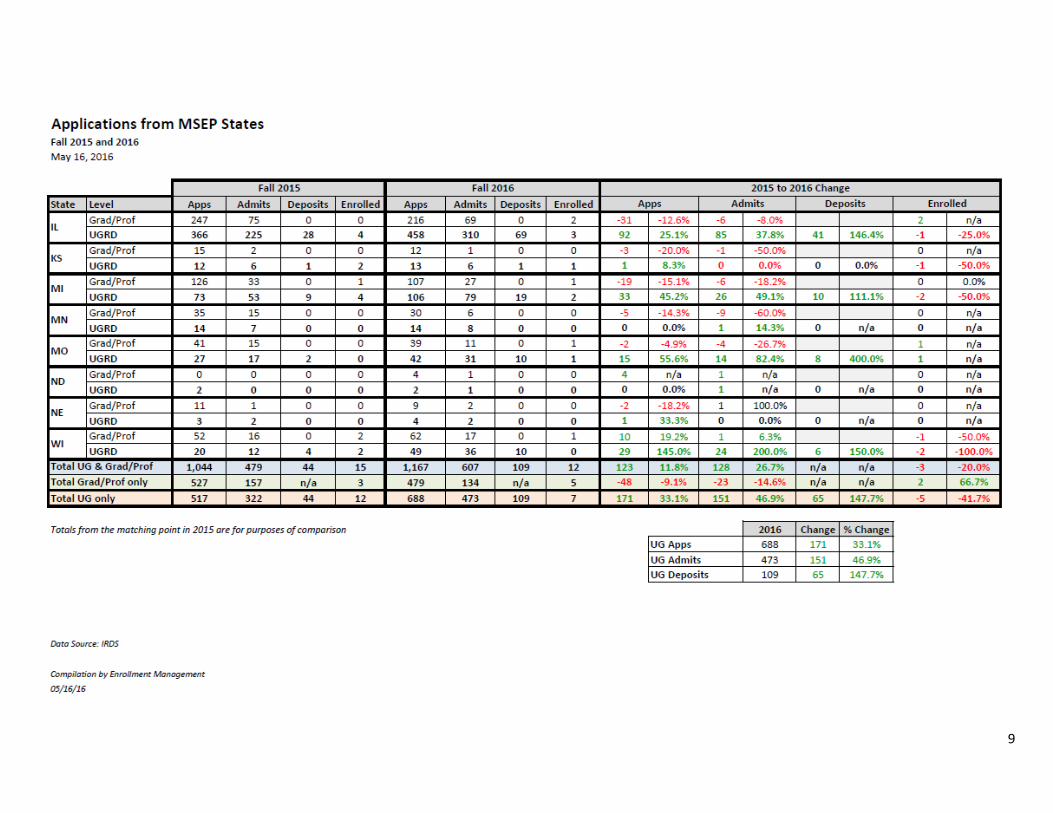
Midwest Student Exchange Program Fall 2016 Admissions Update
Beginner deposits from MSEP participating states are up over deposits from students in those states in 2015.
The total numbers are still relatively small, but given the late adoption of MSEP in the 2016 recruitment cycle, the growth is impressive.
We will work to expand the pipelines that are beginning to appear in particular high schools.
See chart below
2
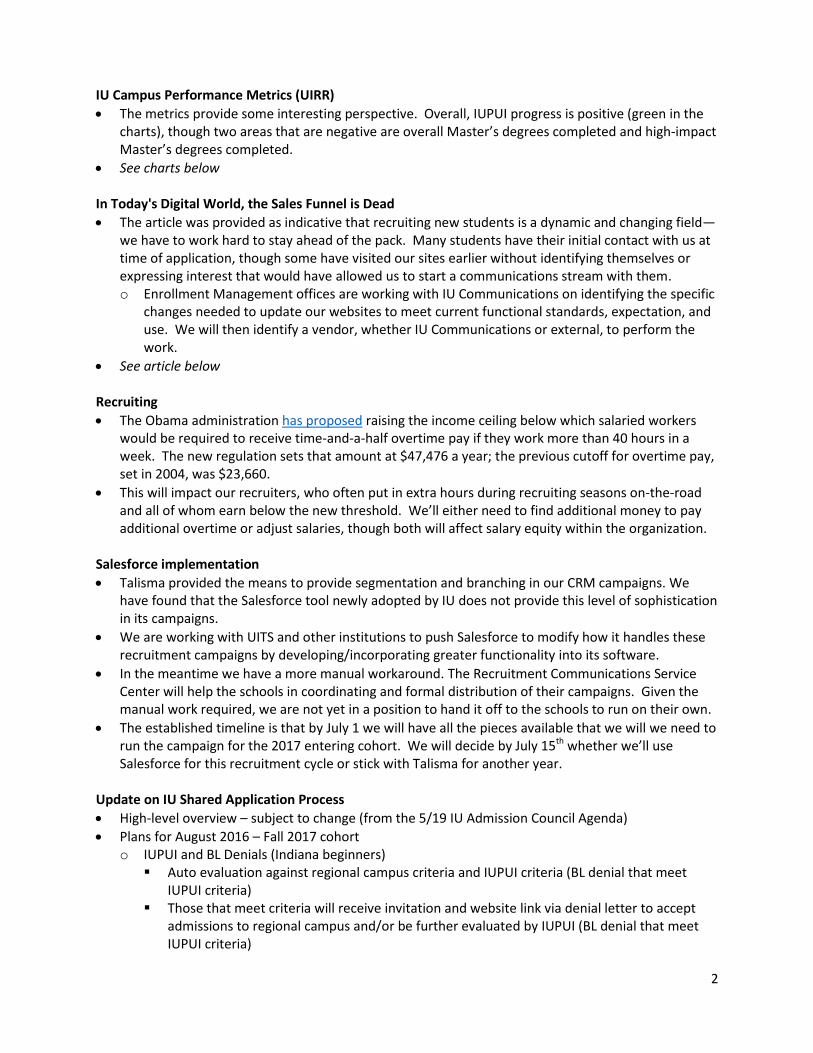
IU Campus Performance Metrics (UIRR)
The metrics provide some interesting perspective. Overall, IUPUI progress is positive (green in the charts), though two areas that are negative are overall Master’s degrees completed and high-impact Master’s degrees completed.
See charts below In Today's Digital World, the Sales Funnel is Dead
The article was provided as indicative that recruiting new students is a dynamic and changing field—we have to work hard to stay ahead of the pack. Many students have their initial contact with us at time of application, though some have visited our sites earlier without identifying themselves or expressing interest that would have allowed us to start a communications stream with them. o Enrollment Management offices are working with IU Communications on identifying the specific
changes needed to update our websites to meet current functional standards, expectation, and use. We will then identify a vendor, whether IU Communications or external, to perform the work.
See article below
Recruiting
The Obama administration has proposed raising the income ceiling below which salaried workers would be required to receive time-and-a-half overtime pay if they work more than 40 hours in a week. The new regulation sets that amount at $47,476 a year; the previous cutoff for overtime pay, set in 2004, was $23,660.
This will impact our recruiters, who often put in extra hours during recruiting seasons on-the-road and all of whom earn below the new threshold. We’ll either need to find additional money to pay additional overtime or adjust salaries, though both will affect salary equity within the organization.
Salesforce implementation
Talisma provided the means to provide segmentation and branching in our CRM campaigns. We have found that the Salesforce tool newly adopted by IU does not provide this level of sophistication in its campaigns.
We are working with UITS and other institutions to push Salesforce to modify how it handles these recruitment campaigns by developing/incorporating greater functionality into its software.
In the meantime we have a more manual workaround. The Recruitment Communications Service Center will help the schools in coordinating and formal distribution of their campaigns. Given the manual work required, we are not yet in a position to hand it off to the schools to run on their own.
The established timeline is that by July 1 we will have all the pieces available that we will we need to run the campaign for the 2017 entering cohort. We will decide by July 15th whether we’ll use Salesforce for this recruitment cycle or stick with Talisma for another year.
Update on IU Shared Application Process
High-level overview – subject to change (from the 5/19 IU Admission Council Agenda)
Plans for August 2016 – Fall 2017 cohort o IUPUI and BL Denials (Indiana beginners)
Auto evaluation against regional campus criteria and IUPUI criteria (BL denial that meet IUPUI criteria)
Those that meet criteria will receive invitation and website link via denial letter to accept admissions to regional campus and/or be further evaluated by IUPUI (BL denial that meet IUPUI criteria)
3
New web interface will provide list of campuses the applicant is eligible for admission (regional campuses) and/or IUPUI to trigger review
Trigger a copy of application for each campuses selected – Regional Campuses (ADMT/MADC), IUPUI (APPL/COAD)
Plans for August 2017 – Fall 2018 cohort o New common IU eApplication
Single application with ability to select multiple campuses – application copied/directed to campuses chosen
Common set of questions with potential to include campus specific questions (TBD) Single app fee Next steps:
Development infrastructure underway
Continue to work specifications, potential user experience exploration, question consolidation
Fall 2016 Projected Enrollment of Beginners and Transfers see research brief below
IRDS is developing a model to help project enrollment of new beginners and transfers. We understand that the closer we get to the first day, the better our projections become.
Different models result in different projections, partly influenced by the change in the speed of processing applications this year. While the tool provides a range of estimates based on different assumptions, the composite model projects the campus would increase by about 150 students.
Transfer students are more consistent—according to the tool we may finish slightly higher in 2016. o Ivy Tech is giving us information on T-SAP enrollment by region. Ivy Tech-Central Indiana region
T-SAP degree that has the highest enrollment is Business. At this point there are only a few T-SAP completers entering IU campuses for Summer/Fall 2016.
Over time, we hope to refine the projection model to allow for better estimates earlier in the summer. Beyond simply knowing how many students to expect, we hope to incorporate a summary of any dual credit they bring with them. This information will be useful in refining our offerings of those courses students most often take in the Fall.
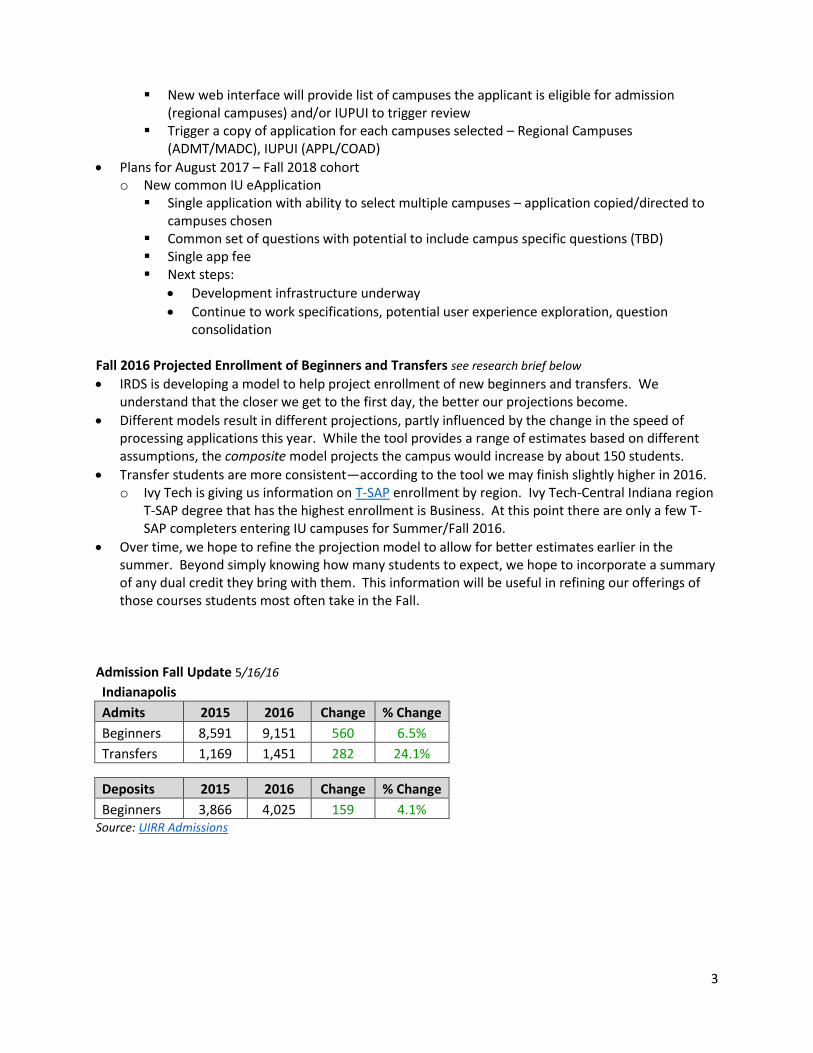
Admission Fall Update 5/16/16
Indianapolis Admits 2015 2016 Change % Change
Beginners 8,591 9,151 560 6.5%
Transfers 1,169 1,451 282 24.1%
Deposits 2015 2016 Change % Change
Beginners 3,866 4,025 159 4.1% Source: UIRR Admissions

4
Enrollment Update 5/16/16 for Fall and Summer II; 5/18 census for Summer I
Summer I
o Summer continues a downward slide and this is also true in Summer II. We are looking at changes in student enrollment as more students may be moving to on-line
enrollment offered elsewhere. The move to flat fee also may have an impact going forward as students complete more credits in the major semesters.
o Student Financial Services has been aggressive in contacting appropriate 21st Century Scholars to encourage summer enrollment to complete the 30 credit required annual progression in order to maintain their award.
o Summer enrollments will undergo additional review with an eye toward establishing baseline information for the future as a number of other changes in coding over the past year makes strict comparisons with earlier years difficult.
o IUPUC made a change to its Summer enrollment process for 2016. Students could register for Spring and Summer at the same time, starting in November. While IUPUC has been down in recent terms (and is at this point for Fall 2016), it is up for Summer I and for Summer II.
o Summer I heads and hours by school appear below
Summer II and Fall o Summer II is adjusted for the timing of registrations in the Dental School, processed earlier in
2016 than in 2015 o Fall has been influenced by the timing of orientation, starting earlier in 2015 than in 2016.
214 beginners were registered at this point for Fall in 2015 compared with 39 this year. 178 external transfers were registered in 2015 compared with 89 this year. These will “correct” as orientation progresses this year.

5
Academic Policies that would benefit from being brought into synchrony Mary Beth Myers
There are a number of policies developed within particular academic units that are not consistent across campus and that pose potential barriers to student success. Several of these are candidates for review and, where possible, brought into alignment. o Academic standing, probation, and dismissal
There is a campus-wide policy but it is not being consistently used as it cites an IUPUI GPA, though the SIS only has an IU GPA (work taken at any IU campus) or the program GPA..
o MATH 110, 111, and ENG W130 Per a directive from the chief academic officer, these three courses should be allowed as
elective credit in any program. However, some schools have not honored that directive, posing a problem for academic advisors and students who would benefit from the additional work but are concerned that it would not apply toward any curricular requirement.
o Course repeat rules and how the repeated and the original course will be used (average, latest, etc.). If a student changes majors these may be treated differently
Further updates will be provided. Members agreed that it is important to keep the faculty involved in such groups such as the Academic Affairs and Student Affairs committees. o On a related point, Mary Beth is drafting an update to the forgiveness policy as “forgiven”
courses are only taken out of a student’s program GPA and not the cumulative GPA. o Once drafted, the proposed revision will be brought to appropriate groups for review and
discussion. A new name also is likely to be proposed.
The group thanked Becky for her leadership of the Division over the past 15 years and in the development of Enrollment Management at IUPUI.
Marianne also was recognized for her EMAC service as she rotates off the group.
Future Meeting Dates
June 15 8:15-9:15 CE 266 July 20 8:15-9:15 CE 266 August 17 8:15-9:15 CE 266 September 21 8:15-9:15 CE 266 October 19 8:15-9:15 CE 266 November 16 8:15-9:15 CE 266 December 14 8:15-9:15 CE 266
2017 January 18 8:15-9:15 CE 266 February 15 8:15-9:15 CE 266 March 8 8:15-9:15 CE 266 April 19 8:15-9:15 CE 266 May 17 8:15-9:15 CE 266 June 21 8:15-9:15 CE 266 July 19 8:15-9:15 CE 266
Websites for EMAC and for the Division of Enrollment Management Enrollment Management Dashboards IRDS

6
Resident deposits are down 6%, NRs are down 13%
Resident deposits are up 1%, NRs are up 46% (n=133)

7

8
9

10
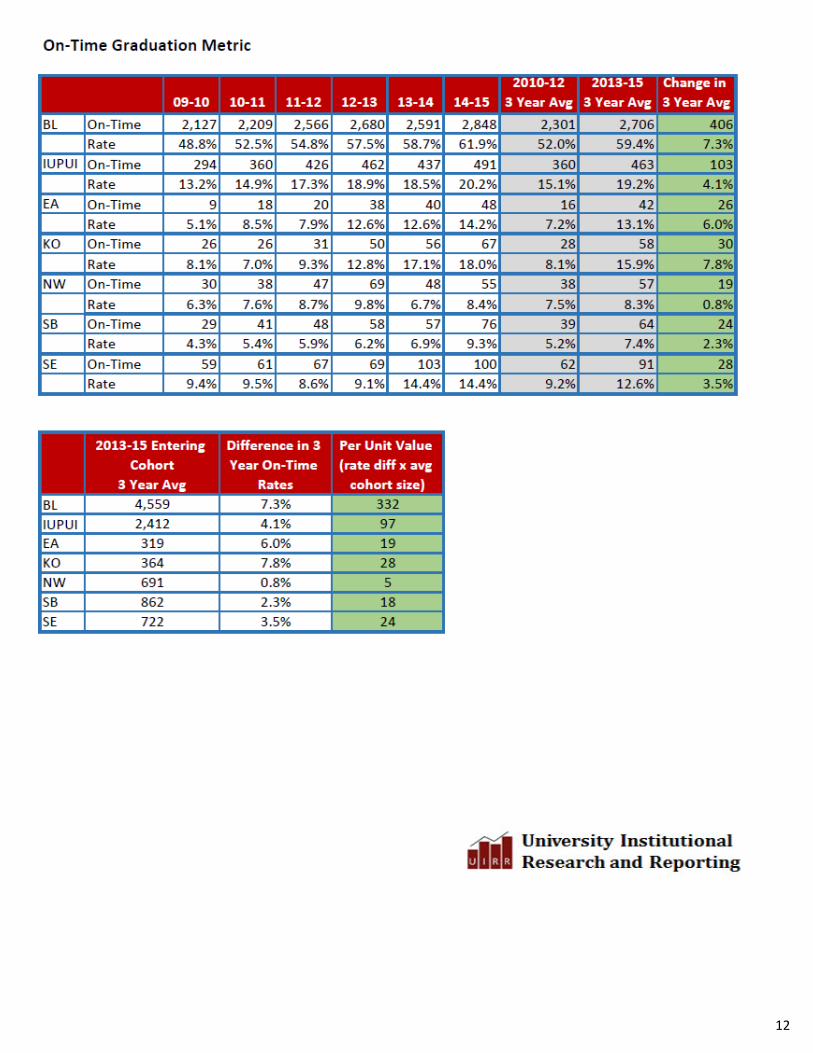
IU Performance Metrics

11
12

13
Advertising Age
In Today's Digital World, the Sales Funnel Is Dead
The Way People Buy Is No Longer a Simple Path from Awareness to Prospect to Sale
March 29, 2016. A few weeks ago, I was at work when I remembered that my coffeemaker had been making weird noises and was doing a less than stellar job of producing a perfect cup. While I was thinking about it, I took a break from checking email to run a quick search on my laptop for "best coffeemakers." I read a couple reviews and browsed a few models before determining that, really, I needed to see them in person to decide which option was best. On my commute that evening, I was greeted by an ad showcasing a variety of shiny chrome models similar to the ones I had been browsing earlier. By the time I got home, I had vowed to head to the store that weekend to check out my options in person. Ironically, once there, I spent half the time on my phone comparing prices and searching for coupons. While I stood there in the aisle, I decided to order my coffeemaker from a different (less expensive) store when I got home -- from the comfort of my couch, on my laptop. Almost exactly where I had started this whole process. What funnel? You probably recognize this chain of events. My search for a new coffeemaker brought me from laptop, to phone, to store, to phone, and back to laptop before I finally pushed the "buy" button. People say the sales funnel is changing -- that, in today's digital world, the way customers buy is no longer a simple path from awareness to prospect to sale. That's just not true. The sales funnel isn't changing -- it's completely and utterly dead. It's been brutally turned upside down, inside out, with little left to identify it as the clean, straightforward process it once was. Today's shopper jumps in and out of channels, views alternatives to purchases, and searches for better deals -- all at the tap of a screen, the click of a button, and oftentimes while standing right in front of the item she's trying to buy. She doesn't predictably slide through the funnel, ushered along by our linear marketing messages. Instead, she more closely resembles a ball in a pinball machine, firing off a bunch of different pegs on the way down, sometimes shooting back up to the top of the funnel before ultimately finding her way to a purchase. She continues to move toward a sale, but it's hard to predict where the bouncing will take her. If it was difficult to influence a shopper's buying decision before, today's landscape makes it
14
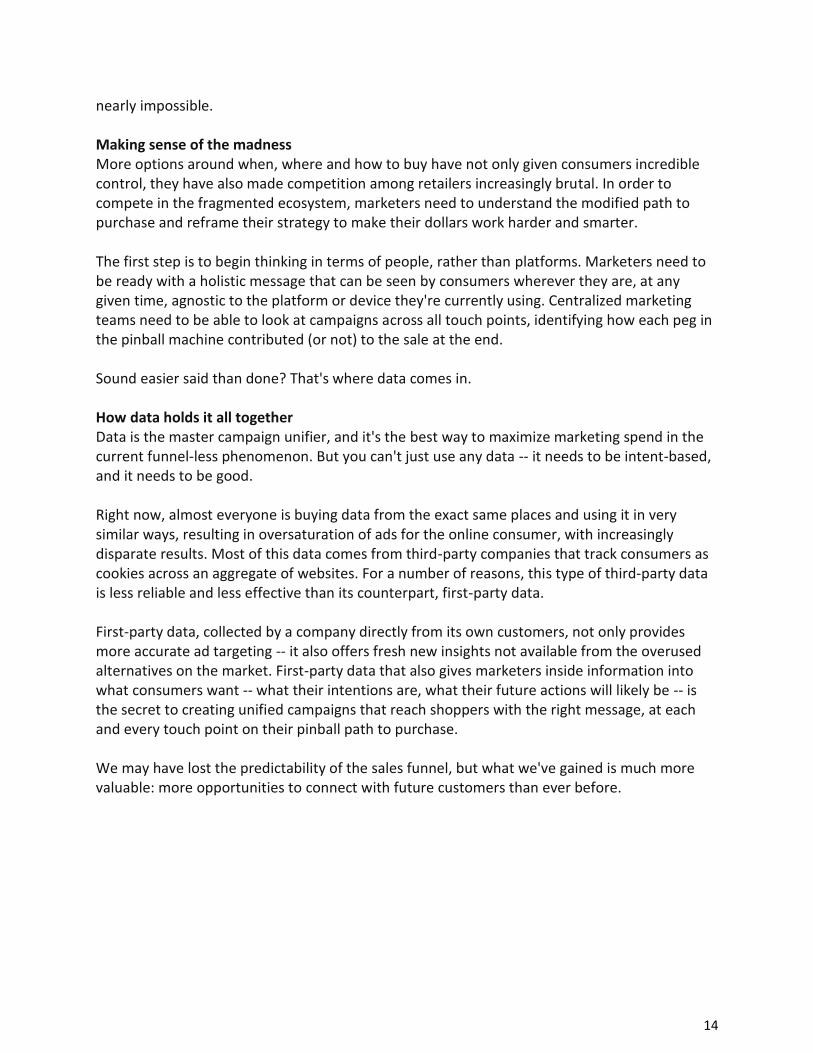
nearly impossible. Making sense of the madness More options around when, where and how to buy have not only given consumers incredible control, they have also made competition among retailers increasingly brutal. In order to compete in the fragmented ecosystem, marketers need to understand the modified path to purchase and reframe their strategy to make their dollars work harder and smarter. The first step is to begin thinking in terms of people, rather than platforms. Marketers need to be ready with a holistic message that can be seen by consumers wherever they are, at any given time, agnostic to the platform or device they're currently using. Centralized marketing teams need to be able to look at campaigns across all touch points, identifying how each peg in the pinball machine contributed (or not) to the sale at the end. Sound easier said than done? That's where data comes in. How data holds it all together Data is the master campaign unifier, and it's the best way to maximize marketing spend in the current funnel-less phenomenon. But you can't just use any data -- it needs to be intent-based, and it needs to be good. Right now, almost everyone is buying data from the exact same places and using it in very similar ways, resulting in oversaturation of ads for the online consumer, with increasingly disparate results. Most of this data comes from third-party companies that track consumers as cookies across an aggregate of websites. For a number of reasons, this type of third-party data is less reliable and less effective than its counterpart, first-party data. First-party data, collected by a company directly from its own customers, not only provides more accurate ad targeting -- it also offers fresh new insights not available from the overused alternatives on the market. First-party data that also gives marketers inside information into what consumers want -- what their intentions are, what their future actions will likely be -- is the secret to creating unified campaigns that reach shoppers with the right message, at each and every touch point on their pinball path to purchase. We may have lost the predictability of the sales funnel, but what we've gained is much more valuable: more opportunities to connect with future customers than ever before.

15
Institutional Research and
Decision Support (IRDS) Fall 2016 Projected Enrollment of Beginners and Transfers
Research Highlights and
Conclusions
• The following displays the results
for projecting Fall 2016 enrollment
of new Beginners and new to IUPUI
External and Intercampus transfers
based on current applications
received and students admitted.
• Projections for Beginners range
from 3,389 to 3,944. The composite
projection represents the average of
all projections. The current
composite (3,701) would represent
the largest class of first-time
beginners in the history of IUPUI.
• Most projections, including the
composite projection, would
suggest the number of incoming
first-year students between 3,600
and 3,800 students. Though there is
a great deal of uncertainty given the
implementation of banded tuition,
new participation in the Midwest
Student Exchange Program
(MSEP), and the increased
processing of applications, a
projection of between 3,600 and
3,800 students seems reasonable at
this point.
• Less variation exists with Transfer
projections. The composite
projection for combined new
external and intercampus transfers
is 1,530 students, a slight increase
from Fall 2015.
The following charts depict a series of enrollment projections for the Fall 2016
cohort of new first-year students and transfer students, based on the number of
students who had applied, were admitted, or paid an enrollment deposit as of
Tuesday May 17, 2016.
Several factors may influence the accuracy of enrollment projections. For
example, beginning in Fall 2016, undergraduate students at IUPUI will be charged
the same tuition dollar amount when taking between 12 and 18 credit hours, a
policy known as banded tuition (http://www.bursar.iupui.edu/bandedtuition.asp).
The effect of this policy on undergraduate enrollment is not known at this time,
and further research will be necessary. In addition, IUPUI now participates in the
tuition reciprocity program as part of the Midwest Student Exchange Program
(MSEP). Under MSEP, students from North Dakota, Nebraska, Kansas, Missouri,
Minnesota, Wisconsin, Illinois, and Michigan pay a reduced rate for out-of-state
tuition. Participation in MSEP could increase the enrollment of out-of-state
students. Finally, the processing of undergraduate admissions decisions has
improved greatly beginning in Fall 2016 (see Appendix 1). As a result, admissions
for Fall 2016 beginners are far outpacing previous semesters. All of these factors
add to the challenge of creating useful enrollment projections.
Because of these challenges, several methods were used to create enrollment
projections. For example, for Fall 2016, applications for beginners are running
slightly lower than 2015 (12,799 as of May 18, 2015, compared to 12,689 as of
May 17, 2016, a 1% decrease. See Appendix 1). Using only current applications
and past trends in the ratios of enrolled students to application, we would project
3,716 new Beginners would be starting in the Fall semester.
Based solely on current admissions, an estimated 3,944 new Beginners would be
projected to start at IUPUI next Fall. However, because of the increased pace,
enrollment projections based on admissions may be biased upward. Deposits for
Fall 2016 are also running ahead of previous years. However, the greater ratio of
deposits to enrolled students in past years, there is reason to believe that the
increased rate of deposits may yield a larger first-year student cohort in the fall
(Table 1).
In addition, the ratio of enrolled students to total applications, as well as the ratio
of enrolled students to admitted students, has declined over the last three years
(see Table 1 below). Three of the projection methods account for these declines,
and projections are based on continued declining ratios. The projected enrollment
would be 3,389 (based on current applications), 3,643 (based on current
admissions) and 3,711 (based on current deposits). Most projections based on the
May 17 data included in this research brief suggest that fall enrollment will be
between 3,600 and 3,800 students.
CONTACT
INFORMATION Steven Graunke
[email protected] 317-274-3617
16
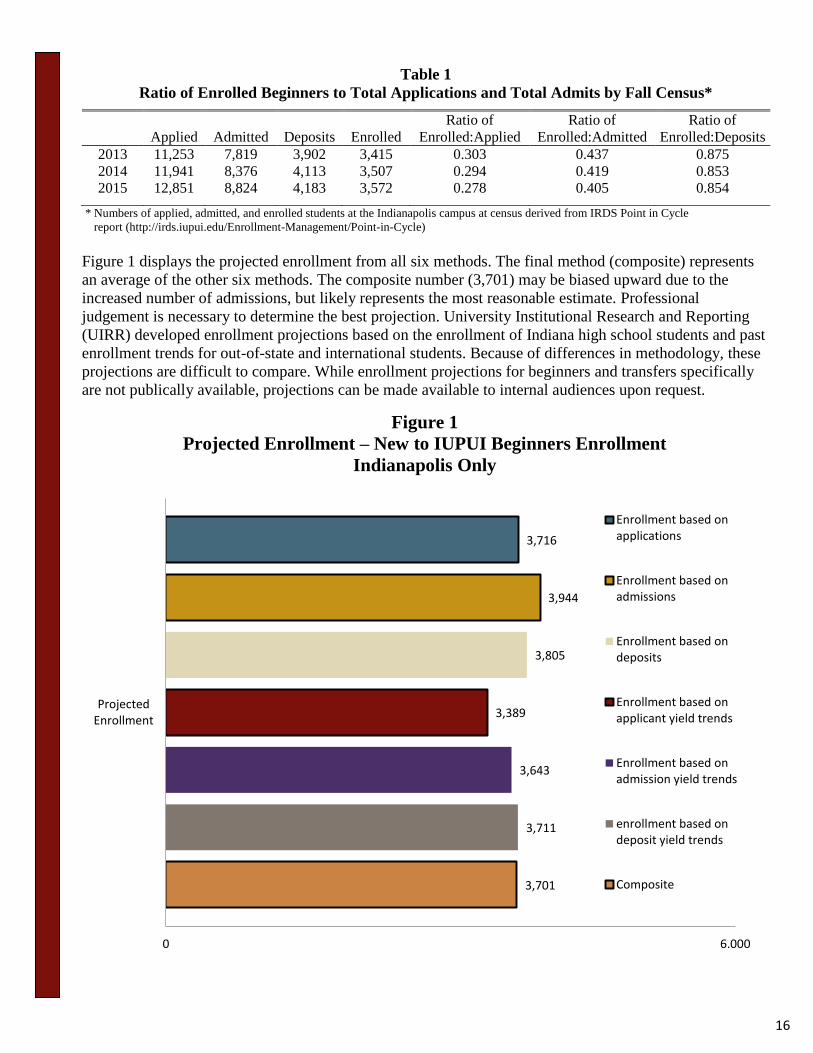
Table 1
Ratio of Enrolled Beginners to Total Applications and Total Admits by Fall Census*
Applied Admitted Deposits Enrolled
Ratio of
Enrolled:Applied
Ratio of
Enrolled:Admitted
Ratio of
Enrolled:Deposits
2013 11,253 7,819 3,902 3,415 0.303 0.437 0.875
2014 11,941 8,376 4,113 3,507 0.294 0.419 0.853
2015 12,851 8,824 4,183 3,572 0.278 0.405 0.854
* Numbers of applied, admitted, and enrolled students at the Indianapolis campus at census derived from IRDS Point in Cycle
report (http://irds.iupui.edu/Enrollment-Management/Point-in-Cycle)
Figure 1 displays the projected enrollment from all six methods. The final method (composite) represents
an average of the other six methods. The composite number (3,701) may be biased upward due to the
increased number of admissions, but likely represents the most reasonable estimate. Professional
judgement is necessary to determine the best projection. University Institutional Research and Reporting
(UIRR) developed enrollment projections based on the enrollment of Indiana high school students and past
enrollment trends for out-of-state and international students. Because of differences in methodology, these
projections are difficult to compare. While enrollment projections for beginners and transfers specifically
are not publically available, projections can be made available to internal audiences upon request.
Figure 1
Projected Enrollment – New to IUPUI Beginners Enrollment
Indianapolis Only
3,701
3,711
3,643
3,389
3,805
3,944
3,716
0 6,000
ProjectedEnrollment
Enrollment based onapplications
Enrollment based onadmissions
Enrollment based ondeposits
Enrollment based onapplicant yield trends
Enrollment based onadmission yield trends
enrollment based ondeposit yield trends
Composite

17
Figure 2 displays the projected enrollment of both external and intercampus transfer students using the
same methods as used for Beginners. In addition to banded tuition and MSEP, enrollment of transfer
students may be effected by declining enrollments at the Ivy Tech Central Indiana region, which is the
largest external transfer feeder institution for IUPUI (https://www.ivytech.edu/files/Fall_2014
_Enrollment_Trends.pdf). Because incoming transfer students do not pay an enrollment deposit,
projections based on enrollment deposits are not included. Projections for transfer students are much more
consistent, ranging from 1,374 (based on current applications and trends in the ratio of enrolled students to
applications) to 1,679 (based on the current number of admissions). Most projections suggest that the
number of incoming transfers will be slightly higher the number of transfers in Fall 2015 (1,429 external
and intercampus transfers). Again, professional judgement is necessary to determine the best projection.
Figure 2
Projected Enrollment – New to IUPUI External and Intercampus
Transfers Indianapolis Only
Discussion
The current composite projection of 3,729 students suggests that the Fall 2016 new Beginner cohort
could be the largest new Beginner cohort in IUPUI’s history. However, caution is warranted, given
that the number of admits is far exceeding previous years. Current projections would seem to
indicate that the number of new external and intercampus transfers beginning at IUPUI in Fall 2016
may be slightly higher than the number of new transfers in Fall 2015.
1,530
1,607
1,374
1,679
1,458
0 6,000
Projected Enrollment
Enrollment based on applications
Enrollment based on admissions
Enrollment based on applicant yieldtrends
Enrollment based on admission yieldtrends
Composite
18
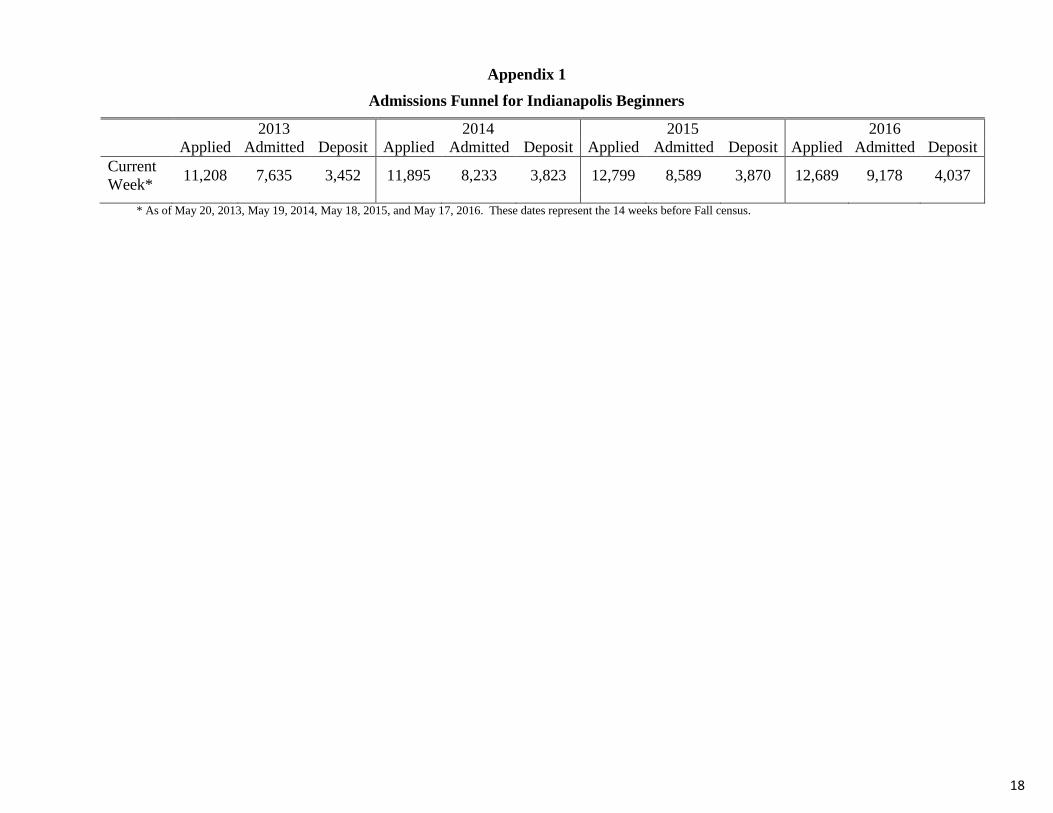
Appendix 1
Admissions Funnel for Indianapolis Beginners
2013 2014 2015 2016
Applied Admitted Deposit Applied Admitted Deposit Applied Admitted Deposit Applied Admitted Deposit
Current
Week* 11,208 7,635 3,452 11,895 8,233 3,823 12,799 8,589 3,870 12,689 9,178 4,037
* As of May 20, 2013, May 19, 2014, May 18, 2015, and May 17, 2016. These dates represent the 14 weeks before Fall census.