enrollment - jacksonville state · pdf fileundergraduate student enrollment - fall 2017....
TRANSCRIPT

Jacksonville State University 33 2017 Fact Book
Enrollment

Jacksonville State University 34 2017 Fact Book

Jacksonville State University 35 2017 Fact Book
Term
Undergraduate
StudentsTotalCreditHours
FTE
Graduate
StudentsTotalCreditHours
FTE
Doctoral
StudentsTotalCreditHours
FTE
Grand Total
StudentsTotalCreditHours
FTE
Fall 2013
Fall 2014
Fall 2015
Fall 2016
Fall 2017 7,387
7,384
7,240
7,599
7,675
88,640
88,609
86,877
91,193
92,094
7,491
7,561
7,383
7,647
7,588
703
670
625
687
720
6,327
6,032
5,628
6,180
6,482
976
913
897
977
1,072
61
20
20
25
23
553
181
176
224
204
100
40
34
35
33
8,151
8,074
7,885
8,311
8,417
95,520
94,822
92,681
97,597
98,780
8,567
8,514
8,314
8,659
8,693
All Students by Year, Level and Full Time Equivalency
Fall 2007 Fall 2008 Fall 2009 Fall 2010 Fall 2011 Fall 2012 Fall 2013 Fall 2014 Fall 2015 Fall 2016 Fall 20170K
1K
2K
3K
4K
5K
6K
7K
8K
9K
10K
Num
ber o
f Stu
dent
s
8,5678,5148,314
8,6598,693
9,161
9,4869,4979,351
9,475
9,070
Student Enrollment by Year
Enrollment and FTE- Fall 2017

Jacksonville State University 36 2017 Fact Book
Enrollment - Fall 2017
Nursing Undecided
Nursing
Undecided-Management
Biology
Criminal Justice
Early Childhood Elementary Ed
Music
Exercise Science/Wellness
Emergency Management
Communication
Psychology
Computer Science
Social Work
English
Family and Consumer Sciences
History
Integrated Studies
Physical Education
Art
Applied Manufacturing Engineer
Undecided
Not Applicable
Other Majors Combined
Grand Total 8,567
2,028
869
314
120
122
131
153
154
160
174
187
198
203
222
257
270
279
351
362
396
501
556
560
All Students(Top 20 Majors)
Female American Indian or Alaska Native
Asian or Asian American
Black or African American
Hispanic/Latino
Native Hawaiian or Other Pacific Islander
White
Other
Not Reported
Total
Male American Indian or Alaska Native
Asian or Asian American
Black or African American
Hispanic/Latino
Native Hawaiian or Other Pacific Islander
White
Other
Not Reported
Total
Not Reported Asian or Asian American
Black or African American
White
Not Reported
Total
Grand Total
4,974
214
37
3,590
6
46
982
61
38
3,546
235
24
2,558
3
39
617
47
23
47
8
28
10
1
8,567
All Studentsby Gender and Ethnicity
Female Male Not Reported0K
2K
4K
Num
ber o
f Stu
dent
s
47
3,546
4,974
All Studentsby Gender
Full-Time Part-Time0K
2K
4K
6K
Num
ber o
f Stu
dent
s
2,811
5,756
All Studentsby Status

Jacksonville State University 37 2017 Fact Book
Class
School of Arts& Humanities
FT PT
School ofBusiness &
Industry
FT PT
School ofEducation
FT PT
School ofScience
FT PT
School ofHealth
Professions &WellnessFT PT
School ofHuman
Services &Social Sciences
FT PT
Other
FT PT
GrandTotal
Freshman
Sophomore
Junior
Senior
Graduate
Doctoral
Grand Total 145
54
49
22
12
8
673
22
166
171
147
167
298
58
116
50
46
28
1,137
16
245
284
280
312
488
317
93
26
35
17
819
84
171
194
195
175
151
40
44
28
21
18
661
19
80
138
184
240
534
63
117
152
98
76
28
1,290
1
50
295
239
283
422
377
35
145
73
44
61
19
825
1
39
149
202
225
209
818
14
16
6
782
351
1
9
3
43
295
8,567
100
976
1,658
1,499
1,614
2,720
All Students by School, Classification and Status
Race/Ethnicity Fall 2013 Fall 2014 Fall 2015 Fall 2016 Fall 2017American Indian or Alaska NativeAsian or Asian AmericanBlack or African AmericanHispanic/LatinoNative Hawaiian or Other Pacific IslanderWhiteOtherNot ReportedGrand Total 8,567
45761
6,1769
851,609
10961
8,51429384
6,2137
901,662
10362
8,314201
925,899
7111
1,839102
63
8,65921387
6,0018
1302,069
9061
8,69326381
5,8367
1232,244
9148
All Students by Ethnicity and Year
Race/EthnicityUndergraduate
Students PercentageGraduate
Students PercentageDoctoral
Students PercentageGrand Total
Students PercentageAmerican Indian or Alaska NativeAsian or Asian AmericanBlack or African AmericanHispanic/LatinoNative Hawaiian or Other Pacific IslanderWhiteOtherNot ReportedGrand Total 87.44%
4.94%0.71%
63.48%0.09%0.88%
15.75%1.03%0.57%
7,49142361
5,4388
751,349
8849
11.39%0.37%
7.70%0.01%0.12%2.81%0.23%0.14%
97632
6601
102412012
1.17%0.02%
0.91%
0.22%0.01%
1002
78
191
100.00%5.33%0.71%
72.09%0.11%0.99%
18.78%1.27%0.71%
8,56745761
6,1769
851,609
10961
All Students by Ethnicity and Level
Students Percentage
Lower Level
Upper Level
Graduate
Doctoral
Grand Total 100.00%
1.17%
11.39%
36.85%
50.59%
8,567
100
976
3,157
4,334
All Students by ClassificationGender Students Percentage
Female
Male
Not Reported
Grand Total 100.00%
0.55%
41.39%
58.06%
8,567
47
3,546
4,974
All Students by Gender

Jacksonville State University 38 2017 Fact Book
Distribution by Age of Students - Fall 2017
Status Age Fall 2013 Fall 2014 Fall 2015 Fall 2016 Fall 2017Full-Time Under 18
18-19
20-21
22-24
25-29
30-34
35-39
40-44
45-49
50-64
65+
Unknown
Part-Time Under 18
18-19
20-21
22-24
25-29
30-34
35-39
40-44
45-49
50-64
65+
Unknown
Grand Total
2
27
51
59
82
165
355
1,042
1,915
2,038
20
2
25
41
59
106
154
390
1,126
1,774
2,022
29
1
4
29
29
69
111
161
362
1,175
1,802
1,866
31
3
33
48
74
125
188
393
1,121
1,913
1,996
42
3
30
58
84
147
192
425
1,141
1,803
2,036
63
4
124
115
168
204
261
463
470
190
98
714
1
7
124
111
154
206
259
452
477
175
110
710
10
117
113
171
189
266
455
476
174
116
587
5
8
131
122
192
250
330
494
472
220
94
405
8
132
142
204
263
366
550
529
222
98
197
8,5678,5148,3148,6598,693
All Students by Status and Age Distribution
Term Undergraduate Graduate Doctoral
Fall 2013
Fall 2014
Fall 2015
Fall 2016
Fall 2017 39.5
42.4
44.6
44.1
43.2
32.4
32.2
32.4
32.9
33.2
22.1
22.3
22.5
22.9
23.2
All Students by Average Age
Jacksonville State University 39 2017 Fact Book
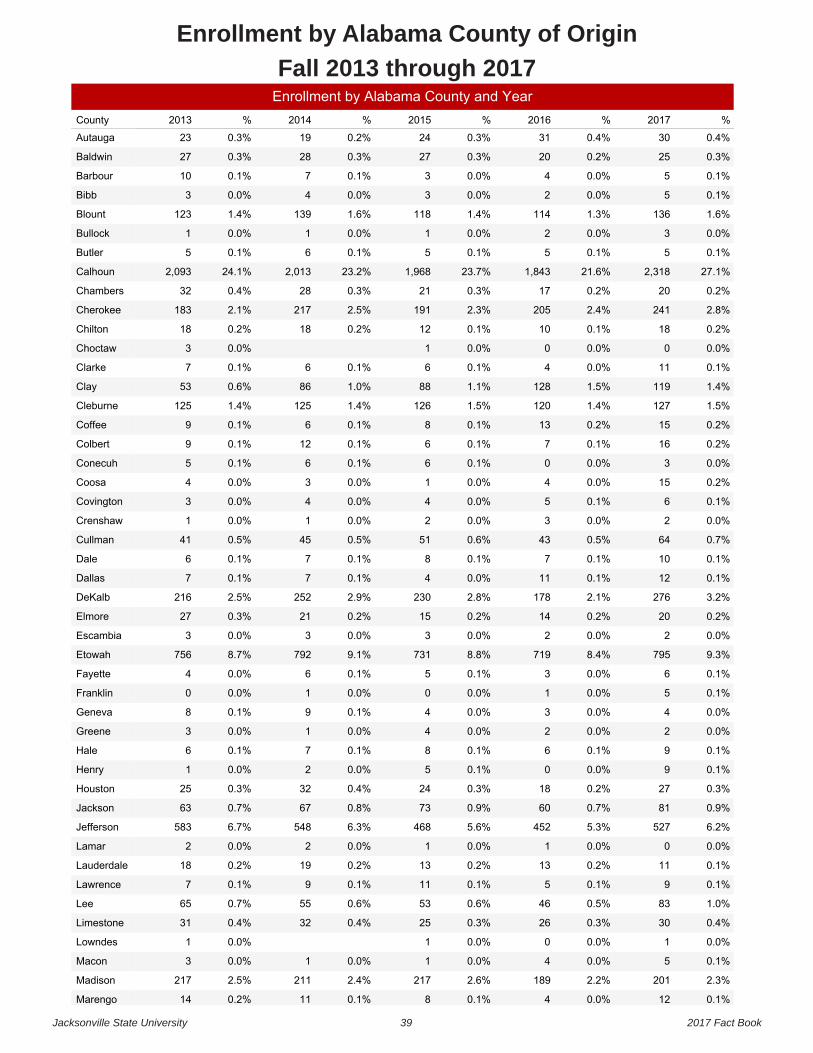
Enrollment by Alabama County of OriginFall 2013 through 2017
County 2013 % 2014 % 2015 % 2016 % 2017 %Autauga
Baldwin
Barbour
Bibb
Blount
Bullock
Butler
Calhoun
Chambers
Cherokee
Chilton
Choctaw
Clarke
Clay
Cleburne
Coffee
Colbert
Conecuh
Coosa
Covington
Crenshaw
Cullman
Dale
Dallas
DeKalb
Elmore
Escambia
Etowah
Fayette
Franklin
Geneva
Greene
Hale
Henry
Houston
Jackson
Jefferson
Lamar
Lauderdale
Lawrence
Lee
Limestone
Lowndes
Macon
Madison
MarengoMarion
0.1%
2.3%
0.1%
0.0%
0.4%
1.0%
0.1%
0.1%
0.0%
6.2%
0.9%
0.3%
0.1%
0.1%
0.0%
0.0%
0.1%
0.1%
9.3%
0.0%
0.2%
3.2%
0.1%
0.1%
0.7%
0.0%
0.1%
0.2%
0.0%
0.2%
0.2%
1.5%
1.4%
0.1%
0.0%
0.2%
2.8%
0.2%
27.1%
0.1%
0.0%
1.6%
0.1%
0.1%
0.3%
0.4%
12
201
5
1
30
83
9
11
0
527
81
27
9
9
2
4
5
6
795
2
20
276
12
10
64
2
6
15
3
16
15
127
119
11
0
18
241
20
2,318
5
3
136
5
5
25
30
0.0%
2.2%
0.0%
0.0%
0.3%
0.5%
0.1%
0.2%
0.0%
5.3%
0.7%
0.2%
0.0%
0.1%
0.0%
0.0%
0.0%
0.0%
8.4%
0.0%
0.2%
2.1%
0.1%
0.1%
0.5%
0.0%
0.1%
0.0%
0.0%
0.1%
0.2%
1.4%
1.5%
0.0%
0.0%
0.1%
2.4%
0.2%
21.6%
0.1%
0.0%
1.3%
0.0%
0.0%
0.2%
0.4%
4
189
4
0
26
46
5
13
1
452
60
18
0
6
2
3
1
3
719
2
14
178
11
7
43
3
5
4
0
7
13
120
128
4
0
10
205
17
1,843
5
2
114
2
4
20
31
0.1%
2.6%
0.0%
0.0%
0.3%
0.6%
0.1%
0.2%
0.0%
5.6%
0.9%
0.3%
0.1%
0.1%
0.0%
0.0%
0.0%
0.1%
8.8%
0.0%
0.2%
2.8%
0.0%
0.1%
0.6%
0.0%
0.0%
0.0%
0.1%
0.1%
0.1%
1.5%
1.1%
0.1%
0.0%
0.1%
2.3%
0.3%
23.7%
0.1%
0.0%
1.4%
0.0%
0.0%
0.3%
0.3%
8
217
1
1
25
53
11
13
1
468
73
24
5
8
4
4
0
5
731
3
15
230
4
8
51
2
4
1
6
6
8
126
88
6
1
12
191
21
1,968
5
1
118
3
3
27
24
0.1%
2.4%
0.0%
0.4%
0.6%
0.1%
0.2%
0.0%
6.3%
0.8%
0.4%
0.0%
0.1%
0.0%
0.1%
0.0%
0.1%
9.1%
0.0%
0.2%
2.9%
0.1%
0.1%
0.5%
0.0%
0.0%
0.0%
0.1%
0.1%
0.1%
1.4%
1.0%
0.1%
0.2%
2.5%
0.3%
23.2%
0.1%
0.0%
1.6%
0.0%
0.1%
0.3%
0.2%
11
211
1
32
55
9
19
2
548
67
32
2
7
1
9
1
6
792
3
21
252
7
7
45
1
4
3
6
12
6
125
86
6
18
217
28
2,013
6
1
139
4
7
28
19
0.2%
2.5%
0.0%
0.0%
0.4%
0.7%
0.1%
0.2%
0.0%
6.7%
0.7%
0.3%
0.0%
0.1%
0.0%
0.1%
0.0%
0.0%
8.7%
0.0%
0.3%
2.5%
0.1%
0.1%
0.5%
0.0%
0.0%
0.0%
0.1%
0.1%
0.1%
1.4%
0.6%
0.1%
0.0%
0.2%
2.1%
0.4%
24.1%
0.1%
0.0%
1.4%
0.0%
0.1%
0.3%
0.3%
14
217
3
1
31
65
7
18
2
583
63
25
1
6
3
8
0
4
756
3
27
216
7
6
41
1
3
4
5
9
9
125
53
7
3
18
183
32
2,093
5
1
123
3
10
27
23
Enrollment by Alabama County and Year

Jacksonville State University 40 2017 Fact Book
County 2013 % 2014 % 2015 % 2016 % 2017 %MarengoMarion
Marshall
Mobile
Monroe
Montgomery
Morgan
Perry
Pickens
Pike
Randolph
Russell
Shelby
St. Clair
Sumter
Talladega
Tallapoosa
Tuscaloosa
Walker
Washington
Wilcox
Winston
Unknown
Out-of-State
International
Grand Total 100.0%
2.0%
15.0%
0.1%
0.1%
0.0%
0.0%
0.4%
0.7%
0.4%
5.2%
0.0%
4.1%
2.3%
0.2%
1.3%
0.0%
0.1%
0.0%
0.9%
0.5%
0.0%
0.4%
4.0%
0.0%
8,567
173
1,284
9
5
2
2
33
59
30
449
1
352
197
18
114
4
5
3
74
47
2
36
343
4
100.0%
1.9%
15.3%
16.8%
0.1%
0.0%
0.0%
0.3%
0.4%
0.3%
4.3%
0.0%
2.1%
1.5%
0.2%
1.0%
0.0%
0.0%
0.0%
0.6%
0.4%
0.0%
0.3%
3.2%
0.0%
8,514
165
1,303
1,428
5
1
0
26
38
23
364
1
182
128
19
85
2
4
2
53
37
0
27
274
3
100.0%
1.8%
15.4%
11.5%
0.1%
0.0%
0.0%
0.3%
0.3%
0.3%
4.9%
0.0%
1.5%
2.9%
0.2%
0.7%
0.1%
0.1%
0.0%
0.7%
0.5%
0.0%
0.3%
3.2%
0.0%
8,314
148
1,283
953
5
2
0
29
28
28
410
1
123
238
13
62
5
6
4
60
40
1
21
268
2
100.0%
1.5%
16.6%
10.0%
0.1%
0.0%
0.0%
0.3%
0.3%
0.3%
4.2%
0.1%
3.0%
1.6%
0.2%
0.8%
0.0%
0.1%
0.1%
0.6%
0.5%
0.0%
0.3%
3.2%
0.1%
8,659
130
1,439
862
7
3
0
25
28
30
363
5
258
139
15
67
2
9
6
50
42
2
30
273
5
100.0%
1.4%
17.8%
10.5%
0.1%
0.0%
0.0%
0.2%
0.3%
0.3%
4.1%
0.0%
1.5%
2.5%
0.1%
0.8%
0.0%
0.1%
0.1%
0.5%
0.4%
0.0%
0.4%
2.9%
0.1%
8,693
124
1,547
915
5
3
1
20
28
25
359
3
133
219
10
66
4
8
9
46
37
0
33
249
5
Enrollment by Alabama County and Year

Jacksonville State University 41 2017 Fact Book
Enrollment by Alabama County - Fall 2017

Jacksonville State University 42 2017 Fact Book
Enrollment by Georgia County - Fall 2017
Worth0
Worth0
Wilkinson0
Wilkinson0
Wilkes0
Wilkes0
Wilcox0
Wilcox0
Whitfield10
Whitfield10
White0
White0
Wheeler0
Wheeler0
Webster0
Webster0
Wayne0
Wayne0
Washington0
Washington0
Warren0
Warren0
Ware0
Ware0
Walton3
Walton3
Walker27
Walker27
Upson0
Upson0
Union1
Union1
Twiggs0
Twiggs0
Turner0
Turner0
Troup5
Troup5
Treutlen0
Treutlen0
Towns0
Towns0
Toombs0
Toombs0
Tift0
Tift0
Thomas4
Thomas4
Terrell0
Terrell0
Telfair0
Telfair0
Taylor1
Taylor1
Tattnall0
Tattnall0
Taliaferro0
Taliaferro0
Talbot0
Talbot0
Sumter0
Sumter0
Stewart0
Stewart0
Stephens1
Stephens1
Spalding0
Spalding0
Seminole0
Seminole0
Screven0
Screven0
Schley0
Schley0
Rockdale2
Rockdale2
Richmond1
Richmond1
Randolph0
Randolph0
Rabun0
Rabun0
Quitman1
Quitman1
Putnam0
Putnam0
Pulaski0
Pulaski0
Polk42
Polk42
Pike1
Pike1
Pierce0
Pierce0
Pickens1
Pickens1
Peach1
Peach1
Paulding86
Paulding86 Oglethorpe
0Oglethorpe
0Oconee
0Oconee
0
Newton5
Newton5
Muscogee8
Muscogee8
Murray5
Murray5
Morgan0
Morgan0
Montgomery0
Montgomery0
Monroe0
Monroe0
Mitchell1
Mitchell1Miller
0Miller
0
Meriwether0
Meriwether0
McIntosh0
McIntosh0
McDuffie0
McDuffie0
Marion0
Marion0
Madison1
Madison1
Macon0
Macon0
Lumpkin2
Lumpkin2
Lowndes4
Lowndes4
Long0
Long0
Lincoln0
Lincoln0
Liberty1
Liberty1
Lee1
Lee1
Laurens0
Laurens0
Lanier0
Lanier0
Lamar0
Lamar0 Jones
0Jones
0
Johnson0
Johnson0
Jenkins0
Jenkins0
Jefferson0
Jefferson0
Jeff Davis1
Jeff Davis1
Jasper0
Jasper0
Jackson2
Jackson2
Irwin0
Irwin0
Houston4
Houston4
Henry46
Henry46
Heard1
Heard1
Hart0
Hart0
Harris5
Harris5
Haralson23
Haralson23
Hancock0
Hancock0
Hall2
Hall2
Habersham0
Habersham0
Gwinnett23
Gwinnett23
Greene0
Greene0
Grady1
Grady1
Gordon14
Gordon14
Glynn0
Glynn0
Glascock0
Glascock0
Gilmer1
Gilmer1
Fulton25
Fulton25
Franklin0
Franklin0
Forsyth11
Forsyth11
Floyd139
Floyd139
Fayette12
Fayette12
Fannin0
Fannin0
Evans0
Evans0
Emanuel0
Emanuel0
Elbert0
Elbert0
Effingham0
Effingham0
Echols0
Echols0
Early0
Early0
Douglas103
Douglas103
Dougherty0
Dougherty0
Dooly0
Dooly0
Dodge0
Dodge0
Decatur0
Decatur0
De Kalb15
De Kalb15
Dawson0
Dawson0
Dade2
Dade2
Crisp0
Crisp0
Crawford0
Crawford0
Coweta60
Coweta60
Cook0
Cook0
Columbia4
Columbia4
Colquitt2
Colquitt2
Coffee1
Coffee1
Cobb80
Cobb80
Clinch0
Clinch0
Clayton10
Clayton10
Clay0
Clay0
Clarke1
Clarke1
Cherokee8
Cherokee8
Chattooga31
Chattooga31
Chattahoochee0
Chattahoochee0
Chatham3
Chatham3
Charlton0
Charlton0
Catoosa13
Catoosa13
Carroll53
Carroll53
Candler0
Candler0
Camden0
Camden0
Calhoun0
Calhoun0
Butts0
Butts0
Burke1
Burke1
Bulloch1
Bulloch1
Bryan1
Bryan1
Brooks0
Brooks0
Brantley0
Brantley0
Bleckley0
Bleckley0
Bibb0
Bibb0
Berrien0
Berrien0
Ben Hill1
Ben Hill1
Bartow37
Bartow37
Barrow0
Barrow0
Banks1
Banks1
Baldwin5
Baldwin5
Baker0
Baker0
Bacon0
Bacon0
Atkinson0
Atkinson0
Appling0
Appling0

Jacksonville State University 43 2017 Fact Book
State 2013 2014 2015 2016 2017AlabamaAlaskaArizonaArkansasCaliforniaColoradoConnecticutDelawareDistrict of ColumbiaFloridaGeorgiaHawaiiIdahoIllinoisIndianaIowaKansasKentuckyLouisianaMaineMarylandMassachusettsMichiganMinnesotaMississippiMissouriMontanaNebraskaNevadaNew HampshireNew JerseyNew MexicoNew YorkNorth CarolinaNorth DakotaOhioOklahomaOregonPennsylvaniaRhode IslandSouth CarolinaSouth DakotaTennesseeTexasUtahVermontVirginiaWashingtonWest VirginiaWisconsinWyomingInternationalUnknownGrand Total 8,567
11173
0236
2301
27383
15171130
1871210025
131756146331701
95951122
1210284
7,107
8,51414
1650413
2200
33331
17084141
1472602116
141529279342901
95062043
1214373
7,038
8,31419
1480525
2501
26290
12074091
1481602109
192416175122
1211
94960125
1015140
6,869
8,65927
1300624
2400
31250
130921
100
2080711207
19471
10159515
1912
1,069660178
15060
7,068
8,69399
1240516
2010
32311
202711
111
20110404208
27340
1516
14413
2110
1,141740148
17342
6,927
Enrollment by State and Year

Jacksonville State University 44 2017 Fact Book
Enrollment in Southeastern U.S. Region - Fall 2017

Jacksonville State University 45 2017 Fact Book
Undergraduate Student Enrollment - Fall 2017
Undecided Management
Nursing Undecided
Nursing
Early Childhood Elementary Ed
Biology
Criminal Justice
Exercise Science/Wellness
Music
Communication
Psychology
Computer Science
Social Work
Family and Consumer Sciences
English
Emergency Management
History
Integrated Studies
Art
Applied Manufacturing Engineer
Computer Information Systems
Not Applicable
Undecided
Other Majors Combined
Grand Total 7,491
1,278
314
854
119
120
122
153
139
141
155
157
187
198
190
222
266
270
346
356
351
492
560
501
Undergraduate Students(Top 20 Majors)
Gender Race/EthnicityFemale American Indian or Alaska Native
Asian or Asian American
Black or African American
Hispanic/Latino
Native Hawaiian or Other Pacific Islander
White
Other
Not Reported
Total
Male American Indian or Alaska Native
Asian or Asian American
Black or African American
Hispanic/Latino
Native Hawaiian or Other Pacific Islander
White
Other
Not Reported
Total
NotReported
Asian or Asian American
Black or African American
White
Not Reported
Total
Grand Total
4,268
191
37
3,122
5
40
797
48
28
3,176
224
24
2,288
3
35
542
39
21
47
8
28
10
1
7,491
Undergraduate Studentsby Gender and Ethnicity
Female Male Not Reported0K
1K
2K
3K
4K
Num
ber o
f Stu
dent
s
47
3,176
4,268
Undergraduate Studentsby Gender
FT PT0K
1K
2K
3K
4K
5K
6K
Num
ber o
f Stu
dent
s
1,968
5,523
Undergraduate Studentsby Status
Jacksonville State University 46 2017 Fact Book
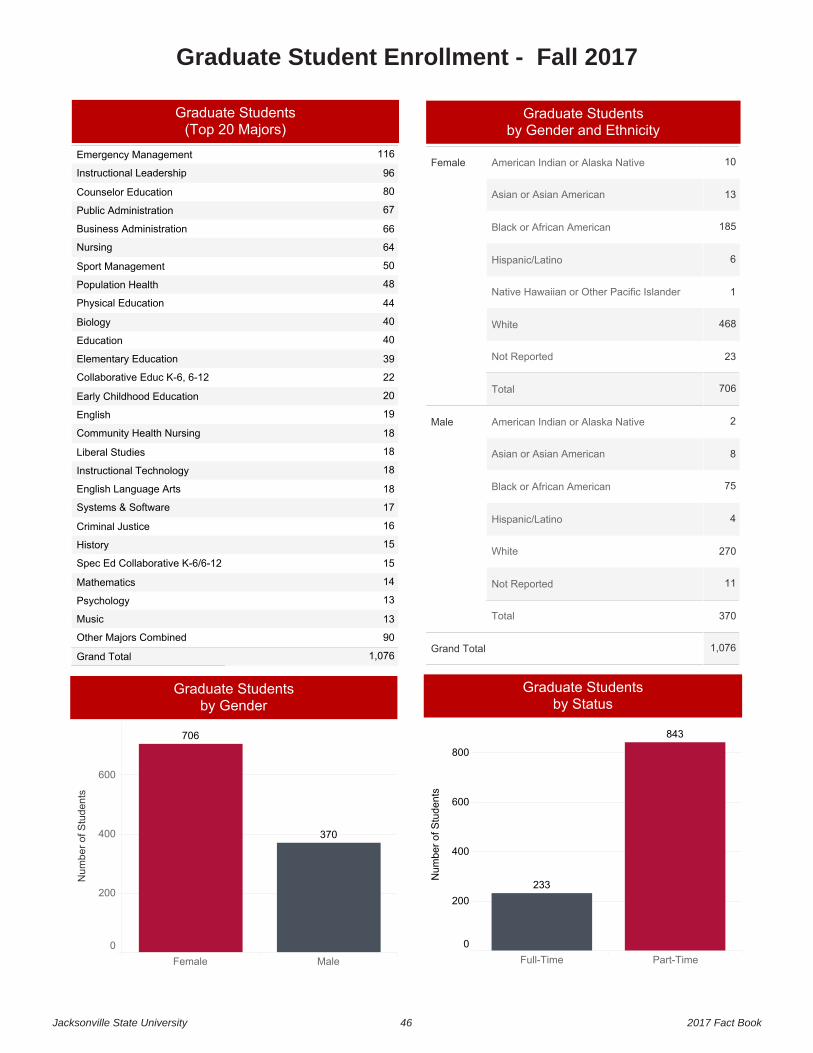
Graduate Student Enrollment - Fall 2017
Emergency Management
Instructional Leadership
Counselor Education
Public Administration
Business Administration
Nursing
Sport Management
Population Health
Physical Education
Biology
Education
Elementary Education
Collaborative Educ K-6, 6-12
Early Childhood Education
English
Community Health Nursing
Liberal Studies
Instructional Technology
English Language Arts
Systems & Software
Criminal Justice
History
Spec Ed Collaborative K-6/6-12
Mathematics
Psychology
Music
Other Majors Combined
Grand Total 1,076
90
13
13
14
15
15
16
17
18
18
18
18
19
20
22
39
40
40
44
48
50
64
66
67
80
96
116
Graduate Students(Top 20 Majors)
Female American Indian or Alaska Native
Asian or Asian American
Black or African American
Hispanic/Latino
Native Hawaiian or Other Pacific Islander
White
Not Reported
Total
Male American Indian or Alaska Native
Asian or Asian American
Black or African American
Hispanic/Latino
White
Not Reported
Total
Grand Total
706
23
468
1
6
185
13
10
370
11
270
4
75
8
2
1,076
Graduate Studentsby Gender and Ethnicity
Full-Time Part-Time0
200
400
600
800
Num
ber o
f Stu
dent
s
843
233
Graduate Studentsby Status
Female Male0
200
400
600
Num
ber o
f Stu
dent
s
370
706
Graduate Studentsby Gender

Jacksonville State University 47 2017 Fact Book
Online Distance Education Student Enrollment - Fall 2017
Nursing Undecided
Nursing
Emergency Management
Undecided Management
Criminal Justice
Biology
Family and Consumer Sciences
Integrated Studies
Exercise Science/Wellness
Early Childhood Elementary Ed
Psychology
Management
Instructional Leadership
Social Work
Music
Physical Education
English
Accounting
Communication
Sport Mgt and Rec Studies
Business Administration
Public Administration
Undecided
Other Majors Combined
Grand Total 4,019
1,066
124
57
61
65
65
70
71
75
78
89
92
96
105
105
116
119
124
129
182
237
251
316
326
Online Students(Top 20 Majors)
Female American Indian or Alaska Native
Asian or Asian American
Black or African American
Hispanic/Latino
Native Hawaiian or Other Pacific Islander
White
Not Reported
Other
Male American Indian or Alaska Native
Asian or Asian American
Black or African American
Hispanic/Latino
Native Hawaiian or Other Pacific Islander
White
Not Reported
Other
NotReported
Black or African American
White
Not Reported
Grand Total
24
84
1,729
2
22
553
19
22
7
57
1,125
2
14
320
14
9
3
7
6
4,019
Online Studentsby Gender and Ethnicity
Female Male Not Reported0
500
1000
1500
2000
2500
Num
ber o
f Stu
dent
s
16
1,548
2,455
Online Studentsby Gender
Full-Time Part-Time0
500
1000
1500
2000
2500
Num
ber o
f Stu
dent
s
1,477
2,542
Online Studentsby Status

Jacksonville State University 48 2017 Fact Book
International Student Enrollment - Fall 2017
Undecided ManagementBiologyComputer ScienceSystems & SoftwareEnglishPolitical ScienceSport ManagementCommunicationExercise Science/WellnessCriminal JusticeBusiness AdministrationFinanceIntegrated StudiesNursing UndecidedArtComputer Information SystemsDramaPublic AdministrationApplied Manufacturing EngineerPsychologyEmergency ManagementNursingMusicPhysical EducationSport Mgt and Rec StudiesAccountingEconomicsManagementFamily and Consumer SciencesManufacturing Systems TechMarketingOccupation Safety & Hlth MgmtRespiratory Therapy UndecidedNot ApplicableUndecidedGrand Total 173
5611111111222223333334445666778
11121333
International Studentsby Major
Female Male Not Reported0
20
40
60
80
Num
ber o
f Stu
dent
s
2
8388
International Studentsby Gender
FT PT0
50
100
150
Num
ber o
f Stu
dent
s
17
156
International Studentsby Status
Female Asian or Asian American
Black or African American
Hispanic/Latino
White
Other
Not Reported
Total
Male Asian or Asian American
Black or African American
Hispanic/Latino
White
Not Reported
Total
NotReported
Asian or Asian American
White
Total
Grand Total
88
23
1
26
2
10
26
83
20
32
1
7
23
2
1
1
173
International Studentsby Gender and Ethnicity