northwest university 20 year enrollment...
TRANSCRIPT

2009
2010
2011
2012
2013
2014
1988
1989
1991
1992
1993
1994
0
200
400
600
800
1000
1200
1400
1600
1800
2000
824 768 737 719
811 819 822 847 855 886 945 939
898 840 843
800
894 948 958
918
34 124 129
161 220 224
235 225 182
183 202
178
156 173 221
275
298 284
238 20
38 81 112
107 124
120
176
237 274
264
257 295
300
44
42
47
51
44
126
124
25 16
63 74
88
80
74
77
49
56
104 28
78
44
Online Graduate
Online Undergrad
CPP
Miscellaneous
Extension Sites
Kirkland Graduate
Kirkland Adult Evening
Kirkland Traditional
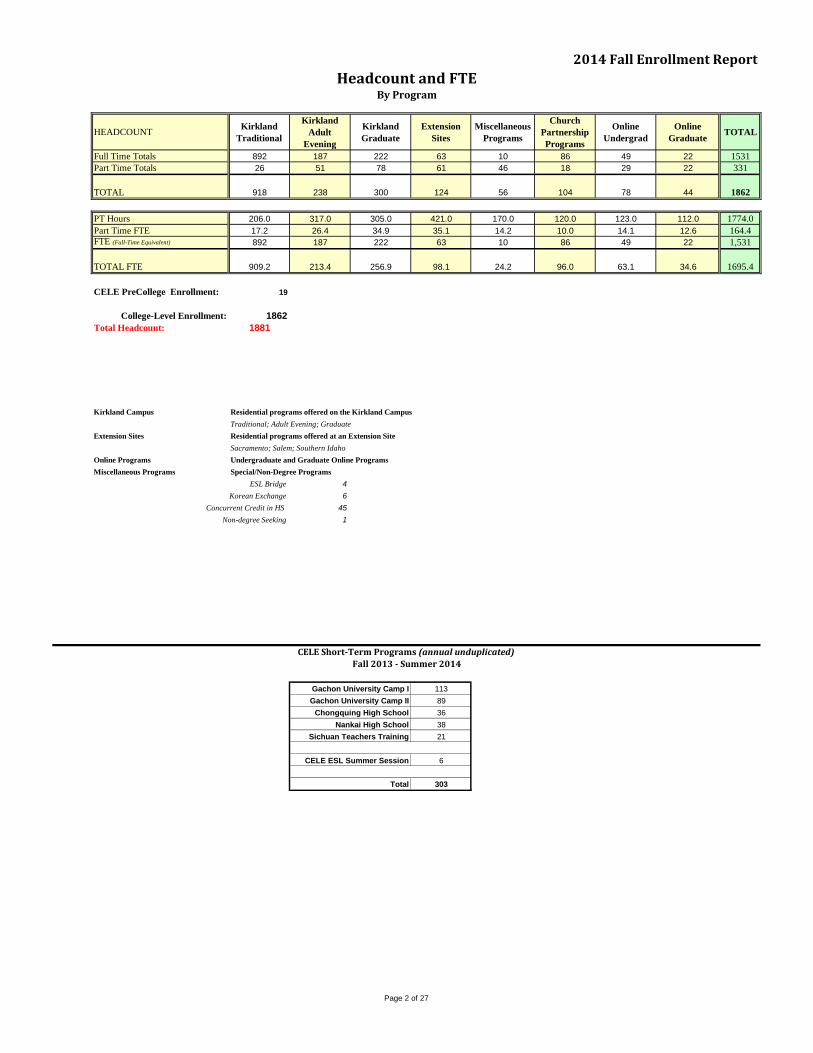
Northwest University 20 Year Enrollment Comparison
(Report Date: 10/27/2014)
861
802
1039
972
1066 1120
1161 1180
1260
848
1281 1290
1383 1422
1558
1624
1740
1862
1259
Page 1 of 27
HEADCOUNTKirkland
Traditional
Kirkland
Adult
Evening
Kirkland
Graduate
Extension
Sites
Miscellaneous
Programs
Church
Partnership
Programs
Online
Undergrad
Online
GraduateTOTAL
Full Time Totals 892 187 222 63 10 86 49 22 1531
Part Time Totals 26 51 78 61 46 18 29 22 331
TOTAL 918 238 300 124 56 104 78 44 1862
PT Hours 206.0 317.0 305.0 421.0 170.0 120.0 123.0 112.0 1774.0
Part Time FTE 17.2 26.4 34.9 35.1 14.2 10.0 14.1 12.6 164.4FTE (Full-Time Equivalent) 892 187 222 63 10 86 49 22 1,531
TOTAL FTE 909.2 213.4 256.9 98.1 24.2 96.0 63.1 34.6 1695.4
CELE PreCollege Enrollment: 19
College-Level Enrollment: 1862
Total Headcount: 1881
Kirkland Campus Residential programs offered on the Kirkland Campus
Traditional; Adult Evening; Graduate
Extension Sites Residential programs offered at an Extension Site
Sacramento; Salem; Southern Idaho
Online Programs Undergraduate and Graduate Online Programs
Miscellaneous Programs Special/Non-Degree Programs
ESL Bridge 4
Korean Exchange 6
Concurrent Credit in HS 45
Non-degree Seeking 1
Gachon University Camp I 113
Gachon University Camp II 89
Chongquing High School 36
Nankai High School 38
Sichuan Teachers Training 21
CELE ESL Summer Session 6
Total 303
2014 Fall Enrollment Report
Fall 2013 - Summer 2014
Headcount and FTEBy Program
CELE Short-Term Programs (annual unduplicated)
Page 2 of 27
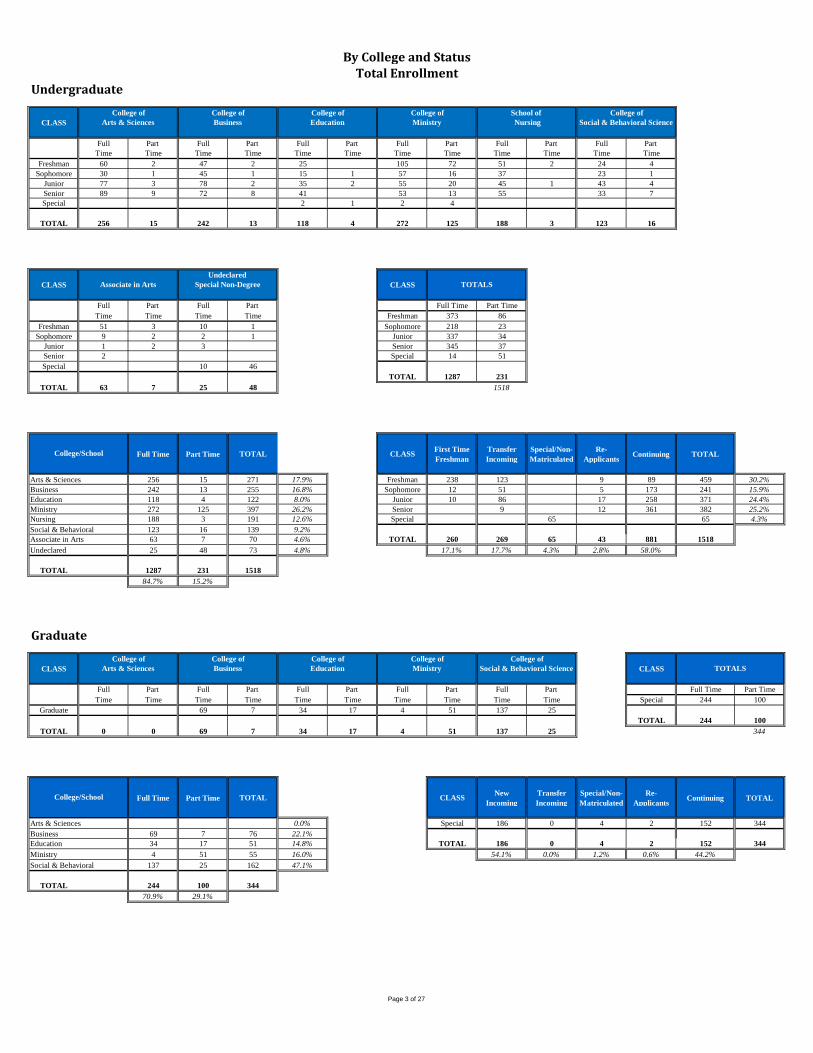
Undergraduate
CLASS
Full Part Full Part Full Part Full Part Full Part Full Part
Time Time Time Time Time Time Time Time Time Time Time Time
Freshman 60 2 47 2 25 105 72 51 2 24 4
Sophomore 30 1 45 1 15 1 57 16 37 23 1
Junior 77 3 78 2 35 2 55 20 45 1 43 4
Senior 89 9 72 8 41 53 13 55 33 7
Special 2 1 2 4
TOTAL 256 15 242 13 118 4 272 125 188 3 123 16
CLASS CLASS
Full Part Full Part Full Time Part Time
Time Time Time Time Freshman 373 86
Freshman 51 3 10 1 Sophomore 218 23
Sophomore 9 2 2 1 Junior 337 34
Junior 1 2 3 Senior 345 37
Senior 2 Special 14 51
Special 10 46
TOTAL 1287 231
TOTAL 63 7 25 48 1518
Full Time Part Time TOTAL CLASSFirst Time
Freshman
Transfer
Incoming
Special/Non-
Matriculated
Re-
ApplicantsContinuing TOTAL
Arts & Sciences 256 15 271 17.9% Freshman 238 123 9 89 459 30.2%
Business 242 13 255 16.8% Sophomore 12 51 5 173 241 15.9%
Education 118 4 122 8.0% Junior 10 86 17 258 371 24.4%
Ministry 272 125 397 26.2% Senior 9 12 361 382 25.2%
Nursing 188 3 191 12.6% Special 65 65 4.3%
Social & Behavioral 123 16 139 9.2%
Associate in Arts 63 7 70 4.6% TOTAL 260 269 65 43 881 1518
Undeclared 25 48 73 4.8% 17.1% 17.7% 4.3% 2.8% 58.0%
TOTAL 1287 231 1518
84.7% 15.2%
Graduate
CLASS CLASS
Full Part Full Part Full Part Full Part Full Part Full Time Part Time
Time Time Time Time Time Time Time Time Time Time Special 244 100
Graduate 69 7 34 17 4 51 137 25
TOTAL 244 100
TOTAL 0 0 69 7 34 17 4 51 137 25 344
Full Time Part Time TOTAL CLASSNew
Incoming
Transfer
Incoming
Special/Non-
Matriculated
Re-
ApplicantsContinuing TOTAL
Arts & Sciences 0.0% Special 186 0 4 2 152 344
Business 69 7 76 22.1%
Education 34 17 51 14.8% TOTAL 186 0 4 2 152 344
Ministry 4 51 55 16.0% 54.1% 0.0% 1.2% 0.6% 44.2%
Social & Behavioral 137 25 162 47.1%
TOTAL 244 100 344
70.9% 29.1%
College/School
College of
Arts & Sciences Business Education Ministry Nursing Social & Behavioral Science
College of College of College of College of
Undeclared
Special Non-Degree TOTALSAssociate in Arts
School of
College/School
TOTALS
By College and StatusTotal Enrollment
College of College of College of College of
Arts & Sciences Business Education Ministry Social & Behavioral Science
College of
Page 3 of 27

KIRKLAND TRADITIONAL 2014 2013 2012 2011 2010 2009 2008 2007 2006 2005
College of Arts & Sciences
BS-Biology 50 57 66 47 28 18 9
BA-Communication 80 81 92 77 69 80 71 65 61 53
BA-English 18 25 20 25 26 33 39 33 30 32
BS-Environmental Science 1 6 3 3 2 8 8 2 3 7
BA-History 7 8 12 7 7 10 12 14 11 7
BA-Interdisciplinary Studies 3 6 8 4 7 6 9 13 10 14
BA-Mathematics 5 7 8 6 4 5 2 2 3 2
BA-Political Science 9 9 10 7 7 12 7 9 7 10
BA-Religion & Philosophy 3 6 10 10 11 10 16 15 11 10
BFA-Contemporary Music Industry 36 23 23 23 10 4 10 13 8 8
BA-Music 16 18 19 27 20 27 24 20 31 23
BM-Music Education 8 12 13 20 23 14 8 4 12 11
BA-Music Ministry 12 9 11 11 10 16 26 19 14 22
Music subtotals 72 62 66 81 63 61 68 56 65 64
AA-General Studies 5 2 1 1 1 4 1 4 6 7
AA-Health Science 2 2 3 4 2 1 1 3 -- --
Certificate of Audio Production -- 0 9 1
CAS subtotals 255 271 308 273 227 248 243 216 207 206
College of Business
BA-Accounting 12 19 18 17 17 10
BA-Business Adminstration 76 48 47 49 46 84 101 101 108 99
BA-Management 26 31 37 26 17 10
BA-Marketing 21 16 22 14 17 5
BA-Music Industry Business 9 1
COB subtotals 144 115 124 106 97 109 101 101 108 99
College of Education
BA-Elementary Education 60 70 60 48 50 60 68 76 77 75
BA-EDSE-Biology 3 1 4 3 7 3 3 4 3 3
BA-EDSE-English/Language Arts 8 13 13 12 7 5 7 13 10 9
BA-EDSE-Health & Fitness 7 11 5 8 11 6 8 14 11 16
BA-EDSE-Mathematics 9 10 8 7 3 3 7 10 8 11
BA-EDSE-Social Studies 9 8 6 3 4 4 6 9 6 12
BA-EDSE-TESOL 0 0 1 2 2 2 1 3 1 1
BA-EDSE-Theatre Arts 0 1 -- -- -- -- 1 1
BA-Secondary Education (Undeclared) 6 7 3 5 7 21 20 11 14 8
Inactive Education Majors -- -- 0 0 0 0 0 1 1 0
EDSE subtotals 42 51 40 40 41 44 53 66 54 60
Student Teaching/Certification Only -- -- -- 2 1 5 4 9 8 16
TESOL Certificates -- -- 1 1 -- -- -- -- -- --
COE subtotals 102 121 101 91 92 109 125 151 139 151
College of Ministry
BA-Biblical Literature 13 19 16 22 23 24 30 35 27 27
BA-Children's Ministries 4 4 5 11 11 9 9 16 18 19
BA-General Ministries 11 12 11 14 11 13 14 10 13 11
BA-Intercultural Studies/Missions 32 30 25 30 29 29 36 36 31 34
BA-Pastoral Ministries 50 63 55 46 39 45 40 48 57 54
BA-Youth Ministries 12 13 16 21 25 35 32 39 53 47
Certificate of Christian Studies -- -- -- -- -- -- -- 1 1 1
COM subtotals 122 141 128 144 138 155 161 185 200 193
School of Nursing
Nursing 191 192 176 173 134 118 119 138 143 165
College of Social and Behavioral Sciences
Psychology 78 83 87 77 81 78 72 74 82 77
General Studies/Undeclared
BA-General Studies 10 13 6 9 9 4 3 5 4
Undeclared and Special Status 17 24 21 22 22 25 18 29 51 53
Center for English Language Education
CELE Center (pre-college) 23 7 12 5 2 -- -- -- 5 3
Korean Exchange Program 6 12 7CELE Subtotals 29 19 19 5 2 0 0 0 5 3
TOTALS 948 979 970 900 802 846 842 899 939 947
Historical Enrollment by MajorKirkland Traditional Undergraduate
2014 Fall Enrollment Report
Page 4 of 27

2014 2013 2012 2011 2010 2009 2008 2007 2006 2005
College of Business
Master of Business Administration 66 66 32 12 24 21 28 24 42 40
MA-Social Entreprenuership -- -- 7 19 20 8
SOBM Subtotals 66 66 39 31 44 29 28 24 42 40
College of Education
Master in Teaching 35 22 20 28 28 40 30 26 18
Master of Education 8 5 4 6 7 5 1
Pro-Certification 8 8 9 4 7 6 2
SOE Subtotals 51 35 33 38 42 51 33 26 18
College of Social and Behavioral Sciences
Counseling Psychology 61 61 61 56 60 57 67 70 64 67
International Care & Community Development 33 26 33 34 36 39 21
Doctor of Psychology 56 51 40 38 32 21
CSBSCI Subtotals 150 138 134 128 128 117 88 70 64 67
Graduate School of Theology
Missional Leadership 20 17 24 28 28 25 13
Theology & Culture 13 16 17 23 20 15 14
Undeclared and Special Status -- 3 2 -- 1CMIN Subtotals 33 36 43 51 49 40 27
TOTALS 300 275 249 248 263 237 176 120 124 107
Historical Enrollment by MajorKirkland Graduate
2014 Fall Enrollment Report
Page 5 of 27

ADULT EVEING 2014 2013 2012 2011 2010 2009 2008 2007 2006 2005
College of Business
BA-Business Management 73 86 93 94 78 77 79 101 133 128
College of Education
BA-Elementary Educationand the Humanities 17 25 17 14
College of Ministry
Certificate of Christian Faith & Practice 1 2 3 14
Certificate of Ministry Leadership 16 40 25 10
Associate in Christian Leadership 1
Associate in Ministry Leadership 1
BA-Ministry Leadership 2
BA-Pastoral Ministries 40 52 59 62 66 51 60 75 64 45
COM subtotals 61 94 87 86 66 51 60 75 64 45
College of Social and Behavioral Sciences
BA-Psychology 61 60 55 55 50 37 13
General Studies/Undeclared
BA-General Studies 13 14 13 9 11 5 2
Associate in Arts 10 6 4 2 -- -- -- 1 5 8
Undeclared and Special Status 3 24 21 22 22 25 18 29 51 53
MISC. Subtotals 26 24 21 22 22 25 18 29 51 53
EXTENSION SITES
Sacramento Campus
Certificate in Ministry Leadership 7 4
Associate Christian Leadership 6 7
Pastoral Ministries 49 51
Undeclared and Special Status 1SACRAMENTO Sutbtotals 63 62
Salem Campus
Certificate in Ministry Leadership 2
Associate in Arts 1
Associate Christian Leadership 16 11 4 7 9 14 38
BS-Christian Leadership 27 31 40 42 36 24 2
Undeclared and Special Status -- -- 2 2 4 4
SALEM Subtotals 46 42 44 51 47 42 44
Southern Idaho Extension
Associate Christian Leadership 11 18 23 11 13
Ministry Leadership 4 4 6 3 3SOUTHERN IDAHO Subtotals 15 22 29 14 16
Church Partnership Program
Certificate in Ministry Leadership 4
Associate in Arts 48
Associate in Ministry Leadership 47
BA-Ministry Leadership 5
Ministry Head Start -- 27 55 74 80 88 74 63 16 25CPP subtotals 104 27 55 74 80 88 74 63 16 25
Miscellaneous Program
Concurrent Credit in High School 45
TOTALS 511 442 401 410 359 320 288 268 264 251
Historical Enrollment by MajorKirkland-Adult Evening and Extension Sites
2014 Fall Enrollment Report
Page 6 of 27

ONLINE UNDERGRADUATE PROGRAMS 2014 2013 2012 2011 2010 2009 2008 2007 2006 2005
College of Arts & Sciences
Associate in Arts 2
College of Business
Criminal Justice 38 28
College of Ministry
Certificate in Ministry Leadership 21
Associate in Ministry Leadership 6
BA-Ministry Leadership 11COM subtotals 38
ONLINE GRADUATE PROGRAMS
College of Business
Master of Business Administration 10 8
College of Social and Behavioral Sciences
International Community Development 12
College of Ministry
Master in Ministry 22 12 8 16 11
TOTALS 122 75 63 90 91 88 74 63 16 25
Historical Enrollment by MajorOnline Programs - Undergraduate/Graduate
2014 Fall Enrollment Report
Page 7 of 27

Freshman Sophomore Junior Senior Special Graduate TOTAL
Kirkland Traditional Undergraduate 918
College of Arts & Science 248
BS-Biology 9 4 15 22 50
BA-Communication 13 9 25 33 80
BFA-Contemporary Music Industry 20 5 7 4 36
BA-English 2 4 6 6 18
BS-Environmental Science 1 1
BA-History 1 1 3 2 7
BA-Interdisciplinary Studies 2 1 3
BA-Mathematics 1 4 5
BA-Music 4 1 5 6 16
BM-Music Education 2 2 4 8
BA-Music Ministry 6 1 2 3 12
BA-Political Science 2 1 5 1 9
BA-Religion and Philosophy 3 3
College of Business 144
BA-Accounting 1 3 4 4 12
BA-Business Administration 21 13 28 14 76
BA-Management 3 5 8 10 26
BA-Marketing 9 3 1 8 21
BA-Music Industry Business 4 1 2 2 9
College of Education 102
BA-Elementary Education 13 3 20 24 60
BA-Secondary Education 1 2 2 1 6
BA-EDSE-Biology 2 1 3
BA-EDSE-English as a Second Language 0
BA-EDSE-English/Language Arts 2 1 1 4 8
BA-EDSE-Health & Fitness 1 2 3 1 7
BA-EDSE-Mathematics 1 4 2 2 9
BA-EDSE-Social Studies 3 2 3 1 9
BA-EDSE-Theatre Arts 0
College of Ministry 122
BA-Biblical Literature 1 7 5 13
BA-Children's Ministries 1 2 1 4
BA-General Ministries 1 1 5 4 11
BA-Intercultural Studies 9 9 3 11 32
BA-Pastoral Ministries 11 9 14 16 50
BA-Youth Ministries 7 2 1 2 12
School of Nursing 191
BSN-Nursing 53 37 46 55 191
College of Social & Behavioral Sciences 78
BA-Psychology 18 14 24 22 78
General Studies/Undeclared 26
BA-General Studies 2 2 2 4 10
Undeclared 10 3 3 16
Associate in Arts 2 3 5
Associate in Arts-Health Science 1 1 2
Miscellaneous Programs 30
CELE Program-ESL 19 19
CELE Program-ESL Bridge 4 4
Korean Exchange 6 6
Special Non-Degree seeking 1 1
TOTALS 235 150 254 279 30 0 948
Major By College and StatusKirkland Traditional Undergraduate
2014 Fall Enrollment Report
Page 8 of 27

Freshman Sophomore Junior Senior Special Graduate TOTAL
Graduate Program 300
College of Business 66
MBA 66 66
College of Education 51
Master of Education 8 8
Masters in Teaching 35 35
Pro-Certification 8 8
College of Ministry 33
MA-Missional Leadership 20 20
MA-Theology and Culture 13 13
College of Social & Behavioral Sciences 150
Doctorate of Psychology 56 56
MA-Counseling Psychology 61 61
MA-International Community Development 33 33
TOTALS 0 0 0 0 0 300 300
Major By College and StatusKirkland Graduate Studies
2014 Fall Enrollment Report
Page 9 of 27

Freshman Sophomore Junior Senior Special Graduate TOTAL
Adult Evening 238
Bachelor
BA-Business Management 5 11 26 31 73
BA-Elementary Education & Humanities 2 2 6 7 17
BA-General Studies 1 1 3 8 13
BA-Ministry Leadership 0 0 1 1 2
BA-Pastoral Ministries 10 9 12 9 40
BA-Psychology 10 10 23 18 61
Certificate/Associate/Misc. Programs
Certificate of Faith & Practice 1 1
Certificate of Ministry Leadership 9 1 1 0 5 16
Associate in Arts 3 4 2 1 10
Associate in Christian Leadership 0 1 0 0 1
Associate in Ministry Leadership 1 1
Special Non-Degree Seeking 3 3
Extension Sites 124
Sacramento
Certificate in Ministry Leadership 5 1 1 7
Associate in Christian Leadership 3 3 6
BA-Pastoral Ministries 15 9 15 10 49
Undeclared 1 1
Salem
Certificate in Ministry Leadership 2 2
Associate in Arts 1 1
Associate in Christian Leadership 10 4 2 16
BS-Christian Leadership 6 10 4 7 27
Southern Idaho
Associate in Christian Leadership 3 7 1 11
BA-Pastoral Ministries 1 3 4
Church Partnership Program 104
Certificate in Ministry Leadership 3 1 4
Associate in Arts 45 2 1 48
Associate in Ministry Leadership 44 2 1 47
BA-Ministry Leadership 4 1 5
Miscellaneous Programs 45
Concurrent Credit in HS 45 45
TOTALS 183 78 104 92 54 0 511
2014 Fall Enrollment Report
College of Adult and Professional Studies-All programs
Major By College and Status
Page 10 of 27

Freshman Sophomore Junior Senior Special Graduate TOTAL
Online Undergraduate 78
College of Arts & Science 2
Associate in Arts 2 2
College of Ministry 38
Certificate of Ministry Leadership 20 1 21
Associate in Ministry Leadership 6 6
BA-Ministry Leadership 7 2 2 11
College of Business 38
BS-Criminal Justice 6 10 11 11 38
Online Graduate 44
College of Social & Behavioral Sciences 12
MA-International Community Development 12 12
College of Business 10
MBA 10 10
College of Ministry 22
MIM-Master in Ministry 22 22
TOTALS 41 13 13 11 0 44 122
Major By College and StatusCollege of Adult and Professional Studies-Online Programs
2014 Fall Enrollment Report
Page 11 of 27

CLASS
Full Part Full Part Full Part Full Part Full Part Full Part
Time Time Time Time Time Time Time Time Time Time Time Time
Freshman 59 2 37 1 23 29 51 2 16 2
Sophomore 30 25 14 24 37 14
Junior 74 3 43 30 1 29 1 45 1 24
Senior 82 8 35 3 34 38 1 55 22
Special
TOTAL 245 13 140 4 101 1 120 2 188 3 76 2
CLASS CLASS
Full Part Full Part Full Time Part Time
Time Time Time Time Freshman 228 7
Freshman 3 10 Sophomore 149 1
Sophomore 3 2 1 Junior 248 6
Junior 3 Senior 267 12
Senior 1 Special
Special
TOTAL 892 26
TOTAL 7 0 15 1 918
Full Time Part Time TOTAL
Arts & Sciences 245 13 258 28.1%
Business 140 4 144 15.7%
Education 101 1 102 11.1%
Ministry 120 2 122 13.3%
Nursing 188 3 191 20.8%
Social & Behavioral 76 2 78 8.5%
Associate in Arts 7 7 0.8%
Undeclared 15 1 16 1.7%
TOTAL 892 26 918
97.2% 2.8%
CLASSFirst Time
Freshman
Transfer
Incoming
Special/Non-
Matriculated
Re-
ApplicantsContinuing TOTAL
Freshman 167 36 32 235 25.6%
Sophomore 12 29 109 150 16.3%
Junior 10 56 4 184 254 27.7%
Senior 4 4 271 279 30.4%
Special 0.0%
TOTAL 189 125 0 8 596 918
20.6% 13.6% 0.0% 0.9% 64.9%
2014 Fall Enrollment Report
College/School
TOTALSSpecial Non-Degree
College of College of College of College of School of College of
Undeclared
Arts & Sciences Business Education Ministry Nursing Social & Behavioral Science
Associate in Arts
Enrollment By College and Status
Kirkland Traditional Undergraduate
Page 12 of 27

CLASS
Full Part Full Part Full Part Full Part Full Part
Time Time Time Time Time Time Time Time Time Time
Freshman 1 5 2 7 12 8 2
Sophomore 1 10 1 1 1 9 1 9 1
Junior 3 25 1 5 1 10 4 19 4
Senior 7 1 26 5 7 8 2 11 7
Special 2 1 2 4 0 0
TOTAL 11 2 66 7 17 3 36 23 47 14
CLASS CLASS
Full Part Full Part Full Time Part Time
Time Time Time Time Freshman 27 14
Freshman 4 Sophomore 33 6
Sophomore 4 1 Junior 63 11
Junior 1 1 Senior 60 15
Senior 1 Special 4 5
Special
TOTAL 187 51
TOTAL 10 2 0 0 238
Full Time Part Time TOTAL
Arts & Sciences 11 2 13 5.5%
Business 66 7 73 30.7%
Education 17 3 20 8.4%
Ministry 36 23 59 24.8%
Social & Behavioral 47 14 61 25.6%
Associate in Arts 10 2 12 5.0%
Undeclared 0.0%
TOTAL 187 51 238
78.6% 21.4%
CLASSFirst Time
Freshman
Transfer
Incoming
Special/Non-
Matriculated
Re-
ApplicantsContinuing TOTAL
Freshman 2 18 1 20 41 17.2%
Sophomore 11 1 27 39 16.4%
Junior 18 9 47 74 31.1%
Senior 4 8 63 75 31.5%
Special 9 9 3.8%
51
TOTAL 2 52 9 19 157 238
0.8% 21.4% 3.8% 8.0% 66.0%
2014 Fall Enrollment Report
Enrollment By College and StatusKirkland Adult Evening Undergraduate
College ofCollege of College of College of College of
Arts & Sciences Business Education Ministry Social & Behavioral Science
Undeclared
Associate in Arts Special Non-Degree TOTALS
College/School
Page 13 of 27

CLASS
Full Part Full Part Full Part Full Part Full Part
Time Time Time Time Time Time Time Time Time Time
Graduate 0 0 61 5 34 17 1 32 126 24
TOTAL 0 0 61 5 34 17 1 32 126 24
Full Time Part Time TOTAL CLASS
Arts & Sciences 0 0 0 0.0% Full Time Part Time
Business 61 5 66 22.0% Special 222 78
Education 34 17 51 17.0%
Ministry 1 32 33 11.0% TOTAL 222 78
Social & Behavioral 126 24 150 50.0% 300
TOTAL 222 78 300
74.2% 26.0%
CLASSFirst Time
Freshman
Transfer
Incoming
Special/Non-
Matriculated
Re-
ApplicantsContinuing TOTAL
Special 151 0 4 2 143 300 100.0%
TOTAL 151 0 4 2 143 300
50.3% 0.0% 1.3% 0.7% 47.7%
2014 Fall Enrollment Report
College/School
Enrollment By College and StatusKirkland Graduate
College of College of
Arts & Sciences Business Education Ministry Social & Behavioral Science
College of College of College of
TOTALS
Page 14 of 27

CLASS
Full Part Full Part Full Part
Time Time Time Time Time Time
Freshman 21 24 1
Sophomore 22 12 1
Junior 13 13
Senior 7 10
Special
TOTAL 63 59 0 1 0 1
Full Time Part Time TOTAL CLASS
Ministry 63 59 122 98.4% Full Time Part Time
Freshman 21 25
Associate in Arts 0 1 1 0.8% Sophomore 22 13
Undeclared 0 1 1 0.8% Junior 13 13
Senior 7 10
TOTAL 63 61 124 Special 0 0
50.8% 49.2%
TOTAL 63 61
124
CLASSFirst Time
Freshman
Transfer
Incoming
Special/Non-
Matriculated
Re-
ApplicantsContinuing TOTAL
Freshman 13 10 5 18 46 37.1%
Sophomore 4 2 29 35 28.2%
Junior 6 2 18 26 21.0%
Senior 1 16 17 13.7%
Special 0.0%
TOTAL 13 21 0 9 81 124
10.5% 16.9% 0.0% 7.3% 65.3%
TOTALSCollege/School
Sacramento, Salem, Southern Idaho
2014 Fall Enrollment Report
Enrollment By College and StatusExtension Campuses and Sites
Ministry
Undeclared College of
Associate in Arts Special Non-Degree
Page 15 of 27

CLASS
Full Part Full Part Bethany Christian 11
Time Time Time Time Canyon Creek 15
Freshman 40 11 43 2 Cedar Park 1
Sophomore 2 2 Dream Center 25
Junior 1 2 1 Eastridge Church 3
Senior Life Center 6
Special Mtn View Christian 5
Peoples Church 10
TOTAL 41 15 45 3 Renton New Life 20
Silverdale 8
Full Time Part Time TOTAL CLASS
Ministry 41 15 56 53.8% Full Time Part Time
Freshman 83 13
Associate in Arts 45 3 48 45.6% Sophomore 2 2
Undeclared 46.2% Junior 1 3
Senior
TOTAL 86 18 104 Special
82.7% 17.3%
TOTAL 86 18
104
CLASSFirst Time
Freshman
Transfer
Incoming
Special/Non-
Matriculated
Re-
ApplicantsContinuing TOTAL
Freshman 46 40 3 7 96 92.3%
Sophomore 2 1 1 4 3.8%
Junior 3 1 4 3.8%
Senior 0 0.0%
Special 0 0.0%
TOTAL 46 45 0 5 8 104
44.2% 43.3% 0.0% 4.8% 7.7%
CLASSCLASS
Special/Non-
Matriculated
Full Part Special 56
Time Time ESL Bridge 4
Special 10 46 TOTAL 56 Korean Exchange 6
Concurrent Credit in HS 45
TOTAL 10 46 Special Non-Degree Seeking 1
CELE ESL Pre-College Program 19
Special Non-Degree Special Programs
Undergraduate Credit
Pre-College Credits
2014 Fall Enrollment Report
Enrollment By College and StatusMiscellaneous Programs
Undeclared
Enrollment By College and StatusChurch Partnership Program
Associate in Arts
TOTALSCollege/School
CPP Site HeadcountMinistry
College of
Page 16 of 27

Undergraduate
CLASS CLASS
Full Part Full Part Full Part Full Time Part Time
Time Time Time Time Time Time Freshman 14 27
Freshman 5 1 8 25 1 1 Sophomore 12 1
Sophomore 10 0 2 1 0 0 Junior 12 1
Junior 10 1 2 0 0 0 Senior 11 0
Senior 11 0 0 0 0 0 Special 0 0
Special 0 0 0 0 0 0
TOTAL 49 29
TOTAL 36 2 12 26 1 1 78
Full Time Part Time TOTAL
Arts & Sciences 0 0 0 0.0%
Business 36 2 38 48.7%
Education 0 0 0 0.0%
Ministry 12 26 38 48.7%
Nursing 0 0 0 0.0%
Social & Behavioral 0 0 0 0.0%
Associate in Arts 1 1 2 2.6%
Undeclared 0 0 0 0.0%
TOTAL 49 29 78
62.8% 37.2%
CLASSFirst Time
Freshman
Transfer
Incoming
Special/Non-
Matriculated
Re-
ApplicantsContinuing TOTAL
Freshman 10 19 0 0 12 41 52.6%
Sophomore 0 5 0 1 7 13 16.7%
Junior 0 3 0 1 9 13 16.7%
Senior 0 0 0 0 11 11 14.1%
Special 0 0 0 0 0 0 0.0%
TOTAL 10 27 0 2 39 78
12.8% 34.6% 0.0% 2.6% 50.0%
Graduate
CLASS CLASS
Full Part Full Part Full Part Full Time Part Time
Time Time Time Time Time Time Special 22 22
Graduate 8 2 3 19 11 1
TOTAL 22 22
TOTAL 8 2 3 19 11 1 44
Full Time Part Time TOTAL CLASSFirst Time
Freshman
Transfer
Incoming
Special/Non-
Matriculated
Re-
ApplicantsContinuing TOTAL
Arts & Sciences 0 0 0 0.0% Graduate 35 0 0 0 9 44
Business 8 2 10 22.7%
Education 0 0 0 0.0% TOTAL 35 0 0 0 9 44
Ministry 3 19 22 50.0% 79.5% 0.0% 0.0% 0.0% 20.5%
Social & Behavioral 11 1 12 27.3%
TOTAL 22 22 44
50.0% 50.0%
2014 Fall Enrollment Report
Enrollment By College and StatusOnline Programs
Business Ministry
College of College of
College of College of College of
Associate in Arts TOTALS
College/School
Business Ministry Social & Behavioral Science
College/School
TOTALS
Page 17 of 27

First Time Transfer Total New Reapplying Total
Freshmen Freshmen Freshmen Freshmen Freshmen
Traditional Students
2014 167 71.1% 36 15.3% 203 86.4% 0 0.0% 32 13.6% 235
2013 158 71.8% 28 12.7% 186 84.5% 0 0.0% 34 15.5% 220
2012 178 74.8% 29 12.2% 207 87.0% 0 0.0% 31 13.0% 238
2011 148 69.2% 34 15.9% 182 85.0% 4 1.9% 28 13.1% 214
2010 141 68.4% 35 17.0% 176 85.4% 1 0.5% 29 14.1% 206
2009 161 65.7% 43 17.6% 204 83.3% 3 1.2% 38 15.5% 245
2008 169 66.8% 35 13.8% 204 80.6% 1 0.4% 48 19.0% 253
2007 169 66.8% 44 17.4% 213 84.2% 1 0.4% 39 15.4% 253
2006 167 66.3% 43 17.1% 210 83.3% 0 0.0% 42 16.7% 252
2005 186 65.3% 59 20.7% 245 86.0% 1 0.4% 39 13.7% 285
Adult Evening CAPS
2014 2 4.9% 18 43.9% 20 48.8% 1 2.4% 20 48.8% 41
2013 3 8.3% 26 72.2% 29 80.6% 5 13.9% 2 5.6% 36
2012 5 8.5% 30 50.8% 35 59.3% 2 3.4% 22 37.3% 59
2011 9 16.1% 28 50.0% 37 66.1% 1 1.8% 18 32.1% 56
2010 5 11.9% 28 66.7% 33 78.6% 0 0.0% 9 21.4% 42
2009 3 7.1% 31 73.8% 34 81.0% 2 4.8% 6 14.3% 42
2008 4 12.5% 19 59.4% 23 71.9% 5 15.6% 4 12.5% 32
2007 0 0.0% 17 68.0% 17 68.0% 3 12.0% 5 20.0% 25
2006 3 8.6% 20 57.1% 23 65.7% 0 0.0% 12 34.3% 35
2005 11 30.6% 21 58.3% 32 88.9% 1 2.8% 3 8.3% 36
Extension Campus/Sites
2014 13 28.3% 10 21.7% 23 50.0% 5 10.9% 18 39.1% 46
2013 13 19.7% 43 65.2% 56 84.8% 0 0.0% 10 15.2% 66
2012 6 33.3% 1 5.6% 7 38.9% 0 0.0% 11 61.1% 18
2011 12 48.0% 3 12.0% 15 60.0% 2 8.0% 8 32.0% 25
2010 5 11.9% 28 66.7% 33 78.6% 0 0.0% 9 21.4% 42
2009 11 36.7% 10 33.3% 21 70.0% 2 6.7% 7 23.3% 30
2008 10 38.5% 1 3.8% 11 42.3% 2 7.7% 13 50.0% 26
Church Partnership Program
2014 46 47.9% 40 41.7% 86 89.6% 3 3.1% 7 7.3% 96
Online Programs
2014 10 24.4% 19 46.3% 29 70.7% 0 0.0% 12 29.3% 41
All Undergraduate Freshman Class
2014 238 51.9% 123 26.8% 361 78.6% 9 2.0% 89 19.4% 459
2013 174 54.0% 97 30.1% 271 84.2% 5 1.6% 46 14.3% 322
2012 189 60.0% 60 19.0% 249 79.0% 2 0.6% 64 20.3% 315
2011 169 57.3% 65 22.0% 234 79.3% 7 2.4% 54 18.3% 295
2010 151 52.1% 91 31.4% 242 83.4% 1 0.3% 47 16.2% 290
2009 175 55.2% 84 26.5% 259 81.7% 7 2.2% 51 16.1% 317
2008 183 58.8% 55 17.7% 238 76.5% 8 2.6% 65 20.9% 311
2007 169 60.8% 61 21.9% 230 82.7% 4 1.4% 44 15.8% 278
2006 170 59.2% 63 22.0% 233 81.2% 0 0.0% 54 18.8% 287
2005 197 61.4% 80 24.9% 277 86.3% 2 0.6% 42 13.1% 321
2014 Fall Enrollment Report
Total Freshman Class* Enrollment Trends*students with less than 30 semester credits earned
Continuing
Freshmen
0 50 100 150 200 250 300 350 400 450 500
2014
2013
2012
2011
2010
2009
2008
2007
2006
2005
459
322
315
295
290
317
311
278
287
321
Freshman Class
Page 18 of 27

# First-time Returning Returning Fall-Fall
Freshmen as as at least Retention
Traditional Students Previous Fall Freshmen Sophomores Rate2014 194 26 115 72.7%
2013 203 29 128 77.3%
2012 162 24 115 85.8%
2011 159 26 100 79.2%
2010 184 25 102 69.0%
2009 189 21 114 71.4%
2008 177 41 80 68.4%
2007 183 26 91 63.9%
2006 203 36 114 73.9%
2005 135 25 75 74.1%
2004 181 48 81 71.3%
2003 164 25 83 65.9%
Adult Evening
2014 2 2 0 100.0%
Extension Campus/Sites
2014 5 3 2 100.0%
Undergraduate Fall-to-Fall Retention Rate
2014 201 31 117 73.6%
College credits earned during high school may allow the student to enter with a Sophomore or higher class level.
*An identified group of students who enter Northwest University as their first post-secondary institution.
First-Time/Full-Time Freshmen Retention RatesFall to Fall
2014 Fall Enrollment Report
72.7%
77.3%
85.8%
79.2%
69.0%
71.4%
68.4%
63.9%
73.9%
74.1%
71.3%
65.9%
60%
65%
70%
75%
80%
85%
90%
% R
ete
nti
on
Fall-Fall FT/FT Traditional Freshman Retention Rate
Page 19 of 27

# First-time Returning Returning Fall-Fall
Freshmen as as at least Retention
Traditional Students Previous Fall Freshmen Sophomores Rate2014 194 26 115 72.7%
2013 203 29 128 77.3%
2012 162 24 115 85.8%
2011 159 26 100 79.2%
2010 184 25 102 69.0%
2009 189 21 114 71.4%
2008 177 41 80 68.4%
2007 183 26 91 63.9%
2006 203 36 114 73.9%
2005 135 25 75 74.1%
2004 181 48 81 71.3%
2003 164 25 83 65.9%
Adult Evening
2014 2 2 0 100.0%
Extension Campus/Sites
2014 5 3 2 100.0%
Undergraduate Fall-to-Fall Retention Rate
2014 201 31 117 73.6%
2014 Fall Enrollment Report
First-Time/Full-Time Freshmen Retention RatesFall to Fall
*An identified group of students who enter Northwest University as their first post-secondary institution.
College credits earned during high school may allow the student to enter with a Sophomore or higher class level.
72.7%
77.3%
85.8%
79.2%
69.0%
71.4%
68.4%
63.9%
73.9%
74.1%
71.3%
65.9%
60%
65%
70%
75%
80%
85%
90%
% R
ete
nti
on
Fall-Fall FT/FT Traditional Freshman Retention Rate
Page 20 of 27

Entry Year
FTFT
Freshman
Cohort
Returning % % % %
1998 Fall 144 92 63.9% 2002 51 35.4% 2004 64 44.4% 2006 67 46.5%
1999 Fall 215 136 63.3% 2003 72 33.5% 2005 92 42.8% 2007 93 43.3%
2000 Fall 194 135 69.6% 2004 70 36.1% 2006 91 46.9% 2008 94 48.5%
2001 Fall 172 108 62.8% 2005 64 37.2% 2007 79 45.9% 2009 81 47.1%
2002 Fall 161 108 67.1% 2006 68 42.2% 2008 86 53.4% 2010 88 54.7%
2003 Fall 182 130 71.4% 2007 79 43.4% 2009 95 52.2% 2011 97 53.3%
2004 Fall 138 103 74.6% 2008 61 44.2% 2010 76 55.1% 2012 77 55.8%
2005 Fall 213 154 72.3% 2009 85 39.9% 2011 108 50.7% 2013 111 52.1%
2006 Fall 186 120 64.5% 2010 72 38.7% 2012 86 46.2% 2014 89 47.8%
2007 Fall 177 121 68.4% 2011 66 37.3% 2013 76 42.9% 2015
2008 Fall 193 148 76.7% 2012 80 41.5% 2014 103 53.4% 2016
2009 Fall 191 133 69.6% 2013 72 37.7% 2015 92 48.2% 2017
2010 Fall 172 134 77.9% 2014 76 44.2% 2016 2018
2011 Fall 175 144 82.3% 2015 21 12.0% 2017 2019
2012 Fall 211 164 77.7% 2016 7 3.3% 2018 2020
2013 Fall 201 148 73.6% 2017 2019 2021
2014 Fall 239 2018 2020 2022
2014 Fall Enrollment Report
FT/FT Freshmen Graduation Rates(red) pending final calculations
1st Year
RetentionGraduation Rate
4 Year 6 Year 8 Year
44.4% 42.8%
46.9% 45.9%
53.4% 52.2% 55.1%
50.7%
46.2% 42.9%
53.4%
48.2%
0.0%
10.0%
20.0%
30.0%
40.0%
50.0%
60.0%
1998 Fall 1999 Fall 2000 Fall 2001 Fall 2002 Fall 2003 Fall 2004 Fall 2005 Fall 2006 Fall 2007 Fall 2008 Fall 2009 Fall
6 Year Graduation Rate
Page 21 of 27

TOTAL TraditionalAdult
EveningGraduate Online CAPS-Other 2013 2012 2011 2010 2009 2008 2007 2006 2005
Assemblies of God 554 251 52 43 39 169 508 464 458 471 460 415 427 485 562
Baptist 61 43 8 4 2 4 59 59 60 42 51 53 50 60 60
Catholic 36 18 7 11 0 0 40 37 44 27 24 22 17 18 12
Christian 288 155 48 47 6 32 260 239 198 151 107 100 86 78 34
Church Of God In Christ 4 0 2 2 0 0 5 2 5 2 6 4 3 11 5
Foursquare 67 45 10 6 3 3 84 125 136 104 86 91 96 94 78
Full Gospel/Pentecostal 76 42 7 9 2 16 66 57 53 60 43 41 49 32 23
Nondenominational 406 250 57 59 14 26 378 377 372 339 320 330 334 368 255
Lutheran 26 18 1 5 2 0 19 16 16 16 11 19 20 30 27
Methodist 7 4 1 2 0 0 10 12 17 15 9 8 13 12 14
Nazarene 8 5 1 1 0 1 11 14 12 7 11 9 5 11 8
Presbyterian 32 18 4 9 0 1 32 33 38 31 31 24 26 27 27Other & Unknown 316 69 40 102 54 51 262 177 149 157 224 174 133 55 155
Total 1881 918 238 300 122 303 1740 1612 1558 1422 1383 1290 1259 1281 1260
Total who declared an actual
denomination795 402 86 83 46 178 768 762 786 715 689 645 657 748 793
Assemblies of God Declared Students% Assemblies of God - Total Student Body
2014 2013 2011 2011 2010 2009 2008 2007 2006 2005
Total Students 1881 1740 1612 1558 1422 1383 1290 1259 1281 1260
Total A/G 554 508 464 458 471 460 415 427 485 562% A/G 29.5% 29.2% 28.8% 29.4% 33.1% 33.3% 32.2% 33.9% 37.9% 44.6%
% A/G of those who declared
an actual denomination 69.7% 66.1% 66.8% 66.8% 64.3% 65.0% 64.8% 70.9% 72.1% 75.3%
% Assemblies of God - by Program
2014 2013 2012 2011 2010 2009 2008 2007 2006 2005
Traditional Student % A/G 27.3% 27.6% 29.3% 31.7% 36.5% 37.5% 35.1% 38.5% 42.1% 51.5%CAPS & Graduate Student % A/G 31.5% 31.2% 28.0% 26.4% 28.7% 23.2% 23.8% 19.1% 25.5% 21.4%
2014 Fall Enrollment Report
2014
Kirkland Other Programs
Enrollment by Denomination(based on declared denomination from semester Registration Process)
51.5%
42.1% 38.5%
35.1% 37.5% 36.5%
31.7% 29.3%
27.6% 27.3%
21.4%
25.5%
19.1%
23.8% 23.2%
28.7% 26.4%
28.0%
31.2% 31.5%
0.0%
10.0%
20.0%
30.0%
40.0%
50.0%
60.0%
2005 2006 2007 2008 2009 2010 2011 2012 2013 2014
% A/G-Kirkland Traditional and Non-Traditional Programs
Traditional Student % A/G
CAPS & Graduate Student % A/G
Page 22 of 27

ETHNICITY
Non-Resident Alien 77 4.1% 30 3.3% 18 6.0%
American Indian/Alaskan Native 24 1.3% 12 1.3% 2 0.8% 5 1.7%
Asian 111 5.9% 43 4.7% 15 6.3% 39 13.0%
Black 83 4.4% 35 3.8% 19 8.0% 15 5.0%
Hispanic/Latino 141 7.5% 66 7.2% 22 9.2% 14 4.7%
Native Hawaiian/Pacific Islander 28 1.5% 11 1.2% 6 2.5% 2 0.7%
Other/Two or more 81 4.3% 41 4.5% 6 2.5% 13 4.3%
Unknown 138 7.3% 7 0.8% 19 8.0% 12 4.0%
White 1198 63.7% 673 73.3% 149 62.6% 182 60.7%
1881
ETHNICITY
Non-Resident Alien 0 0.0% 29 38.7% 0 0.0% 0 0.0% 0 0.0%
American Indian/Alaskan Native 1 0.8% 0 0.0% 2 1.9% 1 1.3% 1 2.3%
Asian 4 3.2% 0 0.0% 4 3.8% 3 3.8% 3 6.8%
Black 2 1.6% 0 0.0% 4 3.8% 5 6.4% 3 6.8%
Hispanic/Latino 22 17.7% 0 0.0% 11 10.6% 4 5.1% 2 4.5%
Native Hawaiian/Pacific Islander 3 2.4% 0 0.0% 4 3.8% 0 0.0% 2 4.5%
Other/Two or more 8 6.5% 0 0.0% 8 7.7% 2 2.6% 3 6.8%
Unknown 13 10.5% 45 60.0% 7 6.7% 30 38.5% 5 11.4%
White 71 57.3% 1 1.3% 64 61.5% 33 42.3% 25 56.8%
Kirkland Campus
124 75 104 78 44
Church Partnerships Online Undergrade Online Graduate
All School
918 238 300
Extension SitesMiscellaneous
Programs
Enrollment by Ethnicity
Traditional Adult Evening Graduate Studies
Non-Resident Alien Student Visa
2%
American Indian Alaskan Native
1%
Asian 6%
Black 4%
Hispanic/Latino 8%
Native Hawaiian/Pacific Islander 2%
Other/Two or more 4%
Unknown 7%
White 64%
Ethnicity for All Populations Fall 2014
Page 23 of 27

Traditional
Undergrad
Adult
EveningGraduate
Extension
Sites
Misc.
Programs
Church
Partnership
Program
Online
Undergrad
Online
Graduate
Washington 1413 716 230 275 1 46 63 57 25
Alaska 13 10 1 1 1
California 127 35 4 64 11 8 5
Idaho 42 20 1 1 15 5
Montana 24 21 1 2
Nevada 5 4 1
Oregon 106 50 1 42 10 2 1
Wyoming 1 1
Other States 68 32 3 2 0 0 13 7 11
International Countries 82 30 0 21 0 29 0 0 2
Traditional
Undergrad
Adult
EveningGraduate
Extension
Sites
Misc.
Programs
Church
Partnership
Program
Online
Undergrad
Online
Graduate
Alabama 1 1
Arkansas 1 1
Arizona 7 4 1 2
Colorado 5 5
Florida 4 1 1 1 1
Georgia 1 1
Hawaii 7 5 2
Illinois 2 1 1
Indiana 1 1
Kentucky 1 1
Maryland 1 1
Michigan 2 2
Minnesota 1 1
Missouri 2 2
North Carolina 3 1 1 1
North Dakota 1 1
New Jersey 1 1
New York 4 3 1
Ohio 2 1 1
Pennsylvania 1 1
Rhode Island 1 1
Tennessee 2 1 1
Texas 6 3 2 1
Utah 3 3
Virginia 3 1 1 1
Wisconsin 3 2 1
Guam 1 1
Northern Territories 1 1
Traditional
Undergrad
Adult
EveningGraduate
Extension
Sites
Misc.
Programs
Church
Partnership
Program
Online
Undergrad
Online
Graduate
Angola 1 1
Australia 2 2
Belgium 2 2
Bolivia 1 1
Brazil 1 1
Britain 2 1 1
Cambodia 1 1
Canada 2 1 1
China 19 1 4 14
Colombia 1 1
Ecuador 1 1
Fiji 1 1
India 10 1 9
Indonesia 6 3 2 1
Iraq 1 1
Japan 3 2 1
Macau 1 1
Malaysia 1 1
Nigeria 3 1 1 1
Serbia 3 2 1
South Korea 18 7 1 10
Taiwan 1 1
Thailand 1 1
2014 Fall Enrollment Report
Other State/Territories
Kirkland Campus
Other State/Territories
Enrollment by State / Country
Regional States
Page 24 of 27

# of
Credits# of Students Credit Hours
# of
StudentsCredit Hours
# of
StudentsCredit Hours
# of
StudentsCredit Hours
# of
StudentsCredit Hours
# of
StudentsCredit Hours
# of
StudentsCredit Hours
# of
StudentsCredit Hours
# of
StudentsCredit Hours
1 17 17 17 17
1.5 13 19.5 13 19.5
2 5 10 5 10
3 71 213 2 6 16 48 22 66 9 27 10 30 7 21 5 15
4 9 36 1 4 1 4 7 28
5 2 10 1 5 1 5
5.5 15 82.5 15 82.5
6 159 954 6 36 12 72 81 486 23 138 12 72 8 48 17 102
7 26 182 3 21 2 14 8 56 6 42 7 49
8 49 392 5 40 1 8 30 240 2 16 11 88
9 81 729 3 27 15 135 25 225 15 135 6 54 14 126 3 27
10 31 310 1 10 2 20 24 240 3 30 1 10
11 63 693 6 66 1 11 53 583 3 33
12 292 4704 82 2184 46 552 34 408 33 396 83 996 14 168
13 97 1261 77 1001 11 143 4 52 2 26 3 39
14 119 1666 103 1442 11 154 4 56 1 14
15 328 4920 186 2790 72 1080 13 195 22 330 35 525
16 187 2992 167 2672 16 256 2 32 2 32
17 153 2601 137 2329 7 119 7 119 2 34
18 144 2592 127 2286 17 306
19 10 190 8 152 2 38
20 3 60 1 20 2 40
21 4 84 3 63 1 21
22 2 44 2 44
23 1 23 1 231,881 23,585 918 13,968 238 3,070 300 2,335 124 1,271 75 606 104 1,161 78 888 44 286
Class Level Credits Average Credits Average Credits Average Credits Average Credits Average Credits Average Credits Average Credits Average Credits Average
Freshman 5,791 12.6 3,397 14.5 492 12.0 444 9.7 1,092 11.4 366 8.9
Sophomore 3,404 14.1 2,297 15.3 499 12.8 389 11.1 39 9.8 180 13.8
Junior 5,467 14.7 3,998 15.7 1,000 13.5 262 10.1 30 7.5 177 13.6
Senior 5,618 14.7 4,276 15.3 1,001 13.3 176 10.4 165 15.0
Special 684 8.1 78 8.7 606 8.1
Graduate 2,621 7.6 2,335 7.8 286 6.5
All School 23,585 12.5 13,968 15.2 3,070 12.9 2,335 7.8 1,271 10.3 606 8.1 1,161 11.2 888 11.4 286 6.5
Online Graduate
Kirkland Campus
Traditional Adult Evening Graduate Studies Extension Sites
2014 Fall Enrollment Report
ALL SCHOOL
ALL SCHOOL Traditional Adult Evening Graduate Studies Extension SitesMiscellaneous
Programs
Church Partnership
Programs
Online
UndergraduateOnline Graduate
Miscellaneous
Programs
Church Partnership
Programs
Enrollment by Academic Load
Kirkland Campus
Online
Undergraduate
Page 25 of 27

AGE FRESHMAN SOPHOMORE JUNIOR SENIOR SPECIAL GRADUATENumber of
Students
Under 18 4 41 45
18-19 244 78 27 18 6 373
20-21 61 63 162 125 9 4 424
22-24 39 25 63 111 11 64 313
25-29 35 26 39 37 8 93 238
30-34 26 14 24 30 4 49 147
35-39 19 7 16 16 1 33 92
40-49 17 17 28 25 2 48 137
50-64 12 10 15 15 50 102
65 and over 1 1 1 1 3 7
Age Unknown 1 2 3
totals 459 241 375 378 84 344 1881
2014 Fall Enrollment Report
Enrollment by Age Category
Page 26 of 27

Male Female
Freshman 225 234
Sophomore 107 134
Junior 144 227
Senior 140 242
Special 31 53
Graduate 127 217
total 774 1107
41.1% 58.9%
Male Female Male Female Male Female
Freshman 93 142 24 17
Sophomore 55 95 18 21
Junior 88 166 29 45
Senior 91 188 34 41
Special 6 3
Graduate 107 193
total 327 591 111 127 107 193
35.6% 64.4% 46.6% 53.4% 35.7% 64.3%
Male Female Male Female Male Female Male Female Male Female
Freshman 26 20 56 40 26 15
Sophomore 24 11 2 2 8 5
Junior 15 11 3 1 9 4
Senior 8 9 7 4
Special 25 50
Graduate 20 24
total 73 51 25 50 61 43 50 28 20 24
58.9% 41.1% 33.3% 66.7% 58.7% 41.3% 64.1% 35.9% 45.5% 54.5%
Class Married Single Unknown
Freshman 67 384 8
Sophomore 57 179 5
Junior 79 281 11
Senior 101 273 8
Special 7 77 0
Graduate 174 167 3
Sub Total 485 1361 35
% of Total 25.8% 72.4% 1.9%
Class Married Single Unknown Married Single Unknown Married Single Unknown
Freshman 8 227 18 22 1
Sophomore 12 138 25 14
Junior 24 230 35 38 1
Senior 41 238 51 24
Special 3 6
Graduate 151 149
Sub Total 85 833 132 104 2 151 149
17.5% 61.2% 0.0% 27.2% 21.4% 0.4% 31.1% 30.7% 0.0%% of Total 4.5% 44.3% 0.0% 7.0% 5.5% 0.1% 8.0% 7.9% 0.0%
Class Married Single Unknown Married Single Unknown Married Single Unknown Married Single Unknown Married Single Unknown
Freshman 10 34 2 9 87 22 14 5
Sophomore 14 20 1 4 6 3 4
Junior 16 10 1 3 3 10
Senior 8 9 1 2 8
Special 4 71
Graduate 23 18 3
Sub Total 48 73 3 4 71 10 94 32 19 27 23 18 3
% of Sub Total 9.9% 15.1% 0.6% 0.8% 14.6% 0.0% 2.1% 19.4% 0.0% 6.6% 3.9% 5.6% 4.7% 3.7% 0.6%% of Total 2.6% 3.9% 0.2% 0.2% 3.8% 0.0% 0.5% 5.0% 0.0% 1.7% 1.0% 1.4% 1.2% 1.0% 0.2%
Church Partnership
Programs
Online
UndergraduateOnline Graduate
Gender
Marital Status
Extension SitesMiscellaneous
Programs
Kirkland Campus
Traditional Adult Evening Graduate Studies
2014 Fall Enrollment Report
Enrollment by Gender and Marital Status
Kirkland Campus
TOTAL
Traditional Adult Evening Graduate Studies
Extension Sites Miscellaneous Programs Church Partnership Programs Online Undergraduate Online Graduate
Enrollment by Marital Status
Total
Page 27 of 27