enhancing intermodal service through public-private
TRANSCRIPT
Technical Report Documentation Page 1. Report No. FHWA/TX-04/0-4565-1
2. Government Accession No.
3. Recipient's Catalog No.
4. Title and Subtitle ENHANCING INTERMODAL SERVICE THROUGH PUBLIC-PRIVATE PARTNERSHIPS IN TEXAS
5. Report Date October 2003
6. Performing Organization Code
7. Author(s) Stephen S. Roop, Jeffery E. Warner, Craig E. Roco, Curtis A. Morgan, David H. Bierling, Juan Carlos Villa, Sarod P. Dhuru, and Chad J. Zorn
8. Performing Organization Report No. Report 0-4565-1
10. Work Unit No. (TRAIS)
9. Performing Organization Name and Address Texas Transportation Institute The Texas A&M University System College Station, Texas 77843-3135
11. Contract or Grant No. Project No. 0-4565 13. Type of Report and Period Covered Research: September 2002 – August 2003
12. Sponsoring Agency Name and Address Texas Department of Transportation Research and Technology Implementation Office P. O. Box 5080 Austin Texas 78763-5080
14. Sponsoring Agency Code
15. Supplementary Notes Performed in cooperation with the Texas Department of Transportation and the U.S. Department of Transportation, Federal Highway Administration. Project Title: Public-Private Partnerships for Enhanced Intermodal Rail Service in Texas 16. Abstract
The increasing levels of truck traffic on the State’s highway system are creating an array of issues for the Texas Department of Transportation ranging from highway safety, congestion, and air quality, to the need for accelerated maintenance and capacity expansion. With trade in Texas projected to continue to increase, the pressure to explore alternatives to highway-borne freight is building. At the same time, railroads are facing challenges of their own. As a capital- and labor-intensive industry, railroads are struggling to earn the cost of capital to maintain and operate their extensive networks. As a mode that excels at long-haul intercity freight, but loses to trucking in shorter-haul movements, railroads are in need of services and capital to help gain back lost market share and compete in short-haul markets. The opportunity for establishing a win-win scenario is apparent: by improving the efficiency of intermodal rail service through targeted public-private partnerships, rail transportation may capture a larger market share of intercity freight in Texas and allow important public benefits to accrue – thereby justifying the investment. This report provides an important step in synchronizing public and private transportation planning and financing processes that mostly operate in isolation from one another to the growing disadvantage of each. A truly exciting finding is that both the public sector and the railroads are increasingly receptive to the idea of collaboration and are searching for mutually beneficial solutions to transportation problems. 17. Key Words Intermodal Freight, Public-Private Partnerships, Short-Haul Intermodal, Transportation Economics, Multimodal Freight
18. Distribution Statement No restrictions. This document is available to the public through NTIS: National Technical Information Service 5285 Port Royal Road Springfield, Virginia 22161
19. Security Classif.(of this report) Unclassified
20. Security Classif.(of this page) Unclassified
21. No. of Pages 144
22. Price
Form DOT F 1700.7 (8-72) Reproduction of completed page authorized


ENHANCING INTERMODAL SERVICE THROUGH PUBLIC-PRIVATE PARTNERSHIPS IN TEXAS
by
Stephen S. Roop Research Scientist
Texas Transportation Institute
Jeffery E. Warner Assistant Transportation Researcher
Texas Transportation Institute
Craig E. Roco Associate Transportation Researcher
Texas Transportation Institute
Curtis A. Morgan
Associate Transportation Researcher Texas Transportation Institute
David H. Bierling
Associate Transportation Researcher Texas Transportation Institute
Juan Carlos Villa
Associate Research Scientist Texas Transportation Institute
Sarod P. Dhuru
Graduate Research Assistant Texas Transportation Institute
Chad J. Zorn
Graduate Research Assistant Texas Transportation Institute
Report 0-4565-1 Project Number 0-4565
Research Project Title: Public-Private Partnerships for Enhanced Intermodal Rail Service in Texas
Sponsored by the Texas Department of Transportation
In Cooperation with the U.S. Department of Transportation Federal Highway Administration
October 2003
TEXAS TRANSPORTATION INSTITUTE The Texas A&M University System College Station, Texas 77843-3135


Texas Transportation Institute v Multimodal Freight Transportation Programs
DISCLAIMER The contents of this report reflect the views of the authors, who are responsible for the facts and
the accuracy of the data presented herein. The contents do not necessarily reflect the official
view or policies of the Federal Highway Administration (FHWA) or the Texas Department of
Transportation (TxDOT). This report does not constitute a standard, specification, or regulation.
The researcher in charge of this project was Stephen S. Roop.

Texas Transportation Institute vi Multimodal Freight Transportation Programs
ACKNOWLEDGMENTS The authors would like to thank Wilda Won, the project director, and Wayne Dennis, the project
coordinator, for their support and direction with the project. The authors are also grateful for the
participation of TxDOT Research and Technology Implementation Office members Andrew
Griffith and Martha Norwood and the Project Monitoring Committee members Gilbert Wilson
(TxDOT), Danny Magee (TxDOT), Raymond Sanchez (TxDOT), John La Rue (Port of Corpus
Christi), Jay Chapa (Burlington Northern Santa Fe Railway), and Joe Adams (Union Pacific
Railroad).
The research team on several occasions met with members of both Union Pacific Railroad (UP)
and Burlington Northern Santa Fe Railway (BNSF). The authors would like to thank the
railroads for their participation. Members involved in meetings or phone conversations from the
railroads include:
• BNSF – Randy Bass, Steve Branscum, Jay Chapa, Matt Igoe, Dennis Kearns, Sam Kyei,
John Lystic, Martin Manasco, Ed McNack, David Mehl, Denise Rinehart, Steve Salzman,
Gail Seaman, John Tinker, and Sherry Williams; and
• UP – Joe Adams, John Hovanec, Wint Marler, Ron Olson, and Ben Shelton.
Special thanks go to Sarod Dhuru, with BNSF. Prior to joining BNSF, Sarod worked diligently
as a graduate student at Texas Transportation Institute on this project.
This project was conducted in cooperation with TxDOT and FHWA.

Texas Transportation Institute vii Multimodal Freight Transportation Programs
TABLE OF CONTENTS
Page List of Figures ................................................................................................................................. x List of Tables ................................................................................................................................. xi Chapter 1: Introduction ................................................................................................................... 1
Why Intermodal? ........................................................................................................................ 1 Chapter 2: Freight Shippers Needs and Modal Operations ............................................................ 3
Shippers....................................................................................................................................... 3 Product Attributes ................................................................................................................... 4 Reliability................................................................................................................................ 4 Shipping Costs ........................................................................................................................ 4
Carriers........................................................................................................................................ 6 Trucking Industry.................................................................................................................... 6 Railroad Industry .................................................................................................................... 8
Intermodal Shipping.................................................................................................................. 12 Attributes of Intermodal........................................................................................................ 12 Benefits of Intermodal Shipping by Rail .............................................................................. 13 Deficiencies of Intermodal Shipping by Rail........................................................................ 15
Chapter 3: Intermodal Equipment and Services ........................................................................... 19
Railroad Intermodal Technologies............................................................................................ 19 Container on Flatcar.............................................................................................................. 19 Trailer on Flatcar................................................................................................................... 21 RoadRailer and RailRunner .................................................................................................. 22 Circus Loading...................................................................................................................... 23 Land Ferry............................................................................................................................. 23 Modalohr............................................................................................................................... 24
Current Intermodal Services in Texas....................................................................................... 25 Union Pacific Railroad.......................................................................................................... 25 Burlington Northern Santa Fe............................................................................................... 29 Kansas City Southern............................................................................................................ 33
Short-Haul Intermodal .............................................................................................................. 33 Florida East Coast Railroad .................................................................................................. 34 Norfolk Southern .................................................................................................................. 34 Canadian Pacific ................................................................................................................... 35
Chapter 4: Key Texas Transportation Corridors........................................................................... 37
Federally Designated Corridors ................................................................................................ 37 National Highway System High-Priority Corridors ............................................................. 37 High-Speed Rail Corridors ................................................................................................... 38
Freight Analysis Framework .................................................................................................... 40 Future Corridor Development in Texas .................................................................................... 43
Trans Texas Corridor ............................................................................................................ 43

Texas Transportation Institute viii Multimodal Freight Transportation Programs
Interstate 69........................................................................................................................... 45 Ports-to-Plains Trade Corridor.............................................................................................. 45
Chapter 5: Project Selected Corridors........................................................................................... 47
Selection Considerations........................................................................................................... 47 Multimodal Corridors ........................................................................................................... 47 Truck and Traffic Volumes................................................................................................... 48 Intermodal Facilities and Services ........................................................................................ 48 Railroad Interest.................................................................................................................... 48
Laredo to Dallas Corridor: Interstate 35 – Union Pacific Railroad .......................................... 49 Corridor Overview................................................................................................................ 49 Highway Characteristics ....................................................................................................... 50 Rail Route Characteristics..................................................................................................... 52 Laredo to Dallas Enhanced Intermodal Option .................................................................... 54
Houston to Dallas Corridor: Interstate 45 – Burlington Northern Santa Fe Railway............... 55 Corridor Overview................................................................................................................ 55 Highway Characteristics ....................................................................................................... 56 Rail Route Characteristics..................................................................................................... 57 Houston to Dallas Enhanced Intermodal Option .................................................................. 59
El Paso to Dallas Corridor: Interstate 10-Interstate 20 – Union Pacific Railroad .................... 60 Corridor Overview................................................................................................................ 60 Highway Characteristics ....................................................................................................... 61 Rail Route Characteristics..................................................................................................... 62 El Paso to Dallas Enhanced Intermodal Option.................................................................... 65
Chapter 6: Economic Analysis of Intermodal Rail ....................................................................... 69
Economic Analysis Fundamentals............................................................................................ 69 Need for an Economic Model ............................................................................................... 70
Results for Selected Intermodal Corridors................................................................................ 78 Chapter 7: Forms of PUBLIC-Private Partnerships and Potential Applications in Texas for
Enhanced Intermodal Service ................................................................................................... 85 History of State-Rail Company Partnerships in Texas ............................................................. 85 Defining Partnerships and PPPs................................................................................................ 87 Various Forms of PPPs ............................................................................................................. 89 Comprehensive Rail Policy Considerations.............................................................................. 91
Possible State-Rail Public-Private Partnership Strategies .................................................... 93 Legal and Political Obstacles to the formation of PPPs ........................................................... 97 Application of PPPs in Texas ................................................................................................... 99
HB 3588 Provisions .............................................................................................................. 99 PPP Participants and Likely Scenarios ................................................................................... 100
Examples of Potential Public Participants in Rail-Related PPPs........................................ 100 Examples of Potential Private Participants in Rail-Related PPPs ...................................... 102 Possible Scenarios for Enhanced Intermodal Services ....................................................... 103
Guidelines for setting up Enhanced Intermodal PPPs in Texas.............................................. 106 Additional Sources for Information on PPPs...................................................................... 110

Texas Transportation Institute ix Multimodal Freight Transportation Programs
Chapter 8: Conclusions and Recommendations ......................................................................... 111
Overview................................................................................................................................. 111 Project Implementation........................................................................................................... 112 Economic Assessment ............................................................................................................ 113
Appendix A: Annotated Bibliography........................................................................................ 115 Appendix B: Glossary of Selected Report Terms....................................................................... 121 References................................................................................................................................... 125

Texas Transportation Institute x Multimodal Freight Transportation Programs
LIST OF FIGURES Page Figure 1. Freight Transportation Service Spectrum..................................................................... 15 Figure 2. Rail Intermodal Equipment. ......................................................................................... 22 Figure 3. Hupac’s Rolling Highway Service. .............................................................................. 24 Figure 4. Modalohr Concept Schematics..................................................................................... 25 Figure 5. Union Pacific Intermodal Ramp Locations Map.......................................................... 26 Figure 6. Union Pacific Blue Streak Network. ............................................................................ 27 Figure 7. Union Pacific International Intermodal Service. .......................................................... 29 Figure 8. BNSF’s Intermodal Network........................................................................................ 30 Figure 9. Mexi Modal Network. .................................................................................................. 32 Figure 10. Federally Designated High-Priority Corridors. .......................................................... 38 Figure 11. Designated High-Speed Rail Corridors Located in Texas. ........................................ 39 Figure 12. 1998 Daily Truck Volume from the Freight Analysis Framework. ........................... 41 Figure 13. 2020 Daily Truck Volume from the Freight Analysis Framework. ........................... 41 Figure 14. Total U.S. Rail Flows, 1999. ...................................................................................... 42 Figure 15. Freight Flows to, from, and within Texas by Rail, 1999............................................ 43 Figure 16. Proposed Trans Texas Corridor.................................................................................. 44 Figure 17. Proposed Interstate 69 Corridor.................................................................................. 45 Figure 18. Ports-to-Plains Trade Corridor. .................................................................................. 46 Figure 19. Laredo to Dallas Corridor........................................................................................... 50 Figure 20. Houston to Dallas Corridor. ....................................................................................... 56 Figure 21. El Paso to Dallas Corridor.......................................................................................... 61 Figure 22. West Coast – South Central-Southeast Route Efficiencies Gained from Union Pacific Merger with Southern Pacific. ....................................................................... 63 Figure 23. Union Pacific’s High-Priority Transcontinental Train Including Business and Sleeper Cars. .................................................................................................................. 66 Figure 24. Spreadsheet Model for the Economic Analysis of Intermodal Rail. .......................... 71 Figure 25. Example of Intermodal Rail Project Success with Regard to Planning for the Trans Texas Corridor. ..................................................................................................... 75 Figure 26. Sample Input and Output Data for the Laredo to Dallas Rail Corridor...................... 79 Figure 27. Public and Private Economic Benefits for the Laredo to Dallas Corridor. ................ 80 Figure 28. Sample Input and Output Data for the Houston to Dallas Rail Corridor. .................. 82 Figure 29. Public and Private Economic Benefits for the Houston to Dallas Corridor. .............. 83 Figure 30. Spectrum of Infrastructure Public-Private Partnerships. ............................................ 89 Figure 31. Balancing the Value of Public-Private Partnerships ................................................ 113

Texas Transportation Institute xi Multimodal Freight Transportation Programs
LIST OF TABLES Page Table 1. Impact of Transportation Modes on Supply Chain Performance. ................................... 4 Table 2. Trucking Costs per Mile. ................................................................................................. 7 Table 3. FRA Track Classification. ............................................................................................. 10 Table 4. Maximum Allowable Speeds for Curved Track. ........................................................... 10 Table 5. Marginal Costs of 80 kip 5-Axle Truck Traffic on Highways. ..................................... 14 Table 6. U.S. NACS Intermodal Ramps. ..................................................................................... 31 Table 7. Laredo to Dallas Corridor Mileage Analysis. ................................................................ 51 Table 8. Laredo to Dallas Corridor Traffic Volumes and Capacity Levels................................. 51 Table 9. Laredo to Dallas Corridor Truck Volumes. ................................................................... 52 Table 10. Laredo to Dallas Corridor Intermodal Service. ........................................................... 55 Table 11. Houston to Dallas Corridor Mileage Analysis............................................................. 56 Table 12. Houston to Dallas Corridor Traffic Volumes and Capacity Levels............................. 57 Table 13. Houston to Dallas Corridor Truck Volumes................................................................ 57 Table 14. Houston to Dallas Corridor Intermodal Service. ......................................................... 60 Table 15. El Paso to Dallas Corridor Mileage Analysis. ............................................................. 61 Table 16. El Paso to Dallas Corridor Traffic Volumes and Capacity Levels. ............................. 62 Table 17. El Paso to Dallas Corridor Truck Volumes. ................................................................ 62 Table 18. El Paso to Dallas Corridor Intermodal Service............................................................ 68 Table 19. OMB Real Discount Rates for 2003. ........................................................................... 76 Table 20. Changes in OMB Real Discount Rates between 2002 and 2003................................. 77 Table 21. 1975 NCSL Recommendations to State Governments to Preserve Rural Rail. .......... 92 Table 22. AASHTO SCORT Freight Rail PPP Funding Strategies. ........................................... 94 Table 23: Stages of Partnership Development........................................................................... 107


Texas Transportation Institute 1 Multimodal Freight Transportation Programs
CHAPTER 1: INTRODUCTION
WHY INTERMODAL?
The recognition by transportation professionals that there is a need for a balanced and
better integrated transportation system has given rise to greater interest in using the capabilities
of multiple transport modes to move intercity freight, rather than the continued use of one
primary transport mode (trucks) for intercity freight transport. The failure to formulate a
productive and mutually beneficial alliance between public and private transportation providers
may result in a highway system that is overwhelmed with traffic levels that degrade
infrastructure and service levels to a point where overall economic vitality is reduced.
Intermodal freight transport is a concept that has been around for decades, and whose use
continues to grow. It is not as simple as it looks or seems. At first glance, it is as straight-
forward as just putting a trailer or container on a flatcar and sending it off. In fact, there is a
plethora of methods and equipment on the market, which makes providing intermodal service
somewhat complex. However, the basic concept of intermodal is simple: the idea of unitized
freight. This means that products are loaded into a container or trailer and not unloaded until
they have reached their final destination. While in transit, the trailer or container can be
delivered by any combination of truck, rail, or ship to its final destination.
Research shows that public-private partnerships and joint developments are both
implementable and successful in realizing solutions to transportation problems. Ultimately,
these partnerships revolve around financing mechanisms, which vary at local, state, and federal
levels and from city to city or state to state. The future of solutions to transportation problems
lies, at least in part, in continued application of public-private partnerships in both infrastructure
development (capital costs) and operation and maintenance (marginal costs). These partnerships
need to be considered and evaluated in light of the infrastructures needed for anticipated
developments in transportation technologies and the corresponding impacts to Texas Department
of Transportation’s (TxDOT’s) planning and financing options.
The results of this project have the potential to help fundamentally alter the manner in
which freight transportation is approached in Texas – both from the public and the private
perspective. From the public sector’s point of view, investment in intermodal infrastructures as
an alternative to adding highway capacity, for instance, should be evaluated in terms of the

Texas Transportation Institute 2 Multimodal Freight Transportation Programs
economic and practical “value” of that investment relative to the alternatives. The project
provides the public sector with an understanding of needs and the constraints under which
intermodal carriers operate. This work also provides important guidance on structuring public-
private partnerships and strategies for overcoming legal, institutional, and policy barriers to
collaboration and references decision-support tools that may assist in quantifying the benefits
and costs of selected projects. The organization of this report follows these focus areas:
• compilation of an annotated bibliography on previous work and studies in freight
transport and public-private partnerships (Appendix A);
• discussion of factors influencing shippers’ mode choice decisions, and economic and
operating variables encountered by truck and rail freight carriers (Chapter 2);
• description of intermodal service offerings or products currently provided by the railroads
and that have potential to capture freight market share and induce use by trucking
interests or shippers (Chapter 3);
• identification of key trade corridors in Texas, and analysis of three specific corridors
(case studies) in the state as candidates for increased intermodal services (Chapters 4 and
5);
• discussion of potential economic benefits achieved by intermodal freight transport in
general and over the identified case studies (Chapter 6); and
• definition of the parameters and mechanisms required for effective public-public and
public-private initiatives to facilitate movement of intermodal freight (Chapter 7).

Texas Transportation Institute 3 Multimodal Freight Transportation Programs
CHAPTER 2: FREIGHT SHIPPERS NEEDS AND MODAL OPERATIONS
In order to better understand the advantages that intermodal technologies and
methodologies bring to freight movement, it is necessary to understand the competitive
landscape and operations of trucking and rail-hauled freight. The dominance enjoyed by the
U.S. railroads in freight movement in the 1800s and early 1900s was gradually supplanted by the
trucking industry, which today captures approximately 86 percent of the freight revenue in the
U.S. (1). Automobiles and the airlines have also replaced the rails dominance in passenger
transportation. Like all modes, railroads today are transportation specialists that focus on those
commodities and services that return the maximum profit to their shareholders given the
constraints of their operating environment. Economics have pushed railroads toward long-haul
operations and bulk commodities. They are the principal carriers of bulk chemicals and retain a
vital role in the transport of coal. While railroads move 40 percent of the freight ton-miles in this
country, they capture only 10 percent of the revenue (2).
At the heart of this shift are the shipping needs of customers, and capital and operating
costs and factors affecting overland carriers. The following section discusses shipper concerns
as they impact freight transportation decision-making.
SHIPPERS
The “shipper” is located either at the origin or destination, although the destination’s
requirements can play a more significant role in selection of a freight method. While shippers
may have several alternatives for selecting a mode of transportation, their core interest is the
movement of their products from one location to another at the lowest price possible with highly
predictable delivery. Generally shippers are not concerned with exactly how (meaning the mode
of transportation) the freight is shipped. Shippers select a suitable carrier based on several
factors, including cost, service availability, delivery requirements, volume, and the shipped
product attributes.
Table 1 compares the various transportation modes from a shipper’s point of view. Each
aspect of inventory management is rated on a scale of “1” to “6” for each transportation mode,
where “1” represents low costs or requirements and “6” represents high costs or requirements.
Comparing truck load (TL) shipping to rail shipping, we can see the benefits and drawbacks of

Texas Transportation Institute 4 Multimodal Freight Transportation Programs
choosing one form of transportation over another. An intermodal solution would effectively
“split the difference” between the two, offering smaller lots and slightly slower service and a
better price when compared to trucks.
Table 1. Impact of Transportation Modes on Supply Chain Performance (3). Rail TL LTL Package Air Water Lot Size 5 4 3 1 2 6 Safety Inventory 5 4 3 1 2 6 In-transit Inventory 5 4 3 1 2 6 Transportation Cost 2 3 4 6 5 1 Transportation Time 5 3 4 1 2 6 TL – Truck Load; LTL – Less Than Truckload
Product Attributes
Product attributes have a strong influence on the selection of shipment method. Some of
these attributes include volume of product that needs to be shipped, the cost of carrying
inventory or safety-stock, product density, and distance to be shipped. For example, rail is the
preferred method of shipping bulky commodity products such as coal or gravel because of the
low cost of transportation relative to the cost of the product, high volume being moved over long
distances, and a low cost of storage. While it is possible to move this material by truck, the
higher cost of this shipping method does not provide any benefit. In general, as the product
density decreases, storage cost increases, shipping distance decreases, or shipment volume
decreases, the preferred mode of travel shifts to intermodal, then truck.
Reliability
In market surveys, shipping companies cite reliability as the most important factor, as this
reduces variability in their forecasting. If products are delivered with high predictability, the
need for safety-stock and emergency orders goes down. If predictability declines, the difficulty
and cost of forecasting and planning increases, ultimately reaching a point where it is less
expensive overall to spend more money on a more reliable method of transportation.
Shipping Costs
The Federal Highway Administration (FHWA) Office of Freight Management reports
that the expense to ship products by truck has remained virtually unchanged over the last decade.

Texas Transportation Institute 5 Multimodal Freight Transportation Programs
The average shipping costs per mile for all types of for-hire truck transportation were $1.78 in
2000 (4). Comparing constant dollars from 1990 to 2000 shows the constant dollar expenses per
mile reduced from $1.51 to $1.34 (4). Several variables affect truck expenses and shipping rates:
• Type of Product: This influences the price based on the density of the product
being shipped, the related special equipment that is required, the risk of carrying
the product, and additional insurance or training required to be able to carry that
product.
• Origin and Destination: Because trucking market rates are unregulated, the prices
are based on the demand and supply of trucking at both the origin and destination.
Areas where trucking is not readily available due to a limited number of loads
either arriving or departing from a location will push the price up, as it costs more
time and money to find a new load and avoid phantom freight.
• Urgency of the Shipment: Shipments higher in urgency rely on premium services
with greater shipping rates.
Railroad shipping rates vary by origin, destination, distance, and commodity and have
been greatly affected by the passage of the Staggers Rail Act of 1980. Prior to the Staggers Act,
the Interstate Commerce Commission regulated rail rates, which forced railroads to develop rates
according to regulation instead of the open marketplace. Since the passage of the Staggers Act,
railroads have greatly improved productivity, resulting in significant rail rate reductions. The
Surface Transportation Board reported in December 2000 that from 1984 to 1999, inflation-
adjusted rail rates declined 45.3 percent (5). The following is a list of commodity-specific rail
rate reductions from 1981 to 2001, each adjusted for inflation:
• coal – 62 percent reduction,
• motor vehicle traffic – 35 percent reduction,
• wheat – 54 percent,
• corn – 41 percent, and
• soybeans – 53 percent (5).

Texas Transportation Institute 6 Multimodal Freight Transportation Programs
CARRIERS
The following sections discuss cost and operating factors that affect truck and rail
carriers.
Trucking Industry
The unparalleled highway transportation system in the U.S., typified by Texas with more
than 77,000 miles of publicly financed and maintained roadways, has given rise to a highly
efficient and capable trucking industry that has in turn encouraged innovations in business
practices such as just-in-time manufacturing (which moves the storage location of industrial
inventories from warehouses to the transportation system). The adoption of advanced logistics in
the manufacturing sector has proven to be closely related to the efficiency of the freight
transportation sector and a major driver of highway use by trucks.
The primary advantage of using a truck versus other types of transportation modes is the
low cost combined with the ease of doing business. As trucks use the public highway system,
they are able to pick up and drop off shipments at almost any location. In addition, there are
generally no special requirements for the pick up or delivery locations. For example,
construction materials can be delivered to any location where there is a forklift and enough room
for truck loading/unloading. Trucks are the only practical choice for moving freight to and from
locations that are not serviced by other modes of transportation, although the vast majority of
shipments do occur between metropolitan areas despite access to intermodal facilities.
Compared with other forms of transportation, highway trucks require the lowest amount
of private capital investment because they consist of only a tractor and a trailer. The
infrastructures are partially paid for through fuel taxes, with the trucking industry not covering
an adequate share of the cost of damages. According to the American Association of Railroads
(AAR), a $0.50 investment in the trucking industry will return $1.00 in revenue (6). Table 2
breaks down the cost of operating a truck on a per- mile basis (7). The top four costs are labor
(driver), fuel, overhead, and maintenance.

Texas Transportation Institute 7 Multimodal Freight Transportation Programs
Table 2. Trucking Costs per Mile. Item $/mi % Type
Interest on tractor and trailer 0.029 2.23 Fixed Vehicle depreciation 0.087 6.68 Fixed Insurance 0.100 7.68 Fixed Management & Overhead 0.160 12.29 Fixed Depreciation & Other interest 0.016 1.23 Fixed Fuel 0.192 14.27 Variable Tires 0.027 2.07 Variable Maintenance 0.154 11.83 Variable License 0.095 7.30 Fixed Driver 0.375 28.80 Variable Miscellaneous 0.067 5.15 Variable Total 1.302
Cycle Time Truck drivers that work for a trucking company are paid on a ‘dollars per mile traveled’
basis, which rewards them for traveling from origin to destination in the shortest time possible in
order to accumulate the most miles and make the most money. Because of this basic philosophy,
in order for truck drivers to support an intermodal solution they must see an ability to earn equal
or greater revenues than they would by driving. An intermodal solution could benefit truck
drivers by reducing their cycle time, thereby permitting them to get to a destination faster and
allowing drivers to use their equipment in a more efficient manner or lower their operating costs
substantially. Independent truck drivers generally get paid a flat rate based on the origin and
destination of the load being shipped but still have the same incentives as those truck drivers
working for trucking companies: an intermodal solution that reduces cycle time or lowers costs.
Potential Solutions
One method to lower the truck driver’s cycle time is to travel during the driver’s rest
period. Some truck drivers work as a team, where one driver drives the truck while the other
sleeps. When the sleeping driver’s rest period is over, they trade. This allows the truck to cover
more miles and results in better asset utilization and lower cycle time. While this expedited
service does carry a premium and pays the drivers a premium, the profits resulting from the
freight movement now must be split. If an intermodal service could be designed where the entire
truck with driver can be moved during the driver’s resting period and charge less than what a

Texas Transportation Institute 8 Multimodal Freight Transportation Programs
‘team-member’ would be paid, then one driver could make the same trip in the same time and
keep the additional profit.
A problem that affects the trucking industry is a high turnover in truck drivers due to the
nomadic lifestyle of traveling for days at a time. A potential intermodal solution would reduce
the need for long- haul drivers, as a driver could travel part of the full dray distance and load the
trailer onto an intermodal freight train for delivery to the destination terminal. The truck driver
can then pick up a trailer from the terminal and return with it to his city of origin, allowing a
driver to spend more time at home.
Railroad Industry
Modern railroads are transportation specialists that focus on long-haul or intercity
movements, usually of bulk commodities. The most significant difference between railroads and
trucking companies is that railroads own and maintain their own infrastructure, adding
significant expense to the internal cost of shipping by rail. As a capital- and labor-intensive
industry, railroads must invest approximately $2.50 in their operations and infrastructure to
return $1.00 in revenue, compared with the $0.50 investment on the part of the trucking industry,
as identified previously. Further, the fixed route structure of the railroads limits the railroad’s
ability to compete with a trucking industry that has far more inherent flexibility in point-to-point
transportation and just-in-time delivery.
Despite the cost handicap, railroads are able to capture a significant amount of freight
traffic in the long-haul market for products that are not critical in nature. It is in the short- haul
market where rail has a difficult time competing against trucks. This is due to several reasons,
such as fixed routes prohibiting door-to-door service and lead times substantially longer than
truck service. In 2001, rail traffic declined by 2.9 percent and was down by 3.0 percent as of July
2002 (8).
Individual railroads have advantages in service areas where they own the rail and have
exclusive operating rights, thus limiting the competition to trucking companies. Shippers in
these areas are typically charged higher rates than if there was more than one railroad present but
less than the cost to ship by truck. The railroads use the additional profits earned in these
scenarios to invest in operations in areas where there is competition and margins are thin (9). It

Texas Transportation Institute 9 Multimodal Freight Transportation Programs
should also be noted that despite the higher rates in certain areas, overall freight rates have gone
down because of competition with trucks (9).
Factors Affecting Rail Capacity Capacity on any rail network is affected by a combination of factors, which the railroads
are attempting to address. These factors include the following.
Track Availability. Track availability refers to having the physical space to
accommodate trains and cargo on the railroad system. Several factors can impact the availability
of track infrastructure, including:
• Double tracking of mainline segments of the railroad increases capacity by
allowing trains to operate without using sidings to pass or to allow other trains to
pass. Often there is a significant delay involved as one train waits for the other. In
addition, as has been the case with Union Pacific’s (UP’s) acquisition of Southern
Pacific (SP), double-track operations can set the stage for “directional operations,”
where one line is designated for traffic moving in a particular direction and the
other line is designated for traffic moving in the opposite direction. This strategy
greatly increases not only capacity, but safety as well. Train speeds can be
increased and the need for passing sidings reduced.
• Added passing siding has an impact similar to that of double tracking, increasing
the number and frequency of trains that can be moved through a segment of track.
As the distance between sidings is decreased, track sections begin to have capacity
characteristics approaching a double-tracked segment of line. Siding length also
contributes to capacity. Longer passing sidings allow the railroad to build longer
trains, thus reducing the total number of trains necessary to move the same amount
of goods. The industry is currently running trains up to 7000 feet in length.
• Train control systems such as centralized traffic control (CTC) add to the capacity
of a track segment by allowing centralized dispatchers to monitor train movements
from a control center. This centralized control improves both capacity and safety.
• Track speed, according to the Federal Railroad Administration (FRA) track class
standards, refers to the quality of the track and, hence, the operating speeds at
which the railroads may run trains. Higher speeds mean greater train throughput

Texas Transportation Institute 10 Multimodal Freight Transportation Programs
and greater capacity. The class of a track is achieved by constructing the track to a
certain standard and maintaining it at a certain level of repair. This level pertains to
the engineering and maintenance of both track geometry, for track gage, alignment,
and curvature, and track structure, for ballast, ties, rail, and switches. The FRA
track classes and related maximum allowable speeds are presented below in
Table 3.
Table 3. FRA Track Classification (10). Maximum Allowable Speed (mph) Track Classification Freight Passenger
Class 1 10 15 Class 2 25 30 Class 3 40 60 Class 4 60 80 Class 5 80 90 Class 6 110* 110 *Special conditions apply
The previous table reflects the maximum allowable speeds given ideal, straight track
geometry conditions. Circumstances where the geometry includes curved track reduce the
maximum allowable operating speeds, significantly in situations where the outside track is not
elevated. Table 4 contains a listing of the maximum allowable speeds for curved track for a
series of degree of curvature-elevation of the outside rail scenarios. In the scenario with one inch
of outside rail elevation, the maximum allowable speed reduces by one-half from a slight curve
to one with two degrees of curvature. For all elevation options, maximum train speeds reduce
drastically for severe curves.
Table 4. Maximum Allowable Speeds for Curved Track (10). Elevation (inches)
0 1 2 3 4 5 6 Degree of Curvature Maximum Allowable Operating Speed (mph)
0°30' 93 107 - - - - - 1°00' 66 76 85 93 100 107 - 2°00' 46 54 60 66 71 76 80 3°00' 38 44 49 54 58 62 66 4°00' 33 38 42 46 50 54 57 5°00' 29 34 38 41 45 48 51
10°00' 21 24 27 29 32 34 36

Texas Transportation Institute 11 Multimodal Freight Transportation Programs
Classification and Intermodal Yards. Railroad capacity and throughput is determined
in large measure by the ability of terminals – classification and intermodal yards – to organize
and move freight in and out. The point on a railroad where congestion nearly always begins can
usually be traced to yard facilities and the inability to move out as much freight as is brought in.
The role of a classification yard is to take apart trains that have material being shipped to
multiple destinations and reconstruct trains for which most of the cars in each train are destined
to the same region.
Intermodal yards are slightly different in that they focus on the handling of trailer on
flatcar (TOFC) and container on flatcar (COFC) shipments and must have the infrastructure
available to position and remove trailers and containers, moving shipments from trucks to
railcars or vice versa. The railroads can improve intermodal yard performance by increasing the
size of the yard and improving the ramps used to load trailers and by upgrading the equipment
that lifts containers and places them on trains and trucks.
Improved Equipment. Capacity can be increased by employing improved equipment,
such as double-stack cars for carrying two stacked containers or the use of lightweight grain cars
that allow the railroads to increase the commodity carried by each car. Maintaining a sufficient
locomotive fleet is also critical to capacity on the railroad, and balancing “power” (i.e.,
locomotive horsepower) required for varying locations is a difficult and continually managed
process. New, higher- horsepower locomotives, which are a very significant investment for the
railroads, may ease the challenge in balancing power due to the fact that two new locomotives
may replace three older, lower-power models.
Crew Availability. In terms of its impact on capacity, crew availability is similar to the
availability of locomotives. A shortage of ready, trained, and usable crews is as damaging to
railroad operations as a shortage of power. There are other similarities in the logistical
challenges associated with having the right crews in the proper place when they are needed to
operate a train. FRA work rules limit the number of hours a crew can be on the job to 12
consecutive hours. This period must be followed by 10 consecutive hours of rest. If a crew is
only halfway to its destination when their 12-hour shift lapses, they must cease operations
immediately. This requirement can mean that they are forced to stop a train in the middle of a
single-track line and block traffic until another crew can be brought in to relieve them. It is
readily apparent that, under conditions of substantial business growth, a railroad could become

Texas Transportation Institute 12 Multimodal Freight Transportation Programs
service constrained by a lack of rested or properly dispersed crews. It is, therefore, important for
the railroad to carefully plan how many crews are hired and trained and where they are stationed.
INTERMODAL SHIPPING
Intermodal transportation is an ideal method of transportation that takes advantage of the
strengths of several forms of transportation. Trucks, for example, are ideally suited to local
delivery of goods, as they are able to travel almost anywhere, quickly. Long-distance trucking is
expensive, however, with the bulk of the cost going to fuel and driver salary. Rail, on the other
hand, is ideal for delivering large quantities of product over longer distances. It is limited,
however, as it can only travel where there is rail infrastructure. The combination of truck and
rail services creates an intermodal method of transportation that is efficient, environmentally
friendly, safe, and low in cost. However, it is difficult to create a plausible business plan for an
intermodal solution where the corridor is less than 500 miles long. One reason is that the cost of
short runs is very high, thus making the retail price too high, especially when compared to truck
rates alone. Not only is the cost to the shipper higher, but the transit time from origin to
destination is considerably longer than the time it takes to ship by truck alone at this distance.
Loading and unloading is composed of the time it takes for the container or trailer to be
removed from the delivering truck and placed on the flat railcar. While it only takes
approximately one minute to load each trailer, with only one crane loading a train that will carry
100 trailers, intermodal adds 200 minutes (loading and unloading) to the transit time (11).
Attributes of Intermodal
Intermodal shipments are an important method of providing for long-distance freight
transportation in and through the state of Texas. Due to Texas’ key geographic location on both
international and transcontinental trade routes, a large portion of the nation’s freight traffic,
moving by either rail or truck, passes through or terminates within the state’s borders. For
example, in the year 2000, intermodal trains were responsible for transporting 199 million tons
and 421 billion ton-miles at the national level—the equivalent of 16.2 billion miles of truck
traffic alone (12).
Intermodal business has been one of the fastest growing sectors within the railroad
industry over the past several years. In fact, a recent study conducted for the Association of

Texas Transportation Institute 13 Multimodal Freight Transportation Programs
American Railroads projected that rail intermodal movement, which includes TOFC, COFC, and
double-stack COFC train types will likely overtake coal transport as the largest revenue source
for any single type of rail movement at some point during the 2003 calendar year (13).
Benefits of Intermodal Shipping by Rail
Highway User Benefits: Reduced Congestion and Maintenance Cost Reduction Intermodal freight shipping, combining truck and rail, has many potential public benefits
over truck-only movements. One of the most often cited benefits is the role that intermodal can
play in taking large numbers of trucks off the highway, thereby reducing highway congestion in
urban areas and along high traffic-density trade corridors. By moving long-distance freight from
the highway to rail rights-of-way, more existing highway capacity is left for use for personal
travel in automobiles and light trucks and for local delivery of goods. While not every freight
commodity is conducive to being shipped by container, those that are can often be transported
for most of their total movement by rail just as efficiently as by truck. This can have enormous
financial, traffic safety, social, and environmental benefits. On average, one double-stack
container train can move the equivalent of 280 trucks, thereby increasing highway capacity by
approximately 1100 automobiles (14). In fact, other train types carrying non-intermodal cargo
are capable of removing as many as 500 trucks per train (14).
While relieving congestion, such a reduction in the numbers of trucks using the highway
system could also greatly reduce the costs of long-term highway maintenance. The expenses
associated with truck damage to highway infrastructure are staggering. The current maximum
weight allowed for trucks on Texas highways, without a special permit, is 80,000 pounds.
Previous studies in this area have shown that the impact of one truck loaded to this weight does
the same amount of damage to the underlying roadway structure as approximately 9600
automobiles (15). As shown in Table 5, the marginal costs associated with each mile of truck
travel at this weight, when all costs are accounted for, are approximately $0.199 cents per mile
per truck in rural areas and approximately $0.696 cents per mile per truck in urban areas.

Texas Transportation Institute 14 Multimodal Freight Transportation Programs
Table 5. Marginal Costs of 80 kip 5-Axle Truck Traffic on Highways (16). Although few individual container trucks approach this 80,000-pound weight limit, the damage
inflicted by repetitive truck loadings at lower weights can rapidly accumulate—continuously
generating pavement, environmental, and social costs.
Costs to the public sector in the road maintenance, congestion, and collision categories
can be reduced or avoided by using rail to transport containerized freight. The ability to handle
multiple containers on each railcar and to move many such railcars using the locomotive power
of one train magnifies this rail benefit. By developing policies that encourage rail transport, the
public sector is also implicitly fostering needed reinvestment by the railroad companies into
improving the performance and capabilities of the rail system. The cost of track maintenance
and rehabilitation is transferred to the private sector railroad companies and its users. Public
dollars that would have been spent on roadway reconstruction and rehabilitation may be put to
work elsewhere.
Energy and Environmental In addition to its highway preservation benefits, rail transportation has several energy use
and environmental advantages over highway transportation. According to the AAR, in 2001 the
average locomotive moved a ton of freight approximately 403 miles for every gallon of diesel
fuel used. The AAR also states that railroads are three or more times more fuel efficient than
trucks (17). As a result of such fuel efficiency, shifting even a small percentage of highway
freight to rail could potentially result in the conservation of millions of gallons of fuel each year
(17).
As a result of better fuel economies per ton transported, rail transportation is also more
environmentally friendly than movement by truck on a ton-mile basis. Environmental Protection
Agency (EPA) reports on transportation-related pollution state that only nine percent of nitrogen
Marginal Costs (2000 $) Cost Category Rural Trucking
($/mile) Urban Trucking
($/mile) Congestion 0.0223 0.2006 Collision 0.0088 0.0115 Pollution 0.0385 0.0449 Noise 0.0019 0.0304 Pavement 0.1270 0.4090

Texas Transportation Institute 15 Multimodal Freight Transportation Programs
Higher ……………………………….. Service Cost Continuum ……………………………….…Lower
$10K/lb. $1.50/lb. 5-10¢/lb. 3¢/lb. 1¢/lb. ½-1¢/lb. 1/2¢/lb.
Fastest,most reliable,most visible
Lowest weight,highest value,
most time-sensitivecargo
Fast,reliable,visible
Range of weight andvalue
Rail intermodalcompetitive with truckover longer distances
Slower,less reliable,less visible
Highest weight,lowest value,
least time-sensitivecargo
oxide (NOx) emissions and four percent of particulate emissions are attributed to rail
transportation, even though rail moves over 40 percent of the intercity freight on a ton-mile basis
(17). The intermodal percentage of this freight reduces emissions by consolidating large
numbers of trucks into single train movements with a net reduction in overall emissions.
Reduced Shipper Cost Intermodal rail movement fills an important niche in the freight transportation industry by
providing a cost-effective alternative to long-distance trucking while providing many of the same
benefits since trucks often are responsible for delivery at each end. Intermodal rail also tends to
carry the more valuable commodities within the rail transport segment as shown in Figure 1
below.
Figure 1. Freight Transportation Service Spectrum (12).
Deficiencies of Intermodal Shipping by Rail
Lack of Door-to-Door Delivery The intermodal rail system represents a fixed network of rail lines traveling between
major intermodal facilities, thus providing a service that rarely connects the origin or destination
locations. Direct connections to port terminals are an exception, but the vast majority of

Texas Transportation Institute 16 Multimodal Freight Transportation Programs
intermodal movements by rail require a truck to handle the movement from the origin and to the
destination with rail handling the middle, long-haul component. This need for truck involvement
at the trip beginning and end may reduce the benefit of removing trucks from the highway in
urban areas.
Several factors contribute to the current situation, including the concentration of
intermodal activities at fewer, larger facilities. This allows the railroads to focus their resources
and improve efficiency at fewer locations and on fewer connecting lanes. Also contributing is
the development of the highway system. Industrial areas have increasingly developed along the
highway system, and not necessarily along the rail network, in order to provide better access for
truck shipments.
Service Levels The two primary concerns for shippers are reliability and transit time. Railroad
operations have historically lagged behind trucks in both these categories, including intermodal
operations. Today, intermodal represents one of the fastest growing markets for the railroads and
has prompted them to find ways of providing truck-competitive intermodal service. Working
closely together by providing seamless interchanges, the railroads have begun providing
guaranteed “on-time” intermodal services. These money-back guarantees have resulted in higher
service levels that have reduced transcontinental transit times by days in some cases. A list of
some of these services that include Texas markets appears in Chapter 3.
Capacity and Capital Investment Concerns Between 1980 and 1999, rail intermodal ton-miles grew 98 percent, and the industry
expects that international container trade will double over the next decade (18). These numbers
indicate significant intermodal activity by the railroads but also raise concerns over the rail
system’s ability to handle the increased traffic levels. This concern also translates to an already
congested highway network.
Concerns over the ability to handle increased intermodal levels exist in both the
intermodal facilities and rail network. Many rail terminals reside within the densely developed
city centers, where there is little room for expansion. These intermodal facilities, often
coexisting with other yard activities, likely have short intermodal tracks that require a train to be
broken over several lines and limited space for truck and chassis parking and storage. Newer

Texas Transportation Institute 17 Multimodal Freight Transportation Programs
intermodal facilities have more room for intermodal activities but may be located outside the
urban area, farther from industrial developments. The number and lengths of sidings, level of
signaling, and overpass clearance heights regulate the types and size of intermodal trains
traveling across the rail network.


Texas Transportation Institute 19 Multimodal Freight Transportation Programs
CHAPTER 3: INTERMODAL EQUIPMENT AND SERVICES
Intermodal movements by rail take several different forms, from traditional container or
trailer moves to new technologies being developed in Europe. This chapter details the different
intermodal technologies utilized by railroads in the U.S. and those under development. Also
included is a detailed analysis of the current intermodal services provided by the Class I railroads
operating in Texas.
RAILROAD INTERMODAL TECHNOLOGIES
The basic premise of intermodal is that goods move in standardized units. However, the
reality of today is that intermodal is a highly complex system of different equipment and
technologies that must handle multiple sized units. The traditional manner of shipping
intermodal goods on the railroads includes the intermodal container and the common trailer. But
several newer, specialized equipment technologies are gaining popularity in the U.S. and Europe.
The following sections describe several of the intermodal technologies utilized by the U.S.
railroads and those in portions of Europe.
Container on Flatcar
When discussing intermodal solutions, the method that is usually assumed is container on
flatcar, or COFC. This is used mostly for international freight that is going to or coming from
the ports. COFC usually uses 20 ft or 40 ft containers, common sizes for sea-based shipping.
Containers are very efficient for shipping product, especially overseas, because the chassis is
separate from the container. For rail service, COFC is more efficient than TOFC because
containers can be stacked two high. There are some restrictions in how the containers can be
stacked, which creates some planning difficulties, but the more efficient use of flatcars more than
makes up for these restrictions. International containers do have some drawbacks, including
being smaller than over-the-road trailers (40 ft vs. 53 ft) and also have special reinforcing beams
within the containers so that they can be picked up from overhead, which reduces the capacity of
the container. Domestic containers used within the U.S. more closely resemble the typical over-
the-road trailers in length, adding to the complexity of train planning.
With the continued growth in intermodal traffic, many intermodal facilities in the United
States are approaching or exceeding capacity levels. Historically, railroad intermodal terminals

Texas Transportation Institute 20 Multimodal Freight Transportation Programs
were located within urban areas and, as a result, have no place to expand. Today, railroads are
developing new, larger facilities located outside city centers, allowing the railroad companies to
consolidate intermodal operations at these new, technologically advanced facilities. The
following list provides examples of the size of several existing Texas intermodal facilities and
also the size of several new facilities located around the country.
Existing Texas Facilities
• UP Englewood Yard (Houston) – This 100-acre ramp performs approximately
18,000 lifts per month (19).
• Burlington Northern Santa Fe (BNSF) Pearland Yard (Houston) – This facility
performs approximately 12,000 lifts per month and resides on 83 acres (20).
• UP Mesquite Yard (Dallas) – This 130-acre facility performs 16,000 to 17,000 lifts
per month (21).
• UP Miller Yard (Dallas) – Located on 68 acres, this facility performs
approximately 15,000 lifts per month (21).
• BNSF Alliance Yard (Fort Worth) – This relatively new, modern facility annually
lifts 460,000 trailers and containers and resides on 289 acres. The intermodal
facility provides 3420 parking spaces (22).
Newly Constructed Facilities
• UP Global III Intermodal Facility (Chicago) – Costing $181 million to construct
and covering over 800 acres, this facility is designed to handle 720,000 lifts
annually. The facility contains four full intermodal train-length tracks and offers
4000 parking places for trailers and containers (23).
• UP Marion, Arkansas Intermodal Facility – This $70 million dollar facility
replaces two outdated facilities located in nearby Memphis, Tennessee. Located on
600 acres, these facilities are designed to lift 375,000 trailers and containers
annually and offers 2600 parking spaces (24).
• BNSF Logistics Park (Chicago) – In addition to intermodal operations, this facility
also offers transload services with distribution and warehousing. The entire
Texas Transportation Institute 21 Multimodal Freight Transportation Programs
Logistics Park resides on 621 acres and expanded BNSF’s Chicago area lift
capacity from 400,000 to over 3 million annually (25).
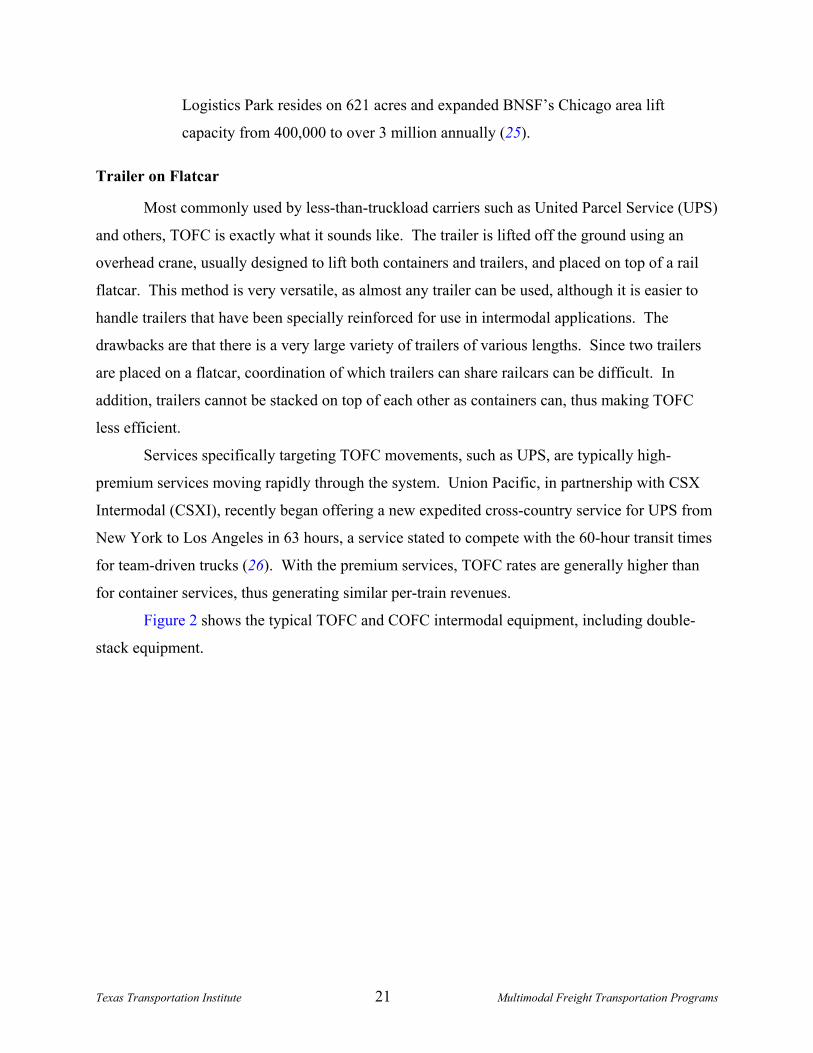
Trailer on Flatcar
Most commonly used by less-than-truckload carriers such as United Parcel Service (UPS)
and others, TOFC is exactly what it sounds like. The trailer is lifted off the ground using an
overhead crane, usually designed to lift both containers and trailers, and placed on top of a rail
flatcar. This method is very versatile, as almost any trailer can be used, although it is easier to
handle trailers that have been specially reinforced for use in intermodal applications. The
drawbacks are that there is a very large variety of trailers of various lengths. Since two trailers
are placed on a flatcar, coordination of which trailers can share railcars can be difficult. In
addition, trailers cannot be stacked on top of each other as containers can, thus making TOFC
less efficient.
Services specifically targeting TOFC movements, such as UPS, are typically high-
premium services moving rapidly through the system. Union Pacific, in partnership with CSX
Intermodal (CSXI), recently began offering a new expedited cross-country service for UPS from
New York to Los Angeles in 63 hours, a service stated to compete with the 60-hour transit times
for team-driven trucks (26). With the premium services, TOFC rates are generally higher than
for container services, thus generating similar per-train revenues.
Figure 2 shows the typical TOFC and COFC intermodal equipment, including double-
stack equipment.

Texas Transportation Institute 22 Multimodal Freight Transportation Programs
Figure 2. Rail Intermodal Equipment (27).
RoadRailer and RailRunner
These two methods use the same basic principle but have some significant differences
that may make one better suited than the other in certain situations. The basic principle is similar
to TOFC, where the entire trailer is moved by rail between cities; however, there is no flatcar.
Instead, these two methods chain trailers and bogies (rail wheel sets) together to make a trailer
train. The two methods, RoadRailer and RailRunner, take very different approaches to
assembling trains, however.
Both methods use specially designed bogies that run on the rails, but RailRunner’s bogies
are FRA certified for higher speeds (up to 110 mph) than RoadRailer. In addition, the
mechanism to attach equipment together is specific to that system, so equipment is not
interchangeable. The principal difference between the two systems is that RoadRailer uses
custom-designed trailers. In order to start intermodal service that uses RoadRailer technology, a
company must invest in a fleet of trailers. RailRunner, on the other hand, has chosen to use
standard intermodal containers. The chassis are still custom designed but can be added to the
pool of chassis that an intermodal yard would require anyway.
Both methods provide increased security because when the train is built, the trailers are
too close to each other to allow the cargo doors to open. They are both fully articulated as well.
This means that the containers do not have any slack between them, so the train operates as one

Texas Transportation Institute 23 Multimodal Freight Transportation Programs
unit. This reduces the chance of damage in transit. Company representatives also claim that
capital costs for these methods are lower because of the minimal requirements for a terminal,
which only needs a moderately sized paved lot with rails.
Circus Loading
This method is similar to TOFC, as well, with the difference being how the units are
placed on the rail flatcars. The circus loading method is currently being utilized by Canadian
Pacific Railway (CP) to service international movements along a route between Montreal and
Detroit, with connections at Toronto and Windsor, and soon to extend to Chicago. To circus
load a train, the trailer simply backs the trailer onto the flatcar using a ramp at the end. Once it is
in position, the trailer is secured and the yard truck pulls away to retrieve another trailer. Circus
loading is very versatile, as any type of trailer can be loaded onto the flatcar; however, the
flatcars are specially designed to have a continuous platform along their length. This allows
trailers to be driven along the entire length into the appropriate position. Again, similar to
TOFC, the trailers cannot be double stacked. Operationally, circus loading utilizes smaller,
typically dedicated, terminal facilities compared with existing large intermodal facilities.
Land Ferry
This method is identical to the circus loading method, except that the entire truck (tractor
and trailer) pulls forward onto the train. There are also passenger cars as part of the train
makeup where the drivers of the trucks spend the journey.
This method has been proven successful in Switzerland, where very specific
circumstances contribute to the successes in that corridor. The Swiss government was very
concerned with both safety when trucks cross the Alps and with highway damage resulting from
the trucks passing on their highway system. To help pay for the damage trucks cause to the
Swiss highways and to hopefully persuade trucks to drive around their country, the government
levied a $200 (U.S.) tax on every truck that crossed through Switzerland. Despite this, the drive
was still cheaper and shorter enough to warrant paying the additional tax, and the Swiss border
continued to experience lengthy queues of up to 10 kilometers, or slightly greater than 6 miles
(28).
The Hupac Group, a private intermodal provider, opened the land ferry service called the
Rolling Highway with the support of a $300 (U.S.) per truck subsidy from the Swiss government

Texas Transportation Institute 24 Multimodal Freight Transportation Programs
(28). The railcars, locomotives, and terminals are all owned by Hupac. The service, carrying the
tractor, trailer, and driver, operates multiple routes between Italy and Germany, Belgium, and the
Netherlands, thus eliminating these trucks from Swiss roadways. Figure 3 shows the land ferry
service loading of the trucks and carrying the entire truck.
Figure 3. Hupac’s Rolling Highway Service.
Modalohr
A new entry in the intermodal world is Modalohr, which is innovative and has potential
for both a rapid-load TOFC and land ferry service. This technology is under development in
France and will be undergoing test runs over the next several years. Modalohr can provide
TOFC and circus loading methods but significantly cuts down on loading times. Modalohr is a
very low-profile railcar with a rotating platform, as shown in Figure 4.
To load the car, the platform is rotated 45 degrees and the tractor and trailer are driven
on. The tractor is detached from the trailer, and the platform is rotated back into position. The
tractors can also be loaded onto another car, if desired. All of the cars can be loaded at one time,
and there is no need for yard trucks to load the containers, as the delivering tractor can load or
unload directly.

Texas Transportation Institute 25 Multimodal Freight Transportation Programs
Figure 4. Modalohr Concept Schematics.
CURRENT INTERMODAL SERVICES IN TEXAS
Class I railroad intermodal services have been growing consistently in the last years,
despite the weak economy. The Intermodal Association of North America (IANA) reported that
the second quarter of 2003 was the fifth consecutive quarterly gain of intermodal volume. Traffic
grew in all key intermodal corridors, with an 11.3 percent growth from second quarter 2002 for
the South Central-Southwest corridor. Railroads are receiving the benefits from aggressive
marketing strategies, guaranteed transportation products, and expanded capacity. Class I
railroads have been launching joint ventures with other railroads and motor carriers to offer a
more reliable and consistent intermodal service. This section of the report describes the
intermodal offerings by Class I railroads that serve Texas.
Union Pacific Railroad (29)
Union Pacific Intermodal offers services to major domestic markets with an extensive
intermodal terminal network, designed to serve as a critical interchange hub and
loading/unloading terminal for rail intermodal shipments. In Texas, UP has intermodal ramps in

Texas Transportation Institute 26 Multimodal Freight Transportation Programs
El Paso, San Antonio, Laredo, Dallas, and Houston, with a “paper ramp” in McAllen. The
location of UP’s ramps is presented in Figure 5.
Figure 5. Union Pacific Intermodal Ramp Locations Map.
This section will describe the domestic services and the services to Mexico in which UP
participates and describes on the company website. Many of these services connect with an
additional rail carrier, expanding the service either across the U.S. or by rail into Mexico and
Canada.
Domestic Services Union Pacific offers several domestic services.
Cascade Connection. The Cascade Connection serves the Interstate 5 corridor from
Southern California to Vancouver, British Columbia. This is a pilot program in the Interstate 5
intermodal service corridor serving Los Angeles, California, in the south, and Portland, Oregon,
and Seattle, Washington, in the north.
Blue Streak. The Blue Streak has been in operation for over 60 years as a premier train
for the Cotton Belt, St. Louis Southwestern, and Southern Pacific railroads. It currently offers
expedited intermodal service with three tiers of service:

Texas Transportation Institute 27 Multimodal Freight Transportation Programs
Superflyer
• Guaranteed on time or service is free
• Guaranteed equipment availability and condition
• Schedule with best cut off times and availability
• Proactive shipment monitoring
Premium
• Priority access on the train; if cutoff is made, container will make the train
• Improved schedule with more favorable cutoff and availability times
• Proactive service monitoring; if freight is running behind, UP will inform of its
status
Standard
• Subject to next-day rolling
• Standard commitments
• Normal customer service
The Blue Streak has an intermodal terminal in Dallas, and the complete network is shown
on Figure 6.
Figure 6. Union Pacific Blue Streak Network.

Texas Transportation Institute 28 Multimodal Freight Transportation Programs
Premier Service between Chicago and Los Angeles. This is an expedited third-day
intermodal service with two levels of service between Los Angeles and Chicago. This truck like
service uses Equipment Management Program (EMP), STAX, or private equipment services.
EMP is a domestic interline container service offered by Union Pacific and Norfolk Southern,
and STAX is a UP and CSXI cross-country container shipping service.
Mexico Services Union Pacific offers three intermodal options to and from Mexico.
Passport. This is a seamless rail-truck ramp-to-door/door-to-ramp service in EMP’s and
rail trailers between specific U.S.-Canadian ramps and major Mexico markets via the Laredo
gateway. Delivery and pick-up in Mexico is arranged by UP Carrier Services (UPCS) with an
authorized Mexican motor carrier (AMMC). Passport simply means that a shipment is required
to de-ramp at the border and present documentation to clear Customs before moving across the
border.
TransBorder. This is a managed all rail and inbound product that bypasses congested
border crossings and moves shipments in and out of Mexico faster and less expensively.
Conventional. The most popular plan combines rail movement north of the border on
Union Pacific with an intermodal marketing company (IMC) or motor carrier south of the
border, providing flexibility in transloading, consolidating, warehousing, or maintaining
preexisting relationships with border vendors. This is a ramp-to-ramp service in containers or
trailers, rail or private, between several U.S.-Canadian ramp points and Mexico gateways located
at El Paso, Laredo, and McAllen, Texas, and Calexico, California.
International (Ocean) For purposes of distinguishing international containerized shipments in the U.S. from
domestic shipments, Union Pacific defines international as U.S. rail traffic involving an
immediately prior or subsequent ocean movement. Figure 7 presents UP’s international
intermodal network.

Texas Transportation Institute 29 Multimodal Freight Transportation Programs
Figure 7. Union Pacific International Intermodal Service.
Burlington Northern Santa Fe (30)
BNSF railway operates one of the largest intermodal networks in North America and
customizes, designs, and even guarantees consistent transportation services to meet intermodal
requirements. BNSF’s intermodal network is shown in Figure 8, and BNSF hub facilities in
Texas are located in Alliance (Dallas-Fort Worth), Amarillo, El Paso, and the Port of Houston.

Texas Transportation Institute 30 Multimodal Freight Transportation Programs
Figure 8. BNSF’s Intermodal Network.
BNSF provides the following intermodal service level options:
• E (Expedited) – For extremely time-sensitive shipments, this provides the fastest
service available, which is competitive with 900-mile-per-day over-the-road, team-
driver service.
• P (Premium) – This truck-competitive service for trailers or containers supplies
premium train service comparable with 500-mile-per-day or single-driver truck
service.
• N (No weekend availability) – This is a premium train service for trailers or
containers offering weekday (Monday-Friday) availability at the destination.
• V (Value) – This is a service in selected markets to address fluctuating supply and
demand needs.
• Y (Empty) – Train service provided for the movement of empty containers or
trailers.
BNSF offers several domestic and Mexico-related intermodal services.

Texas Transportation Institute 31 Multimodal Freight Transportation Programs
Guaranteed Service BNSF and Norfolk Southern (NS) have teamed up to offer coast-to-coast guaranteed
intermodal service deliveries. BNSF offers a 100 percent on-time guarantee for intermodal
shipments between Alliance and Chicago, Richmond, San Bernardino, and Stockton.
Ramp-to-Ramp to and from Mexico via El Paso BNSF, CSXI, and Ferrocarril Mexicano (FXE) have expanded the North American
Container Service (NACS) network to include service to and from Mexico via El Paso. This
offer includes service between selected ramps in the U.S. and the ramps at Pantaco (Mexico
City) and Guadalajara. The services are available to and from the U.S. ramps in Table 6.
Table 6. U.S. NACS Intermodal Ramps. Atlanta Baltimore Boston Charleston Chicago Cleveland
Evansville Ft. Lauderdale Jacksonville Los Angeles Miami Nashville
Orlando Philadelphia Richmond St. Paul Savannah S. Kearny
Springfield Syracuse Tampa Worcester
Mexi Modal Mexi Modal is an intermodal service offered by BNSF in which carriers from Canada and
Mexico participate, offering a truck-competitive, seamless transportation option into and out of
Mexico. The carriers that participate with BNSF are:
• Canadian National (CN),
• CSX Intermodal,
• Ferrocarril Mexicano, and
• Transportacion Ferroviaria Mexicana (TFM).
Mexi Modal services are offered via Laredo with TFM in the Midbridge or MexiStack
options, or via El Paso with FXE in the InterWest alternative.
The Midbridge product mirrors how most transborder truck transportation into and out of
Mexico occurs today and allows the purchase of products to occur at the “middle of the bridge”
between Laredo, Texas, and Mexico. Midbridge allows freight to be moved in containers by rail
in the U.S. and by truck in Mexico.

Texas Transportation Institute 32 Multimodal Freight Transportation Programs
The Laredo product allows movements of full truckload freight from the United States by
rail either to or from a designated warehouse in Laredo, enabling shippers to store freight in
Laredo for warehousing.
MexiStack is an all-rail, door-to-door product that enables the purchase of goods to occur
at the United States or Mexico origin or destination. The freight is moved in containers by CSXI
together with BNSF in the United States and by TFM in Mexico. The Mexi Modal network is
shown in Figure 9.
Figure 9. Mexi Modal Network.

Texas Transportation Institute 33 Multimodal Freight Transportation Programs
Kansas City Southern (31)
Kansas City Southern Railway (KCS) offers two main intermodal services: the Meridian
Speedway and the North American Free Trade Agreement (NAFTA) Express.
Meridian Speedway In 1995 KCS initiated run-through intermodal service between Meridian, Mississippi, and
Alliance, Texas, on its Meridian Speedway. That operation was expanded in 1997 with the
implementation of a voluntary coordination agreement (VCA) designed to promote manifest
traffic volume on the route. The VCA offers Norfolk Southern shippers run-through service
accessing Dallas and Mexico while avoiding congested Memphis and New Orleans gateways.
In March of 1998, KCS and NS opened a newly constructed joint intermodal facility in
Port Arthur, Texas, to service the Port Arthur/Beaumont/Houston, Texas, Gulf Coast region.
NAFTA Express NAFTA Express offers time-definite intermodal service to and from Laredo or all the
way to Mexico City. NAFTA Express offers an alternative to costly, time-consuming over-the-
road service. Southbound shipments de-ramping or northbound shipments ramping in Laredo
take advantage of NAFTA Express service through Texas Mexican Railway’s Laredo intermodal
facility, Serrano Yard.
SHORT-HAUL INTERMODAL
The current intermodal services listed in the above section either extend the length of the
railroad’s system or continue, through partnerships, over another railroad. This means
intermodal movements typically extend beyond 1000 miles, even exceeding 2000 miles for some
West Coast-East Coast transcontinental movements. The term short-haul intermodal generally
focuses on movements less than 700 miles. At these distances competition with trucking is very
strong, but railroads see this market as having growth potential. Jim McClellan, Senior Vice
President of Planning at NS indicates that if the railroads want to grow business “it means taking
on truckers in short-haul markets (32).”
To implement successful short-haul intermodal services is a very big challenge for the
railroads. Several factors contribute to the success of short-haul intermodal. The first is
intermodal produces small margins, so the short-haul service requires large volumes to cover the

Texas Transportation Institute 34 Multimodal Freight Transportation Programs
relatively small margins. The product needs to provide truck-like service, including highway-
competitive transit times and high service delivery performance. Shippers depend on extremely
high levels of reliability for truck services, so the railroad will have to meet these standards for
success. These levels are contradictory to existing perceptions of historic rail performance. In
order to develop highly reliable, truck-like performances, the rail corridor needs to be high-
speed, high-capacity routes directly connecting major markets.
Terminals also contribute to the success of short-haul intermodal services. Drayage is a
major cost component of intermodal shipments, so drayage costs need to be minimized for short-
haul intermodal. The terminals for short-haul intermodal services need to be well placed in order
to create shorter drays. Services directly to and from ports would remove the drayage costs for
one end of the service, thus greatly reducing that cost component. Terminal operations need to
be fast, in order to facilitate highway-competitive transit times.
There are many examples in the U.S. and Canada of short-haul intermodal services,
ranging from shuttle services, such as the Alameda Corridor, or truck-like services, such as CP’s
Expressway. The following include a few notable short-haul intermodal services.
Florida East Coast Railroad
The Florida East Coast Railroad (FEC) operates from Miami to Jacksonville, where it
interchanges with both NS and CSX. In conjunction with NS, FEC operates the Hurricane Train
between Atlanta, Jacksonville, and Miami, a total distance of 650 miles. The seven-day-a-week
run-through service provides next day service from Jacksonville to Miami, and second morning
delivery from Atlanta with service performance of 26 hours, both of which are highly
competitive with truck-transit times (33).
Norfolk Southern
Norfolk Southern offers multiple short-haul services, including domestic retail service
utilizing their Triple Crown subsidiary. Two major short-haul successes for NS include services
between Atlanta and the ports of Charleston, South Carolina and Savannah, Georgia. The direct
connection removes the dray penalty at the port locations, thus making these short routes a more
economically viable option. The highway distance between Charleston and Atlanta is 320 miles,
while the distance between Savannah and Atlanta is only 249 miles, making these extremely
short for rail intermodal (34).

Texas Transportation Institute 35 Multimodal Freight Transportation Programs
Norfolk Southern’s preferred competitive tool for short-haul traffic is their Triple Crown
RoadRailer technology, which was previously described in this chapter. The Triple Crown
service operates an extensive retail network, according to Jim McClellan, including operations in
Canada, U.S., and Mexico. The vital component of the service is that it is a door-to-door, one
price, one point of contact service utilizing standard truck trailers modified to operate on rail
lines. According to Mr. McClellan, the Triple Crown service “looks like, smells like, and acts
like a truck (34).”
Canadian Pacific
For Canadian Pacific, short-haul does not mean directly competing against trucking but
partnering with trucking companies to provide the line-haul portion of the motor carriers’ trip.
This provides benefits to the trucking companies and fleet owners by saving on tractor
investments, driver availability and costs, and fuel and maintenance expenses. The Expressway
product covers the Toronto-Montreal-Detroit corridor and represents a non-traditional TOFC
service with dedicated terminals and trains. The roll-on/roll-off loading and unloading
technology, previously described in this chapter, allows for the transport of non-reinforced
trailers by the railroad, thus expanding the available customer base. The 24-hour-a-day service
has the capabilities of transporting 90 trailers per train and utilizes consistent market-driven
schedule service, highway-competitive transit times, and superior service delivery performance
of around 95 percent (35).


Texas Transportation Institute 37 Multimodal Freight Transportation Programs
CHAPTER 4: KEY TEXAS TRANSPORTATION CORRIDORS
Texas’ central location in the U.S., its proximity to Mexico, and its seaport connections
along the Gulf Coast create highly utilized trade corridors across the state. Many of these
corridors include both highways and rail lines that extend to major domestic and international
markets. This chapter provides a description of many of the major trade corridors in the state,
including those designated by state or federal agencies, those identified by freight movement
patterns, and those proposed for future development.
FEDERALLY DESIGNATED CORRIDORS
Recent federal legislation has undertaken the process of identifying major corridors
around the country that extend through multiple states and are important to future freight and
passenger movements. This section describes the federally designated high-priority highway
corridors and the high-speed rail corridors that connect major markets around the country.
National Highway System High-Priority Corridors
Originally developed under the Intermodal Surface Transportation Efficiency Act of 1991
(ISTEA) and expanded under the Transportation Efficiency Act for the 21st Century (TEA-21),
43 high-priority corridors were designated in the U.S. These corridors represent major trade
corridors.
Texas is the location of several international border crossings and major trade corridors.
In total, six high-priority corridors pass through Texas. These are shown in Figure 10. Only
Corridor 3 through the Texas Panhandle does not directly connect at a Texas-Mexico border
crossing. The following five connect at border crossings:
• Corridor 27 – El Paso,
• Corridor 38 – Del Rio and Eagle Pass,
• Corridor 23 – Laredo,
• Corridor 20 – Laredo, and
• Corridor 18 – McAllen and Brownsville.
Combined Corridors 18 and 20 make up the proposed Interstate 69, and Corridor 38 represents
the Ports-to-Plains Trade Corridor. Each of these routes is currently under consideration for

Texas Transportation Institute 38 Multimodal Freight Transportation Programs
future development. Corridor 23 corresponds to Interstate 35 and was studied in a multistate
project examining proposed improvement alternatives.
Figure 10. Federally Designated High-Priority Corridors.
High-Speed Rail Corridors
A provision of the 1991 federal ISTEA legislation allowed the U.S. Department of
Transportation (U.S. DOT) to designate up to eight rail corridors throughout the U.S. as locations
where high-speed rail (HSR) would potentially be developed. TEA-21 expanded the number of
corridors from eight to 11. The ISTEA legislation also authorized a special program for funding
at-grade crossing hazard mitigation and other safety improvements along the designated
corridors. For example, the most recent program allocations provide $5.22 million in grants to
10 states along five HSR corridors. The U.S. DOT indicates that since 1993, this program has
“resulted in improvements to nearly 330 highway-rail crossings, the closure of 122 highway

Texas Transportation Institute 39 Multimodal Freight Transportation Programs
grade crossings, and aided in the design and construction of 12 grade separation projects (36)”.
To date, Texas has not received significant funding from this program.
There are currently two federally designated HSR corridors within the state of Texas.
The Gulf Coast Corridor was first designated in 1998. The Texas portion of this corridor
includes the Union Pacific “Sunset Line” between Houston and the Louisiana border via
Beaumont. This corridor links Houston to the more extensive routes in the states of Louisiana,
Mississippi, and Alabama. Extensions to Georgia and Florida have also been added since it was
first designated, as shown in Figure 11.
Figure 11. Designated High-Speed Rail Corridors Located in Texas.
The second HSR corridor in Texas is the South Central Corridor. This corridor was
designated in 2000 and includes lines in Texas, Oklahoma, and Arkansas. The Texas portion of
the corridor roughly parallels Interstate 35 between San Antonio and the Dallas-Fort Worth area.
From Dallas, the route continues on to Texarkana, where it connects to Arkansas section ending
in Little Rock. The Oklahoma portion of the route connects Tulsa and Oklahoma City to Dallas-
Fort Worth via Gainesville. In 2003, TxDOT submitted a request to the Federal Railroad
Administration to add an extension to the existing South Central Corridor that would extend
from the Killeen-Temple area to Houston via Bryan-College Station—effectively connecting the
two previously existing corridors and linking the major urban areas of the state. This extension

Texas Transportation Institute 40 Multimodal Freight Transportation Programs
request was not approved, due to changes in U.S. DOT and FRA policy that encourage an
increased role for states in developing and funding new passenger rail corridors.
FREIGHT ANALYSIS FRAMEWORK
The Freight Analysis Framework (FAF) is a tool developed by the FHWA to understand
freight demands, assess implications for the surface transportation system, and develop policy
and program initiatives to improve freight efficiency (37). The FAF estimates trade flows on the
nation’s infrastructure in order to identify locations of capacity concerns. The FAF utilizes a
base data year of 1998 and projects volumes for the years 2010 and 2020. The transportation
modes incorporated into the tool are highway, railroad, water, and air.
The association of the trade flows with the infrastructure allows for the analysis of major
trade corridors across the country. The following two figures display the current and projected
truck volumes across the U.S. Examining the 1998 truck flows in Figure 12 shows that major
flows occur in the eastern portion of the U.S., along the California coast, and from Texas to the
east. The majority of the truck flows in Texas occur in the metropolitan areas and in the Texas
Triangle between Dallas-Fort Worth, San Antonio, and Houston along Interstates 35, 45, and 10.
The major flows between Texas and other states exist on Interstate 40 through the Panhandle’s
Interstates 20, 30, and 35 from Dallas toward the north and east, and Interstate 10 between
Houston and New Orleans. For 1998, the urban areas are the only locations with volumes
greater than 10,000 trucks per day.
Figure 13 shows the anticipated daily truck volumes for year 2020 across the U.S.
A much higher percentage of the country’s infrastructure is projected to carry at least 10,000
trucks on a daily basis. Where these locations were only in urban areas of Texas, they are
anticipated to occur over the entire segments of the Texas Triangle and most of the interstate
highways crossing into Texas. The anticipated growth in truck volumes will also result in
significant numbers of trucks along the rural sections of Interstates 10 and 20 from El Paso to
San Antonio and Fort Worth and international connections to Laredo, McAllen, and Brownsville.
The map also displays the significant transcontinental corridors across the country.

Texas Transportation Institute 41 Multimodal Freight Transportation Programs
Figure 12. 1998 Daily Truck Volume from the Freight Analysis Framework (37).
Figure 13. 2020 Daily Truck Volume from the Freight Analysis Framework (37).

Texas Transportation Institute 42 Multimodal Freight Transportation Programs
FHWA also utilizes the FAF to create flow maps of the rail movements across the U.S.
Figure 14 displays the total U.S. rail flows for the year 1999. The rail flows are generally
associated with major port and border locations. In Texas, the most significant corridor exists
between Houston and the Dallas-Fort Worth region. Several additional high-volume corridors
connect with the Dallas area.
Figure 14. Total U.S. Rail Flows, 1999 (37).
The results of rail volumes only originating and/or terminating within Texas are
displayed in Figure 15. The dominant flow reaches from the Midwest through the Dallas-Fort
Worth region and down to Houston. This lane is explained by the coal movements originating in
Wyoming and major movements to Kansas City and Chicago. Also notable are the movements
between the West Coast and Texas along UP’s Sunset Route and BNSF’s Transcon Line from
Los Angeles to Chicago, which passes through Texas’ Panhandle. Traffic from this line destined
for Texas connects at Amarillo before traveling to Fort Worth.
The international movements to Laredo are also pronounced in Figure 15. Both the UP
line from San Antonio and the Texas Mexican Railway line from Corpus Christi have flows of
five million to 20 million tons.

Texas Transportation Institute 43 Multimodal Freight Transportation Programs
Figure 15. Freight Flows to, from, and within Texas by Rail, 1999 (38).
FUTURE CORRIDOR DEVELOPMENT IN TEXAS
The picture of future transportation in Texas will be greatly affected by current state and
federal concepts of moving people and goods. This section provides an overview of several
corridor concepts for Texas.
Trans Texas Corridor
The Trans Texas Corridor plan released in June 2002 proposes a 4000-mile corridor
system entailing 1200-ft wide rights-of-way. Each corridor will contain separate highway lanes
for passenger vehicles and trucks, high-speed passenger and freight rail lines, and dedicated
utility zones.
The vision of the Trans Texas Corridor is to provide a faster and safer transportation
network for the movement of people and goods. There are several identified positive impacts the
corridor will have on the state.
• It will relieve congestion in the major metropolitan areas.
• It will increase safety by routing hazardous materials away from highly populated
areas.
• It will generate toll revenue to further improve Texas’ transportation system.

Texas Transportation Institute 44 Multimodal Freight Transportation Programs
• It will stimulate economic growth (39).
With these in mind, four corridor segments have been designated as priority segments for their
potential ability to maximize the benefits:
• Denison to the Rio Grande Valley parallel to Interstate 35, Interstate 37, and the
proposed Interstate 69;
• Texarkana to Houston to Laredo along the proposed Interstate 69;
• Houston to Dallas-Fort Worth parallel to Interstate 45; and
• El Paso to Orange parallel to Interstate 10.
Figure 16 displays the proposed Trans Texas Corridor, with priority corridors identified in red.
Figure 16. Proposed Trans Texas Corridor (39).

Texas Transportation Institute 45 Multimodal Freight Transportation Programs
Interstate 69
Considered the NAFTA Highway, Interstate 69 will connect Mexico with Canada
through eight U.S. states, including Texas. The Interstate 69 states, the states using Interstate 69,
and its border crossing ports account for nearly 63 percent of the total U.S. truck-borne trade
with Canada and Mexico (40). The development of Interstate 69 will occur along the
combination of two federally designated high-priority corridors: Corridor 18 and Corridor 20. In
Texas, Interstate 69 will travel from Texarkana to the Rio Grande Valley, where branches stretch
to the border crossings of Laredo, McAllen, and Brownsville. Figure 17 shows the proposed
Interstate 69 route in Texas.
Figure 17. Proposed Interstate 69 Corridor (41).
Ports-to-Plains Trade Corridor
In TEA-21 the Ports-to-Plains corridor was designated as high-priority Corridor 38.
Driven by the tremendous NAFTA-related trade volumes, the Ports-to-Plains corridor will
connect Mexico to Denver, Colorado, through west Texas, the Texas Panhandle, New Mexico,
Oklahoma, and Colorado. Figure 18 shows the proposed Ports-to-Plains routes from Denver to
the Texas-Mexico border.

Texas Transportation Institute 46 Multimodal Freight Transportation Programs
Figure 18. Ports-to-Plains Trade Corridor (42).

Texas Transportation Institute 47 Multimodal Freight Transportation Programs
CHAPTER 5: PROJECT SELECTED CORRIDORS
The previous chapter described the many identifiable corridors within Texas. The most
significant corridors revolve around the movement of freight along the interstate highways and
major rail routes, particularly those related to international movements.
Successful intermodal services depend on reliable service levels and competitive costs
associated with the movement from the origin to the destination. The focus of this project is to
identify corridors with enhanced intermodal services, the use of which could reduce truck traffic
on highways. The three corridors selected are:
• Laredo to Dallas, involving Interstate 35 and Union Pacific Railroad;
• Houston to Dallas, involving Interstate 45 and Burlington Northern Santa Fe
Railway; and
• El Paso to Dallas, involving Interstate 10-Interstate 20 and Union Pacific Railroad.
Each corridor represents different scenarios of enhancement options and different markets
served. This chapter describes the selection criteria utilized in the selection process and the
characteristics of the selected corridors.
SELECTION CONSIDERATIONS
Texas has a robust transportation system that is used extensively for the movement of
freight. In selecting three corridors for detailed analysis for this project, researchers used several
criteria.
• multimodal in nature,
• high levels of traffic and truck volumes,
• currently utilized for intermodal purposes, and
• considered significant by the railroads.
Multimodal Corridors
The selection process focused on corridors that provide both highway and rail
transportation options between the identified market centers. In some instances, rail lines closely
parallel the highway route, passing through virtually the same markets throughout the length of
the route. In other instances, the rail line and highway may connect to the same origin and

Texas Transportation Institute 48 Multimodal Freight Transportation Programs
destination but may vary in routing. Also, the rail route may consist of a direct route or may
utilize several different segments, such as transferring from one subdivision to another along the
route. For this project, the primary concern is the origin and destination markets without
consideration of the intermediate markets. Therefore, either scenario is acceptable, given the
origin and destinations are the same and the routes are not overly circuitous. In Texas, most of
the corridors reviewed were multimodal in nature, consisting of both highway and rail couples.
Truck and Traffic Volumes
The growth in the number of trucks transporting freight on Texas highways has grown
significantly. Texas’ position along many of the major trade routes between the U.S., Mexico,
and Canada, along with the major seaports and inland commercial centers, has contributed to this
growth. Truck traffic, combined with the significant growth in automobile traffic along the
major highways is resulting in increasing levels of roadway congestion. Along with the
development of suburban communities, congestion is becoming one of the highest concerns in
urban transportation and municipality planning. This project focuses on those routes that contain
high levels of truck traffic along the entire stretch of the corridor and that will benefit from the
removal of trucks that traverse the entire corridor from the highway system.
Intermodal Facilities and Services
One major consideration for providing intermodal service along a corridor is the
operation and availability of existing intermodal services and terminals for the truck-to-rail
transfer. Three of the seven U.S. Class I railroads operate in Texas and maintain intermodal
facilities. Chapter 3 of this report discussed the many intermodal services currently offered in
the state. For the selection process, researchers examined the corridors identified in Chapter 4
for the existence of the development of intermodal facilities and services.
Railroad Interest
A Public-Private Intermodal Partnership will not be successful without the interest and
cooperation of the railroads. In Texas, the Class I railroads are Union Pacific Railroad,
Burlington Northern Santa Fe Railway, and Kansas City Southern Railway. Just as with any
business, the railroads continuously examine their business for ways to improve productivity
without any added burdens, such as long-term debt or commitments. Two ways to develop

Texas Transportation Institute 49 Multimodal Freight Transportation Programs
enhanced intermodal services are to target either highly utilized lines that would benefit from
infrastructure improvements or underutilized lines with excess capacity. The research team
employed direct communication with the Texas railroads for this criterion.
LAREDO TO DALLAS CORRIDOR: INTERSTATE 35 – UNION PACIFIC RAILROAD
Corridor Overview
The Laredo to Dallas corridor represents one of the most significant north-south trade
corridors in the United States. Interstate 35 is the only interstate highway that connects Mexico
and Canada and passes through the Midwest, linking the metropolitan areas of San Antonio,
Austin, Dallas-Fort Worth, Oklahoma City, Kansas City, Minneapolis-St. Paul, and Duluth.
National trade corridor flows indicate Interstate 35 carries some traffic along the entire length
between Mexico and Canada but, more importantly, acts as a collection basin for locations along
the Eastern U.S. traveling to and from Mexico. In Texas, the Interstate 35 segment represents
the fastest growing population area in the state, with the metropolitan areas of Laredo, San
Antonio, San Marcos, Austin, Temple, Waco, and Dallas.
In 2001, surface trade valued at over $79 billion moved through the Laredo gateway,
ranking it second to Detroit in total U.S.-North American land trade and first in U.S.-Mexico
land trade. The majority of that land trade travels by truck and rail. Incoming trucks through the
Laredo gateway totaled 1.4 million crossings, while incoming rail movements totaled almost
274,000 crossings. On a daily basis 3800 truck and 750 rail incoming crossings take place
through the Laredo gateway (43).
The Union Pacific Railroad is the only carrier to maintain rail routes over the Laredo to
Dallas corridor. The San Antonio to Laredo route segment consists of one mainline segment.
The Dallas to San Antonio route segment consists of multiple routes of rail infrastructure over
several subdivisions. Operationally, this allows UP to distribute train movements directionally
over parallel routes, thus increasing capacity.
Figure 19 shows the Laredo to Dallas corridor which includes Interstate 35 and the UP
rail lines.

Texas Transportation Institute 50 Multimodal Freight Transportation Programs
Figure 19. Laredo to Dallas Corridor.
For the corridor, Interstate 35 is designated as National Highway System High-Priority
Corridor 23, and between San Antonio and Dallas-Fort Worth is designated as part of the South
Central High-Speed Rail Corridor. The Trans Texas Corridor plan indicates a priority corridor
paralleling Interstate 35 from the Texas-Oklahoma border north of Dallas to the San Antonio
area before extending south to the Texas-Mexico border.
Highway Characteristics
The FHWA Freight Analysis Framework data provide information related to segment
properties, average daily traffic levels, volume-to-capacity levels, and average daily truck levels.
Table 7 shows that 58.5 percent of the corridor resides in rural portions of the state, while the
remaining portions reside in small or large urban areas. The segment from San Antonio to
Hillsboro, where Interstate 35 splits with branches to Fort Worth and Dallas, is substantially
urban (61 percent) in nature compared with other segments.

Texas Transportation Institute 51 Multimodal Freight Transportation Programs
Table 7. Laredo to Dallas Corridor Mileage Analysis.
Corridor Segment Total Large Urban Percent Small
Urban Percent Rural Percent
I35 Laredo-SA 153.3 23.0 15.0 0.0 0.0 130.3 85.0 I35 SA-Hillsboro 214.3 86.0 40.1 45.3 21.2 83.0 38.7 I35E Hillsboro-Dallas 47.3 6.5 13.8 11.3 23.8 29.5 62.4 Total 414.9 115.5 27.8 56.6 13.6 242.8 58.5 Large Urban = 50,000 or greater; Small Urban = 5,000-49,999; SA – San Antonio
The urban influences along the Interstate 35 segment north of San Antonio is reflected in
the total traffic volumes displayed in Table 8, which is three times more than the Laredo to San
Antonio segment and over twice as much as the Hillsboro to Dallas segment. The traffic
volumes are not expected to approach the capacity levels over the entire corridor until 2020
mostly because of the inclusion of Laredo to San Antonio segment. The San Antonio to
Hillsboro segment was approaching capacity in 1998 and is expected to reach a volume-to-
capacity ratio of 1.47 in 2020. The most northern segment’s volume-to-capacity ratio is
projected to be 1.05 in 2020.
Table 8. Laredo to Dallas Corridor Traffic Volumes and Capacity Levels. Average AADT Average V/C Ratio Corridor Segment Segment
Length 1998 2010 2020 1998 2010 2020 I35 Laredo-SA 153.3 28,812 38,882 46,473 0.29 0.41 0.49 I35 SA-Hillsboro 214.3 96,706 125,171 142,460 0.98 1.31 1.47 I35E Hillsboro-Dallas 47.3 42,933 56,307 65,266 0.67 0.91 1.05 Total 414.9 56,150 73,454 84,733 0.65 0.87 1.00 AADT – Average annual daily traffic; V/C Ratio – Volume-to-Capacity Ratio
Two forms of truck traffic along the corridor are presented in Table 9. The first set of
values represents the average average annual daily truck traffic (AADTT) for each segment and
the entire corridor. In 1998 the San Antonio to Hillsboro segment experienced the greatest level
of trucks with over 8700 daily, while the Laredo to San Antonio segment had 4100 trucks per
day. The projected values result in similar truck levels over the entire corridor. The Hillsboro to
Dallas segment is projected to experience the greatest levels with almost 13,000 trucks per day.
The Laredo to San Antonio segment is projected to grow to 9900 trucks per day.

Texas Transportation Institute 52 Multimodal Freight Transportation Programs
Table 9. Laredo to Dallas Corridor Truck Volumes. Average AADTT Average FAF Corridor Segment Segment
Length 1998 2010 2020 1998 2010 2020 I35 Laredo-SA 153.3 4,182 7,355 9,904 2,830 5,453 7,424 I35 SA-Hillsboro 214.3 8,726 12,551 11,830 6,040 8,772 6,903 I35E Hillsboro-Dallas 47.3 7,613 11,095 12,823 4,462 6,664 7,045 Total 414.9 6,840 10,333 11,519 4,444 6,963 7,124 AADTT – Average annual daily truck traffic = all trucking units; FAF – Freight Analysis Framework truck traffic = 60,000-80,000 lb. units only
Also shown in Table 9 are the FAF truck volumes. This model-generated number
represents the number of daily 60,000-80,000 pound truck units along the segment. These values
are expected to significantly grow in the Laredo to San Antonio segment from 2800 trucks in
1998 to 7400 trucks per day in 2020. Over the entire corridor the FAF truck levels are expected
to average 7100 trucks per day in 2020.
The Interstate 35 corridor is a significant player in NAFTA-related truck movements.
According to the TxDOT report Effect of NAFTA on the Texas Highway System Interstate 35
carries 31.6 percent of all NAFTA trucks (44).
Rail Route Characteristics
Union Pacific Railroad operates the rail corridor between Laredo and Dallas. The
150-mile route segment from Laredo to San Antonio is a single mainline, while the route from
San Antonio to Dallas consists of two separate rail line routes utilizing directional running.
From San Antonio, northbound shipments travel over a distance of approximately 310 miles
through San Marcos, Austin, Waco, and Fort Worth before reaching Dallas. The southbound
shipments from Dallas travel over a distance of approximately 335 miles through Corsicana,
Hearne, Smithville, and San Marcos. An additional southbound route travels to Flatonia, where
trains connect to UP’s heavily traveled Sunset Route over to San Antonio.
The stretch between San Antonio and San Marcos consists of two separate parallel lines:
one formerly owned by Missouri Pacific Railroad (MP) and the other formerly owned by the
Missouri Kansas Texas Railroad (MKT). Restored operations over the MKT line occurred in
1998 when UP spent $15.7 million to rehabilitate the 17 miles between San Marcos and San
Antonio (45). Track improvements over the MP rail line included a $6.8 million project in 2001
for cross tie and rail upgrades from New Braunfels to Austin (46).

Texas Transportation Institute 53 Multimodal Freight Transportation Programs
Union Pacific implemented directional running after the merger with Southern Pacific
over several areas of their network where each entity possessed parallel routes. In addition to
operations between Dallas and San Antonio, the major corridor between Laredo, St. Louis, and
Chicago has southbound traffic traveling on the former Southern Pacific route and northbound
trains on the parallel UP route (47). Operating on parallel lines directionally eliminates
oncoming train conflicts and increases operational efficiency.
Union Pacific operates intermodal facilities in Laredo, San Antonio, and Dallas. The
current Laredo facility, Port Laredo, opened in 1990 and handles both railroad operations and
railcar inspections. Union Pacific estimates a $40 million total investment in the Port Laredo
facility since its construction. That value includes initial costs and periodic improvements and
upgrades. The last major improvements to the facility occurred in 2001 and 2002. The
continued growth in international traffic motivated UP to invest $15.8 million to increase
capacity and for facility improvements (48). With all the improvements to the facility since
inception, the Port Laredo facility now consists of:
• six tracks for arriving and departing trains;
• 14 tracks used to sort railcars by destination;
• two tracks, and space under roof, to repair four railcars at a time;
• one track for locomotive fueling and inspection; and
• three tracks for intermodal use (48).
San Antonio intermodal operations exist at two facilities, with the major activities
occurring at the South San Antonio (SoSan) Yard. Prior to the merger, both UP and Southern
Pacific operated intermodal yards. The SoSan Yard was UP’s ramp prior to the merger and
exists near the former Kelly Air Force Base. Southern Pacific intermodal operations were
maintained at the East Yard. For UP, the facilities in San Antonio play a major role in
international movements by handling the staging activities for shipments to and from Mexico.
Despite recent improvements to the SoSan Yard, including the addition of two new departure
tracks and the extension of four yard tracks, UP feels additional capacity improvements and
investment would improve service to the border (49).
Union Pacific operates two intermodal facilities in the Dallas area. The Miller Yard in
Dallas is a 68-acre ramp with six working tracks approximately 1200 feet in length each. This

Texas Transportation Institute 54 Multimodal Freight Transportation Programs
facility performs 14,000 to 15,000 lifts per month values considered at or near capacity (21). It
is an older facility with constrained boundaries limiting future expansion.
The 130-acre Mesquite Yard houses only intermodal and automotive activities. This
relatively new facility, originally constructed in 1980, benefited from a $26 million expansion in
1998 that doubled yard capacity (21). The facility now has four working tracks approximately
5000 feet in length and a state-of-the-art automated gate system.
Laredo to Dallas Enhanced Intermodal Option
The enhanced intermodal service for this 450-mile corridor is a sprint train service by UP
between Laredo and Dallas. The six total trains per day service, three in each direction, would
target both containers and trailers and operate 5000-6000 foot trains with 90 railcars. The
projected infrastructure improvements necessary to implement such a service include upgrades to
the facilities at both ends and the construction of a double track over the 150-mile segment
between Laredo and San Antonio. The total estimated improvement costs are $279 million. The
expected per unit charge is $500-$600.
A service focusing on both trailers and containers with trains between 5000 and 6000 ft.
in length would transport 90 trailers or 180 double-stacked containers per train, assuming full
trains each trip. This would result in the removal of between 540 and 1080 trucks per day along
Interstate 35. Operating 5 days per week, or 260 days per year, the number of trucks removed
ranges between 140,400 and 280,800 trucks annually. Table 10 provides an overview of the
intermodal service from Laredo to Dallas. The economic analysis of this corridor exists in
Chapter 6, including the benefits accrued by the public and private entities.

Texas Transportation Institute 55 Multimodal Freight Transportation Programs
Table 10. Laredo to Dallas Corridor Intermodal Service. Service
• Sprint Train between Laredo and Dallas • 3 trains per day in each direction • 5 days per week
Target • Both Trailers and Containers • 90 cars per train: 90 trailers or 180 double-stack containers per train
Service Cost • $500 to $600 per unit
Infrastructure Improvements • Facility Improvements • Upgrade existing facilities on both ends • $20-$30 million per facility • Rail Line Improvements • Double track between Laredo and San Antonio: $1.5 million per mile at 146 miles is
$219 million • Total Infrastructure Improvements add to $279 million
HOUSTON TO DALLAS CORRIDOR: INTERSTATE 45 – BURLINGTON NORTHERN SANTA FE RAILWAY
Corridor Overview
This corridor links Houston and Dallas, the fourth and eighth largest cities in the U.S.,
respectively. Houston’s proximity to the Texas Gulf Coast makes it a major generator of
international freight traveling through the Port of Houston. The Houston area contains a high
concentration of petrochemical and manufacturing industries. Dallas represents a major
generator of freight, both inbound and outbound. It is often referred to as an “inland port” for its
attraction of international goods, which then disperse throughout the U.S. Dallas’ geographic
location also contributes to its role in transcontinental shipments.
This multimodal corridor linking Houston and Dallas analyzed for this project consists of
Interstate 45 and the BNSF Teague line, as shown in Figure 20. The BNSF route consists of a
single direct line that parallels Interstate 45, although not closely. Mostly rural along most of the
route once outside Houston’s suburban growth, Interstate 45 between Dallas and Houston is a
vital freight movement connection. As one of the legs of the Texas Triangle, along with the
Houston-San Antonio and Dallas-Fort Worth-San Antonio routes, Interstate 45 represents one of

Texas Transportation Institute 56 Multimodal Freight Transportation Programs
the most used highways in Texas for truck movements. Perhaps because of this, the Trans Texas
Corridor Plan designates the corridor as high priority.
Figure 20. Houston to Dallas Corridor.
Highway Characteristics
Interstate 45 travels approximately 225 miles between Houston and Dallas. Of this,
73 percent of the corridor is rural, 14 percent resides in populated areas between 5000 and
49,999, and the remaining 13 percent passes through large urban areas, as displayed in Table 11.
These small urban areas are Conroe, Huntsville, Corsicana, and Ennis. The estimated travel time
over the segment is four hours.
Table 11. Houston to Dallas Corridor Mileage Analysis.
Corridor Segment Total Large Urban Percent Small
Urban Percent Rural Percent
I45 Houston to Dallas 227.8 30.5 13.4 31.6 13.9 165.7 72.8 Large Urban = 50,000 or greater; Small Urban = 5,000-49,999

Texas Transportation Institute 57 Multimodal Freight Transportation Programs
Table 12 shows the average daily traffic levels and average volume-to-capacity ratio for
the entire Interstate 45 corridor. Conditions for the base 1998 year indicate the roadway is below
capacity with daily traffic of 75,000 vehicles. These levels will increase to over 109,000 daily
vehicles in 2020, creating oversaturated conditions.
Table 12. Houston to Dallas Corridor Traffic Volumes and Capacity Levels. Average AADT Average V/C Ratio Corridor Segment Segment
Length 1998 2010 2020 1998 2010 2020 I45 Houston to Dallas 227.8 75,602 96,206 109,555 0.78 1.00 1.12 AADT – Average annual daily traffic; V/C Ratio – Volume-to-Capacity Ratio
Table 13 shows the truck levels along the entire Interstate 45 corridor for 1998, 2010, and
2020. The average AADTT numbers represent the number of all trucks on the corridor, which is
projected to increase from 9400 in 1998 to 11,500 in 2020. The average FAF truck volumes
represent the number of 60,000 to 80,000-pound trucks on the corridor. This model-generated
number is projected to experience moderate growth from 1998 to 2020.
Table 13. Houston to Dallas Corridor Truck Volumes. Average AADTT Average FAF Corridor Segment Segment
Length 1998 2010 2020 1998 2010 2020 I45 Houston to Dallas 227.8 9,467 11,549 11,360 7,658 9,004 8,041 AADTT – Average annual daily truck traffic = all trucking units; FAF – Freight Analysis Framework truck traffic = 60,000-80,000 lb. units only
The Interstate 45 corridor is not a major player in NAFTA-related traffic. According to
the TxDOT Effect of NAFTA on the Texas Highway System report, only 0.1 percent of NAFTA
truck movements travel along Interstate 45 (44).
Rail Route Characteristics
BNSF operations between Houston and Dallas-Fort Worth utilize two different routes:
the Teague line from North Houston to Dallas and the Temple line from South Houston through
Temple to Fort Worth. The most significant rail operations in the Dallas-Fort Worth area occur
in Fort Worth at the Alliance Yard and intermodal facility. The shortest route in terms of

Texas Transportation Institute 58 Multimodal Freight Transportation Programs
distance is the Teague route, which is approximately 245 miles from North Houston to Dallas.
An additional 50 miles are required to reach the Alliance facility. The Temple route departs
Houston on the south side and travels south to Alvin before traveling northwest through Temple
to Alliance. The total trip length from South Houston to Alliance is 350 miles. Despite the
distance advantage, the dominant traffic route between Houston and Dallas-Fort Worth is over
the Temple line, mainly because of track conditions and operational restrictions in the Dallas
area, along a Union Pacific track over which BNSF has trackage rights.
The current maximum operating speed along the Teague line is 40 mph, with some short
sections relegated to speeds as low as 10 mph (50). The estimated travel time from Houston to
Dallas is 7.5 hours, according to BNSF personnel (51). Train control along the route consists of
automatic block signals (ABS) dispatched by track warrant control (TWC).
Traffic along the Teague line consists mainly of coal trains supporting electrical power
plants at both ends, with little traffic destined for locations in the middle segments. Traffic
density in 2002 was between 10 and 19.9 million gross ton-miles per mile (MGTM/Mi) (52).
Current intermodal movements by BNSF between the city pairs exist solely on the
Temple route from the Pearland Intermodal Yard to the Alliance facility north of Fort Worth.
BNSF does own an additional intermodal yard in Houston but is currently leasing it to an
aggregate company. This 70-acre facility is located along UP’s East Belt Subdivision in
northeast Houston near the Pierce Yard, between Settegast and Englewood Yards. It signifies
where Burlington Northern (BN) centered their intermodal operations in Houston prior to the
merger with Atchison Topeka and Santa Fe Railway (ATSF) to form BNSF. Interestingly,
according to the merger application, all BNSF intermodal activity was to be stationed at this
location instead of the Pearland facility. They indicate the facility was in a “very good location
relative to the market” but limited in expansion opportunities (53).
Previous intermodal operations between Houston and Dallas-Fort Worth included a
service by BN as a component of a longer service to and from the Pacific Northwest. The
Teague line was BN’s link between Houston and Dallas-Fort Worth. If excess capacity was
available on the Pacific Northwest-Houston train, then intermodal units originating or
terminating in Dallas-Fort Worth would be added to the train. According to BNSF personnel,
the Dallas-Fort Worth-Houston demand was greater than the excess train capacity, but it was too
costly to run additional trains just to serve that market (54).

Texas Transportation Institute 59 Multimodal Freight Transportation Programs
Houston to Dallas Enhanced Intermodal Option
The intermodal service between Houston and Dallas by BNSF is a dedicated short-haul
service focusing on reinforced and non-reinforced trailers or containers on chassis. The initial
service level involves two trains per day in each direction, with each train capable of transporting
a maximum of 120 units. Initial traffic levels are for each train to transport 85 trailers.
Anticipated annual levels are 88,802 trailers in the first year and 131,056 trailers in the tenth
year, with growth capped at year 10. BNSF plans to work directly with trucking companies in a
partnership, where the trucking company would provide the transportation to and from the
intermodal yard and BNSF would provide the line-haul portion of the trip. Operating five days a
week, the service will include a morning service and an evening service, each taking nine hours
ramp-to-ramp.
This dedicated service requires a total infrastructure and equipment investment of
$100.5 million. Infrastructure costs include line upgrades, which will improve speeds and reduce
transit times from 7.4 hours to 5.0 hours. The existing former BN intermodal hub will act as the
staging facility in Houston, while the Dallas area requires a new facility. The equipment costs
include the eight dedicated locomotives and 104 dedicated “long runner” railcars capable of
transporting up to three 57-ft trailers per car.
Table 14 provides details and costs of the BNSF intermodal service between Houston and
Dallas. An economic analysis of this corridor also exists in Chapter 6, including the benefits
accrued by the public and private entities.

Texas Transportation Institute 60 Multimodal Freight Transportation Programs
Table 14. Houston to Dallas Corridor Intermodal Service. Service
• Dedicated short-haul intermodal service between Houston and Dallas • Direct partnership with trucking companies • 2 trains per day in each direction – morning and evening service • 9 hours ramp-to-ramp • 5 days per week
Target • Trailers and containers on chassis • Initial levels: 85 trailers per train • Projected annual levels: 88,802 units in year 1; capped after 10 years at 131,056 units
Infrastructure Improvements and Equipment Costs • Facility Construction/Improvements – $38.5 million • New facility in Dallas – $21 million • 32 acres • 7000-ft strip track & 8000-ft storage track • 200 parking spaces • 3 lift devices • Upgrade existing facility in Houston at former BN Intermodal Hub – $17.5 million • Rail Line Improvements – $33.8 million • Increase speeds from 40 mph to 60 mph, which will reduce transit times from 7.4 hours
to 5 hours • Equipment Costs – $28.2 million • 8 dedicated locomotives • 104 dedicated “long runner” railcars – capable of transporting up to three 57-ft trailers on
one railcar • Total Infrastructure and Equipment Costs – $100.5 million
EL PASO TO DALLAS CORRIDOR: INTERSTATE 10-INTERSTATE 20 – UNION PACIFIC RAILROAD
Corridor Overview
This corridor captures significant levels of transcontinental traffic from Los Angeles to
the Midwest and East Coast and international traffic to and from El Paso. The highway portion
consists of Interstate 10 from El Paso east to Kent, where Interstate 20 forms and bears northeast
to Fort Worth and Dallas. Predominantly located in rural parts of Texas, the notably sized cities
of Odessa, Midland, and Abilene reside along the route.
The UP rail line navigates the entire corridor, closely paralleling the highway segment.
Composed of the Sunset Route from El Paso to Sierra Blanca and the Texas and Pacific (T&P)

Texas Transportation Institute 61 Multimodal Freight Transportation Programs
line from Sierra Blanca to Fort Worth and Dallas, this line forms the central segment of the vital
transcontinental operations from California to Memphis. The highway route also represents a
major component of the cross-country movements between the West Coast and Texas and the
Southeastern U.S. Figure 21 shows the El Paso to Dallas corridor.
Figure 21. El Paso to Dallas Corridor.
Highway Characteristics
The El Paso to Dallas corridor runs approximately 640 miles between El Paso and Dallas
along Interstate 10 east to Kent and Interstate 20 to Fort Worth and Dallas. The corridor is
mostly rural in nature, with the notable small urban areas consisting of Big Spring and
Sweetwater. The large urban communities with populations over 50,000 include El Paso,
Odessa, Midland, Abilene, Fort Worth, and Dallas. Table 15 displays the mileage breakdown by
small and large urban and rural areas, which make up 80 percent of the route.
Table 15. El Paso to Dallas Corridor Mileage Analysis.
Corridor Segment Total Large Urban Percent Small Urban Percent Rural PercentI10 EP-Kent 173.0 21.0 12.2 1.1 0.6 150.9 87.2 I20 Kent-FW 468.0 80.3 17.2 23.4 5.0 364.4 77.9 Total 641.1 101.3 15.8 24.4 3.8 515.3 80.4 Large Urban = 50,000 or greater; Small Urban = 5,000-49,999; EP – El Paso; FW – Fort Worth
Total vehicular traffic is displayed in Table 16. The traffic level over the entire corridor
is projected to grow significantly from 66,000 in 1998 to 99,000 in 2020, according to
projections. The El Paso to Kent segment experiences the highest traffic levels; however,

Texas Transportation Institute 62 Multimodal Freight Transportation Programs
capacity is more of a concern over the Kent to Dallas segment. The volume-to-capacity ratio for
that segment was near capacity in 1998 and is expected to exceed capacity levels by 2010 and
reach a ratio of 1.48 in 2020. The Interstate 10 segment will reach 1.00 in 2010 and will exceed
capacity by 2020.
Table 16. El Paso to Dallas Corridor Traffic Volumes and Capacity Levels. Average AADT Average V/C Ratio Corridor Segment Segment
Length 1998 2010 2020 1998 2010 2020 I10 EP-Kent 173.0 91,980 117,048 136,766 0.76 1.00 1.18 I20 Kent-FW 468.0 40,274 52,601 61,662 0.94 1.26 1.48 Total 641.1 66,127 84,825 99,214 0.85 1.13 1.33 AADT – Average annual daily traffic; V/C Ratio – Volume-to-Capacity Ratio; EP – El Paso; FW – Fort Worth
The truck levels along the El Paso to Dallas corridor are expected to grow by 64 percent
from the 1998 levels to 2020, as shown in Table 17. The Interstate 10 segment experiences
higher overall truck levels, but the average FAF truck levels are projected to be higher along the
Interstate 20 segment.
Table 17. El Paso to Dallas Corridor Truck Volumes. Average AADTT Average FAF Corridor Segment Segment
Length 1998 2010 2020 1998 2010 2020 I10 EP-Kent 173.0 8,174 9,772 12,334 4,287 4,304 5,204 I20 Kent-FW 468.0 4,629 6,973 8,738 3,281 5,078 6,267 Total 641.1 6,402 8,372 10,536 3,784 4,691 5,735 AADTT – Average annual daily truck traffic = all trucking units; FAF – Freight Analysis Framework truck traffic = 60,000-80,000 lb. units only EP – El Paso; FW – Fort Worth
According to the Effect of NAFTA on the Texas Highway System both Interstate 10 and
Interstate 20 are significant passageways for NAFTA truck traffic. Interstate 10 carries
17.3 percent of all the NAFTA trucks and Interstate 20 carries 8.5 percent of all the NAFTA
trucks (44).
Rail Route Characteristics
The acquisition of the T&P line during the merger with Southern Pacific and the
infrastructure improvements undertaken afterward have greatly improved UP’s system

Texas Transportation Institute 63 Multimodal Freight Transportation Programs
operations. The route from Los Angeles to Dallas is now 233 miles shorter than the former
Southern Pacific route and 999 miles shorter than the former UP route (55). This improvement
in system operations allows UP to battle for the vital long-haul traffic from the West Coast to
Texas, Memphis, and the Eastern U.S. Figure 22 shows the pre- and post-merger UP and SP
routes and also the competing BNSF routes.
Figure 22. West Coast – South Central-Southeast Route Efficiencies Gained from Union Pacific Merger with Southern Pacific (55).
The Texas route closely parallels the highway from El Paso to Fort Worth: the Sunset
Route along Interstate 10 from El Paso to Sierra Blanca and the T&P line along Interstate 20
from Sierra Blanca to Fort Worth. The entire rail segment from El Paso to Dallas is
approximately 640 miles. There are intermodal facilities at both ends of the route. The El Paso
yard primarily serves international traffic between Mexico and the U.S. and has a reported lift
capacity of 96,000 lifts (56). Additional yard services are also available in El Paso at several UP
yard locations. As previously stated, the Dallas-Fort Worth area intermodal facilities reside at
Miller and Mesquite Yards.
Union Pacific identified this route as critical to their transcontinental operations of
intermodal traffic from California to Memphis, where the shipments interchanged with one of the
eastern railroads. Not only did the distance decrease to Dallas from California, but the entire
route to Memphis is now 283 miles shorter compared to the former Southern Pacific route and
580 miles shorter compared to the former UP route (55). According to UP’s Third Annual
Report on Merger and Condition Implementation, $106.6 million of an estimated $125.4 million

Texas Transportation Institute 64 Multimodal Freight Transportation Programs
was spent on the T&P line between Fort Worth and El Paso to increase speed and capacity (57).
These upgrades were necessary to implement the direct route from El Paso to Fort Worth via the
T&P line versus moving traffic along the Sunset Route over to San Antonio and up to the Dallas-
Fort Worth area.
In the August 2002 edition of Trains Magazine, an article described the T&P line from
Fort Worth to El Paso (58). The vision of the line, as stated in the article, has always been to
develop a highly competitive transcontinental route that will dominate both railroad and truck
competition. In order to achieve this goal and to overcome the historic lack of maintenance and
capital toward the line, UP has implemented several infrastructure and operational improvement
strategies.
The three major infrastructure improvements focused on siding lengths and locations,
signal systems, and track conditions. The major emphasis on sidings occurred over the 160-mile
segment between Monahans and Sierra Blanca where UP installed six new sidings. The spacing
between the existing sidings included 57 miles from Monahans to Toyah, 43 miles from Toyah
to Boracho, and 60 miles from Boracho to Sierra Blanca, but the additional sidings reduced the
average spacing between sidings to 20 miles (58).
Union Pacific also addressed improvements with the signaling. Current train control
along the route consists of the following:
• Fort Worth to Clyde – Centralized Traffic Control;
• Clyde to Sierra Blanca – Automatic Block Signals dispatched by Track Warrant
Control; and
• Sierra Blanca to El Paso – Centralized Traffic Control.
The stretch from Fort Worth to Clyde received CTC in 1957. To improve operations along the
Clyde to Sierra Blanca segment, UP installed six new sidings with “CTC islands” west of
Monahans (58). These islands, along with the siding at Toyah, provide some of the benefits of
CTC operations along the route. The Sierra Blanca to El Paso stretch resides along the heavily
used Sunset Route, which operates under CTC.
The Trains article indicates the rail line between Big Springs and Sierra Blanca was
jointed and had been laid between 1942 and 1945. Recent infrastructure improvements, pre- and
post- merger, included welded rail from Fort Worth to Abilene, from Iatan to Big Springs, from
Sweetwater to Iatan, and between Abilene and Sweetwater. An additional 50-mile section on

Texas Transportation Institute 65 Multimodal Freight Transportation Programs
both sides of Odessa received 136-pound welded rail (58). With these improvements, train
speeds have increased along the route. Union Pacific news releases indicate new operating
speeds of 60 mph through Abilene, Midland, and Odessa (59, 60, 61). Despite the
infrastructure improvements over the T&P line, Frailey in the Trains article points out that 200
miles of aged, jointed rail still exists between Big Spring and Sierra Blanca (58).
Union Pacific now utilizes this route for both trailer and container intermodal services
between the West Coast and Texas or Memphis. The Blue Streak intermodal trailer service
consists of two offerings. One pertains to a service in alliance with Norfolk Southern that
transports trailers between California and Atlanta, with the interchange occurring at Memphis.
This service travels the Los Angeles to Memphis segment in approximately 57 hours, primarily
serving United Parcel Service and Schneider National (58). The other Blue Streak service
connects the Mesquite Yard to the East Los Angeles Yard for westbound movements and the
East Los Angeles Yard to the Marion, Arkansas, intermodal facility, which sits across the
Mississippi River from Memphis (58).
Double-stack container movements connect at Miller Yard in Dallas, at the Marion Yard,
or with Norfolk Southern or CSX in Memphis, Tennessee. The double-stack flow of containers
favors eastbound movements, creating the need to run empty railcars and empty boxes back to
the West Coast.
Total train movements average 11 trains per day along the route, according to the Trains
article (58). Density over that stretch in 2001 was between 20 and 39.9 MGTM/Mi (52).
El Paso to Dallas Enhanced Intermodal Option
The Laredo to Dallas and Houston to Dallas routes consisted of direct inputs from the
railroads for infrastructure costs and service levels. These details provide the necessary inputs
for the economic evaluation in Chapter 6. An economic evaluation is not performed for this
corridor. Provided the detailed information related to equipment costs, terminal and
infrastructure costs, service levels, and shipping fees, this type of service could be evaluated
utilizing the evaluation tool developed for this project. Although there are examples of such
services around the world, the lack of detailed information specific to requirements of such a
service in the U.S. necessitated the research team to examine this corridor qualitatively.

Texas Transportation Institute 66 Multimodal Freight Transportation Programs
In examining the service for this corridor between El Paso and Dallas, the service
consists of a land ferry intermodal service, in which the entire truck, including tractor, trailer,
and driver, is transported via rail. In order to transport the driver along with the truck, the trains
require business and sleeper cars. Recent efforts by the U.S. railroads to create truck-like
transcontinental intermodal service has led to the examination of including business and sleeper
cars for extra train crew members. One of these trains operated by UP was photographed in a
recent Trains Magazine article, as shown in Figure 23.
Figure 23. Union Pacific’s High-Priority Transcontinental Train Including Business and
Sleeper Cars (62).
In addition to providing the driver accommodations for a land ferry service, there are
several other considerations required for such a service.
• Service Levels – The service must provide highway-competitive transit times and
truck-like reliability. In order to perform at high levels, the service requires
dedicated terminals and dedicated, specialized rail equipment.
• Customer Base – The most critical consideration for this service is for whom the
service is geared. In a service transporting the truck equipment along with the
driver, the most likely scenario is the service targets a component of the total trip.

Texas Transportation Institute 67 Multimodal Freight Transportation Programs
For this particular route, this includes traffic from the West Coast ports traveling
across the country to market centers in the interior, such as Dallas, Memphis, and
markets along the East Coast, such as Atlanta. Also of particular interest is
international traffic to and from El Paso that passes through Dallas headed to the
Midwest or East Coast.
• Highway and Truck Volumes – The El Paso to Dallas corridor is projected to
experience an average of over 10,500 total trucks by 2020 and a volume-to-
capacity ratio of 1.33. With continued traffic growth along the corridor likely
resulting in reduced traveling performance, the corridor provides opportunities to
transfer vehicles to the intermodal service.
• Terminal Locations and Operations – The terminals on both ends must provide
easy access and operate effectively in order for drivers to consider the service. The
high service level requirements greatly depend on the operations within the
terminals, which act as the first and last components of the service.
• Driver and Trucking Company Benefits – Drivers and trucking companies
require the service benefit them in a tangible manner. A land ferry service provides
an opportunity for the drivers to meet their “off duty” rest requirements while the
shipment remains in motion toward the final destination. Financially, this service
reduces the fuel requirements for the 640-mile journey and maintenance costs,
although only slightly.
• Service Fees – The fees need to be minimal or there will be no business. However,
for the service to be self-sufficient it will require enough revenue for the railroads
to cover the significant operational costs and desired profits. The most likely
scenario is a land ferry service would require significant public intervention,
perhaps in terms of a subsidy, in order for the service to be financially feasible, for
both the railroads and the trucking entity.
• Railroad Operations – This service requires dedicated terminals and equipment,
both of which add significant financial burdens on the railroads for operations.
They also require significant up-front investments, which could be shared with the
pubic sector.

Texas Transportation Institute 68 Multimodal Freight Transportation Programs
Table 18 provides an overview of the El Paso to Dallas intermodal service described above.
Table 18. El Paso to Dallas Corridor Intermodal Service. Service
• Dedicated land ferry service between El Paso and Dallas – tractor, trailer, and driver • Business and sleeper cars for truck drivers • Highway-competitive transit times – approximately 10 hours
Target • Trucks traveling completely through Texas along Interstate 20 • International movements to/from El Paso that travel along Interstate 20 • Trucks traveling, at minimum, between El Paso and Dallas
Cost Considerations • Facility costs – dedicated terminals at both ends • Dedicated, highly-specialized rail equipment • Infrastructure improvements along route

Texas Transportation Institute 69 Multimodal Freight Transportation Programs
CHAPTER 6: ECONOMIC ANALYSIS OF INTERMODAL RAIL
The justification for pursuing public-private intermodal ventures within existing rail
corridors should be structured upon the realization of favorable economic returns for each
participating entity. In the case of public entities, economic feasibility is usually based on a cost-
benefit analysis such as net present value or benefit/cost ratio; on the other hand, the private
sector usually selects projects for investment based on a monetary rate of return (63). The
passage of House Bill 3588 (HB 3588) created a new obligation for Texas transportation officials
to examine the economic feasibility of joint ventures, such as those considered in this research,
no longer only in terms of those they represent but also from the perspective of their financial
partners. As a result, both cost-benefit analyses and corporate rates of return were considered in
the preparation of this project.
The following sections present the basic theory and economic evaluation framework
upon which this approach is constructed. However, it should be noted that the results presented
herein are intended only to demonstrate the recommended methodology for evaluating the
economics of these projects, and not to actually recommend the implementation or rejection of
funding for the examples shown. This work does, however, show a way to determine two-party
feasibility and suggests that more extensive development and refinement of the basic economic
model would be of value.
ECONOMIC ANALYSIS FUNDAMENTALS
The Office of Management and Budget recommends the use of cost-benefit analysis in
the evaluation of government projects, whereby net benefits to “society” are the basis for
evaluation (64). While the determination of net societal benefits is part of this analysis, this
research also evaluates net benefits specific to the Texas Department of Transportation in terms
of preserving transportation infrastructure. Of course, performing such an analysis requires the
subjective selection of cost and benefit data that most certainly will be subject to scrutiny,
particularly when both public and private partners contribute to project funding. Therefore, a
method of analysis for this intermodal study was developed to promote an understanding of each
party’s financial constraints and decision-making processes so that a mutually beneficial project
funding strategy can be devised.

Texas Transportation Institute 70 Multimodal Freight Transportation Programs
Need for an Economic Model
Project evaluation of public-private partnerships should incorporate a consensus-building
tool that provides transparency in identifying costs and in determining benefits that may be
realized by each party. For example, a public entity would most likely choose not to partly
finance rail infrastructure improvements that resulted in exorbitant profits for the railroad. On
the other hand, a railroad may choose not to finance capital improvements foreseen as marginally
profitable even if such expenditures would postpone or eliminate the need to construct public
infrastructure. In the first of these cases, overstating costs by the private sector could hide the
potential for large profits in order to attract public funding; in the second, understating the true
public benefits of investing in a rail project could result in a missed opportunity to engage the
help of the private sector. Consequently, this consensus-building tool must not only predict
value to public and private partners with reasonable accuracy, it must also provide transparency
in stated costs and avoided costs (i.e., benefits).
The Economic Model Decisions made by the state concerning public-private partnerships will likely be subject
to greater scrutiny than prior to HB 3588, and it is for this reason that the elementary proof-of-
concept economic model shown in Figure 24 was prepared. Essentially, this model is a
framework for the state to clarify relationships with railroads and describe the effects of
assumptions on costs, benefits, financial requirements, and operating conditions (65). Kenneth
Small describes the best method of disclosure as “one that makes it possible to understand and
justify political decisions that are in the interests of the citizenry at large, while embarrassing
those who would make decisions favoring only narrow interest groups,” and this model should
be a reasonable first step toward that goal (65).

Texas Transportation Institute 71 Multimodal Freight Transportation Programs
Figure 24. Spreadsheet Model for the Economic Analysis of Intermodal Rail. Model Inputs
The spreadsheet model shown in Figure 24 has been color-coded to differentiate between
types of input data. Each input category has been classified according to the frequency at which
the information will likely change. For example, a large number of trial inputs for public
funding is expected as part of an economic analysis, so this category is color-coded red, whereas
unit costs associated with rail or truck transportation are expected to change infrequently, so
these items are color-coded green. Each of the following input data are included in the model:
• Funding levels – total project cost and levels of public financing
• Operating data – data associated with railroad operations as follows:
1. Rail corridor operations
o discount rate (for public investments)
o internal corporate interest rate (for project financing)

Texas Transportation Institute 72 Multimodal Freight Transportation Programs
o corporate tax rate
o trains per day
o truck trailers or containers per train
o operating days per year
o shipping fee
o shipping distance (corridor length)
2. Train operating conditions
o railcar tare weight
o truck trailer or container weight
o number of trailers or containers per railcar
o locomotive weight
o locomotives per train
• Cost data – operating costs associated with the movement of freight as follows:
1. Rail transportation
o railcar maintenance cost per mile
o locomotive maintenance cost per mile
o fuel cost per ton-mile
o train crew costs (two personnel per locomotive)
o number of train crews per corridor trip (based on 8-hour work day)
2. Truck transportation
o societal costs (roadway congestion, automobile collisions, and pollution)
o infrastructure costs (roadway damage minus fuel tax revenue)
• Corridor Characteristics – traffic mix and population densities along corridor
Even though railroad unit operating costs have remained consistent throughout recent
time, these values were confirmed by recent literature (66). Also, truck unit operating costs from
the 1997 Federal Cost Allocation Study and 2000 addendum were used to calculate social and
infrastructure cost reductions – that is, benefits of diverting trucks to rail – in the economic
model (67, 16). These parameters are defined below:
• pavement cost – cost of repairing pavement deterioration;
• congestion cost – value of additional travel time due to small increments of traffic;

Texas Transportation Institute 73 Multimodal Freight Transportation Programs
• collision cost – medical costs, property damage, lost productivity, and pain and
suffering associated with highway crashes;
• air pollution cost – cost of premature death and illness due to vehicular emissions;
and
• noise pollution cost – change in value of adjacent properties caused by motor-
related noise.
Of these parameters, the economic model includes separate computations of public well
being for 1) TxDOT, where only reductions in pavement damage are considered, and 2) general
society, where all other avoided costs are considered. Also, reducing truck trips will impose a
cost to TxDOT in the form of lost fuel tax revenue; namely, the $0.20 per gallon state tax and the
state’s 87.4 percent share of the $0.21 per gallon federal tax. Therefore, assuming an average
truck fuel efficiency of 5 miles per gallon, a cost to TxDOT of [$0.20/gal + 0.874($0.21/gal)] /
5 miles/gal = $0.0767/mile is included in the TxDOT computations.
As shown in Figure 24, the FHWA has established separate marginal costs for
60,000-pound and 80,000-pound trucks traveling through both rural and urban areas –
distinctions were made between these areas using a threshold of 50,000 persons as defined by the
Bureau of Transportation Statistics (68). The traffic mix factors, which can be adjusted as
“corridor characteristics” features, take into account these differences in marginal costs for rural
and urban areas.
The FHWA has also prepared a report on trucking industry costs titled Expenses Per Mile
for the Motor Carrier Industry (4). This reports that motor carrier expenses have ranged from
$1.34 to $1.51 per mile during the last decade, subject to fluctuations in the price of diesel fuel,
and are expected to increase by $0.05 - $0.06 by 2005. Consequently, any shipping fee charged
by a railroad to transport trucks through an intermodal corridor will need to set rates well below
this cost in order to entice the trucking industry to use rail service – for this study, researchers
assumed a shipping fee of $1.00 per truck-mile.
Input Uncertainty and Risk. Perhaps most important among cost and benefit issues is
the degree of certainty with which these parameters are used in the economic model. New rail
trackage is, for practical purposes, an irreversible capital expenditure that will obligate funds to
untested intermodal projects, so an understanding of the variability in expected capital and

Texas Transportation Institute 74 Multimodal Freight Transportation Programs
operating expenses is needed (65). Flyvbjerg et al. noted that among all public transportation
projects, rail projects incur the highest difference between the actual cost and the cost estimate
that led to the decision to build (69). Even though intercity rail projects were only a portion of
this data and while upgrades to existing freight rail corridors are arguably of lower risk, the
uncertainty of cost data in the economic model should be recognized.
In terms of benefits, the ability to divert trucks from the roadway to the intermodal
corridor is, at this point, speculative. Moreover, the greatest risk to achieving the expected
benefits from an intermodal project may lie within planning decisions made by TxDOT with
regard to the Trans Texas Corridor. For example, Figure 25 diagrams a scenario where there is a
50 percent probability that a portion of the Trans Texas Corridor, expected to contain rail
infrastructure, is built near a candidate intermodal corridor. Furthermore, the scenario assumes
there is a 50 percent probability that the candidate intermodal track itself would become the rail
portion of the Trans Texas Corridor. Based on these assumptions, Figure 25 shows that there is a
75 percent probability of no competing rail infrastructure and, therefore, a 75 percent chance of
project success since the benefits associated with revenues and truck diversions will be as
expected – of course, there will also be uncertainty in the benefit parameters themselves, so the
means of projecting revenues and truck diversions should be done with great care.

Texas Transportation Institute 75 Multimodal Freight Transportation Programs
Figure 25. Example of Intermodal Rail Project Success with Regard to Planning for the Trans Texas Corridor.
Model Outputs
The outputs, or “financials,” for the spreadsheet model shown in Figure 24 are
computations of net present value (NPV), which is a method of cost-benefit analysis that
“discounts” a stream of projected annual costs and benefits to a present value of net benefits
(70). This method can be expressed by the formula in Equation 1, showing that project costs are
subtracted from project benefits in each of the years in which they are incurred and then
discounted back to a present value. Since society places less value on benefits and costs that
occur farther into the future, a discount rate, d, is selected that accounts for society’s willingness
to trade off future benefits and costs (60).
nnn
ttt
dCB
dCB
dCB
dCB
NPV)1()1(
...)1()1( 1
11000
+−
++−
+++−
++−
=’ (Eq. 1)
where NPV = net present value, Ct = dollar value of costs incurred at time t,
DecisionMade ToInvest In
IntermodalProject Probability that the
Trans Texas Corridor
is built = 50%
Probability that th
e
Trans Texas C
orridor
is not built =
50%
Probability of the intermodal
track becoming part of the
Trans Texas Corridor = 50%
Probability of the intermodal
track not becoming part of the
Trans Texas Corridor = 50%
Probability of competing rail infrastructure = 0%
Probability of competing rail infrastructure = 25%
Probability of competing rail infrastructure = 0%
Summary
Probability of project success = 75%Probability of project failure = 25%

Texas Transportation Institute 76 Multimodal Freight Transportation Programs
Bt = dollar value of benefits incurred at time t, d = discount rate, and n = life of the project in years.
The economic model in Figure 24 calculates an internal rate of return (the discount rate at
which the NPV is zero) to the investing railroad to determine how they may benefit from the
proposed projects. Since a corporation’s cost of capital represents an opportunity cost equal to
the return that could have been earned on a similar alternative investment, the returns on an
intermodal project must meet or exceed this rate. If the risk of investing in this project is
foreseen as being greater than the risk of investing elsewhere, then the corporation will likely
include a risk premium on the required rate of return (71). This risk premium may be largely
subjective, based on management’s perception of risk and knowledge of the transportation
industry, and may be, say, only two percent for a low-risk investment but 20 percent for a high-
risk investment. Most certainly, the railroad’s perception of risk will consider the structure of
the agreement between themselves and the public. Therefore, when using the model’s calculated
rate of return to judge whether a railroad might be willing to participate in a project, one must
understand that this rate must at least equal the internal corporate interest rate and will likely
exceed that amount.
The discount rate for public sector NPV calculations in this work was based on the 2003
real discount rates published by the Office of Management and Budget (OMB) in OMB Circular
A-94: Guidelines and Discount Rates for Benefit-Cost Analysis of Federal Programs, as shown
in Table 19 (64). This document recommends that the analysis of projects with terms different
than those shown in Table 19 use linear interpolation to determine the appropriate interest rate.
With the shortest service life of typical rail infrastructure components being approximately 25
years (i.e., signaling and communications), this research assumes a 25-year investment period
and, correspondingly, a discount rate of 3.025 percent.
Table 19. OMB Real Discount Rates for 2003.
Program Life (Years) Discount Rate (Percent) 3 1.6 5 1.9 7 2.2 10 2.5 30 3.2

Texas Transportation Institute 77 Multimodal Freight Transportation Programs
Output Uncertainty and Risk. Just as with projects documented long ago by Krutilla
and Eckstein, where waterway and irrigation projects were promoted by using unrealistically low
discount rates, the intentional selection of an inappropriate rate can also introduce hidden bias
into what might be an otherwise objective analysis of intermodal rail projects (72). Even more, a
truly honest appraisal of the discount rate can be challenging. As explained by Small, the
willingness to trade off future benefits and costs could easily be identified if a single stable
market interest rate prevailed throughout the economy; however, differences in income taxes and
the incompleteness of markets create a need for considerable judgment in setting rates (65). For
this reason, the Office of Management and Budget provides uniformity in the use of discount
rates for public investments by establishing those rates shown in Table 19.
Regardless of discount rate uniformity, project evaluations are still affected by the year in
which the evaluations occur. Table 20 shows how dynamic economic conditions have changed
OMB discount rates from 2002 to 2003 where rates have decreased by at least 0.5 percent. In
consideration of this, the use of the economic model shown in Figure 24 should be accompanied
by a sensitivity analysis to determine how changes in discount rates affect project feasibility
(65).
Table 20. Changes in OMB Real Discount Rates between 2002 and 2003. Program Life
(Years) 2002 Discount Rate
(Percent) 2003 Discount Rate
(Percent) Change
(Percent) 3 2.1 1.6 -0.5 5 2.8 1.9 -0.9 7 3.0 2.2 -0.8 10 3.1 2.5 -0.6 30 3.9 3.2 -0.7
Recommended Approach to Economic Modeling
A close examination of Equation 1 reveals that small differences in the discount rate
(e.g., Table 20) can have a significant impact on the economic analysis because net benefits in
any given year are discounted by the factor 1/(1+d)t, which changes exponentially with time. As
a result, projects evaluated over large time horizons will be susceptible to significant changes in
outcome with small adjustments in the chosen discount rate. For example, if a project is
anticipated to produce net benefits of $11 million in the 30th year, then, according to Table 20,
this value would be discounted by 1/(1+0.039)30 = 0.3173 if calculated using the 2002 rate and

Texas Transportation Institute 78 Multimodal Freight Transportation Programs
by 1/(1+0.032)30 = 0.3887 if calculated using the 2003 rate. In other words, contributions to the
NPV from net benefits received in the 30th year would differ by $784,000, depending on which
rate was used.
Considering the major uncertainties identified as being important in intermodal rail
feasibility studies, such as anticipated costs and benefits, possible competition from the Trans
Texas Corridor, and selecting a representative discount rate, it is recommended that the
following guidelines proposed by Pickrell be followed when using the economic model (73):
• require peer review of evaluations,
• limit the time horizon that can be considered,
• require more detailed engineering support of cost estimates, and
• require specific types of sensitivity analysis.
RESULTS FOR SELECTED INTERMODAL CORRIDORS
The economic analysis of short-haul intermodal freight in this research focuses on Union
Pacific Railroad’s Laredo to Dallas corridor and Burlington Northern Santa Fe Railway’s
Houston to Dallas corridor. Some general cost and operating data acquired from these
companies for their respective corridors are as follows:
• UP’s Laredo to Dallas Corridor
• Project Cost = $279 million
• Corridor Length = 450 miles
• Intermodal Service = 6 trains/day with 90 trailers/train
• BNSF’s Houston to Dallas Corridor
• Project Cost = $100 million
• Corridor Length = 228 miles
• Intermodal Service = 4 trains/day with 85 trailers/train
Researchers used this information in conjunction with other general railroad operating
data to perform separate economic analyses using the model shown in Figure 24.
Evaluation of the Laredo to Dallas Rail Corridor
Figure 26 shows sample input and output values for the economic feasibility of using
Union Pacific’s Laredo to Dallas rail corridor for intermodal freight operations. These particular

Texas Transportation Institute 79 Multimodal Freight Transportation Programs
results are for the case where TxDOT breaks even on an investment of approximately
$62 million – that is, the state also receives $62 million in reduced pavement damage (net of the
fuel tax revenue loss). Union Pacific’s rate of return is shown to be 12.2 percent for this case,
which is greater than the assumed internal corporate interest rate of 6.50 percent, indicating that
this could be an attractive corporate investment to the railroad.
Figure 26. Sample Input and Output Data for the Laredo to Dallas Rail Corridor.

Texas Transportation Institute 80 Multimodal Freight Transportation Programs
Figure 27 shows a plot of economic results for TxDOT and Union Pacific over a range of
TxDOT funding levels. In order to illustrate how such a plot can be used the region where
TxDOT’s NPV is positive and Union Pacific’s Internal Rate of Return (IRR) is greater than 10
percent (an assumed requirement) has been bracketed. This region represents the range of public
funding levels where a compromise may be reached – assuming that all input parameters and
computational methods have been agreed upon following a proper audit.
Figure 27. Public and Private Economic Benefits for the Laredo to Dallas Corridor.
Evaluation of the Houston to Dallas Rail Corridor Figure 28 shows sample input and output values for the economic feasibility of using
Burlington Northern Santa Fe’s Houston to Dallas rail corridor for intermodal freight operations.
Similar to the first analysis, these particular results are for the case where TxDOT breaks even on
an investment of approximately $20 million. As with UP’s Laredo to Dallas corridor, BNSF’s
-150
-125
-100
-75
-50
-25
0
25
50
75
0 50 100 150 200 250
TxDOT Funding ($ Million)
TxD
OT
Net
Pre
sent
Val
ue ($
Milli
on)
0
5
10
15
20
25
30
35
40
UP
Afte
r-Ta
x R
ate
of R
etur
n (%
)
TxDOTNet Present Value
Union PacifcRate of Return
TxDOTNPV > 0
UPIRR > 10%

Texas Transportation Institute 81 Multimodal Freight Transportation Programs
rate of return of 9.3 percent is greater than the assumed internal corporate interest rate of
6.50 percent. This indicates that the economic feasibility of this intermodal corridor, while lower
than that of the Laredo to Dallas corridor, is possible, but could be improved by initiating
changes such as:
• Reducing capital or operating costs
• Securing funding from other public sources
• Increasing the numbers of trucks moved onto rail
The relatively short distance between Houston and Dallas could be a barrier to providing
economically feasible intermodal service along this corridor – that is, if both TxDOT and BNSF
are to gain from the partnership. BNSF’s 228-mile corridor is approximately one-half the length
of UP’s 450-mile Laredo to Dallas corridor, which means that proportionally smaller amounts of
railroad revenue and public benefits will accrue from each transported truck. Also, based on each
railroad’s reported projections of intermodal service, BNSF would haul (4 trains/day)
(85 trailers/train) = 340 trailers/day, whereas UP would haul (6 trains/day) (90 trailers/train) =
540 trailers/day; and this expected 228-trailer/day difference could limit the possibility of shared
economic gains.

Texas Transportation Institute 82 Multimodal Freight Transportation Programs
Figure 28. Sample Input and Output Data for the Houston to Dallas Rail Corridor.
Figure 29 shows a plot of economic results for TxDOT and Burlington Northern Santa Fe
over a range of TxDOT funding levels. Bracketing the boundaries for the example case where
TxDOT’s NPV is positive and BNSF’s IRR is greater than 10 percent demonstrates the difficulty
that would be encountered if the railroad requires a rate of return equal to or greater than this 10

Texas Transportation Institute 83 Multimodal Freight Transportation Programs
percent. As a consequence, a more challenging approach to formulating an agreeable partnership
would be required by the Houston to Dallas corridor than that for the Laredo to Dallas corridor.
Figure 29. Public and Private Economic Benefits for the Houston to Dallas Corridor.
-80
-70
-60
-50
-40
-30
-20
-10
0
10
20
30
0 10 20 30 40 50 60 70 80 90 100
TxDOT Funding ($ Million)
TxD
OT
Net
Pre
sent
Val
ue ($
Mill
ion)
0
10
20
30
40
50
60
70
80
90
100
BN
SF
Afte
r-Tax
Rat
e of
Ret
urn
(%)
TxDOTNet Present Value BNSF
Rate of Return
TxDOTNPV > 0
BNSFIRR > 10%


Texas Transportation Institute 85 Multimodal Freight Transportation Programs
CHAPTER 7: FORMS OF PUBLIC-PRIVATE PARTNERSHIPS AND POTENTIAL APPLICATIONS IN TEXAS FOR ENHANCED
INTERMODAL SERVICE
Coupled with the growth in personal transportation demand, the increases in freight
traffic as a result of the North American Free Trade Agreement and economic globalization are
beginning to have increasingly detrimental impacts on Texas roadways. Public pressure grows
for new or expanded facilities, while at the same time, the cost of maintaining the present system
increases each year. Increased traffic is causing roadways to wear out at an accelerated rate
while becoming more and more congested. State transportation officials have begun to realize
that investing in highway improvements alone will not achieve the desired goals and have begun
to seek private sector partnerships through which public transportation dollars may be leveraged
to achieve the maximum benefits (74). The existing private rail network could be used to move
much of the freight that is now traveling on Texas highways in a manner that could benefit both
the public sector and private railroad companies that own the rail system.
Adding roadway capacity and constructing new toll roads are one way for the public
sector to address demand for transportation infrastructure; however, the case for increased public
reliance on intermodal transportation to assist in mitigating highway congestion is strong. For
increased intermodal movements to take place, both the public sector and the private rail
companies must seek out ways to capitalize upon one another’s strengths. The remainder of this
chapter will describe the possible forms that such a public-private partnership could take,
describe the policy methods through which the state can assist rail companies, and potential
financing methods for public-private partnerships (PPPs) before focusing on the specific makeup
of potential PPPs in Texas based upon new state-level financing tools and political structures
authorized by recent state transportation legislation.
HISTORY OF STATE-RAIL COMPANY PARTNERSHIPS IN TEXAS
Over the last century we have become accustomed to the public sector being almost
solely responsible for designing, financing, constructing, and maintaining transportation
infrastructure—most notably, the highway system. This was not always the case. Rural
cooperatives once built and maintained roadways using volunteer labor, private ferries once
transported people and goods across rivers, and, during its early years as a state when Texas

Texas Transportation Institute 86 Multimodal Freight Transportation Programs
needed to rapidly expand its transportation infrastructure and there was little capital to do so,
state lawmakers turned to the private sector to take on the risks of constructing a rail
transportation system. Consideration of PPPs between governmental entities and private rail
transportation companies is today perceived as a new development, however; partnerships
between the government and private railroad companies were, in fact, the catalyst for
development of most of the rail transportation network in the state and triggered the economic
development, settlement patterns, and population growth that followed. The lure of business
profit, supported by attractive government policies, was used as a tool to bring about private
investment that ultimately provided for the state’s transportation needs.
As far back as the early 1850s, both local and state government encouraged private rail
development through several means (although little progress was made during the American
Civil War period during the early 1860s). Between 1850 and 1876, when the new state
constitution prohibited local governments from doing so, various city and county governments in
Texas passed bond proposals totaling approximately $2.4 million for rail construction (75). At
the state level, support took the form of both state financial loans and public land grants.
Between 1854 and the outbreak of the American Civil War, six different railroad companies
borrowed a total of $1,816,500 from the young state’s Special School Fund at $6000 per mile of
track to be constructed. The railroads repaid these loans to the state, with interest, in the amount
of $4,172,965, a 230 percent increase (75).
The state had limited capital funds to loan but it had millions of acres of public lands, so
it also participated in land grants both before and after the war to stimulate building of new rail
lines. The first state land grants began in the early 1850s, allowing for grants varying between
eight and twenty sections of land for each mile of track constructed at different times during this
period. Grants were stopped for a while by the Constitution of 1869 but began again following
passage of the Constitution of 1876, which standardized railroad land grants at 16 sections per
mile of track constructed. Under this constitutional provision, approximately 35,777,038 acres
were granted to railroad companies, but faulty grants resulted in an actual public grant of
32,157,878 acres to railroad companies by the state (76). These grants were made during a
6 year period between 1876 and 1882, at which time the legislature repealed the land grant law
after realizing that no unappropriated vacant public lands remained available in the state (75).

Texas Transportation Institute 87 Multimodal Freight Transportation Programs
Thus, public land assets encouraged private investment and risk in order to develop a
functioning statewide transportation system, which led to expansion and economic growth. This
program was not without problems, as railroad companies took advantage of the advantageous
policies and many private citizens objected to the magnitude of the lands being granted. In spite
of the excesses and abuses that occurred under the land grant system, the transportation and
economic development needs of the young state were met to the benefit of both the public and
private sectors as a result of the investment of public assets and the power of the private profit
motive.
Today, Texas faces a similar transportation challenge to the one it faced a century and a
half ago. While the problem today is not the nonexistence of transportation infrastructure, the
need to rapidly expand capacity of the existing transportation system during a time of limited
public capital points to the need for the state to once again seek private sector partners. State
transportation officials must look for ways to respond to the rapidly increasing population
growth and increased demand for movement of people and goods through using existing
transportation infrastructure more efficiently. Public investment in and use of existing private
rail networks can potentially alleviate some of the freight burden currently overtaxing the
roadway system and, at the same time, reduce maintenance costs of the publicly funded roadway
network by diverting larger percentages of truck traffic to the rail mode.
It is the responsibility of public agencies and transportation planners to seek
transportation options that represent the best use of public funds. In many cases, investing in
enhanced intermodal infrastructure and services through capital grants or operating subsidies to
railroads for specific services may be that investment. To preclude consideration of such
methods for historical or institutional reasons is both unwise and inefficient. Both the public and
private sectors could potentially benefit from shifting truck freight traffic to intermodal rail/truck
moves, but determining how to formulate effective partnerships between government and private
business to successfully carry this out remains a challenge.
DEFINING PARTNERSHIPS AND PPPS
A partnership is an agreement that is formed between two or more parties to pool their
resources and attain a common goal. Partnerships are formed when one party lacks specific
skills, financial backing, or is not large enough to handle an entire project using only its own

Texas Transportation Institute 88 Multimodal Freight Transportation Programs
assets or strengths. Partnerships can be formed between governments, private companies, public
companies, or individuals in any combination. Partnerships formed between a government entity
and any private entity are referred to as Public-Private Partnerships.
Partnerships, including PPPs, can take many forms, but the key attribute that
differentiates them from other types of agreements is risk sharing between parties. In most types
of contractual agreements, one party agrees to pay another party for services performed
according to a service agreement and the contracting party pays the contractor for services
rendered. In a partnership, the parties that enter into a contract share the risks inherent to the
project. They contribute their resources to the project in exchange for a share of the reward but
are also exposed to the potential losses. The result is that both parties have a vested interest in
the success of the project and will work collaboratively to guarantee success. The exact terms of
the partnership must be negotiated before the work of the partnership begins.
Parties that enter into a partnership are not limited to only providing capital investment.
They can contribute in other ways, such as providing credit worthiness/reduction of project risk,
political support, technical expertise, and specialized equipment or labor. Ideally, all parties in
the partnership are actively involved and bring their strengths or talents to the table to offset the
weaknesses of the other members. In essence, parties to the partnership contribute a certain
amount of value to a project and expect to receive rewards in proportion to the value they have
brought.
Partnerships are easiest to form when the parties involved share common expected results
and measures of success in addition to their goals; however, this is usually not the case.
Partnerships are most difficult to form when, despite a common goal, one party does not
appreciate or give validity to another’s goal. PPPs can be a highly contentious type of
partnership for this very reason. While there is little inherent difference between this type of
partnership and many other types of partnerships, there are significant cultural, philosophical,
and operational differences between public and private entities. These differences are significant
enough that they create very unique conditions that can result in failure if these differences are
not carefully managed and controlled. In order to understand these differences, knowledge of the
various forms that PPPs can take is necessary.

Texas Transportation Institute 89 Multimodal Freight Transportation Programs
Fully FullyPublic ……………………………………… Partnerships….....……………………………….…Private
InfrastructurePublic-Private Partnership Spectrum
Government Public Service Operations Cooperative Lease- Build- Build- Wrap Buy- BuildDepartment Authority Contract and Build- Transfer- (Own-) around Build- Own
Maintenance Operate Operate Operate- Addition Operate Operate(O&M) (LBO) (BTO) Transfer (BBO) (BOO)
Contract (BOT orBOOT)
Public Shared Private Ownership Ownership Ownership
VARIOUS FORMS OF PPPS
In the book Privatization and Public-Private Partnerships, E. S. Savas outlines 11
different forms that PPPs can take in relation to the provision of infrastructure (77). These range
from full public ownership to full private ownership of the facility. In between these two
extremes, various responsibilities and ownership may be shared as shown in Figure 30. As can
be seen, many potential forms for PPPs exist. Examples of several of these can be evidenced in
recent TxDOT projects throughout the state.
Figure 30. Spectrum of Infrastructure Public-Private Partnerships (77). Savas’ eleven forms of PPPs are briefly outlined below:
• Government Department: A government agency owns, designs, finances, builds,
and operates the facility.
• Public Authority: A separate government entity is set up to operate more like a
business to oversee the construction and/or operation of the facility.
• Service Contract: A public agency retains responsibility for ownership and
maintenance of the facility, but contracts out, for a defined period of time, certain
aspects of the operation to a private firm, which is responsible for fulfilling its
functions in order to receive contract payment.

Texas Transportation Institute 90 Multimodal Freight Transportation Programs
• Operations and Maintenance (O&M) Contract or Lease: A private firm
operates and maintains a publicly owned facility through a maintenance contract
that holds the private firm responsible for the facility’s proper operation.
• Cooperative: A non-profit, voluntary, cooperative association takes responsibility,
often in a rural area, where government departments or authorities are not
succeeding in providing needed or desired services.
• Lease-Build-Operate (LBO): A publicly owned facility is leased to a private firm
which makes improvements at its own expense and recoups its investment from
increased operations/activity over the term of the lease.
• Build-Transfer-Operate (BTO): A private firm finances and builds a facility,
transfers ownership to the government once completed, then leases back the facility
in order to operate it and recoup its initial investment plus a reasonable return
during the term of the lease.
• Build-Operate-Transfer (BOT) or Build-Own-Operate-Transfer (BOOT): A
private firm is awarded a franchise or concession to construct, operate, and charge
and collect user fees for a facility for a defined period of time before transferring
ownership of the facility to the public sector.
• Wraparound Addition: A private firm constructs and owns an addition to an
existing public facility that the public cannot afford to improve at the present time
and then operates and collects user fees on the combined facility for a defined
period of time or until costs plus a reasonable return are recovered.
• Buy-Build-Operate: A private firm buys an existing public facility and then
improves or expands it and operates it under a permanent franchise agreement.
• Build-Own-Operate: A private firm finances, constructs, owns, and operates a
facility subject to government regulatory controls on pricing and operations under a
long-term agreement that gives the private firm an incentive to invest its own funds
in the project (77).
Before seeking private partners, public agencies such as TxDOT must select and/or
modify a form of PPP that is acceptable to the state, yet attractive to private rail firms for
creating enhanced intermodal services. In doing so, the department must be sure to safeguard the
public’s investment while at the same time accounting for the private railroad’s desire to earn a

Texas Transportation Institute 91 Multimodal Freight Transportation Programs
reasonable profit. Several tools that expand the types of PPPs available to TxDOT in making its
selection have been recently passed by the 78th Legislature. These will be discussed further in
the section on Texas applications of PPPs later in this chapter.
COMPREHENSIVE RAIL POLICY CONSIDERATIONS
Development of a cooperative atmosphere at the policy level is an important precursor to
direct involvement in a PPP between public agencies and the railroad companies. This helps to
build a framework of common interests among the parties so that conflicts can be more easily
resolved as the project or projects grow in complexity over time. Thus, in addition to
understanding the full range of PPP possibilities that are available, there should be a
comprehensive rail policy framework in place that will help the public agency to preserve,
encourage, and participate in rail transportation projects that are of benefit to the citizens of the
state.
During the literature review for this project, researchers reviewed several compilations of
methods through which public sector agencies can assist private rail firms. As stated previously
in this chapter, the idea of public sector cooperation with and assistance to rail companies is not
new. A 1975 Council of State Governments study, The States and Rural Rail Preservation:
Alternative Strategies, was one of the early documents that explored the role states could play in
preserving rail infrastructure (78). While the federal regulatory framework under which these
recommendations were made has changed considerably, many of the actions that the documents
suggested as ways for state government to assist private rail companies to continue operations
remain relevant.
During the 1970s, states were searching for the proper role that they could play under the
new provisions put into place to deal with the rail crisis in the northeastern part of the U.S. The
study made 19 recommendations to state governments as alternatives available to them in
preserving rural rail service (78). These recommendations fall into four main areas—planning
and legislative, system preservation, funding, and economic development measures as shown in
Table 21.

Texas Transportation Institute 92 Multimodal Freight Transportation Programs
Table 21. 1975 Recommendations to State Governments to Preserve Rural Rail (78).
Area Recommendation Planning/ Legislative
• States should develop a coordinated transportation policy and plan through a centralized agency.
• States should review their existing rail statutes and repeal or modernize antiquated or obsolete sections.
• States should review their existing crew laws for railroads and modify them where merited.
• Contractual agreements between states, shippers, and railroads for rail service should have explicit clauses guaranteeing acceptable levels of performance.
• States should require that railroads operating within the state annually submit their long-range plans for trackage abandonment and service curtailment.
• In the interest of safety and economy, states should reduce the number of railroad grade crossings and bear a larger portion of their maintenance and construction costs.
System Preservation
• States should take an active role in rail abandonment proceedings which affect them.
• States should preserve vital rail links to areas with natural and economic resources which have the potential for future expansion or development.
• States should require that railroads submit annual operating summaries of each line which they operate within the state to justify possible financial assistance.
• Creation of short line railroads with state assistance should be considered only under special circumstances.
• Consideration should be given to state acquisition and subsequent leasing to an operator as a method of preserving rail service.
• Following federal approval to abandon any rail right-of-way, the state must have the first opportunity to acquire the track and property.
Funding • States should consider subsidizing short-term losses incurred on light-density branch lines.
• State financial participation should be a part of any federal branch line subsidy program.
• Under any state subsidy program, if a branch line being subsidized is found to be profitable; those profits should be used to offset other losses of that carrier’s lines within the program.
• States should review, reform, and equalize their railroad taxation practices. • States, in cooperation with local areas, should reduce property taxes where
necessary to preserve and maintain rail service. • States should discourage the use of rail rate surcharges and arbitraries as a
method of subsidizing rail service. Economic Development
• State and railroad industrial development programs should cooperate in locating new industry on economically marginal branch lines.
Individual states adopted several of these recommendations; however, there was no
uniformity in adopting these policy recommendations from one state to another. Other proposals
from the study were incorporated into federal legislation. The federal government created the
requirement that each state develop a state rail plan in the late 1970s and funded state efforts to

Texas Transportation Institute 93 Multimodal Freight Transportation Programs
do so until the mid-1980s. Also, during this time, the federal Local Rail Freight Assistance Act
was in place, which gave limited funds to aid in rail preservation to each state. The Texas
Railroad Commission was designated by the governor at that time to administer Texas’ efforts in
this area since a multimodal TxDOT did not yet exist (TxDOT’s predecessor agency was the
Texas Highway Department).
When federal funding for state-level rail planning stopped during the mid-1980s, the
legislature did not appropriate state funding to continue active rail transportation planning at the
state level or to create a state-level rail funding program. As a result, Texas has not had a recent
history of directly participating in public-private partnerships with railroad companies or funding
rail projects at the state level with the exception of a few individual projects that have been
funded as riders on state appropriations bills. No systematic rail infrastructure program or
funding source has been in place for use by state transportation planners to fill this need. In
recent years TxDOT has begun to include the rail mode in its statewide, overall transportation
planning, but it was not until 2003 that TxDOT was given authority by the 78th Legislature to
build or manage rail infrastructure (79). While some of the recommendations in Table 21 have
been adopted or implemented in the state, many of these measures remain available as options
for either TxDOT or the Texas legislature to encourage rail transportation use and development
in the future. Additionally, TxDOT now has the authority to explore a number of funding
scenarios for rail-oriented PPPs in order to leverage the funds that it now has at its disposal for
rail projects.
Possible State-Rail Public-Private Partnership Strategies
Following the passage of ISTEA in 1991 and its reauthorization through TEA-21 in 1998,
several methods have emerged through which state transportation agencies can enter into PPPs
with private rail firms to fund rail projects. Several of these strategies, along with the pros and
cons of each are listed in the 2003 American Association of State Highway and Transportation
Officials (AASHTO) Standing Committee on Rail Transportation (SCORT) Freight Rail Bottom
Line Report, which was prepared to guide congressional deliberations regarding the
reauthorization of TEA-21 for the FY 2004-FY 2009 period. This list, shown in Table 22,
outlines 14 financing methods through which freight rail-oriented PPPs could potentially

Texas Transportation Institute 94 Multimodal Freight Transportation Programs
participate in intermodal projects. While this list is not exhaustive, it provides a good cross-
section of the types of PPP strategies that are available.
Table 22. AASHTO SCORT Freight Rail PPP Funding Strategies (12). Direct Funding out of Railroad Revenues
Definition: Railroad companies fund improvements out of their own profits for projects beneficial to the public and themselves. Pro: Railroads can make investments where they generate sufficient revenue to repay the investment and serve profitable markets. Con: Limited railroad investment funds; railroads are not earning their cost of capital, making borrowing on the open market more difficult and expensive; railroads cannot afford to invest in lower-profit lines and services; unlikely to invest in projects in order to achieve public benefits.
Rail User Fees or Surcharges Definition: Public money is used to improve existing or build new rail infrastructure and then rail companies are charged user fees at a specified rate developed through a prior agreement (e.g., on a per car or per ton-mile basis) for use of the facilities. Pro: User fees generate revenues to pay back construction bonds financed by the states or special-purpose authorities. The leading successful example is the recently opened Alameda Corridor. Con: Requires stable and increasing volumes of traffic to generate revenue stream. The Alameda Corridor is a relatively unique situation. The corridor serves the high-volume container ports of Long Beach and Los Angeles; other locations may not have sufficiently stable and growing traffic to support user fees. Most manageable when applied to short, well-defined corridors or bridges and tunnels. More difficult to manage when multiple improvements must be made across a network and across a multistate region.
Direct Federal Appropriations and Earmarks Definition: Federal funds are appropriated to a specific rail project, often for a specific use, through Congressional action. Pro: Ensures targeted public investment in rail projects that have significant national, public benefits. Con: Limited funds; requires lengthy public planning and review process; typically entails compliance with federal labor and other laws that are generally unacceptable to the railroads.

Texas Transportation Institute 95 Multimodal Freight Transportation Programs
Table 22. AASHTO SCORT Freight Rail PPP Funding Strategies (continued). Congestion Mitigation and Air Quality (CMAQ) Program Grants
Definition: CMAQ grants are authorized to EPA non-attainment areas for projects that improve air quality within that region. Pro: CMAQ grants have been used to fund transportation improvements that reduce congestion and engine emissions in regions that do not meet national air quality standards. Con: Lack of explicit eligibility for freight rail; limited funding.
Transportation Infrastructure Finance and Innovation Act (TIFIA) Definition: U.S. DOT/federal loan program specifically for major transportation projects (total costs exceeding $100 million). Pro: Provides loans and loan guarantees for large transportation projects. Con: Lack of explicit eligibility for freight-rail and intermodal projects; requires revenue stream to pay back loans; high threshold for project eligibility.
Railroad Rehabilitation and Improvement Finance Program (RRIF) Definition: TEA-21 federal low-interest loan program administered by the Federal Railroad Administration that provides loans to both large and small railroad companies for capital improvements. Pro: Loan program specifically for rail improvements; congressional proposals would significantly expand funding for the program. Con: Limited funding at present; FRA lacks authorization to fund the mandated project credit risk analysis, so few projects have been initiated; funding focuses on investments with private, rather than public benefits; financially constrained railroads unlikely to invest in projects in order to achieve public benefits.
Borders and Corridors Definition: Two, jointly administered, TEA-21 programs that are focused on meeting the transportation corridor needs along the U.S.-Canada and U.S.-Mexico borders and international transportation corridors. Pro: Provides funds to states to plan and develop multistate trade corridors serving international trade gateways. Con: Popular program but over-subscribed with limited funding, much of which has been earmarked to highway projects; rail projects are not explicitly eligible.
Section 130 Grade Crossing Program Definition: Federal funding source, administered by states, for closing unnecessary highway/rail grade crossings or improving safety at highway/rail grade crossings by adding warning devices. Pro: Provides for use of highway funds to eliminate dangerous highway/rail grade crossings or improve existing grade separations. Con: Limited funding available; states and railroads are discussing expansion of the program but have not resolved concerns about assignment of liability for accidents at crossings.

Texas Transportation Institute 96 Multimodal Freight Transportation Programs
Table 22. AASHTO SCORT Freight Rail PPP Funding Strategies (continued). Federal Tax-Credit Bond-Financing Programs
Definition: Funding source under which the federal government would allow private rail companies to take tax credits in an amount proportional to funds that are spent on capital improvements to their rail infrastructure. Pro: Tax credit financing might be used to generate funds for investment in rail infrastructure projects; funds could be distributed as grants, loans, or credit enhancements; could be targeted to specific types of businesses and improvements; does not impact discretionary portion of federal budget. Con: New program not easily understood; numerous details to be worked out; impacts revenue side of the federal budget.
Issuance of Tax-Exempt Debt for Railroad Infrastructure Definition: Federal government would allow private firms (railroad/non-railroad) to purchase tax-exempt debt instruments for funding rail infrastructure and other capital improvements. Pro: Holders of debt would be exempt from tax on interest earned, resulting in reduced cost of funds; could be targeted to specific types of businesses and improvements; debt could be acquired by investors other than railroads; does not impact discretionary portion of federal budget. Con: Will likely require congressional action to increase ceiling on state per-capita debt limit, and to allow tax-exempt debt for private activity; impacts the revenue side of the federal budget.
Use of Rail Share of Gas Tax for Dedicated Railroad Trust Fund Definition: Current federal $0.043 cent per gallon diesel-fuel tax paid by railroads would be devoted to rail use instead of going to the general fund. Pro: Would reallocate $0.043 cent per gallon diesel fuel tax paid currently by the railroads from the general fund to a dedicated railroad trust fund for rail infrastructure projects.
Con: Railroad industry opposes the tax; generates a modest amount of funding ($160 million per year).
State-Based Loans and Infrastructure Banks Definition: State-level funding programs would be created that could be given the flexibility to be used for rail infrastructure. Pro: Would provide states with a mechanism to invest in rail improvements. Con: States require seed money for banks and programs.

Texas Transportation Institute 97 Multimodal Freight Transportation Programs
Table 22. AASHTO SCORT Freight Rail PPP Funding Strategies (continued). Sale of Freight Assets for Rail Passenger Use
Definition: Conversion of existing freight rail facilities or rights-of-way to public for passenger rail purposes in exchange for direct financial payment or improvement to a rail company’s core rail facilities. Pro: Generates cash, in-kind improvements, or state matching funds that states or railroads can use to invest in freight-rail service improvements.
Con: Limited opportunities; primarily in high-density metropolitan rail corridors; states must have sufficient transportation revenues to support purchase of assets or access rights.
Relief from State Property Taxes on Rail Definition: State and local governments would reduce or eliminate property taxes on rail infrastructure in exchange for reinvestment of those monies into rail improvements. Pro: State property taxes on rail were estimated at $453 million in 1999; relief could be coupled with requirements that the funds be dedicated to rail improvements.
Con: Would represent a loss of state revenues that would have to be made up from other taxes or fees.
These examples of funding strategies show that there are many available options to
financing PPPs between state government and a private railroad company; however, in addition
to selecting a form and selecting the proper funding strategy, there are also political and legal
barriers that must be overcome before a PPP can become a reality.
LEGAL AND POLITICAL OBSTACLES TO THE FORMATION OF PPPS
One of the main reasons that PPPs have not been more prevalent in transportation
projects is the variety of political and legal obstacles that both the public and private sectors face
in forming a partnership. Studies performed to identify “challenges” or “barriers” to PPP
formation have generally classified these into four areas—divergent motivation of the
participants, limited resources, real or perceived legal/institutional barriers or unfair competition
concerns among the partners, and evolving agendas at both the public and private institutions
(80). Legal issues that should be evaluated and discussed during partnership formation include
not only those between public and private, but also those that could potentially be problematic
between two different public agencies that may be a part of the same partnership (81). The types
of legal issues that should be addressed in forming a PPP include:

Texas Transportation Institute 98 Multimodal Freight Transportation Programs
• differing statutory interpretations between partners (TEA-21, Clean Air Act
Amendments, NAFTA, etc.);
• jurisdictional disputes;
• conflict of laws at different levels of government/between locations;
• labor compliance (i.e., unionized labor regulations and rules);
• differing land acquisition and capital expenditure procedures;
• federal preemption issues;
• intellectual property rights ownership;
• liability concerns;
• access issues;
• civil rights act/environmental justice issues;
• bonding procedures;
• risk allocation; and
• First Amendment issues (81).
Each of these general issues must be considered along with any other legal issue that might be
unique to the project that is being undertaken. For enhanced intermodal projects such as the ones
examined in this report, the list might also be expanded to include items such as impacts on local
noise ordinances, issues associated with truck traffic generation, and/or community legal
interests.
In addition to legal matters, political barriers to partnership formation also exist. These
can vary from determination of authority over the project between jurisdictions to lack of state or
federal laws that allow certain partnerships to be formed. Many barriers that existed in Texas for
the creation of rail-related PPPs when this project began now no longer exist. HB 3588, adopted
during the regular session of the 78th Texas Legislature (and discussed in more detail below), put
in place several key policies that will now allow TxDOT to work with railroad companies to
improve the rail system of the state, however, several limitations remain. HB 3588 puts an upper
limit of $12.5 million in state and federal funds to be available for rail projects, but provides
several caveats that do not fall under this limit such as federal grants or from bonding programs
such as the Texas Mobility Fund. The state constitutional provision that all funds raised from
highway sources (e.g., state and federal gasoline tax revenues) is restricted to highway use only
remains in place. In the near term, due to the identified needs of the highway system of the state,

Texas Transportation Institute 99 Multimodal Freight Transportation Programs
it is unlikely that this provision will be considered for change to allow for diversion of some of
these monies to other modes such as rail. TxDOT has also interpreted HB 3588 to limit
TxDOT’s participation in rail projects only to those projects in which TxDOT or the state has an
ownership interest (82). This interpretation will, in many ways, define or limit the types of
partnerships that might be available for enhanced intermodal projects. Continued legislative and
political actions will undoubtedly have a great influence on what types of PPPs will be possible
in the state.
APPLICATION OF PPPS IN TEXAS
Up to this point, the broad array of possible PPP forms and funding strategies have been
described. This section of the report will describe how and if recent legislative measures passed
in Texas will limit or expand the choices available within the state. In addition to the general
conclusions concerning this topic, it will also make observations regarding the types of PPPs that
might be applied to the enhanced intermodal scenarios examined in this project.
HB 3588 Provisions
The 78th Texas Legislature passed an omnibus transportation bill, HB 3588, during its
regular session in the spring of 2003. This bill drastically overhauled the way in which TxDOT
approaches its responsibilities for providing and coordinating the use of transportation
infrastructure in the state. Among the many provisions of this bill, several important measures
related to rail infrastructure were included.
Passage of HB 3588 has given TxDOT the authority to build and manage rail
infrastructure or aid local governments on passenger and freight rail projects for the first time,
however it also put in place strict financial restrictions which limit the dollar amounts available
for TxDOT’s investment in rail facilities (79). HB 3588 Article 4 spells out the limits under
which TxDOT may participate in the provision of rail facilities. It specifically gives TxDOT the
authority to acquire, finance, construct, operate, and maintain a rail facility (83). It prohibits
TxDOT from owning railroad rolling stock (i.e., locomotives and/or railcars) and TxDOT
employees from operating trains—requiring instead that TxDOT contract with a private operator
to operate trains over any rail facility owned by the department, but allows TxDOT to maintain
rail facilities either directly or through a private contractor (84).

Texas Transportation Institute 100 Multimodal Freight Transportation Programs
HB 3588 also placed financial restrictions upon the amount of funding that TxDOT may
spend each year upon rail facilities. No more than $12.5 million per year from state and federal
funds may be spent on rail projects, however, this restriction does not apply to funds that are
spent to acquire or construct rail lines on Trans Texas Corridor routes; the acquisition of
abandoned rail lines; funding from bonds, private investment, donations, or grants from the FRA
or the Federal Transit Administration (FTA); or funds spent on grading and bed preparation (85).
These exceptions potentially allow TxDOT’s involvement to significantly exceed the
$12.5 million dollar annual cap from the state highway fund through use of bond programs such
as the Texas Mobility Fund and through leveraging state funds to receive larger amounts through
existing federal loan programs. This gives TxDOT the flexibility to do many different types of
rail projects throughout the state. In relation to this project, it also opens up many possibilities
for structuring PPPs that would not have been possible prior to the passage of this legislation.
PPP PARTICIPANTS AND LIKELY SCENARIOS
While much of this report has evaluated two-party PPPs between TxDOT and a rail
company, there are, in fact, many other potential participants, from both the public and private
sector, that might be interested in taking part in a rail infrastructure related PPP. The number of
possible combinations makes it impossible to list all such partners. This section will list several
potential partners from both the public and private sectors that might participate in general rail-
based projects and then suggest some likely scenarios for partnerships that might form
specifically for funding enhanced intermodal service. While not exhaustive, these examples are
the most likely participants in future PPPs.
Examples of Potential Public Participants in Rail-Related PPPs
• Texas Department of Transportation – As the state agency responsible for overall
transportation planning, including rail, TxDOT has an important role in preserving and/or
making improvements to the state’s rail infrastructure that will aid it in fulfilling its
mission in the movement of people and goods. TxDOT will need to partner with private
rail companies to accomplish many of these projects.
• Local (County and City) Governments – Often local governments have rail
transportation priorities that they are interested in seeing advanced, however, they do not

Texas Transportation Institute 101 Multimodal Freight Transportation Programs
have the funding to complete them by themselves. In such situations, partnering with the
state and/or private rail companies may be the only way to accomplish these goals.
• Metropolitan Planning Organizations (MPOs) – MPOs prioritize and program funding
for transportation projects within the urbanized areas (>50,000 population) of the state.
MPOs could desire to participate in rail projects that improve traffic safety or that
generate environmental/societal benefits within their boundaries.
• Regional Mobility Authorities (RMAs) – RMAs are new governmental bodies that
have been granted certain taxing powers within their region for funding of transportation
improvements that will increase mobility. Projects are not restricted to the highway
mode alone and some RMAs may choose to fund passenger or freight rail projects as part
of their overall mobility improvement planning.
• Rural Rail Transportation Districts (RRTDs) – RRTDs are sub-divisions of state
government created to preserve rail infrastructure that have the power to own, construct,
operate, and maintain rail and intermodal facilities. RRTDs could work with TxDOT to
secure funding and provide local management and oversight for shortline rail operations.
Those owning facilities in or near urban areas may also allow commuter or other types of
passenger rail to use their infrastructure.
• Port Authorities – Port authorities might participate in rail projects that would benefit
the port by providing better landside access for both people and goods.
• Airport Boards – Airport boards might participate in rail projects that improved
movement of passengers or freight to airport facilities.
• Transit Agencies – Transit agencies in the urban areas of the state might become
partners on rail projects that created opportunities for rail transit or right-of-way
acquisition for rail or bus transit facilities.
• Commuter Rail Districts – Intercity commuter rail districts might partner on projects
that increased rail capacity allowing for commuter rail operations. Commuter rail also
qualifies for certain federal transit grant programs that could be used to help fund the
project.
• State-supported Institutions of Higher Education – State universities often have large
financial reserves that are invested for provision of future educational opportunities.
Some state officials have suggested that these funds could be invested in transportation

Texas Transportation Institute 102 Multimodal Freight Transportation Programs
projects, including rail projects that had a potential for financial return or that produced
other benefits to the university such as increased connectivity to urban areas and/or other
educational and business institutions.
• School Districts – Local school districts could potentially become involved in rail
projects where the transportation needs or safety of students were involved. Provision of
improved transportation of students, the movement of a rail line away from school
property, or purchase of improved warning devices at a highway-rail grade crossing
nearby a school are examples of possible school district interest.
• Other State and Federal Agencies – Almost always other interests, in addition to
transportation, play a role in rail transportation projects. This means that other state and
federal agencies may be interested in participating in the project. For example, the
state’s economic development agency or agriculture department may also be interested in
partnering to meet their goals for job creation or agricultural movement, respectively.
Examples of Potential Private Participants in Rail-Related PPPs
• Railroad Companies – Private railroad companies have existing rail infrastructure but
limited funding available for added capacity or expansion of their systems for new
services. By partnering with the public sector, private rail companies may be able to
open new markets for themselves and benefit the public at the same time through
diversion of freight and passenger traffic from the highway system.
• Railroad Contractors – Railroad contractors, both rail operators and those who
specialize in rail construction, signaling, or equipment, may also be interested in
partnering. These companies stand to gain in projects where state-owned facilities may
require their services for operation or maintenance.
• Highway Construction Firms/Infrastructure Firms – Major construction firms that
now specialize in the building of highway facilities may be interested in participating in
projects that have both highway and rail features. These companies may branch out into
rail construction or simply take part in the highway construction portion of such a
partnership. Their experience in management and execution of large construction
projects may also be of great benefit to any PPP team.

Texas Transportation Institute 103 Multimodal Freight Transportation Programs
• Consortia/Joint Ventures – Several private firms may choose to form subsidiaries or
joint ventures for a specific project. This model has been evident in recent large TxDOT
projects such as SH-130 and initial proposals for construction of the high-priority routes
of the Trans Texas Corridor.
• Operations and Maintenance (O&M) Companies – Companies that specialize in the
operations and maintenance of large transportation facilities may wish to partner in order
to participate in O&M of the facility following construction.
• Trucking Companies – Trucking companies might be interested in participating in rail
projects that could meet specific performance standards for movement of their cargoes
which either augment or improve their truck or driver availability. Rail service that can
move TOFC or COFC quickly and efficiently for relatively long segments of the trip can
enhance truck operations by freeing up drivers and tractors for other purposes, thereby
reducing maintenance, fuel, and personnel costs.
• Third Party Logistics (3PL) Companies – 3PL companies are contractors that take
responsibility for making sure that a company’s freight products are delivered on time.
3PL companies choose the mode by which that freight should move. Rail projects that
increase delivery reliability and/or reduce the costs of delivery may interest 3PL
companies enough to participate in a PPP that could provide such a service that would
move their contracted freight.
• Private Investment Firms – The prospect of a rail project generating a long-term profit
may be high enough to interest a private investment firm to participate. The return on
investment for the company would have to outweigh the risks associated with the project.
The interest of the private financial firms would be largely dependent on the projected
traffic or ridership of any such rail project.
Possible Scenarios for Enhanced Intermodal Services
Below are five possible scenarios through which TxDOT could possibly participate in a
partnership that provides an enhanced intermodal service. This list is not meant to exclude other
possibilities, but merely to give examples of possible structures and objectives that might drive
team formation.

Texas Transportation Institute 104 Multimodal Freight Transportation Programs
TxDOT/RMA/RRTD Fund Railroad Corridor Shuttle Services for TOFC/COFC In this scenario, state entities such as TxDOT, a Regional Mobility Authority, a Rural
Rail Transportation District, or a combination of these entities would partner with a railroad
company to provide additional intermodal rail services in a heavily congested truck corridor.
Government involvement and funding assistance is typically necessary for rail movements of
less than 500-700 miles where rail rates and delivery times become more competitive with
trucks. In concept, this type of partnership would work in this manner. Funds from one or more
of the state entities would subsidize rail companies to a level that allowed them to charge rates
that are competitive with trucking companies at these distances. Rail companies could earn a
reasonable profit in accordance with the partnership agreement and, in exchange, the state would
benefit by reducing the number of shipping containers and trailers using the existing highway
system thereby decreasing congestion and maintenance costs.
If the costs to participate in such a partnership were less than or equal to the costs saved
in reduced maintenance or reduced construction to handle increased traffic, such a partnership
would make sense for the state to consider. Other societal benefits such as environmental
benefits and traffic safety could also be taken into account. For the railroad companies, the
ability to generate a reasonable rate of return based upon the state investment could potentially
make this type of project feasible. Potentially, trucking companies might also benefit by
concentrating drivers’ efforts upon delivery from the rail terminals rather than the line segment
where rail was used.
The partnership agreement and conditions for each project of this type would have to be
negotiated between the parties at the outset to ensure that each partner’s role, responsibilities,
and expected return was clear. Also, TxDOT’s interpretation of HB 3588 may require that the
state have an ownership role in some fixed assets in order to participate. The state constructing
and owning some fixed assets that make TOFC/COFC service possible, such as an intermodal
terminal, might satisfy this requirement as opposed to the state purely subsidizing new
intermodal train service by the private railroad company.
TxDOT/Federal Track Improvements in a Specific Corridor In this type of partnership, TxDOT, on its own or as a pass-through agency for federal
loans or grants, would partner with a private railroad company to make infrastructure
improvements along a specific corridor in order to achieve transportation benefits that have a

Texas Transportation Institute 105 Multimodal Freight Transportation Programs
statewide or national benefit. For example, rail improvements in the congested NAFTA corridor
through Texas might be considered in order to divert some of the current truck freight from
Interstate 35. In fact, construction of a railway along a portion of Interstate 35 to handle
increasing freight traffic was considered as one alternative during the 1999 Interstate 35 Trade
Corridor Study although this option was not a part of the finally recommended strategy (56).
This form of partnership would instead have public agencies incrementally invest in
improvements to existing rail corridors to improve their speed and efficiency—thereby
increasing their competitiveness with truck-only solutions. Railroad companies would benefit by
gaining a more efficient and capable rail system and public agencies would benefit by reduced
highway maintenance and decreased congestion-related construction/expansion costs. By
focusing funds in a designated corridor, transportation improvements over a longer travel
segment could potentially be realized.
As in the previous example, roles for each of the participants and desired performance
measures would need to be spelled out in advance before public funds could be invested in the
private rail network. Limited public ownership roles for certain components of the system might
have to be devised before state funds approved by HB 3588 or from the State Infrastructure Bank
(SIB) could be allocated to such a project by TxDOT. In other cases, federal loans or grants or
highway fund reimbursements might be approved in which TxDOT played an administrative or
oversight role for truck diversion to intermodal movement. The acceptability to the railroad
company of allowing any such limited supervision of rail operations by a public entity might also
be a challenge to forming a partnership of this type.
Texas Mobility Fund/GARVEE-type Bonding for PPPs The approval of additional funding mechanisms in the past two legislative sessions by
TxDOT have opened up a myriad of possibilities that did not exist previously for rail-related/
intermodal PPPs in Texas. The availability of bonding programs such as the Texas Mobility
Fund to provide rail infrastructure, as one option among many to relieve urban congestion, may
appeal to the fund’s users. It is possible that stable (i.e., known and steady quantities) funding
available for rail purposes as provided in HB 3588 or the creation of a more stable federal
funding source for rail infrastructure could allow GARVEE-type bond financing of rail facilities.

Texas Transportation Institute 106 Multimodal Freight Transportation Programs
As new financial tools such as these become available, a larger variety of PPP forms may
become viable.
GUIDELINES FOR SETTING UP ENHANCED INTERMODAL PPPS IN TEXAS
Several types of recommended guidelines for the creation of PPPs in Texas could be
made, however this report will limit its recommendations to those guidelines that have been
proven successful in practice and documented in transportation research literature. The National
Cooperative Highway Research Program (NCHRP) published a report in 1999 that conducted in-
depth case studies of multimodal transportation project partnerships as well as evaluating data
from a database of 58 other multimodal projects (81). NCHRP Report 433 outlines three stages
to general partnership development—prior to developing a partnership, developing a partnership,
and maintaining a partnership as shown in Table 23. A checklist for each of the steps involved
in each of these stages is also included which provides advice on specific issues to consider. An
analysis of these steps shows that partnership formation is an on-going process that requires
continual effort throughout the life of any project for which a PPP is formed.
In general, partnership development tends to adhere to the following pattern. Under each
step, a list of issues to consider based upon the recommendations of NCHRP Report 433 and
other sources are listed.
Step 1. Determine the need to form a partnership • TxDOT (or another public agency) may lack the financial or technical resources to
develop a project “in-house” using internal expertise.
• An evaluation of the public agency’s strengths and weaknesses should be done to
determine if the private sector has strengths that can offset the identified
weaknesses of the public sector participant(s), thus making the project feasible. If
so, formation of a PPP should be explored.

Texas Transportation Institute 107 Multimodal Freight Transportation Programs
Table 23: Stages of Partnership Development (81). Stage A: Prior to Developing a Partnership
1. Reasons for forming a partnership 2. Activities prior to deciding to partner 3. Activities to activate a partnership 4. Identifying stakeholders
Stage B: Developing a Partnership 1. Activities included in kick-off workshop 2. Partnership components 3. Legislation and other legal issues 4. Institutional issues 5. Community involvement issues
Stage C: Maintaining a Partnership 1. Internal communication components 2. Tracking progress 3. Legal issues 4. Institutional issues 5. Community involvement activities
Step 2. Determine the partners needed for project success • Careful consideration should be given to which (i.e., how many?) public and
private sector partners should be included in the PPP for a given project.
Appropriate public agencies should not be excluded because they do not invest
funds in the project— they may play an important role in public awareness and/or
acceptance of the project. At the same time, however, the addition of too many
partners into the PPP can unnecessarily slow down the project development
process.
• Private sector participants should generally be limited to those that have skills
and/or financial resources that are directly related to the project, its planning, its
construction, its operations, or its maintenance.
Step 3. Identify common goals and resources for partnership members • For any PPP to be successful, the goals of each member of the partnership should
be clearly understood. Often, public and private sector agencies may have
divergent, but compatible goals. For example, a private rail company may
participate in a project because it is interested in generating new business and
therefore larger profits. This goal could be compatible with TxDOT’s goal of
decreasing the number of trucks on the highway for congestion reduction and

Texas Transportation Institute 108 Multimodal Freight Transportation Programs
maintenance savings or for an environmental agency’s goal of reducing truck
emissions – differing goals, but common methods of meeting them.
• Each member of the PPP brings its own resources “to the table.” Public agencies
may be able to qualify for specific federal or state grants more easily than private
entities. Conversely, private firms may have internal holdings that can be brought
to bear on the project or their expertise in a certain area may more readily attract
private financing or an improved bond rating. Financial, technological, political
and other types of resources should all be considered.
Step 4. Develop a plan/process for dealing with anticipated and unanticipated legal, political, and financial conflicts that may occur
• Inevitably, difficulties of this type will occur during the life of the project, so
having a plan in place to deal with them is a vital part of partnership formation.
For example, agreeing to settle disputes through a defined arbitration process rather
than through legal means is strongly recommended for any PPP.
• Additionally, methods of handling conflicts over purchasing requirements, project
scheduling, and financial matters should all be discussed and codified as part of the
partnership agreement.
Step 5. Clarify roles and responsibilities of each of the partners for all project stages • Each party should be aware of their role throughout the project.
• Project roles may vary during the different stages for each partner.
• Leadership roles in the partnership at each stage should be explored and
documented.
• Both the scope and extent of the responsibilities of each partner, at each stage of
the project, should be determined.
Step 6. Complete and coordinate the necessary financial and technical planning documents • Financial agreements must allow for the different methods of tracking expenditures
and follow-up accountability for investments. For example, public agencies
generally must comply with accounting principles that are in-line with the
Governmental Accounting Standards Board (GASB) in their reporting of financial
transactions. Private firms do not have the same set of rules for accounting and
may vary from firm to firm. Parties in a PPP must come to some agreement on the
accounting practices that will be acceptable in and for the PPP.

Texas Transportation Institute 109 Multimodal Freight Transportation Programs
• Planning documents should take into account the varying policies and desires that
public and private sector firms have regarding project approval and completion
schedules. Public sector agencies usually are working from a pre-defined and
agency approved planning process that may seem tedious and repetitive to the
private sector members of the partnership. Private firms, on the other hand, are
typically more flexible and interested in getting the project completed in short order
so that their operations can be positively affected through increased efficiency or
increased profits (81). The agreement must address expectations and limitations on
project completion from both perspectives.
Step 7. Secure project resources as planned or through alternative means • Once a PPP is formed and necessary items are negotiated into an approved project
agreement, all parties should begin to pull together the resources (financial and
technical) that each has committed to the project.
• Occasionally, planned resources and/or funding options will not materialize as
anticipated in the project agreement/planning document and alternative means of
replacing those resources must be found. Early identification of alternate funding
sources or other firms that can quickly replace a PPP member firm that is in default
of the project agreement is vital.
• If at all possible, resources should be identified and solidified prior to completing
the project agreement/ PPP formation and planning stage. This may include
considerable effort to develop public support for the project.
Step 8. Build infrastructure/operate service as outlined in project agreement • Execution of the project plan should begin as scheduled, if at all possible. Delays
in construction or service affect resource availability with each of the partners.
Step 9. Evaluate conditions and success of partnership and project • Operation of a new infrastructure (or new operations over existing infrastructure)
should be evaluated to determine if traffic levels/usage are in accordance with the
financial and operational projections made before construction.
Step 10. Negotiate/renegotiate partnership structure as necessary • If a project is not meeting the forecast level of service, partners in the PPP should
be consulted to identify reasons for this shortfall and suggested methods to address
the problem.

Texas Transportation Institute 110 Multimodal Freight Transportation Programs
• It is possible that changes to the PPP structure and/or membership may be
necessary for continued operation of the facility/service.
• Lessons learned should be documented for future PPP formation.
Additional Sources for Information on PPPs
• National Cooperative Highway Research Program (NCHRP) Report 433, Guidelines for Developing and Maintaining Successful Partnerships for Multimodal Transportation Projects, Transportation Research Board, National Academy Press, 1999.
• NCHRP Web Document 21, Volume II- Case Studies of Multimodal Partnerships, Available
at: http://www4.nas.edu/trb/crp.nsf. • NCHRP Web Document 22, Volume III- Research Report: Developing and Maintaining
Partnerships for Multimodal Transportation Planning. Available at: http://www4.nas.edu/trb/crp.nsf.
• U.S. DOT Volpe Transportation Center, Public/Private Partnerships: Implications for
Innovation in Transportation, December 1998. Available at: http://www.volpe.dot.gov/infosrc/strtplns/nstc/ppp/
• U.S. DOT Volpe Transportation Center, Public/Private Partnerships II: Engines for
Innovation in Transportation, May 2000. Available at: http://www.volpe.dot.gov/infosrc/strtplns/nstc/ppp2/
• U.S. DOT Volpe Transportation Center, Public/Private Partnerships III: Implementing
Successful Public/Private Partnerships in Transportation, February 2002. Available at: http://www.volpe.dot.gov/infosrc/strtplns/nstc/ppp3/

Texas Transportation Institute 111 Multimodal Freight Transportation Programs
CHAPTER 8: CONCLUSIONS AND RECOMMENDATIONS
OVERVIEW
Strategic public investment through public-private partnerships in the rail freight
network, specifically in enhanced intermodal rail service, has been found to be a possible
solution for lessening the state’s roadway congestion problem. Many feel that without greater
investment in rail infrastructure allowing rail to carry a greater proportion of intercity freight,
congestion caused by trucks on Texas’ roadways will most certainly increase. Without rail
assuming a greater role in the transportation mix, truck traffic is expected to grow as a
percentage of total traffic.
This research project analyzed the opportunities for public investment in intermodal rail
service through a partnership with railroad companies as a means of achieving this goal. It
identifies the importance of synchronizing public and private transportation planning and
financing processes that, throughout the past century, have primarily operated in isolation from
one another to the growing disadvantage of each. A truly exciting finding is that both the public
sector, which faces enormous highway maintenance and construction needs, and the railroads,
which often struggle to earn the cost of capital for maintenance and operation of their extensive
networks, are increasingly receptive to the idea of collaboration. The railroads are beginning to
see alliances with the public sector as an opportunity for mutually beneficial solutions to
transportation problems. Matt Rose, President and Chief Executive Officer of BNSF, disclosed
“BNSF meets annually with state [departments of transportation] to review plans. In the future,
we should be discussing changes in our service that could ease the burden on a state’s highway
network, as well as the plans of each state that could affect our business, hopefully, positively
(86).” Furthermore, Dick Davidson, Mr. Rose’s counterpart at UP, believes “that the existing
surface rail network, with perhaps some relatively modest capital investment, presents a
significantly lower cost and more timely alternative to additional highway spending (87).” With
these sentiments in mind, this project was undertaken to help balance and optimize the surface
transportation system by maximizing the value of transportation expenditures in both the public
and private sectors.

Texas Transportation Institute 112 Multimodal Freight Transportation Programs
PROJECT IMPLEMENTATION
The concept of public-private partnerships for transportation projects is not new. There
are numerous examples of partnerships that have occurred over the past decade for this purpose.
The most notable ones include the Alameda Corridor in Los Angeles and the Kansas City
Sheffield Junction Flyover. These projects benefited both public and private entities by
improving roadway mobility and railroad operations through the elimination of at-grade conflicts
and increasing the competitiveness of rail. Recent studies and the multitudes of examples point
out the fact that a variety of partnership arrangements currently exist and are possible. The array
of options may vary according to existing state and local laws and the availability of federal
programs. The success of partnerships may depend on the understanding of the flexibility
necessary on both the public and private sides in culminating with a mutually beneficial
agreement while analyzing all the possible opportunities. With this in mind, there are several
important issues to consider when establishing public-private partnerships.
The first is that the relationship between public and private entities is ultimately
predicated on the ability of both sides to receive favorable economic returns. Decision makers,
both with the public sector and within the rail industry, will have to consider a large number of
issues and at times reconcile competing or conflicting objectives. The ultimate solution requires
both entities to work toward common goals.
In Texas, recent initiatives have broadened the scope under which the public sector can
participate in public-private partnerships, thus creating new opportunities for the utilization of
the transportation network to solve transportation problems in the state. With these new
opportunities come new responsibilities and the challenge of understanding the newly created
guidelines. This challenge also includes understanding any guidelines created as a result of the
rule-making processes.
During the rule-making process it is important to ensure that flexibility is provided for in
developing public-private partnerships. The multitude of possible arrangements, along with the
vast array of projects possible in seeking transportation solutions, require that the rules
established for forming partnerships do not unduly limit the type and form of relationships
possible.

Texas Transportation Institute 113 Multimodal Freight Transportation Programs
ECONOMIC ASSESSMENT
A successful public-private partnership not only depends on the legal, institutional, and
political impediments that must be overcome, but ultimately depends on the financial
justification of the project. Public transportation agencies must select the best investments for
the public’s transportation dollar, while private railroads must increase stockholder value by
earning a reasonable return on investments.
In analyzing the economic feasibility of an intermodal project investment, the public
entity uses some form of cost-benefit analysis, such as net present value, and the private sector
evaluates the rate of return from expected cash flows. A decision-making tool that jointly
performs both of these analyses can be useful if it allows each party to understand the full range
of costs and benefits accrued by the other. As a result, public and private entities can be
confident that their respective investments are not unduly favoring the other party. Figure 31
illustrates this balance that must be achieved by an economic model that is used to analyze the
economic feasibility of public-private partnerships.
Figure 31. Balancing the Value of Public-Private Partnerships.
The economic model developed for this project essentially provides a basic framework
for the state to clarify relationships with railroads and describe the effects of assumed costs,
benefits, financial requirements, and operating conditions. By understanding each party’s
financial constraints and decision-making processes, an agreed-upon project funding strategy can
be devised. This basic framework provides a critical starting point for evaluating a potential
Value to thePrivate Sector
Value to thePublic Sector
Measured as a Return on Investment
Measured as Net Benefits
Value to thePrivate Sector
Value to thePublic Sector
Measured as a Return on Investment
Measured as Net Benefits

Texas Transportation Institute 114 Multimodal Freight Transportation Programs
public-private partnership. It is recommended that a more refined, detailed model be developed
subsequent to this project in order to more realistically capture the highly complex financial
situations of both parties.
This project examined three corridors as case studies. Each scenario examines a
particular transportation corridor, involving both highway and railroad routes, and a specific
intermodal solution opportunity. Two of the corridors represent intermodal partnership
opportunities identified through research and discussions with the railroads. It should be noted
that the results from the model for these corridors are mostly intended to demonstrate the
recommended methodology for evaluating the economics of these projects, and not to actually
recommend the implementation or rejection of funding for candidate corridors.
Based on information made available for this project, UP’s Laredo to Dallas corridor
appears to have the greatest chance for mutual economic gains. Perhaps the greatest difference
between this corridor and BNSF’s Houston to Dallas corridor is the corridor length and the
number of trucks assumed to be removed from the highway on a daily basis. Nevertheless, the
fact that these analyses were based on limited information on the cost of upgrading infrastructure
and trucking industry participation reinforces the fact that additional studies should be made in
order to refine each of the input parameters.

Texas Transportation Institute 115 Multimodal Freight Transportation Programs
APPENDIX A: ANNOTATED BIBLIOGRAPHY American Association of State Highway and Transportation Officials. “Freight Rail Bottom Line Report,” Transportation-Invest in America, Washington, D.C., January 2002. This report summarizes the nation’s freight rail system and addresses concerns about the capacity of the nation’s freight transportation system over the next 20 years. This document goes into detail about the investment needs and possibilities for the nation’s highways, transit systems, and freight transportation infrastructure. In particular, cost estimates for freight-rail investment is analyzed and a set of potential investment scenarios are generated, based on future demand estimates. The costs and benefits of each scenario are then thoroughly investigated. Brown, Thomas and Hatch, Anthony. The Value of Rail Intermodal to the U.S. Economy. Accessed from: www. Tomorrowsrailroads.com. June 2003. This document explains the expected increase in freight transportation demand by the year 2020. A strategy is outlined in the report to help determine which investments in transportation infrastructure will generate the greatest economic impacts. The report explains that investments in highway expansion alone will not be enough to meet future demands. Rather, more public investments in rail intermodal transportation must be made. Carmichael, Gil. A Column’s Final Thoughts. Progressive Railroading. Volume 45, No. 10. October 2002.
This is an opinionated freelance article that calls on the leadership of the railroad industries to be more open to new ideas and changes. The article sites specific examples of how the railroads have resisted new ideas in the past and explains how it has hurt them. In particular, the article emphasized public-private partnerships. Volume II – Case Studies of Multimodal Partnerships. NCHRP Web Document 21, Available at: www4.nas.edu/trblcrp.nsf. This document looks at several existing multimodal partnerships around the country. The methods of funding, project oversight, parties involved, and other factors of each partnership are discussed in detail. CSX. Railroad Advantage. Available at: www.csx.com/index.cfm?fuseaction=environment.rr_advantage. This is a brief description of how the railroad industry provides the safest movement of hazardous materials. It also investigates the low emissions emitted from railroads in comparison to other modes of transport.

Texas Transportation Institute 116 Multimodal Freight Transportation Programs
Federal Highway Administration. Southern California Regional Freight Study. A case study is presented in this report of the freight movement system in southern California. The three major markets of its fright system are analyzed; regional and local distribution, domestic trade and national distribution, and international trade. The issues associated with each are investigated, such as funding, planning, and partnerships. A number of issues facing southern California are also discussed such as air quality, congestion, land-use, growth, security, and several others. The Freight Rail Solution for Easing Congestion. Found on-line at: www.tomorrowsrailroads.com. May 21, 2003. This report provides numerical data and statistics for comparing freight between trucks and freight rail. Their effects on traffic congestion and the environment are looked at as well. The report concludes with suggestions for the federal government on implementing more efficient freight rail service around the country. Hunt, Harold D. The Road Ahead. Tierra Grande, The Real Estate Journal. April 2001. This is a report on the development of the proposed NAFTA highway in Texas, Interstate 69. It explains the need for the system, how it will solve truck congestion, the potential benefits, and it discusses the remaining issues that need to be solved to complete the project. International Road Transport Union. Comparative Analysis of Energy Consumption and CO2 Emissions of Road Transport and Combined Transport Road/Rail. 2002. This study compares key environmental impacts of transporting freight over European routes by truck to those movements made by a combination of truck and rail. Energy consumption data and carbon dioxide emissions were taken into account to compare the environmental effects of both modes of transport. Several types of intermodal freight transport were researched; containers, rolling highway, swap body, and others. International Technology Exchange Program. Freight Transportation: The European Market. United States Department of Transportation, Federal Highway Administration. June 2002. This document was an international investigation of the issues, constraints, and challenges faced by the European Union in its attempts to develop a common market and how the private sector has responded. Several sponsors contributed to the study of this research such as the Federal Highway Administration, the American Association of State Highway and Transportation Officials, the National Cooperative Highway Research Program, and other transportation officials from Canada and Mexico. The report concludes with recommendations of further studies that can help further understand characteristics of the international market.

Texas Transportation Institute 117 Multimodal Freight Transportation Programs
The Lone Star Report. LSR Special Issue: Transportation in Texas. Volume 6, Issue 43; July 26, 2002. This report summarizes the current traffic demand problem in the state of Texas. It discusses funding issues, freight transportation, inner-city congestion, and several potential solutions. Mongelluzzo, Bill. Intermodal Bottleneck Ahead. The Journal of Commerce. Vol. 4 Issue 13. March 31-April 6, 2003. This document addresses the lack of capacity ahead for the intermodal freight system in southern California. The report suggests that user fees be implemented on container freight so that adequate funding can be gathered to expand the railroad system to double or triple track. Evidence is presented that explains why more public funding is needed for intermodal projects around the country, such as the Alameda Corridor, investigated in this report. National Road Authority of Ireland. Going Places. This document is a description of how public-private partnership can improve roads in Ireland. It briefly describes the need for Public-private partnerships, how the need can be met, and what the benefits are. Norment, Richard. PPPs- American Style. This report discusses the situation of Agroindustry in Latin America, market demand for Agroindustry, its importance and the partnership possibilities. The document then further investigates public-private partnerships and how they can be implemented. Partnership to Promote Enhanced Freight Movement at Ports and Intermodal Terminals: A Strategic Plan. Volpe Center. February 2000. The document presents a plan for initial implementation strategies for public-private partnerships identified in the 1997 NSTC Transportation Science and Technology Strategy. Opportunities, outcome goals and implementation strategies are all reported in detail within this document. Railroad Shipper Transportation Advisory Council. White Paper II. Washington, D.C. April 1999. This document summarizes the recommendations made to congress by the Railroad-Shipper Transportation Advisory Council. It discusses the distribution of public transportation funds, the connectivity of the rail network, rail capacity and efficiency, and lists proposed regulatory changes. Report of Genoa Forum Proceedings. Fourth Forum on Intermodal Freight Transport Between Europe and the United States. April 5, 2001.

Texas Transportation Institute 118 Multimodal Freight Transportation Programs
This report discusses the current implications of intermodal transport in Europe and the United States. New technologies, such as electronic commerce, are discussed. This document also looks at a few of the recent intermodal projects under way, such as the Alameda Corridor, and discusses their advantages and how they can be applied to future intermodal projects. R.L. Banks & Associates, Inc. Twin Cities Region Intermodal Terminal Needs Study. A Report to the Metropolitan Council. January 1995. The information in this report provides an assessment of needs for terminal capacity in the Twin Cities area to handle intermodal freight and is primarily intended to aid the Minnesota Intermodal Terminal Study coordination group. The document introduces intermodal rail terminal capacity analysis methodology, information on Burlington Northern’s St. Paul Intermodal Terminal, and a demand analysis is performed, followed by final conclusions. Roop, S. S, J. E. Warner, F. Zambrano, R. Ismailova, and D. H. Kang. The Impact of Mexican Rail Privatization on the Texas Transportation System. Report 2128-2. Texas Transportation Institute, College Station, TX, February 2001. This report discusses the privatization of Mexico’s rail network and the effects of privatization on Texas transportation infrastructure. …The document concludes that the privatization of the Mexican rail network will result in a significant increase in rail traffic that will serve to partially offset the growth in truck traffic. Texas Department of Transportation. Creating Tomorrow’s Transportation System Strategic Plan 2003-2007. Statement of the Governing Board of the Texas Department of Transportation. March 2002. This report outlines the major initiatives for TxDOT over the next 4 years. Led by Governor Rick Perry, TxDOT commissioner Ric Williamson, and others, the document specifies agency objectives, measures, and performance targets for each. In addition, a budget strategy is outlined with five steps and corresponding outputs and efficiencies are listed for each. The report concludes by describing current challenges facing the state of Texas and possible solutions that can be undertaken. Texas Transportation Commission. Texas Transportation Partnerships. A report for the citizens of Texas. Texas Department of Transportation, August 2001. This report outlines a vision for the Texas transportation system. It then expresses the need for newer and stronger partnerships and provides examples of current successful partnerships and strategies. The document then discusses how mobility, safety, and project delivery can all be improved to help the economy of Texas.

Texas Transportation Institute 119 Multimodal Freight Transportation Programs
UNEP. Rail on Track of Sustainable Mobility. January 2002. This report discusses the rail infrastructure on a global scale and its advantages over other modes of transport. The document calls on the rail sector to build on its social and environmental advantages while indicating a modal shift to rail may be necessary in some areas and that increases support for rail from the public sector should continue. U.S. Department of Transportation. Addendum to the 1997 Federal Highway Cost Allocation Study Final Report. Federal Highway Administration, May 2000. This Addendum to the 1997 Federal Highway Cost Allocation Study presents estimates of the costs of highway use not borne directly by transportation agencies. This includes crash costs, air pollution, congestion, noise, and other societal and economic costs. These costs are estimated to rage from $30 billion to $349 billion per year. Virginia Department of Rail and Public Transportation. Potential for Shifting Virginia’s Highway Traffic to Railroads. Commonwealth of Virginia. 2001. The objective of this paper is to address, to the Secretary of Transportation, the need and possibility of diverting highway traffic from Interstate 81 into rail transport. A number of factors are measured and analyzed that could determine if this type of project would justify using public funding for the rail improvements. Washington Department of Transportation. Benefits of Rail Freight Study. Found on-line at www.wsdot.wa.gov/rail/plans/DTA/default.cfm. June 2003. The objective of this report is to quantify the benefits of railroad freight transportation in Washington State. Two scenarios are investigated for improving benefits. One is shifting the freight moved by rail to combination trucks and the other is converting short-line railroads to trucks. The overall goal of the study is to show the rail system’s value as one part of our transportation system. Wilbur Smith Associates and HNTB Corporation. Corridor 18 Special Issues Study. Final Report. May 1997. This report is a continuation of Corridor 18 and Corridor 20 feasibility studies. In particular, this document investigates three major issues associated with future location and environmental impacts of the corridor. This document also provides cost estimates, economic analysis, efficiency benefits, and traffic impacts of the corridor.


Texas Transportation Institute 121 Multimodal Freight Transportation Programs
APPENDIX B: GLOSSARY OF SELECTED REPORT TERMS BLOCK SECTION—a section of track in a fixed block system which a train may only enter when it is not occupied by other trains (88). CIRCUS LOADING—Manner of loading truck trailers on rail flatcars by backing the trailer onto the flatcars from a ramp with a yard tractor. CLASSIFICATION YARD—A railroad terminal area where railcars are grouped together to form train units (89). COST-BENEFIT ANLAYSIS—An economic measure, typically undertaken by the public sector, of the feasibility of transportation projects or investments. Examples of cost-benefit analyses include net present value and benefit/cost ratio. DIRECTIONAL OPERATIONS—A manner in which railroads increase train throughput and safety by transporting opposing trains on separate parallel routes. This is also called Directional Running. DOUBLE TRACK—Two main tracks, upon one of which the current of traffic is in a direction specified by railway rules, and upon the other track in the opposite direction. DRAYAGE—The movement of a container or trailer to or from the railroad intermodal terminal to or from the customer’s facility for loading or unloading (90). INTERMODAL—Denotes movement of cargo between transport modes (89).
CONTAINER ON FLATCAR (COFC)—An intermodal shipping container moving via rail on a railroad flatcar. DOUBLE STACK COFC—Railcar movement of containers stacked two high (89). TRAILER ON FLATCAR (TOFC)—A highway truck trailer moving via rail on a railroad flatcar. Trailers are either lifted onto the flatcars or driven onto the flatcars by a yard tractor, a practice known as circus loading.
INTERMODAL YARD—A railroad terminal area where railcars are intermodal containers or trailers are loaded and unloaded. These facilities are usually dedicated for this purpose but may be located in conjunction to a classification yard. INTERMODAL CONTAINER—A freight container designed and constructed to be used interchangeably in two or more modes of transport (89).
DOMESTIC CONTAINER—Intermodal containers utilized within the U.S. These containers closely resemble the typical over-the-road trailers in length, i.e., 53 ft.

Texas Transportation Institute 122 Multimodal Freight Transportation Programs
INTERNATIONAL CONTAINER—Intermodal containers utilized in international shipping by ship. These containers are either 20 ft or 40 ft.
INTERNAL RATE OF RETURN—A measure of economic feasibility often utilized by the private sector for transportation projects or investments. This method solves for the interest rate that equate the equivalent worth of an alternative’s cash inflows to the equivalent worth of cash outflows (91). JOINTED RAIL—Rails of standard length which are bolted together at the ends. Current practices favor upgrading jointed rail to continuously welded rail. LESS THAN TRUCK LOAD CARRIERS (LTL)—Less than truck load companies serve customers who have insufficient amount of cargo to make up a full truck load. Less than truck load operations include mixing shipments of different customers and making multiple stops at each customer. Examples of LTL carriers are United Parcel Service and Federal Express. MAIN LINE—That part of a transportation railway system, exclusive of switch tracks, branches, yards and terminals. MODAL SPLIT—The proportioning of trips between travel modes (i.e., truck or rail). MODE—A particular form or method of travel for people or goods. OPERATING EXPENSES—The expense of furnishing service, including the expense of maintenance and depreciation of the plant and infrastructure used in the service. PASSING SIDING—A track auxiliary to the main track for meeting of passing trains. RAIL CAPACITY— The maximum number of trains which may be operated through a line (88). REVENUE—Income from all sources. RIGHT-OF-WAY—Lands or rights used or held for railroad operation. SHIPPER—The individual or institution that originates a shipment. SINGLE TRACK—A main track upon which trains are operated in both directions. TON-MILE—(a) A unit used in comparing freight earnings or expenses – the amount earned from, or the cost of, hauling one ton of freight one mile. (b) The movement of a ton of freight one mile. TRACKAGE RIGHT—An agreement through which a railroad obtains access and provides service over tracks owned by another railroad where the owning railroad retains the responsibility for operating and maintaining the tracks.

Texas Transportation Institute 123 Multimodal Freight Transportation Programs
TRAIN CONTROL SYSTEMS—A block signal system under which train movements are authorized by block signals whose indications supersede the superiority of trains for both opposing and following movements on the same track.
AUTOMATIC BLOCK SIGNALS (ABS)—System of signals that automatically indicates to trains about to enter a segment of track whether it is occupied by another train. CENTRALIZED TRAFFIC CONTROL (CTC)—A system to control the movement of trains by means of remotely controlled signals and switches from a central location by a dispatcher.
TRACK WARRANT CONTROL (TWC)—A method to authorize train movements on a main track within specified limits (92). TRUCK LOAD CARRIERS (TL)—Truck load companies serve large customers who have sufficient amount of cargo to make up a full truck load and thus do not need to mix shipments of different customers. Truck load operations usually travel from the origin directly to the destination (93). WELDED RAIL—Rails of standard length which are welded together at the ends to form a single rail.


Texas Transportation Institute 125 Multimodal Freight Transportation Programs
REFERENCES 1. Giblin, Jim. “Are Truckers Lucky? Or Just Better? How Motor Carriers Took Fast
Freight Away from Railroads.” Trains Magazine, Vol. 61, No. 11, November 2001, pp. 54-57.
2. U.S. Department of Transportation. Bureau of Transportation Statistics. North American
Transportation in Figures. BTS-00-05. Washington, D.C., 2000. 3. Chopra, Sunil. Supply Chain Management: Strategy, Planning and Operation.
Upper Saddle River, New Jersey: Prentice Hall, 2001. 4. Federal Highway Administration. Office of Freight Management and Operation.
Expenses per Mile for the Motor Carrier Industry: 1990 through 2000 and Forecasts through 2005. Washington, D.C., 2001.
5. Association of American Railroads. Falling Railroad Rates: Billions of Dollars in
Shipper Savings, July 2003. Online. Available: www.aar.org. 6. Association of American Railroads. Railroad Issues. 106th Congress, 2nd Session,
Washington, D.C., January 2000. 7. Goldsby, Thomas J. Professor, Department of Marketing and Logistics, Ohio
State University. “Topic 4: Motor Transportation.” Lecture Notes. Business Marketing and Logistics 784, Autumn 2002.
8. Guenthner, David. “More Competition, Capacity Needed for Freight Rail in
Texas.” The Lone Star Report, Vol. 6, No 43 July 26, 2002, p. 10. 9. National Science and Technology Council, Committee on Technology,
Subcommittee on Transportation Research and Development. Partnership to Promote Enhanced Freight Movement at Ports and Intermodal Terminals: A Strategic Plan. Volpe Center, February 2000.
10. U.S. Department of Transportation. Federal Railroad Administration. Office of
Safety Assurance and Compliance. Track Safety Standards Compliance Manual. Washington, D.C., January 1, 2002.
11. Igoe, Matthew. Senior Manager, Los Angeles Hub Operations, Burlington
Northern Santa Fe Railway. Interviewed by Sarod Dhuru, 2003. 12. American Association of State Highway and Transportation Officials, “Freight-
Rail Bottom Line Report,” Transportation – Invest in America. Washington, D.C., January 2003.

Texas Transportation Institute 126 Multimodal Freight Transportation Programs
13. Dupin, Chris. “Intermodal Will Top Rail Revenue in 2003.” Journal of
Commerce. Online. Available: www.joc.com (subscription required). Accessed: 9/20/2002.
14. Association of American Railroads, Railroads and Highway Congestion, January
2003. Online. Available: www.aar.org. Accessed: 02/20/2003. 15. Wilson, Robert, TxDOT Design Division, “Testimony before the House
Committee on Transportation.” March 25, 1998. 16. Federal Highway Administration [Internet]. Washington, D.C.: Addendum to the
1997 Federal Highway Cost Allocation Study Final Report; [updated 2000, June 20; cited 2003, August 10]. Available at: http://www.fhwa.gov/policy/hcas/addendum.htm.
17. Association of American Railroads, Railroads: Building a Cleaner Environment,
January 2003. Online. Available: www.aar.org. Accessed: 02/20/2003. 18. Phillips, Don. “Fast Freight’s Future.” Trains Magazine, Vol. 61, No. 11,
November 2001, pp 58-65. 19. Fryer, Don, Terminal Operator, and Joe Adams, Chairman’s Special
Representative, Union Pacific Railroad, Houston, TX. Interview, November 19, 2002.
20. Seaman, Gail, Manager Hub Operations, Business Unit Operations & Support,
BNSF Railway, Houston, TX. Interview, November 19, 2002. 21. Shelton, Ben. General Director, Premium Operations; Wint Marler, Senior
Manager Intermodal Terminal Operations; and Joe Adams, Chairman’s Special Representative, Union Pacific Railroad, Dallas, TX. Interview, December 4, 2002.
22. Burlington Northern Santa Fe Railway. BNSF Alliance Intermodal Facility Fact
Sheet. Received via Email, August 2003. 23. Union Pacific Railroad. “Union Pacific Railroad Officially Opens New $181
Million Chicago Region Intermodal Facility” News Releases. Omaha, NE, August 27, 2003. Online. Available: www.uprr.com.
24. Union Pacific Railroad. “UP Opens Intermodal Terminal in Marion, AR.” News
Releases. Omaha, NE, July 10, 2002. Online. Available: www.uprr.com.

Texas Transportation Institute 127 Multimodal Freight Transportation Programs
25. Burlington Northern Santa Fe Railway. “BNSF Logistics Park – Chicago Opens
Creating New Model for Freight Logistics.” News Release. Fort Worth, TX, October 14, 2002. Online. Available: www.bnsf.com.
26. “Expedited Rail Services Gain Ground on Trucking.” Logistics Management.
September 1, 2003. Online. Available: www.manufacturing.net/lm/. 27. U.S. Department of Transportation. The Comprehensive Truck Size and Weight
Study Final Report, Washington, D.C., Vol. 2, Chap. 4, p. IV-35, 2000. 28. U.S. Department of Transportation, Federal Highway Administration,
International Technology Exchange Program, Freight Transportation: The European Market. Washington, D.C., June 2002.
29. Union Pacific Railroad. Intermodal. Online. Available: www.uprr.com.
Accessed: 9/25/2003. 30. Burlington Northern Santa Fe Railway. BNSF Intermodal. Online. Available:
www.bnsf.com. Accessed: 9/24/2003. 31. Kansas City Southern Railway. Automotive and Intermodal. Online. Available:
www.kcsi.com. Accessed: 9/24/2003. 32. Intermodal Association of North America. “Rail Looking for Growth Target
Short-Haul Intermodal.” IANA News. February 2003. Online. Available: www.intermodal.org.
33. Stagl, Jeff. “Pay on Delivery.” Progressive Railroading. Vol. 46, No. 4, April
2003, pp. 33-37. 34. McClellan, Jim. Senior Vice-President of Planning, Norfolk Southern Corp.
“Short-Haul Intermodal: The Norfolk Southern Experience.” Presentation. Transportation Research Board, Washington, D.C., January 2003.
35. Gilmore, Paul, Vice President, Expressway, Canadian Pacific Railway.
“Equipment Options for Short-Haul Intermodal Rail Markets.” Presentation. Transportation Research Board, Washington, D.C., January 2003.
36. U.S. Department of Transportation. “Federal Railroad Administrator Announced
Funding for Grade Crossing Hazard Elimination Programs.” DOT News. FRA 05-03. Washington, D.C., Thursday, September 4, 2003.

Texas Transportation Institute 128 Multimodal Freight Transportation Programs
37. U.S. Department of Transportation. Federal Highway Administration. Office of
Freight Management and Operations. Freight Analysis Framework. Online. Available: www.ops.fhwa.dot.gov.
38. U.S. Department of Transportation. Federal Highway Administration. Freight
Profile – Texas. Washington, D.C., 2003. 39. Texas Department of Transportation. Crossroads of the Americas: Trans Texas
Corridor Plan. Austin, TX, June 2002. 40. Alliance I-69 Texas. Top I-69 Facts. Online. Available: www.I69Texas.org. 41. Alliance I-69 Texas. I-69 Basic Presentation, October 2002. Online. Available:
www.I69Texas.org. 42. Ports-to-Plains Corridor Coalition. Map of Routes. Online. Available:
www.portstoplains.com. 43. U.S. Department of Transportation. Bureau of Transportation Statistics. U.S.
International Trade and Freight Transportation Trends, BTS03-02. Washington, D.C., 2003.
44. Louis Berger & Associates. Effect of the North American Free Trade Agreement
on the Texas Highway System. Texas Department of Transportation, Austin, TX, 1998.
45. Union Pacific Railroad. “Reopening of New Braunfels Line Delayed.” News
Releases, Omaha, NE, October 28, 1998. Online. Available: www.uprr.com. 46. Union Pacific Railroad. “Union Pacific Announces $6.8 million Upgrade Projects
in Texas.” News Releases. Omaha, NE, October 4, 2001. Online. Available: www.uprr.com.
47. Union Pacific Corporation. Union Pacific 1999 Financial and Operating
Statistics. Online. Available: www.uprr.com. 48. Union Pacific Railroad. “Union Pacific Announces $15.8 million Improvement
Plans for Port Laredo Facility.” News Releases. Omaha, NE, August 9, 2001. Online. Available: www.uprr.com.
49. Chacon, Tony, Assistant Vice President of Mexico Markets, Union Pacific
Railroad. Interview, May 23, 2000.

Texas Transportation Institute 129 Multimodal Freight Transportation Programs
50. Burlington Northern Santa Fe Railway. BNSF Gulf Division & Texas Division
Timetable No. 5. Online. Available: www.bnsf.com. 51. Burlington Northern Santa Fe Railway, Fort Worth, TX. Meeting with Project
Team, December 10, 2002. 52. U.S. Department of Transportation. Bureau of Transportation Statistics. “Rail2m
Database.” National Transportation Atlas Databases 2003. BTS-03-04. Washington, D.C., 2003
53. Interstate Commerce Commission. Railroad Control and Merger Application,
Volume 2, Burlington Northern Railroad Company and the Atchison, Topeka, and Santa Fe Railway Company. Washington, D.C., October 1994.
54. Williams, Sherry. Director Pricing & Measurement, Burlington Northern Santa Fe
Railway. Email, “BNSF Texas Short Haul Intermodal – Response to Your Inquiry,” to Sarod Dhuru, April 28, 2003.
55. U.S. Department of Transportation. Surface Transportation Board. Union
Pacific’s Fifth Oversight Report. STB Finance Docket No. 32760 (Sub-No. 21). Filed on July 2, 2001.
56. HNTB Corporation. I-35 Trade Corridor Study: Recommended Corridor
Investment Strategies. Texas Department of Transportation, Austin, TX, 1999. 57. U.S. Department of Transportation. Surface Transportation Board. Union
Pacific’s Third Annual Report on Merger and Condition Implementation. STB Finance Docket No. 32760 (Sub-No. 21). Served: December 21, 1998.
58. Frailey, Fred W. “Union Pacific’s Desert Bloom.” Trains Magazine. Vol. 62, No.
8, August 2002, pp. 47-65. 59. Union Pacific Railroad. “Union Pacific to Increase Train Speed Through Odessa.”
News Releases. Omaha, NE, October 15, 2002. Online. Available: www.uprr.com.
60. Union Pacific Railroad. “Union Pacific to Increase Train Speed Through Abilene,
Texas.” News Releases. Omaha, NE, March 20, 2003. Online. Available: www.uprr.com.
61. Union Pacific Railroad. “Union Pacific to Increase Train Speed Through Midland,
Texas.” News Releases. Omaha, NE, March 20, 2003. Online. Available: www.uprr.com.

Texas Transportation Institute 130 Multimodal Freight Transportation Programs
62. Frailey, Fred. “Union Pacific is off to the transcontinental races.” Trains
Magazine. Vol. 62, No. 7, July 2003, pp. 8-9. 63. Oberlender, G. D., Project Management for Engineering and Construction, 2nd
ed., McGraw-Hill Companies, Inc., New York, 2000. 64. Office of Management and Budget [Internet]. Washington, D.C.: OMB Circular
No. A-94, Guidelines and Discount Rates for Benefit-Cost Analysis of Federal Programs; [updated 2002, Jan. 22; cited 2003, Aug. 10]. Available: http://www.whitehouse.gov/omb/circulars
65. Gomez-Ibanez, J., Tye, W.B., Winston, C., Essays in Transportation Economics
and Policy, Brookings Institute Press, Washington, D.C., 1999. 66. Resor, R. R., Blaze, J. R., Short Haul Intermodal: Can It Compete With Truck?,
Zeta-Tech Associates, TRB Annual Meeting, Washington, D.C., 2004. 67. Federal Highway Administration, 1997 Federal Highway Cost Allocation Study,
U.S. Department of Transportation, 1997. 68. Bureau of Transportation Statistics, Bureau of the Census for Urbanized Area
Boundaries, National Transportation Atlas Database, 2003. 69. Flyvbjerg, B., Holm, M. S., Buhl, S., Understanding Costs in Public Works
Projects: Error or Lie?, Journal of the American Planning Association, Vol. 68, No. 3, Summer 2002.
70. Sassone, P. G., Schaffer, W. A., Cost-Benefit Analysis: A Handbook, Academic
Press, Inc., New York, 1978. 71. Higgins, R. C., Analysis for Financial Management, 6th ed., McGraw-Hill, New
York, 2001. 72. Krutilla, J. V., Eckstein, O., Multiple Purpose River Development: Studies in
Applied Economic Analysis, Johns Hopkins Press, 1958. 73. Pickrell, D. H., A Desire Named Streetcar: Fantasy and Fact in Rail Transit
Planning, Journal of the American Planning Association, Vol. 58, Spring 1992. 74. Robert L. Nichols, TxDOT Strategic Plan 2003-2007, p. 32. 75. “RAILROADS.” The Handbook of Texas Online. Online. Available:
http://www.tsha.utexas.edu/handbook/online/articles/view/RR/eqr1.html Accessed Wed Oct 1 11:42:39 US/Central 2003 .

Texas Transportation Institute 131 Multimodal Freight Transportation Programs
76. “RAILROAD CONSTRUCTION, PUBLIC AID TO.” The Handbook of Texas
Online. Online. Available: http://www.tsha.utexas.edu/handbook/online/articles/view/RR/mpr1.html, Accessed Wed Oct 1 11:34:39 US/Central 2003.
77. Savas, E. S., Privatization and Public-Private Partnerships, Chatham House
Publishers, New York, 2000, pp. 241-245. 78. William R. Black and James F. Runke. The States and Rural Rail Preservation:
Alternative Strategies. Lexington, Kentucky: The Council of State Governments, October 1975, p. 4-5.
79. TxDOT, Drafting the Future, Austin, TX, 2003, p. 9. Online. Available:
http://www.dot.state.tx.us/dtf/DraftingtheFuture.pdf Accessed: September 12, 2003.
80. U.S. DOT Volpe Transportation Center. Public/Private Partnerships:
Implications for Innovation in Transportation, Section II.B., December 1998, Online. Available: http://www.volpe.dot.gov/infosrc/strtplns/nstc/ppp/chp2.html, Accessed: 9/30/03.
81. NCHRP Report 433, Guidelines for Developing and Maintaining Successful
Partnerships for Multimodal Transportation Projects. National Academy Press, Washington, DC, 1999, p. 11.
82. Telephone conversation between TTI staff and Mario Medina, Director of
TxDOT Multimodal Section, October 16, 2003. 83. HB 3588, 78th Legislature, Regular Session, Article 4, Section 91.002. 84. HB 3588, 78th Legislature, Regular Session, Article 4, Section 91.005. 85. HB 3588, 78th Legislature, Regular Session, Article 4, Section 91.071(b). 86. Trains.com Newswire. “BNSF’s Rose: Private-Public Partnerships are a Win-Win
for Railroads, States.” Online. Available: www.trains.com. 87. Davidson, Dick, Chairman, Union Pacific Corporation. Letter to Representative
Eddie Bernice Johnson, August 21, 2001. 88. Pachl, Joern. Railway Operation and Control. Mountlake Terrace, WA: VTD Rail
Publishing, 2002.

Texas Transportation Institute 132 Multimodal Freight Transportation Programs
89. Muller, Gerhardt. Intermodal Freight Transportation. 4th Edition. Eno
Transportation Foundation and Intermodal Association of North America. Washington, D.C., 1999.
90. UP Intermodal Glossary. Union Pacific Railroad. Online. Available:
www.up.com. 91. Sullivan, William, et. al. Engineering Economy. 12th Edition. New Jersey:
Pearson Education, Inc., 2003. 92. General Code of Operating Rules. 4th Edition. Washington, D.C., 2000. 93. Wegmann, Frederick, et. al. Characteristics of Urban Freight Systems. Report
DOT-T-96-22. U.S. Department of Transportation. Washington, D.C., December 1995.
