enhancing a vehicle re-identification methodology based on
TRANSCRIPT

Enhancing a Vehicle Re-Identification Methodology
based on WIM Data to Minimize the Need for
Ground Truth Data
Andrew P. Nichols, PhD, PE Director of ITS, Rahall Transportation Institute
Associate Professor, Marshall University
Mecit Cetin, PhD Director, Transportation Research Institute (TRI)
Associate Professor, Old Dominion University
Chih-Sheng “Jason” Chou, PhD ITS Research Associate, RTI

Presentation Overview
Background
Overall research objective
In-pavement WIM systems
Previous related research
Re-Identification methodology
Methodology shortcomings
Methodology Enhancements
Case Study
Comparison of results
Application of re-identification for WIM calibration
Summary

Background
Overall Research Objective
Identify individual commercial vehicles at multiple
locations along a route by matching its axle attributes
(number, spacing, weight) measured by weigh-in-motion
(WIM) or automated vehicle classification (AVC) stations
Applications
Travel time estimation
Origin-destination flows
Sensor accuracy assessment

Background
In-Pavement Weigh-in-Motion Systems
In-pavement sensors and roadside equipment
Inductive loops (speed and vehicle length)
Piezometer (axle spacing and weight)
Bending plate (weight)
Load cell (weight)
Pertinent Output
Speed
Axle-to-Axle Spacing
Axle Weight
Vehicle Classification (based on scheme and axle attributes)

Background
Research on Re-Identification of Vehicles
Automatic Vehicle Identification (AVI)
Transponder
Automatic License Plate Recognition
Bluetooth
Wi-fi
Indirectly through Sensor Outputs
Vehicle Length from Inductive Loops
Inductive Loop Signature
Video Imagery
Weigh-in-Motion

Background
Re-Identification Research by Authors
Based WIM/AVC Data
2006 NATMEC - “Utilizing Weigh-in-Motion Data for Vehicle
Re-Identification.”
2007 TRB - “Commercial Vehicle Re-identification Using WIM
and AVC Data.”
2009 TRB - “Improving the Accuracy of Vehicle Re-identification
Algorithms by Solving the Assignment Problem.”
2010 TRB - “Bayesian Models for Re-identification of Trucks
over Long Distances Based on Axle Measurement Data.”
2014 TRB - “Re-identification of Trucks Based on Axle Spacing
Measurements to Facilitate Analysis of Weigh-in-Motion
Accuracy.”

Background
Ongoing Research
2012 SBIR Project 12.2-FH4-007
Title: Tracking Heavy Vehicles based on WIM and Vehicle
Signature Technologies
Awardee: CLR Analytics Inc.
Status: Phase 1 complete, awaiting Phase 2
Methodology: Combine re-identification algorithm based on
axle attributes (from WIM or AVC) with re-identification
algorithm based on inductive loop signatures to be able to
match individual vehicles at WIM and/or AVC stations

Background
Re-Identification Methodology
Step 1. Bayesian Model Training and Calibration
Determine Probability Distribution Functions (PDFs) based on
“known” matches between a pair of WIM stations
PDFs developed for Axle Spacing and Vehicle Length
Accounts for difference in speed calibration
LengthUpstream – LengthDownstream
LengthDownstream
Densi
ty
Vehicle Length
Average = +0.4%
Std Dev = 1.7%

Background
Re-Identification Methodology
Step 2. Search for Vehicle Crossing Upstream WIM at
Downstream WIM (re-identification)
Define Search Space (SS) based a travel time window between
the two WIM stations
Calculate the probability (Bayes theorem) of a match between
the upstream vehicle and each vehicle in the downstream SS
Assign as a match, the vehicle from downstream SS that yielded
the largest probability
Minimum probability thresholds can be defined per application
Higher probability threshold – fewer matches but higher reliability
Lower probability threshold – more matches but less reliability
Background
Re-Identification Methodology
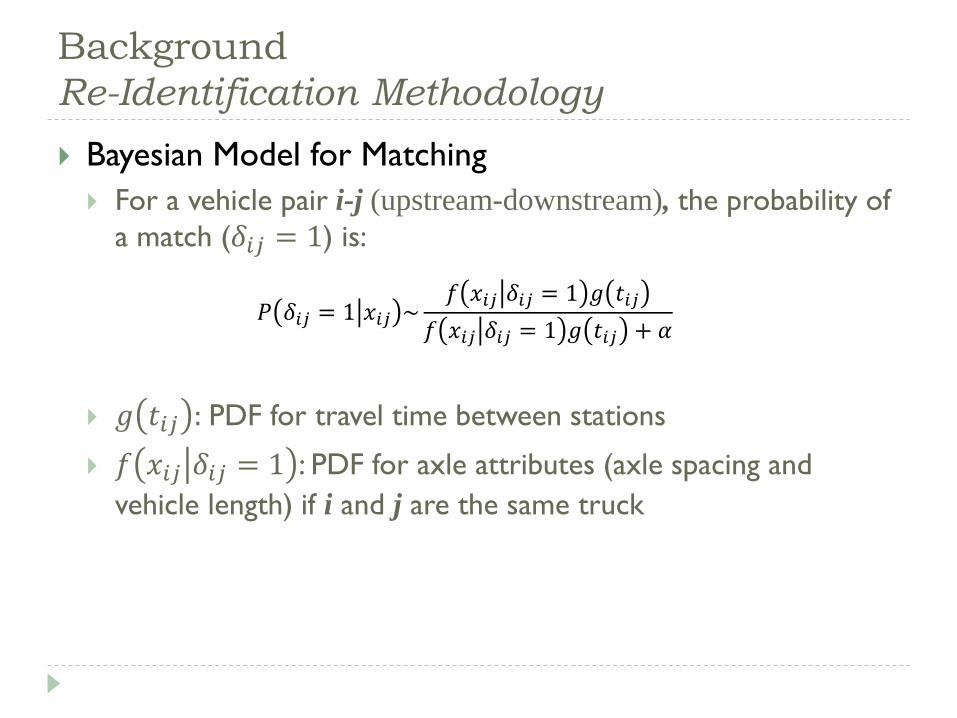
Bayesian Model for Matching
For a vehicle pair i-j (upstream-downstream), the probability of
a match (𝛿𝑖𝑗 = 1) is:
𝑔 𝑡𝑖𝑗 : PDF for travel time between stations
𝑓 𝑥𝑖𝑗 𝛿𝑖𝑗 = 1 : PDF for axle attributes (axle spacing and
vehicle length) if i and j are the same truck
𝑃 𝛿𝑖𝑗 = 1 𝑥𝑖𝑗 ~𝑓 𝑥𝑖𝑗 𝛿𝑖𝑗 = 1 𝑔 𝑡𝑖𝑗
𝑓 𝑥𝑖𝑗 𝛿𝑖𝑗 = 1 𝑔 𝑡𝑖𝑗 + 𝛼

Background
Methodology Shortcomings
Model training accounts for calibration variations between
stations, and is therefore needed for each pair of stations being
used for re-identification
Models are trained using the WIM measurements of known
vehicle matches (ground truth)
Manual Video Analysis – Roadside cameras at 2 WIM systems 1 mile
apart in Indiana. Manually match same vehicle in videos.
Automatic Transponder – Oregon commercial vehicle transponder
program and readers at 14 WIM systems statewide. Transponder ID
captured in WIM record.
Manual Data Analysis – Manual analysis of likely “matches” based on
expected travel time between 2 WIM stations and WIM axle
measurements to identify high correlations. Applied to WV data.
Background
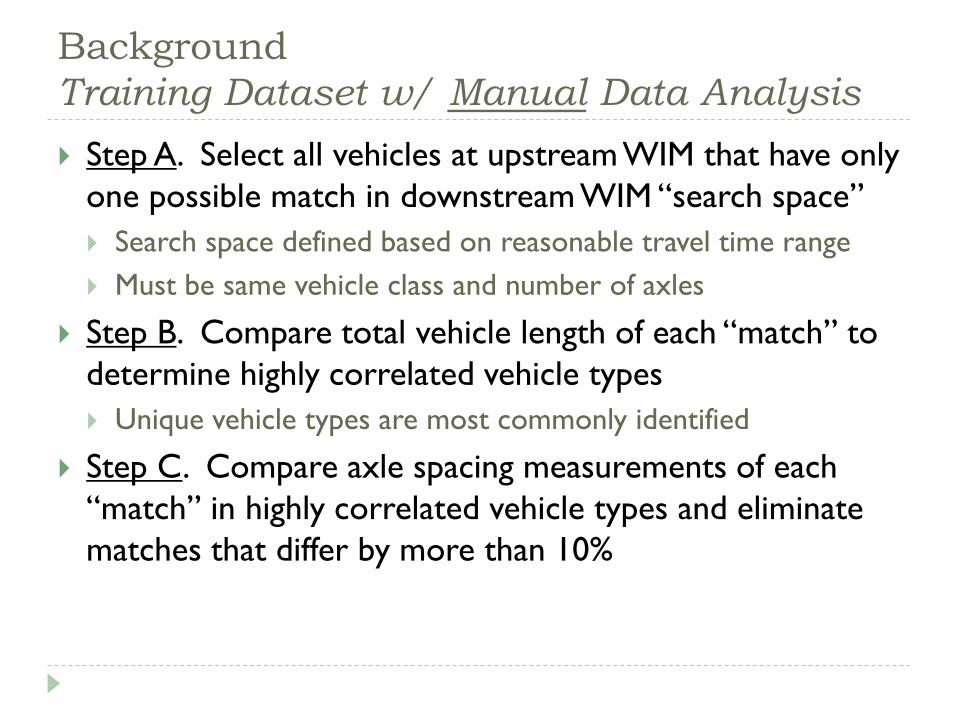
Training Dataset w/ Manual Data Analysis
Step A. Select all vehicles at upstream WIM that have only
one possible match in downstream WIM “search space”
Search space defined based on reasonable travel time range
Must be same vehicle class and number of axles
Step B. Compare total vehicle length of each “match” to
determine highly correlated vehicle types
Unique vehicle types are most commonly identified
Step C. Compare axle spacing measurements of each
“match” in highly correlated vehicle types and eliminate
matches that differ by more than 10%

Background
Training Dataset w/ Manual Data Analysis
Technique applied to 2 WIM stations in West Virginia
Step A. 862 vehicles at upstream WIM with single match
at downstream WIM
Step B. Vehicle types with highest correlation
Class 10 with 7+ axles (n = 9)
Class 12 or 13 (n = 27)
Class 15 with 6+ axles (n = 16)
Step C. 3 suspected outliers
removed based on axle
spacing analysis
Upstream
Axle 1-2 Spacing (ft)
Dow
nst
ream
Axle
1-2
Spac
ing
(ft)

Background
Methodology Shortcomings
“Single Window” search space
Applies to Step 1 (Training w/ Manual Data Analysis) and Step 2
(Re-identification)
Search for best upstream vehicle match @ downstream WIM
Two or more upstream vehicles may get matched
to the same downstream vehicle
All vehicles are matched including
those with a low probability
5
Upstream Vehicle (i)
Downstream Vehicle (j)
6
SS5
SS6 𝑥𝑖,𝑗 = .6
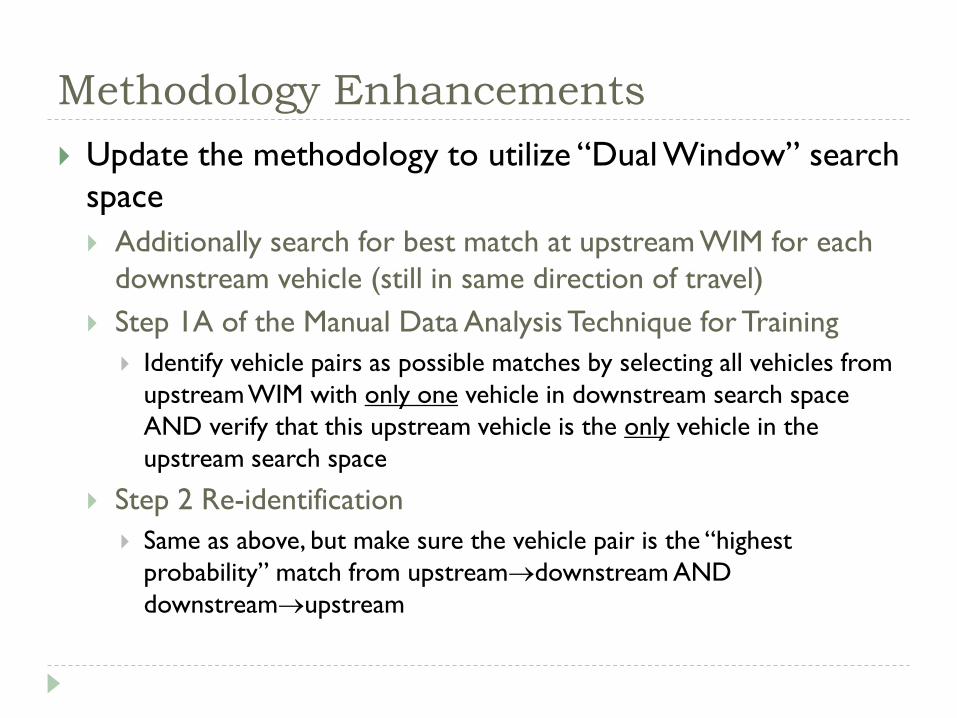
Methodology Enhancements
Update the methodology to utilize “Dual Window” search
space
Additionally search for best match at upstream WIM for each
downstream vehicle (still in same direction of travel)
Step 1A of the Manual Data Analysis Technique for Training
Identify vehicle pairs as possible matches by selecting all vehicles from
upstream WIM with only one vehicle in downstream search space
AND verify that this upstream vehicle is the only vehicle in the
upstream search space
Step 2 Re-identification
Same as above, but make sure the vehicle pair is the “highest
probability” match from upstreamdownstream AND
downstreamupstream
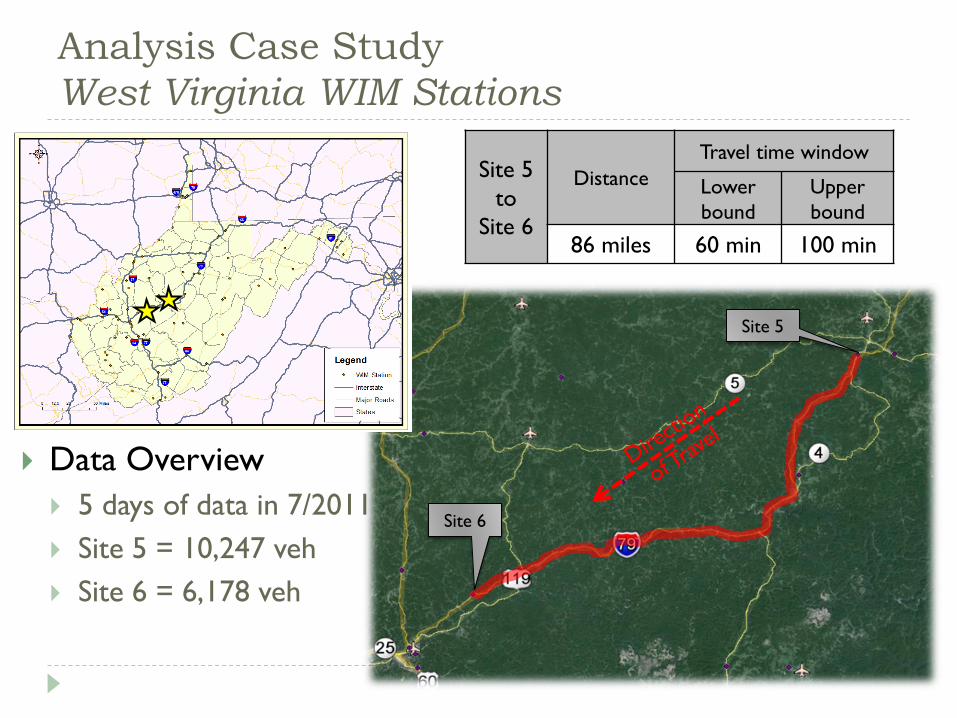
Analysis Case Study
West Virginia WIM Stations
Data Overview
5 days of data in 7/2011
Site 5 = 10,247 veh
Site 6 = 6,178 veh
Site 5
Site 6
Site 5
to
Site 6
Distance Travel time window
Lower
bound Upper
bound
86 miles 60 min 100 min

Step 1A. Training Comparison
Single vs. Dual Window Results
Identify pairs with only 1 possible match in search space
based on vehicle class and number of axles only
All Class 9
eliminated
from Training

Step 1B/1C. Training Comparison
Single vs. Dual Window Results
Eliminate pairs where vehicle length and axle spacing are
> ±10%
Most blue
dots along
45º line
Total Vehicle Length
Comparison

Step 1B/1C. Training Comparison
Single vs. Dual Window Results
Eliminate pairs where vehicle length and axle spacing are
> ±10%
Most blue
dots along
45º line
Axle 1-2 Spacing
Comparison

Step 1. Training Comparison
Single vs. Dual Window Results
Probability Distribution Function Comparisons
(Upstream-Downstream)/Downstream
Standard Deviations decrease from Single to Dual
Single Window
(5→6) Dual Window
# of Vehicle Pairs w/in ±10% 161 82
Vehicle Length PDF Mean -1.1% -0.5%
Std Dev 3.1% 2.6%
Axle 1-2 Spacing PDF Mean +1.2% +1.3%
Std Dev 3.2% 2.0%

Step 2. Re-Identification
Single vs. Dual Window Results
Bayesian probabilities of a match
Probability
Fre
quency
Single Window n = 4,917
Dual Window n = 3,325
Probability
Probability
Single Window Only n = 1,592

Application of Re-Identification Results
Utilized matched vehicles using Dual Window
For WIM calibration assessment, matches with high
probabilities (>98%) were used for this analysis
Can be used to assess differential calibration between Site
5 and Site 6 in southbound direction
Vehicle length used to compare (inductive) loop spacing
calibration (distance between leading edge)
Axle spacing used to compare axle sensor calibration (distance
between sensors)
Axle weight used to compare axle weight calibration

Application of Re-Identification Results
Vehicle Classification of Matches
Majority of
matched vehicles
are Class 9
Used for Calibration Assessment

Application of Re-Identification Results
Comparison of Vehicle Lengths (Class 9-12)
Very close
calibration

Application of Re-Identification Results
Comparison of Axle Spacing (Class 9-12)
Very close
calibration

Application of Re-Identification Results
Comparison of Axle Weights (Class 9-12)
Intercept = 0
Axle 2
consistently
heavier than
Axle 3
Axle 2
heavier
upstream
compared to
Axle 3
Upstream
~10% heavier
Not much
“spread” in
Axle 1

Summary
Model Training with manual data analysis increases the
applicability of the re-identification methodology
Dual window search space helps eliminate unlikely
matches in both the training and re-identification steps
Attributes of re-identified vehicles can be used to
compare the relative calibration of two WIM sites
Perhaps field calibration can be performed at a few reference
sites and calibration checked at other sites through re-
identification
Axle weight comparisons could be utilized to improve portable
WIM if two sensors/systems placed side-by-side (rather than
averaging the two weights)

Summary of Case Study Findings
Vehicle length and axle spacing calibrations were very
close
Based on axle weight comparisons, there appear to be
some possible outliers or mis-matched vehicles
Axle 1 weights do not vary enough to reliably estimate
the differential weight calibration
Axle weight calibration varied across different axles, but
upstream WIM appeared to weigh ~10% heavier than
downstream WIM based on Axles 3-5
Axle 2 weights tended to be heavier than Axle 3 weights
Axle 4 and 5 didn’t have same relationship