enhanced fmea for supply chain risk identification
TRANSCRIPT
Enhanced FMEA for Supply Chain RiskIdentification
Lu Lu1, Zhou Rong1, Robert de Souza1
1 – National University of Singapore
Supply chain risk identification is fundamental for supply chain risk management.Its main purpose is to find critical risk factors for further attention. The failuremode effect analysis (FMEA) is well adopted in supply chain risk identification forits simplicity. It relies on domain experts’ opinions in giving rankings to risk factorsregarding three decision factors, e.g. occurrence frequency, detectability, andseverity equally. However, it may suffer from subjective bias of domain expertsand inaccuracy caused by treating three decision factors as equal. In this study,we propose a methodology to improve the traditional FMEA using fuzzy theoryand grey system theory. Through fuzzy theory, we design semantic items, whichcan cover a range of numerical ranking scores assessed by experts. Thus, differ-ent scores may actually represent the same semantic item in different degreesdetermined bymembership functions. In this way, the bias of expert judgementcan be reduced. Furthermore, in order to build an appropriate membership func-tion, experts are required to think thoroughly to provide three parameters. As theresults, they are enabled to givemore reliable judgement. Finally, we improve theranking accuracy by differentiating the relative importance of decision factors.Grey system theory is proposed to find the appropriate weights for those decisionfactors through identifying the internal relationship among them represented bygrey correlation coefficients. The results of the case study show the improvedFMEAdoes produce different rankings from the traditional FMEA. This is meaningful foridentifying really critical risk factors for further management.
Keywords: supply chain risk identification; FMEA; grey system theory; fuzzy settheory
First recieved: 01.Jul.2018 Revised: 10.Jul.2018 Accepted: 15.Jul.2018
311
Enhanced FMEA for Supply Chain Risk Identification
1 Introduction
Risk identification involving both risk classification and risk ranking canbe seen asa fundamental work for risks assessment. It identifies critical risks that need fur-ther assessment and treatment (Berman and Putu, 2012). Generally, researcherscategorize risks into several groups for systematically risk identification. In ourstudy, risks are classified into three levels—themacro level, the company leveland the industry level. Risks on the macro level may influence the whole supplychain’s operation; risks on the company level are from operation activities of acompany; risks on the industry level are from the development of industry (Zhouet al., 2012).
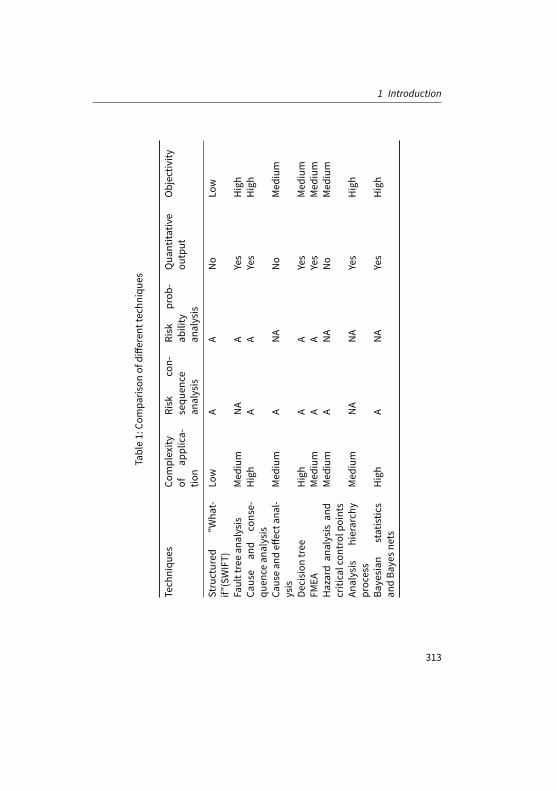
Subsequently, we still need to identifymost relevant risk factors so that only thoserelevant and important ones are studied further. As a large number of risk factorsthat may be involved, the easiest way is through risk ranking so that a companycan effectively mitigate them (Chopra and Sodhi, 2004). A comparison of nine riskranking techniques is shown in Table 1, where techniques are compared in fiveattributes—complexity of application, risk consequence analysis, risk probabilityanalysis, quantified output, and objectivity.
312
1 Introduction
Table1:Co
mpa
rison
ofdiffe
rent
tech
niqu
es
Tech
niqu
esCo
mplexity
ofap
plica-
tion
Risk
con-
sequ
ence
analysis
Risk
prob
-ab
ility
analysis
Qua
ntita
tive
output
Objectiv
ity
Structured
”Wha
t-if”
(SWIFT)
Low
AA
No
Low
Faulttreean
alysis
Med
ium
NA
AYes
High
Cause
and
conse-
quen
cean
alysis
High
AA
Yes
High
Causean
deff
ecta
nal-
ysis
Med
ium
ANA
No
Med
ium
Decision
tree
High
AA
Yes
Med
ium
FMEA
Med
ium
AA
Yes
Med
ium
Hazardan
alysis
and
criticalcon
trol
points
Med
ium
ANA
No
Med
ium
Analysis
hierarch
yprocess
Med
ium
NA
NA
Yes
High
Bayesian
statistic
san
dBa
yesn
ets
High
ANA
Yes
High
313
Enhanced FMEA for Supply Chain Risk Identification
According to the above table, risk ranking techniques can be classified into fourbig categories. The first category is a supporting method, which can only give ageneral analysis about the risks. For example, SWIFT uses a series of “What if”questions to identify the deviations from normal conditions with the help of apredefined checklist. The second category uses scenario analysis, which is goodatanalyzing the causes of risks. Fault tree analysis, cause and consequence analysis,cause and effect analysis, and decision tree belong to this category (Dakas et al.,2009, Hauptmanns, 2010, HichemandPepijn, 2007). The third category is functionanalysismethod including FMEA, hazard analysis, and critical control points. Theyfocus on analyzing the effects of risks. The final category is the statistical method,which applies the statistical knowledge into the analysis process. AHP and BBNbelong to this category.
FMEA has been adopted widely as it can produce quantitative output, which isdesirable for risk ranking. However, it may be biased as the opinions of domainexperts can be subjective. The target of the current study is to improve FMEA forits objectivity using fuzzy set theory and grey system theory.
The structure of the paper is as follows. The next section describes the traditionalFMEA; section 3 presents the enhanced FMEA. A case study is provided in section 4.Finally, conclusions are made in section 5.
2 The Traditional FMEA
FMEA identifies failure modes andmechanisms as well as their effects. There areseveral types of FMEA, e.g. design FMEA, system FMEA, process FMEA, serviceFMEA, software FMEA, etc. The current study adopts the FMEAmethodology. Inthe study, the systemmeans the supply chain while the failure mode refers to thepotential supply chain risk. For each risk, experts give three scores between oneand ten regarding the risk’s occurrence frequency (OF), detectability and severity.Then the risk priority number (RPN) can be calculated throughmultiplying thesethree score and represents the risk impact of the risk factor. The higher is the RPN,the more critical is the risk.
314

2 The Traditional FMEA
Table 2: Scores marked by experts
Risk Experts OF Detectability Severity
Risk 1 B1 4 5 9B2 5 1 5B3 2 2 8Average 3.7 2.7 7.3
Risk 2 B1 9 3 4B2 6 2 2B3 8 3 5Average 7.7 2.7 3.7
2.1 An Example
We assume that there are three domain experts—B1, B2 and B3, who give ranksregarding the risk impacts of two risk factors: risk 1 and risk 2 in a scale of 1 to 10.The greatest rank, 10, refers to the greatest risk impact. The summary of scoresmarked by experts is shown in Table 2.
Then, using the average numbers of three experts’ rankings, RPNs for risks 1 and2 can be calculated as RPN1=3.7*2.7*7.3=7.3 and RPN2=7.7*2.7*3.7=7.7, respec-tively. Since RPN2 is greater than RPN1, risk 2 is more risky than risk 1 accordingto those three experts.
2.2 Limitations of Traditional FMEA
Through the above example, three limitations of the traditional FMEA can berecognized. Firstly, there may be ranking differences among experts, which canlead to the inaccuracy of outcomes. For example, for the same degree of riskimpact, expert B1 may score 9 while expert B2 scores 7. Secondly, the approachdepends on the experience and knowledge of experts to a large degree and theoutcome can be very subjective. Finally, the RPN formula above does not considerthe relative importance of three decision factors. The severity of a risk factor couldbemore important than OF or detectability while in the current approach, threedecision factors are treated as equal. As a result, the above RPNmay not be ableto give accurate risk rankings.
315

Enhanced FMEA for Supply Chain Risk Identification
3 Improved FMEA
To reduce the limitations of the traditional FMEA, we propose to improve it usingfuzzy set theoryandgrey relationanalysis. Theprimaryprocedureof the improvedFMEA is as follows.
— Identify the relevant risk factors (regarding the risk categories) and do-main experts.
— Reduce the expert bias using Fuzzy Set theory.
— Experts reach consensus for each risk.
— Improve assessment precision through Grey Correlation Analysis.
— Ranking risk factors.
Specially, we use Fuzzy Set theory in step 2 to reduce experts’ ranking differenceand Grey Correlation Analysis in step 4 to improve assessment precision throughapplying appropriate weightages to decision factors.
3.1 Fuzzy Set
In the classical discrete sets, an element either belongs to a set or it does not. Butfor fuzzy sets, their elements have degrees of membership according to certainmembership functions (Abdelgawad and Fayek, 2011). There are many types ofmembership functions based on the graphs, e.g. triangular, trapezoidal, Gaussian,generalized bell, sigmoid, and others. We choose the triangular membershipfunction to improve the traditional FMEA. A triangular membership function isspecified by three parameters, a, b, and c in formula (1):
M(x) =
0, x ≤ ax−ab−a
, a ≤ x ≤ b
x−ab−a
, b ≤ x ≤ c
0, c ≤ x
(1)
316

4 Case Study
whereM refers to themembership of score x. The value of themembership rangesfrom 0 to 1. The value of 1 represents the full membership.
3.2 Grey Relation Analysis
Grey system theory was first developed in 1982 (Deng, 1982). A grey systemgenerally refers to a system lacking certain information, e.g. structure message,operationmechanism, or behavior document. The aims of the grey system theoryare to provide theory, techniques, notions and ideas for resolving latent andintricate systems (Deng, 1982). This study adopts the grey relation analysis, whichdescribes the relationships between one main factor and all the other factors in agiven system. The degree of correlation among different factors is measured bytheir grey correlation coefficient. The greater is the value of coefficient, the closerrelationship is between the two factors.
4 Case Study
In this section, we use a case study to improve the traditional FMEA through theproposedmethodology. Assuming there are three risk factor, e.g. rawmaterialshortage, labour availability, and natural disaster as well as three experts, e.g.B1, B2, B3, the ranking process follows the five steps illustrated in sections 4.1 to4.5.
4.1 Identify the Relevant Risks List and Experts
Table 3 summarizes the risk factors and experts, which are identified for theranking process.
Risks identified are rawmaterial shortage (R1), labor availability (R2), and naturaldisaster (R3) while three experts, B1, B2 and B3 are from supply chain, operation,and R&D departments, respectively.
317

Enhanced FMEA for Supply Chain Risk Identification
Table 3: Risks and experts identified
Potential Risks Experts Department
Rawmaterial shortage (R1) B1 Supply chain department
Labor availability (R2) B2 Operation department
Natural disaster (R3) B3 R&D department
4.2 Reduce Experts Bias Using Fuzzy Set Theory
The process of reducing expert bias (ranking difference) includes 1) setting up thefuzzy semantic assessment set, 2) determiningmembership functions for fuzzysemantic items, and 3) calculating specific numbers for fuzzy semantic itemsthrough defuzzification.
4.2.1 Set up the fuzzy semantic assessment set (Faisal and Sarah, 2015)
In the study, the fuzzy semantic assessment set is designed to include the sematicitems of “very high”, “high”, “medium”, “low”, and “very low”. The implications ofthe five semantic items in terms of three decision factors, occurrence frequency,detectability, and severity are illustrated in Table 4.
The definitions of semantic items can guide experts to score a risk factor. In theabove table, the semantic item “very high” means “occurs in high frequency” foroccurrence frequency, “very hard to detect” for detectability, and “lead to failureof whole supply chain” for severity.
The purpose of the fuzzy sematic assessment set is to provide a few number ofsemantic items like “very high”, “high”, etc. to reflect experts’ numerical rankingsfrom 1-10. For example, given the same level of risk impact, different experts maygive different numerical scores of “7” or “9”. But in terms of semantic items, thesescores can be translated to either “high” or “very high” with certain degrees ofmembership. In this way, the ranking difference, e.g. the bias of experts can bereduced.
318

4 Case Study
Table 4: Implication of semantic items
Semantic items Occurrencefrequency Detectability Severity
Very high Occurs in highfrequency
Very hard todetect
Lead to failure ofwhole supplychain
High Occursfrequently Hard to detect
Lead to thefailure of criticalparts of supplychain
Medium Occursoccasionally
Can be detectedoccasionally
Lead to thefailure ofnon-essentialparts of supplychain
Low Occurs in lesstimes relatively Easy to detect
A little influenceon the supplychain
Very Low Unlikely to occur Very easy todetect
Mainly noinfluence on thesupply chain
319

Enhanced FMEA for Supply Chain Risk Identification
4.2.2 Determine membership functions of fuzzy semantic items
Themembership functions for the five semantic items, “very low (VL)”, “low (L)”,“medium (M)”, “high (H)”, and “very high (VH)” are given in Figure 1 regardingequation (1).
M
1.0
Mem
ber
ship
G
rad
es
Figure 1: The structure of membership functions
Each membership function is determined by three parameters describing therange of membership. For example, risk factors with scores from al to cl canbe generally considered as low risk factors. Score bl represents full “low risky”membership. For risk factors with scores close to al become less “low” but more“very low” risky. Similarly, those with scores close to cl become less “low” butmore “medium” risk. Three parameters determining a membership function areimportant and need domain experts’ inputs to find out their values.
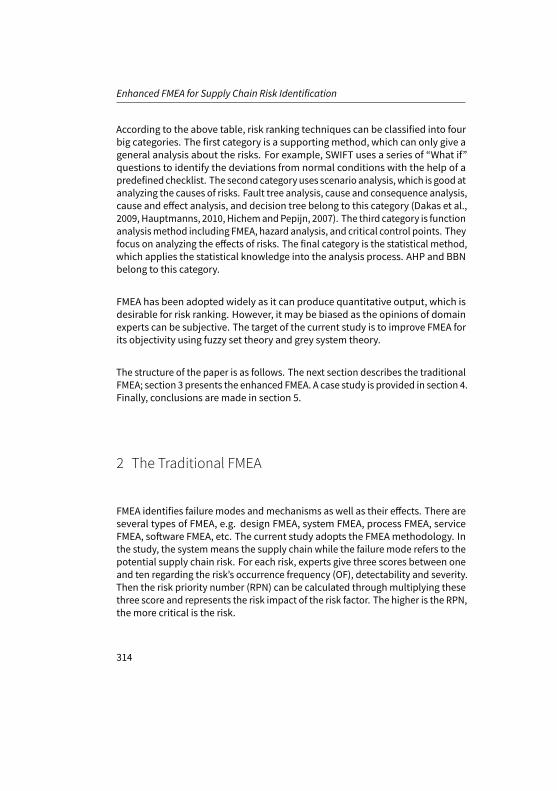
Thus, instead of giving only one number representing absolute “low” risk, anexpert should thinkoverandgivea rangeofnumberswhichcanalsobeconsideredas “low” risk but with different degrees. In this way, experts are enabled to thinkthoroughly and give more feasible ranks of risks. Table 5 collects the inputs ofthree parameters for each semantic item from three experts (B1, B2, and B3). Thelast row is the average of three scores.
Subsequently, we have three parameters for eachmembership function throughTable 5:
— For semantic item “very low”: avl = 0, bvl = 0, cvl = 2.6;
320
4 Case Study
Table 5: Experts’ inputs regarding three parameters
Expert Very low Low Medium High Very high
B1 0, 0, 2.8 1.6, 3.3, 4.8 3.8, 5.8, 7.8 6.8, 8.3, 9.8 8.8, 10,10
B2 0, 0, 2.6 1.2, 3.4, 5.8 3.5, 5.5, 7.6 6.1, 7.8, 9.8 8.6, 10, 10
B3 0, 0, 2.4 1.4, 3.5, 5.1 3.5, 5.5, 8.0 6.6, 8.6, 9.8 8.5, 10, 10
Average 0, 0, 2.6 1.4, 3.4, 5.2 3.6, 5.6, 7.8 6.5, 8.2, 9.8 8.6, 10, 10
— For semantic item “low”: al = 1.4, bl = 3.4, cl = 5.2;
— For semantic item “medium”: am = 3.6, bm = 5.6, cm = 7.8;
— For semantic item “high”: ah = 6.5, bh = 8.2, ch = 9.8;
— For semantic item “very high”: avh = 8.6, bvh = 10, cvh = 10.
4.2.3 Calculate the specific number of fuzzy semantic item
The aim of the current step is to obtain the specific number, representing a se-mantic item in one number. Defuzzification is introduced to transfer the valuesof three parameters into one specific number and the formula (2) adopted is asfollow(Chen, 2010).
I =a+ ab+ c
4(2)
We then have the specific number of each semantic item as follows.
— For semantic item “very low”: Ivl = 0.65;
— For semantic item “low”: Il = 3.4;
321
Enhanced FMEA for Supply Chain Risk Identification
— For semantic item “medium”: Im = 5.7;
— For semantic item “high”: Ih = 8.2;
— For semantic item “very high”: Ivh = 9.7;
In summary, the target of the current step is to reduce bias from experts in twoaspects. On the one hand, we establish a judgment standard using a fuzzy se-mantic assessment set so that we can have the same semantic item (very low,low, medium, high, and very high) from the ranges of scores given by experts. Onthe other hand, in order to establish membership functions, each expert shouldgive three numbers for each fuzzy semantic item describing the extension ofmembership. This enables them to think thoroughly and subsequently reducessubjectivity of judgment.
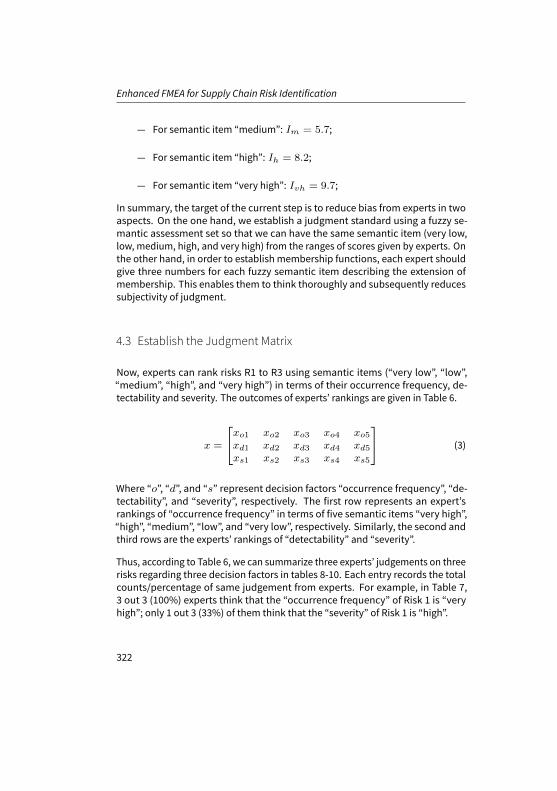
4.3 Establish the Judgment Matrix
Now, experts can rank risks R1 to R3 using semantic items (“very low”, “low”,“medium”, “high”, and “very high”) in terms of their occurrence frequency, de-tectability and severity. The outcomes of experts’ rankings are given in Table 6.
x =
xo1 xo2 xo3 xo4 xo5
xd1 xd2 xd3 xd4 xd5
xs1 xs2 xs3 xs4 xs5
(3)
Where “o”, “d”, and “s” represent decision factors “occurrence frequency”, “de-tectability”, and “severity”, respectively. The first row represents an expert’srankings of “occurrence frequency” in terms of five semantic items “very high”,“high”, “medium”, “low”, and “very low”, respectively. Similarly, the second andthird rows are the experts’ rankings of “detectability” and “severity”.
Thus, according to Table 6, we can summarize three experts’ judgements on threerisks regarding three decision factors in tables 8-10. Each entry records the totalcounts/percentage of same judgement from experts. For example, in Table 7,3 out 3 (100%) experts think that the “occurrence frequency” of Risk 1 is “veryhigh”; only 1 out 3 (33%) of them think that the “severity” of Risk 1 is “high”.
322
4 Case Study
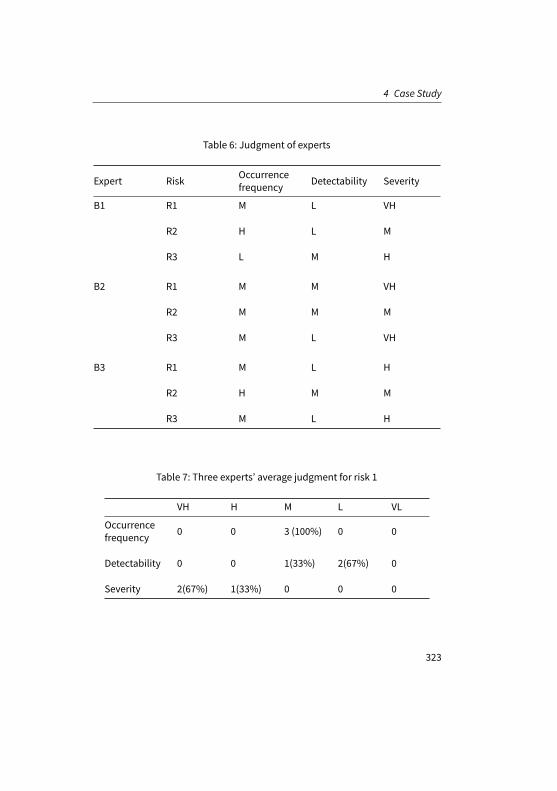
Table 6: Judgment of experts
Expert Risk Occurrencefrequency Detectability Severity
B1 R1 M L VH
R2 H L M
R3 L M H
B2 R1 M M VH
R2 M M M
R3 M L VH
B3 R1 M L H
R2 H M M
R3 M L H
Table 7: Three experts’ average judgment for risk 1
VH H M L VL
Occurrencefrequency 0 0 3 (100%) 0 0
Detectability 0 0 1(33%) 2(67%) 0
Severity 2(67%) 1(33%) 0 0 0
323

Enhanced FMEA for Supply Chain Risk Identification
Table 8: Three experts’ average judgment for risk 2
VH H M L VL
Occurrencefrequency 0 2(67%) 1(33%) 0 0
Detectability 0 0 2(67%) 1(33%) 0
Severity 0 0 3(100%) 0 0
Table 9: Three experts’ average judgment for risk 3
VH H M L VL
Occurrencefrequency 0 0 2(67%) 1(33%) 0
Detectability 0 0 1(33%) 2(67%) 0
Severity 1(33%) 2(67%) 0 0 0
324

4 Case Study
x1 =
x1o1 x
1o2 x
1o3 x
1o4 x
1o5
x1d1 x
1d2 x
1d3 x
1d4 x
1d5
x1s1 x
1s2 x
1s3 x
1s4 x
1s5
=
0 0 1 0 00 0 0.33 0.67 0
0.67 0.33 0 0 0
(4)
x2 =
x2o1 x
2o2 x
2o3 x
2o4 x
2o5
x2d1 x
2d2 x
2d3 x
2d4 x
2d5
x2s1 x
2s2 x
2s3 x
2s4 x
2s5
=
0 0.67 0.33 0 00 0 0.67 0.33 00 0 0 0 0
(5)
x3 =
x3o1 x
3o2 x
3o3 x
3o4 x
3o5
x3d1 x
3d2 x
3d3 x
3d4 x
3d5
x3s1 x
3s2 x
3s3 x
3s4 x
3s5
=
0 0 0.67 0.33 00 0 0.33 0.67 0
0.33 0.67 0 0 0
(6)
Subsequently, the judgment matrices for risks 1, 2 and 3 are listed in matrices of(4) (5) and (6). They represent the rankings from three experts given in terms offive semantic items.
4.4 Improve Precision through Grey System Theory
In the current section, we firstly establish an assessment matrix based on step 3and thena referencematrix using themost risky semantic item. Subsequently, thedegree of relevancy is measured through the grey correlation coefficient. Finally,we apply weights to decision factors (occurrence frequency, detectability, andseverity) to differentiate their relevant importance.
325
Enhanced FMEA for Supply Chain Risk Identification
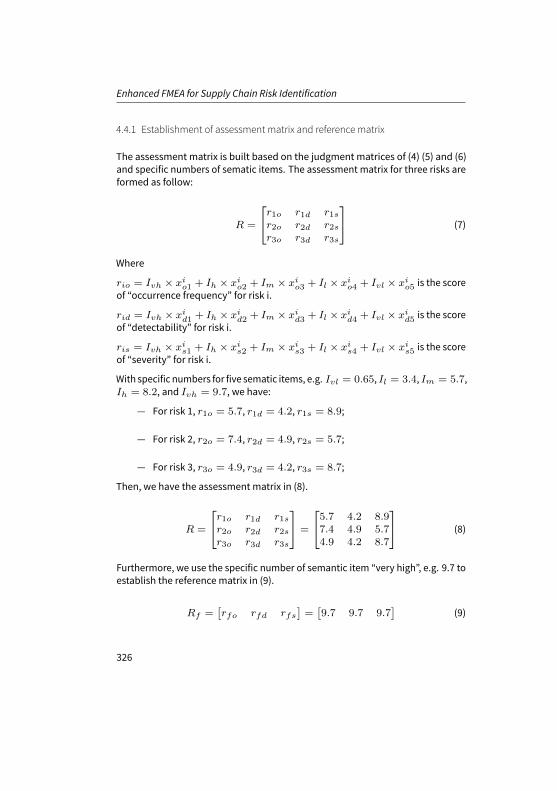
4.4.1 Establishment of assessment matrix and reference matrix
The assessment matrix is built based on the judgment matrices of (4) (5) and (6)and specific numbers of sematic items. The assessment matrix for three risks areformed as follow:
R =
r1o r1d r1sr2o r2d r2sr3o r3d r3s
(7)
Where
rio = Ivh × xio1 + Ih × xi
o2 + Im × xio3 + Il × xi
o4 + Ivl × xio5 is the score
of “occurrence frequency” for risk i.
rid = Ivh × xid1 + Ih × xi
d2 + Im × xid3 + Il × xi
d4 + Ivl × xid5 is the score
of “detectability” for risk i.
ris = Ivh × xis1 + Ih × xi
s2 + Im × xis3 + Il × xi
s4 + Ivl × xis5 is the score
of “severity” for risk i.
With specific numbers for five sematic items, e.g. Ivl = 0.65, Il = 3.4, Im = 5.7,Ih = 8.2, and Ivh = 9.7, we have:
— For risk 1, r1o = 5.7, r1d = 4.2, r1s = 8.9;
— For risk 2, r2o = 7.4, r2d = 4.9, r2s = 5.7;
— For risk 3, r3o = 4.9, r3d = 4.2, r3s = 8.7;
Then, we have the assessment matrix in (8).
R =
r1o r1d r1sr2o r2d r2sr3o r3d r3s
=
5.7 4.2 8.97.4 4.9 5.74.9 4.2 8.7
(8)
Furthermore, we use the specific number of semantic item “very high”, e.g. 9.7 toestablish the reference matrix in (9).
Rf =[rfo rfd rfs
]=
[9.7 9.7 9.7
](9)
326

4 Case Study
This referencematrix represents a very risky situationof a risk factorwhere the “oc-currence frequency”, “detectability”, and “severity” are all “very high” (Table 4).
4.4.2 Calculating the grey correlation coefficient
Nowwith the assessmentmatrix R in (8) and the referencematrixRf in (9), we cancalculate the grey correlation coefficient between them using the grey correlationcoefficient function (10) (Du et al., 2011):
λ(xfj , xij) =
mini|xfj − xij |+v
maxi
|xfj − xij |
|xfj − xij |+vmaxi
|xfj − xij |(10)
Where
i refers to risk i;
j refers to decision factor j;
f refers to the reference matrix entry;
λ(xfj , xij) refers to the grey correlation coefficient of entries xfj andxij ;
υ is the distinguishing coefficient; its value is within [0,1] and normallyv = 0.5.
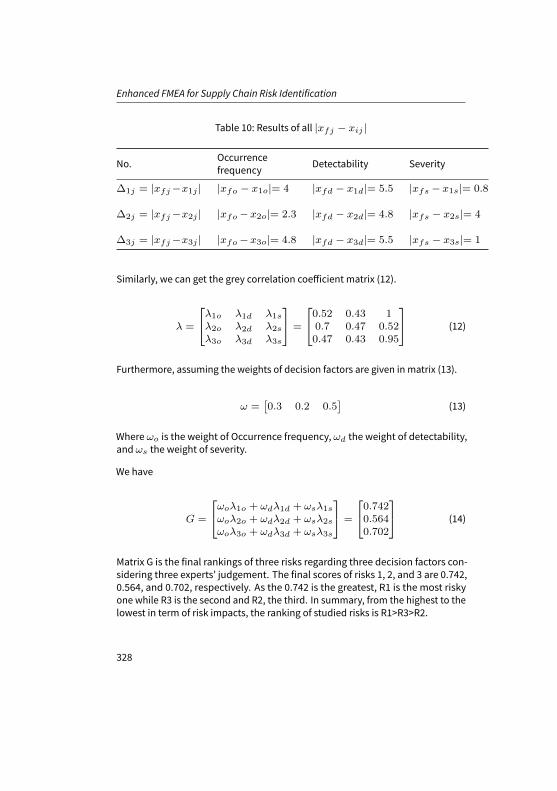
Table 10 presents the results of all |xfj − xij | and the minimal and maximal
values are mini|xf − xi|= 0.8 andmax
i|xf − xi|= 5.5.
Thus, we have
λ1o =
mini|xfj − xij |+
0.5maxi
|xfj − xij |
|xfj − xij |+0.5max
i|xfj − xij |
=0.8 + 0.5× 5.5
4 + 0.5× 5.5= 0.52
(11)
327
Enhanced FMEA for Supply Chain Risk Identification
Table 10: Results of all |xfj − xij |
No. Occurrencefrequency Detectability Severity
∆1j = |xfj−x1j | |xfo − x1o|= 4 |xfd − x1d|= 5.5 |xfs − x1s|= 0.8
∆2j = |xfj−x2j | |xfo −x2o|= 2.3 |xfd − x2d|= 4.8 |xfs − x2s|= 4
∆3j = |xfj−x3j | |xfo −x3o|= 4.8 |xfd − x3d|= 5.5 |xfs − x3s|= 1
Similarly, we can get the grey correlation coefficient matrix (12).
λ =
λ1o λ1d λ1s
λ2o λ2d λ2s
λ3o λ3d λ3s
=
0.52 0.43 10.7 0.47 0.520.47 0.43 0.95
(12)
Furthermore, assuming the weights of decision factors are given in matrix (13).
ω =[0.3 0.2 0.5
](13)
Where ωo is the weight of Occurrence frequency, ωd the weight of detectability,and ωs the weight of severity.
We have
G =
ωoλ1o + ωdλ1d + ωsλ1s
ωoλ2o + ωdλ2d + ωsλ2s
ωoλ3o + ωdλ3d + ωsλ3s
=
0.7420.5640.702
(14)
Matrix G is the final rankings of three risks regarding three decision factors con-sidering three experts’ judgement. The final scores of risks 1, 2, and 3 are 0.742,0.564, and 0.702, respectively. As the 0.742 is the greatest, R1 is the most riskyone while R3 is the second and R2, the third. In summary, from the highest to thelowest in term of risk impacts, the ranking of studied risks is R1>R3>R2.
328

5 Conclusion
4.5 Compare the Traditional and the Improved FMEA
For the assessment matrix R (8), the RPN applying the traditional FMEA is asfollows.
RPN =
r1o × r1d × r1sr2o × r2d × r2sr3o × r3d × r3s
=
5.7× 4.2× 8.97.4× 4.9× 5.74.9× 4.2× 8.7
=
213206179
(15)
Thus, the ranking of risks is R1>R2>R3, which is different from the outcome of theimproved FMEA in matrix (14). The reason is that the improved FMEA considersweights (matrix (13)) for three decision factors.
Furthermore, if we directly include those weights into the assessment matrix (8)without applying the grey correlation coefficient. The result is as follows.
RPN1 =
5.7× 0.3× 4.2× 0.2× 8.9× 0.57.4× 0.3× 4.9× 0.2× 5.7× 0.54.9× 0.3× 4.2× 0.2× 8.7× 0.5
=
6.396.185.37
(16)
The new ranking becomes the same as the one from the traditional FMEA, e.g.R1>R2>R3, but different from the improved FMEA. This emphasizes the impor-tance of including the grey correlation coefficient in allocating appropriate weigh-tages to decision factors.
5 Conclusion
In this study, themethodology to improve FMEA for supply chain risk identificationis proposed in order to reduce the bias from domain experts and improve theranking accuracy.
First of all, the subjective bias in ranking from experts can be reduced throughestablishing semantic items, which are linked to numerical scores through fuzzymembership functions. In this way, even though experts give difference scores forthe same level of risk impact, those scores can still represent the same semanticmeaning, perhaps in different degrees. In this way, the bias from experts can bereduced.
329

Enhanced FMEA for Supply Chain Risk Identification
Furthermore, in order to build a membership function, three parameters are re-quested to represent the coverage of a semantic item in terms of numerical scores.This enables experts to think thoroughly and further improves the reliability oftheir judgement.
Finally, in the traditional FMEA, decision factors are treated equally in their rolesto determine the impact of a risk. This may not rational. In the improved FMEA,we differentiate the importance of decision factors in ranking risk impacts. Thegrey correlation coefficient is adopted to extract appropriate weights for decisionfactors. This further improves the accuracy of the ranking.
References
Abdelgawad, M. and A. Fayek (2011). “Fuzzy reliable analyzer:quantitative assessment of riskevents in the construction industry using fuzzy fault-tree analysis”. In: Journal of ConstructionEngineering and Management 137.4, pp. 294–302.
Berman, K. and D. K. Putu (2011). “SCRIS: a knowledge-based system tool for assisting manufac-turing organizations in identifying supply chain risks”. In: Journal of Manufacturing TechnologyManagement 23.7, pp. 834–852.
Chen, M. S. (2010). “Evaluating the rate of aggregative risk in software development using fuzzyset theory”. In: Cybernetics and Systems: An International Journal 30.1, pp. 57–75.
Chopra, S. andM. S. Sodhi (2004). “Managing risk to avoid supply chain breakdown”. In:MIT SloganManagement Review 46.1, pp. 53–62.
Dakas, I. M., D. A. Karras, and D. C. Panagiotakopoulos (2009). “Fault tree analysis and fuzzy expertsystems: early warning and emergency response of landfill operations”. In: EnvironmentalModeling & Software 24.1, pp. 8–25.
Deng, J. (1982). “Control problems of grey systems”. In: Systems and Control Letter 5, pp. 288–294.Du, D. L., J. Qiu, and H. Y. Zhao (2011). “Risk assessment study of manufacturing green supply
chain based on grey theory”. In: 2011 China located International Conference on InformationSystems for Crisis Response and Management.
Faisal, A. and L. S. Sarah (2015). “A fuzzy-based integrated framework for supply chain risk assess-ment”. In: International journal of production economics 161, pp. 54–63.
Hauptmanns, U. (2010). “A decision-making framework for protecting process plants from floodingbased on fault tree analysis”. In: Reliability Engineering & Sytem Safety 95.9, pp. 970–980.
Hichem,B. andC.Pepijn (2007). “Dynamic fault treeanalysis using input/output interactivemarkovchains. dependable systems and networks”. In: Internal Conference on 37th Annual IEEE/IFIP,pp. 708–717.
Zhou, R., R. De Souza, and M. Goh (2013). “Risk management of complex supply chains part 1:Supply chain risk and complex systems”. In: Vol. 12-Nov-SCI-09.
330