english intelligibility issues in outsourcing of marketing
TRANSCRIPT

St. Cloud State UniversitytheRepository at St. Cloud State
Culminating Projects in English Department of English
12-2018
English Intelligibility Issues in Outsourcing ofMarketing and Call CentersEunice Gyamerah
Follow this and additional works at: https://repository.stcloudstate.edu/engl_etds
This Thesis is brought to you for free and open access by the Department of English at theRepository at St. Cloud State. It has been accepted forinclusion in Culminating Projects in English by an authorized administrator of theRepository at St. Cloud State. For more information, please [email protected].
Recommended CitationGyamerah, Eunice, "English Intelligibility Issues in Outsourcing of Marketing and Call Centers" (2018). Culminating Projects inEnglish. 148.https://repository.stcloudstate.edu/engl_etds/148

English Intelligibility Issues in Outsourcing of Marketing and Call Centers
by
Eunice Gyamerah
A Thesis
Submitted to the Graduate Faculty of
St. Cloud State University
in Partial Fulfillment of the Requirements
for the Degree of
Master of Science in
English: .Teaching English as a Second Language
December 2018
Committee Members:
Ettien Koffi, Chairperson
Ramon Serrano
Paula Weber

2
Abstract
Worldwide, most multinational companies have outsourced their call centers in India, the
premiere outsourcing destination of services. However, some U.S. companies have brought back
their outsourced services in response to U.S. customers’ complaints of communication
breakdowns in their phone interactions with Indian call agents.
This thesis researches English intelligibility issues of outsourced telemarketing and call centers
in India. The observations made in the thesis extend to all call agents originally from the Outer
Circle of English countries, part of the three Concentric Circles of World Englishness model
developed by Kachru (1975). English in Outer circle countries serves as lingua franca, though
still spoken as a second language.
This thesis primarily focuses on Indian call centers’ interactions with customers. Essentially, it
examines issues at the interface of English as lingua franca and business communication. It
addresses the following research questions: 1) what are the intelligibility issues that consumers
face when interacting over the phone with Indian accented English? 2) What are the specific
features in the Indian accent that cause intelligibility issues for American callers? 3) What are
outsourcing companies doing to meet these challenges?
The first question is regarding the types of intelligibility issues that consumers face when they
interact with Indian English speakers over the phone. The second question examines the specific
features in the Indian-accented English which cause intelligibility issues for American callers.
The third question considers some specific training strategies, such as accent neutralization, that
U.S. outsourcing multinationals have implemented to address issues of intelligibility as well as
communication breakdowns.
Before tackling these questions, a brief background on outsourcing and call centers is presented.
Next, economic ramifications of U.S. call centers in India as well as why some U.S. companies
have brought back their call centers are examined. The main part of the thesis will focus on
segmental issues that impede intelligibility. Confusion and phonological data will be presented
and discussed.

3
Acknowledgments
First and foremost, I would like to thank my thesis committee: Dr. Koffi, whose immense
patience has guided me through the elaboration of my thesis; Dr. Serrano, who has encouraged
me and supported me; and Dr. Weber, whom I met by accident, and who graciously agreed to be
part of my thesis committee. I would like to thank Dr. Robinson, my graduate advisor, who has
made it possible for me to complete my graduate program. Also, I would like to thank Corey
Fitzgerald, and Ms. Rhoda Fitzgerald.
I am grateful to have amazing friends who have asked about the progress of my thesis;
especially, my best friend who has taken his time to read and proofread my thesis. I am most
thankful to my family: my father; my mother, whom I hope to see again in Paradise Earth; my
two wonderful sisters; my step-mother; and my brother. Hallelujah!

4
Table of Contents
Page
List of Tables .......................................................................................................................... 6
List of Figures .......................................................................................................................... 7
Chapter
1. Literature Review.......................................................................................................... 8
Outsourcing: Definition and Importance ................................................................ 8
A Short History of Outsourcing .............................................................................. 9
Definition and Importance of Call Centers ............................................................. 10
History..................................................................................................................... 11
An Overview of India’s Economy .......................................................................... 13
Cultural Profile........................................................................................................ 15
Current Issues and Human Resources..................................................................... 16
Indian Call Centers and Companies’ Profits ........................................................... 17
Relocation from India-Based to U.S.-Based Call Centers ...................................... 18
2. Sociolinguistic Profile of India .................................................................................... 24
Varieties of English in India ................................................................................... 24
The Prestige of English in India .............................................................................. 27
A Linguistic Overview of Hindi ............................................................................. 27
Inventory of Hindi Phonemes ................................................................................. 28
3. Segmental Intelligibility................................................................................................ 37
Intelligibility and Unintelligibility .......................................................................... 37
Working toward Intelligibility Solutions ................................................................ 38

5
Chapter Page
Relative Functional Load of English Consonants and
Mispronounced Segments ................................................................................. 43
4. Confusion ...................................................................................................................... 45
Introduction ............................................................................................................. 45
Confusion Data of Consonants ............................................................................... 49
Confusion Data of Vowels ...................................................................................... 52
5. Pedagogical Implications and Recommendations ........................................................ 54
Pedagogical Implications ........................................................................................ 54
English Received Pronunciation International Phonetic Alphabet ......................... 54
Implementation Guidelines ..................................................................................... 55
References ................................................................................................................................. 59
Appendices
A. Consonant System ................................................................................................... 68
B. Vowel System ......................................................................................................... 79
C. Relative Functional Load ........................................................................................ 84

6
List of Tables
Table Page
2.1 Hindi Phonemic Distribution of Consonants ..................................................................... 30
2.2 General American English Manner of Articulation with Descriptions .............................. 31
2.3 American English Phonemic Distribution of Consonants .................................................. 32
3.1 Correlation between Relative Functional Load and Intelligibility ..................................... 44
4.1 Participants’ Biometric Information
(Adapted from the George Mason Speech Accent Archive) ........................................ 45
4.2 Consonant Confusion Matrix ............................................................................................. 47
4.3 Vowel Confusion Matrix .................................................................................................... 48

7
List of Figures
Figure Page
1.1 Caste System during the Aryan Civilization Period (1500 BCE -1800 BCE) .................... 12
1.2 2017 A.T. Kearney Global Services Location Index Top 10 Countries ............................. 17
1.3 Kachru’s (1976) Three Concentric Circles of World Englishness Model .......................... 23
2.1 The Three Registers of Indian English ............................................................................... 26
2.2 Hindi Vowel Chart ............................................................................................................. 33
2.3 General American English Vowel Chart ........................................................................... 35
2.4 General American English Area in the U.S. Based on Wells (1982, p.471) ...................... 36
4.1 Hindi Speakers’ Consonants with the Greatest Negative Transfer Rate ............................ 49
4.2 Hindi Speakers’ Total Negative Transfer Rate of Stops ..................................................... 50
4.3 Hindi Speakers’ Total Negative Transfer Rate of Fricatives .............................................. 51
4.4 Hindi Speakers’ Vowels with the Greatest Negative Transfer Rate ................................... 52

8
Chapter 1: Literature Review
A wealth of statistics show that the country of India is the main destination for
multinational companies’ marketing and call centers services. In fact, The Economist (2013)
estimated that about 80% of functions such as customer service, banking by phone, and
organizational activities that American and European banks and financial services could
reasonably outsource had been offshored, mostly to India, as of 2008.
Outsourcing: Definition and Importance
People use the terms “outsourcing” and “offshoring” interchangeably, yet clear
differences exist. Offshoring is the relocation of organizational activities to a wholly owned
subsidiary or an independent service provider in another country. In contrast, Gaspar (2014)
defines outsourcing as “the corporate practice of acquiring or producing quality goods or
services abroad at a lower cost, thereby eliminating domestic production” (p.38). Outsourcing
can also mean “the process of a company subcontracting a certain production function to a third
party” (Gaspar, 2014, p. 270).
Thus, outsourcing can be done within a country whereas offshored can be done to another
country. The functions in a company that are generally outsourced are: personal or virtual
assistantship, bookkeeping, payroll services, data entry, administration roles, accounts payables
and accounts receivables, social networking, search engine optimization, commonly abbreviated
as SEO, data mining, and call centers roles (Optimal Outsourcing, 2015).
Altogether, offshoring is part of outsourcing. With outsourcing, the offshoring company
can either shift its manufacturing or clerical operations to another company, or it can allow
another company to take over some of its functions. In any case, the outsourcing company is the
end receiver of the offshore company’s organizational activities and functions.

9
Some organizations and individuals have criticized offshoring companies for outsourcing
manufacturing and service operations. Those who are against outsourcing and offshoring have
made the case that U.S. multinational companies have caused loss of jobs in the home country in
hopes for cheaper labor abroad and to avoid tax liabilities in their home country.
Gaspar (2014) explains that outsourcing and offshoring practices have been polemical
issues among U.S. workers because of the loss of U.S. jobs to other countries (pp. 270-271). He
says that outsourcing by U.S. corporations is “here to stay” (p. 271) due to the increase of
globalization, technology advances, and the pressure to offer lower prices to consumers. Klie
predicted that by 2017, more than $28 billion dollars in market revenue would come from U.S.
outsourcing companies (Klie, 2014, p. 23). According to Klie, the top outsourced industries are
telecommunications, banking, and financing services, followed by the healthcare industry. Other
industries that are outsourcing their customer service centers are technology, utilities, gaming,
travel, and hospitality (Klie, 2014, p. 23). Oshri listed the top 10 global outsourcing vendors as
of 2010 as being “Accenture, IBM, Infosys Technologies, Sodexo, Cap Gemini, Tata
Consultancy Services, Wipro Technologies, Hewlett-Packard, Genpact, and Tech Mahindra”
(Oshri, 2015, p. 50).
A Short History of Outsourcing
By the mid-20th century, companies had begun to gravitate away from the conventional
model of autonomous self-reliance in favor of a more delegated approach due to the
technological advances in the telecommunications industry and the Internet (Handfield, 2006). In
1989, the practice of outsourcing was officially recognized as a viable instrument for maintaining
a lean and flexible business strategy. This strategy has allowed companies to focus their attention
on commercial interests that protect their bottom line, while simultaneously alleviating the
10
burdens of unnecessary overhead and micromanagement they would normally face in their home
countries. In the early 2000s, outsourced call center operations were basically clerical, and back-
office customer service queries that were needed in the diverse industries areas such as banking,
computers, credit cards, media consumption, travel, and so on (Bolton, 2013, p. 497).
Companies have outsourced their basic customer service operations because the cost of labor is
cheaper overseas than locally.
Nowadays, U.S. companies’ outsourcing decisions are no longer related to the reduction
of costs only. The decision to relocate business operations must do with access to “business
flexibility, skilled talent, best-in-class technology, and better delivery locations and models”
(Klie, 2014, p. 22). Now, companies are more strategic in how they outsource. They look for
higher skilled labor. Companies that outsource their customer service call centers understand that
to maintain a competitive edge, cost, location, and labor considerations will not be enough.
In a nutshell, customer service is still needed, but it has changed. Due to the wide access
of technology in multiple forms worldwide, companies utilize multichannel resources to attract
and keep customers. For instance, Klie (2014) reports that corporations’ adoption of more
technology-based services encompasses “automated customer care, analytics, cloud-based
contact center apps, [and] managed services to reach customers via telephone, tablets, computers,
and other customer preferred technology media” (p. 22).
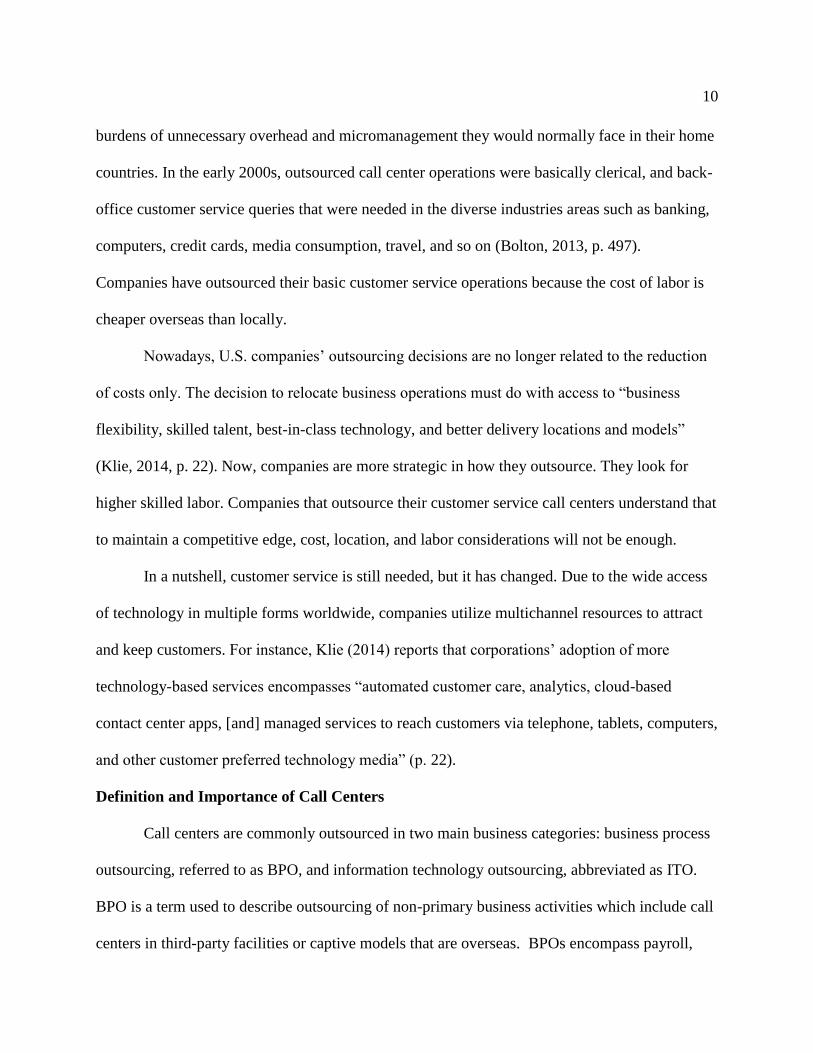
Definition and Importance of Call Centers
Call centers are commonly outsourced in two main business categories: business process
outsourcing, referred to as BPO, and information technology outsourcing, abbreviated as ITO.
BPO is a term used to describe outsourcing of non-primary business activities which include call
centers in third-party facilities or captive models that are overseas. BPOs encompass payroll,

11
human resources (HR), accounting, and customer/call center relations. An ITO, on the other
hand, describes the process by which companies outsource either all or part of their IT functions
to offshore facilities.
Oshri (2009) explains that the shortage of cheaper qualified labor in the West has
prompted companies to adopt BPO and ITO (p. 240). Klie (2014) estimates that more than
500,000 U.S. call center jobs were outsourced to foreign countries such as India during a 5-year
span from 2009 to 2014 (p. 23).
History
The Republic of India is not only the largest country of the South Asian subcontinent,
but it also holds the second largest population in the world. Among the things Indians are the
proudest of are their independence obtained in 1947 from former colonialist Great Britain, thanks
to the efforts of legendary figures like Gandhi and freedom fighters like Rani Lakshmi Bai. Also,
India is proud to be known for having the world’s largest democracy. From having been under
British colonial rule to becoming a modern independent nation, India, this developing country
can now compete with developed countries. It holds its own with rapidly growing economies
such as Brazil, Russia, and China. In fact, during the 2008 American recession, the BRIC
(Brazil, Russia, India, and China) countries were the least impacted.
India has greatly adapted to Western culture. It has advantages over other countries as the
premiere choice for outsourcing, in part because of its colonial history. Yet, it has retained its
deeply ingrained traditional culture. In the following paragraphs, the history of India, its
economy, and its cultural backgrounds are presented.

12
Figure 1.1 Caste System during the Aryan Civilization Period (1500 BCE -1800 BCE)
Britain has had a profound impact on current India’s identity and national pride. India
gained its independence from British rulership in 1947. Since then, India has adopted a flag of
three horizontal layers: orange, white, and green. The orange layer, described as deep safran or
kesari represents the strength and courage of India. Indians cherish the memory of Gandhi and
Rani Lakshmi Bai, legendary freedom fighters who embodied this strength and courage. The
white layer symbolizes peace and truth. In the center of the white layer is a navy-blue wheel
called Dharma Chakra, a Buddhist term meaning “the wheel of the law.” Finally, the green layer
represents fertility of the land and growth.
As late as 1991, India was one of the world’s poorest countries, still unable to pay its
world debt following the end of World War II. However, through the process of globalization
Bhramans:
Priests
Kshatriyas: Rulers and warriors
Vaisyas: Traders. artisans, farmers, and merchants
Sudras: Unskilled workers
Pariah: the Untouchables ( Non-Aryans)
13
and free market economy, India changed its protectionist economic system to a more liberal one.
This economic strategy opened India’s market to the world. Since the 2000s, India has become
an attractive business destination for multinationals, thanks to factors such as “a large English-
speaking population, its information technology services, its business outsourcing services, and
software workers” (CIA.gov, 2015). Its labor force is composed of 31% in services, 20% in
industry, and 49% in the agricultural sector (CIA.gov, 2015). The sector of services contributes
largely to India’s GDP with 53%, followed by industry (30%), and agriculture (17%) (CIA.gov,
2015).
An Overview of India’s Economy
India’s peaceful political stability contributes to its favorable status as a host country from
which to select for multinational companies. According to the World Bank (2018), the GDP annual
growth rate of India is 6.6% as of 2017. This strong GDP growth rate indicates that India has a
healthy economy that is very attractive to companies from around the world.
India has multiple trade agreements with many of its neighboring countries. Examples
include: the India-Nepal Trade Treaty and India-Sri Lanka Free Trade; trade agreements with
Bangladesh, Bhutan, Sri Lanka, Maldives, China, and South Korea; the Comprehensive
Economic Cooperation Agreement (CECA) with Singapore; framework agreements with the
Association of Southeast Asian Nations ASEAN; preferential trade agreements with
Afghanistan, Chile, and Mercosur; and involvement with the World Bank.
In 2013, India had a negative trade balance in which its imports exceeded its exports by
$129 billion. Its GDP was $1.88 trillion and its GDP per capita was $5,400.00. India’s main
exports were refined petrol, packaged medicinal drugs, jewelry, rice, and cars. Its main imports
were crude petroleum, gold, coal, petroleum gas, and diamonds. India’s top import destinations

14
in 2013 were: China, Saudi Arabia, United Arab Emirates, Switzerland, and Iraq (Observatory of
Economic Complexity, 2013).
Its top export destinations are the U.S., United Arab Emirates, China, Singapore, and the
United Kingdom. In fact, India has become the top outsourcing destination of services for
companies like GE, AT&T, IBM, American Express, American Online (AOL), British Airways,
British Telecom, Cap Gemini, Citigroup, Swiss Air, Microsoft, and Dell. In 2008, India
contributed $40 billion of revenue to the USA. This amount is 8 times higher than China’s export
revenues.
India is an attractive outsourcing destination because of a cheaper labor force that is also
skilled. In addition, most U.K and U.S. multinational companies prefer to outsource their IT
software and technology related services in telecommunications and in the banking sector to
India, thanks to its increase of foreign investment, the nation’s open market economy, its
consistency in productivity, and its profits increase, especially in IT and software industries.
Thanks to Prime Ministers Nehru and Rajvni’s government push to grow technologically skilled
labor starting in 1984, in 2008, India has attracted 65% of the information technology
outsourcing market and 43% of the business processing market worldwide (Oshri, 2009, p. 30).
Despite the attractiveness of the Indian skilled labor market, the country’s literacy rate
remains low. In 2007, the adult literacy rate was 66%, according to the MDG-3 project report of
women’s employment in India: “the female literacy was 54.5% and the male 77.1%.” (Klaveren,
et al, 2010, p. 6). Between 2008 and 2012, UNICEF reported a total adult literacy rate of 62.8%,
compared to 86.2% in the world (CIA.gov, 2015). The youth literacy rate for males was 88.4%,
whereas the youth literacy rate for females between 15 and 24 years of age was 75.4%.
Moreover, the MDG-3 project report shows that there is a large gender gap in school enrollment

15
rates because girls are lagging, and “drop-out rates are quite high” in primary education for boys
and girls.
Even with the technological innovations and advancements in the telecom, IT and
software industries that are notably reflected in the Southern Indian Silicon Valley, most of the
population have not reaped the benefits. The causes are due in part to corruption and casteism.
In fact, International Transparency gives India a score of 38% for its corruption perception index
(Transparency International, 2015).
Cultural Profile
The Indian Constitution names English and Hindi as official languages and recognizes
about 21 additional major languages, out of the 1652 languages and dialects that are known to
exist in India (Kachru, 1976, p. 2). Scholars like Sailaja contend that the British colonial
language, English, has served as a unifying factor for the multilingual nation of India (Sailaja,
2009, p. 5). Sailaja (2009) states that “English is the language of communication at the level of
trade and commerce” (p. 5). Hindi and English are the most popular languages used in registered
newspapers and published books (Pandita, 2014, pp. 309-314). Hindi was the first with 24,927
publications. The second largest registered newspapers with 9,064 newspapers were in English
(Sailaja, 2009, p. 4). At home and in public places, most Indians speak Indian English or Butler
English, a variety of English that is not considered a proper register in the education and
academic systems. Indians who have received better education mark themselves by speaking
more prestigious varieties of British English or American English (Sailaja, 2009, p. 14).
Sailaja (2009) notes that English has a neutralizing effect that blurs regional differences
(p. 10). Also noteworthy is that English language in movies serves as a social status market to
differentiate the well-educated from the poorly educated. For instance, Bollywood movies,
16
popular Hindi films made in Bombay/Mumbai, use Indian English in its dialogues for the urban
elite (Sailaja, 2009).
Current Issues and Human Resources
Although India still faces include brain drain, illiteracy, and language conflicts, it has
attracted U.S. vendors and global clients in the ITO and the BPO markets for reasons other than
its low-cost destination.
Today, Indian outsourcing suppliers have a wealth of expertise and experience with their
U.S. customers’ business relationships. Oshri (2015) claims that Indian suppliers offer a high-
quality workforce who speak a better variety of English than its competitor China (p. 17). In
2008, India attracted 65% of the ITO and 43% of the BPO in the world.
Relationships between Indian suppliers and U.S. vendors’, along with clear practical
advantages (such as low tax, advanced technology, and English educated workforce) have
advanced to the degree that strategic decisions to outsource to India are no longer made solely
for using India’s cheap labor to reduce costs. India’s location is also attractive for outsourcers
who want to maintain a 24-hour relationship with the customer thanks to an advantageous time
zone difference.
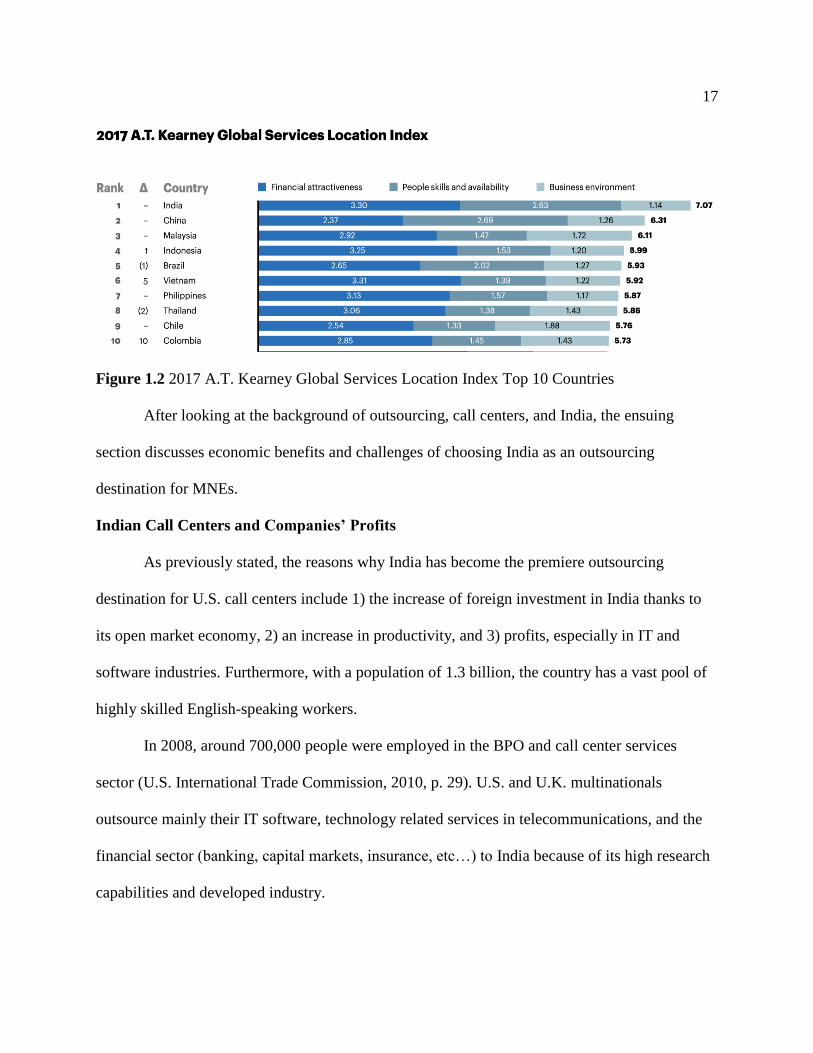
Overall, the 2017 A.T Kearney Global Services Location Index still rates India as number
one for outsourcing in terms of financial attractiveness, people and skills availability, and
business environment, with a total score of 7. China and Malaysia come second and third, with
scores of 6.31 and 6.11, as it is shown in the figure below (Kearney, Sethi, & Gott, 2017, p. 10).
17
Figure 1.2 2017 A.T. Kearney Global Services Location Index Top 10 Countries
After looking at the background of outsourcing, call centers, and India, the ensuing
section discusses economic benefits and challenges of choosing India as an outsourcing
destination for MNEs.
Indian Call Centers and Companies’ Profits
As previously stated, the reasons why India has become the premiere outsourcing
destination for U.S. call centers include 1) the increase of foreign investment in India thanks to
its open market economy, 2) an increase in productivity, and 3) profits, especially in IT and
software industries. Furthermore, with a population of 1.3 billion, the country has a vast pool of
highly skilled English-speaking workers.
In 2008, around 700,000 people were employed in the BPO and call center services
sector (U.S. International Trade Commission, 2010, p. 29). U.S. and U.K. multinationals
outsource mainly their IT software, technology related services in telecommunications, and the
financial sector (banking, capital markets, insurance, etc…) to India because of its high research
capabilities and developed industry.

18
For instance, Shastri (2004) provides the example of GE Capital, a large multinational
company that set up call center operations in the 1990s to simply delegate non-critical business
functions such customer care and collection calls. Six years later, GE changed its business
strategy by thoroughly investing in a full-fledged subsidiary outsourcing model in India. The
high outsourcing expenditures became justified when, in 2003, GE reported higher revenues
(Shastri, 2004, p. 58).
GE and many U.S. companies continue to evolve their business models to offer better
quality services and productivity to beat the fast-growing competition from other emerging
Indian call centers (p. 59). Still, despite the effectiveness of these business ventures, some
companies are bringing their call centers back to the U.S. The next section will explain why.
Relocation from India-Based to U.S.-Based Call Centers
U.S. companies are now making strategic decisions on whether to outsource their call
centers. Some companies have decided to bring their outsourced customer service contact centers
back home to the U.S. For example, in 2010, Delta Airlines closed its call centers in India and
relocated back to the U.S. because of customer service complaints due to language barriers (U.S.
international trade commission, 2010, p. 18). In addition, some companies are bringing back
their outsourced call centers home because they seek more than the benefit of a cheaper rate
when they decide to outsource their business operations to other countries. As Klie explains,
“labor rates are no longer the main concern as companies consider outsourcing their contact
centers” (Klie, 2014, p. 20).
Traditional outsourcing. Traditional outsourcing (routine software, and application
development and maintenance) has reached its saturation point. In the past, companies would
outsource their business operations, such as order line call centers, out of the USA, due to

19
economic pressures and because of the cheaper labor rate available overseas. However, it is now
known that most business decision makers have realized that this strategy has not saved on costs.
For instance, Dell Company has offered a premium technical support option based in the U.S. to
improve customer satisfaction for U.S. customers who prefer to listen to “U.S. based customer
call reps” at the other end of the line (U.S. International Trade Commission, 2010, p. 18).
Klie relates the story of a global U.S. pharmaceutical company that lost 1 percent of its
customers in just forty-five days after outsourcing its call centers to India. In addition, the
company had to respond to unusually high volumes of complaints and calls were much longer
(Klie, 2014, pp. 20-21). Therefore, the company decided to relocate its contact centers back to
the U.S. One of the company’s employees attributed this failure of outsourcing to the negligence
of ignoring important aspects of doing business abroad, like the cultural profile of the chosen
country, and customers’ reactions.
Communication breakdowns. Bolton reports how in the U.K. media, call centers have
aggravated consumers due to “prolonged delays, difficulties contacting retailers or service
providers, and service provided by Indian call centers related to language issues” (Bolton, 2013,
p. 495).
Granered explains that communication breakdowns occur when a sender’s message is not
correctly decoded “in the receiving end of the message” (Granered, 2005, p. 25). He also adds
that the problem of communication breakdowns is stronger in phone interactions than in face-to-
face interactions because “a large amount of context is missing, when we interact over the
phone” (p. 54).
Furthermore, the strategy of outsourcing to other countries like India has not been cost-
effective because companies have overlooked “communication breakdowns” between U.S. and

20
Indian cultures (Klie, 2014, p. 21). Walker and Hartley (2012) observe several communication
breakdown issues in the outsourcing business. These include high employee burnout rate due to
the radical time zone difference between U.S and India, expectations on the local workforce to
speak like Westerners when they have never been to a native country where English is the native
language, scripted responses that lack customer service soft skills, and customer complaints of
Indian call representatives’ thick accents.
Technological advances. The competitive climate that the Internet has fostered may also
have resulted in less demand for outsourcing of call centers in India and to less communication
breakdown between call representatives and customers. Customer interactions over routine
questions on the phone have decreased as advance technology and the Internet have replaced
jobs previously completed by humans (Gaspar, 2014, p. 266). The need for outsourced call
centers may become less essential to companies. Customers can look for answers themselves
through Google, or through the company’s website, or via customer service direct chat or email,
or even before calling businesses for solutions. Although economic consideration in language
policy discourse are generally about legal, cultural, and educational perspectives, Walker and
Hartley (2012) observe, that from a business perspective, American multinational companies
should also consider cultural and language differences between the Indian call workforce and
American listeners.
Language economics. Language economics considerations enable multinational
businesses to decide whether to extend their businesses in other countries where English is not
the first language. Grin (2006) supports the claim that economics is becoming relevant to
language consideration for two main reasons: first, language matters have always existed in
economics, even if language experts have rarely talked about this interest; and secondly,

21
language specialists are realizing that language issues have economic implications. In addition,
Grin explains that language is a form of capital that can influence earnings and economic
variables in one of the main stages of “language economics” (p. 81).
Thus, multinationals must train Indian workers not only on technical and product
knowledge, but they must also focus on language intelligibility to reduce costs and liabilities. In
fact, Granered (2005) confirms that “there are tangible consequences for not considering cultural
variables at every stage of outsourcing and offshoring call center functions” (p. 24). Granered
asks rhetorically, “How often have you received a telephone solicitation from someone who
can’t pronounce your name, has an accent that is so strong that you can barely understand what
he is saying, and possesses a conversational protocol that is completely alien to you? It clearly
does not produce results” (Granered, 2005, p. 55).
Accent neutralization. Granered advises that “when customer complaints arise, the most
effective strategy is to deal with them immediately” (p. 305). Yet, multinational companies are
elusive on what their expectations are of the ideal accented English. Cowie (2007) brings this out
in her ethnographic research on accent training agencies in Bangalore, South India (p. 322).
Most U.S. and British multinational companies delegate employee training responsibilities to
local external accent training companies. From the beginning, call centers clients demanded
accents close to the inner circle variety of English. In the last two decades, some companies have
switched their preferred outsourcing destination from India to the Philippines, as the English
accent in the Philippines is said to be closer to the American accent (Diola, 2014).
Philippine vs. Indian neutral accents. India’s ranking position as being the premier
outsourcing destination is at risk. It could be altered by the Philippines and Latin America, or
even by U.S. home-based agents (Klie, 2014, p. 23). CIA.gov (2015) has reported India’s
22
“inadequate quality of basic and higher education, rising macroeconomics imbalances in India’s
economic leaders, and improving economic conditions in the western countries” as well as in
developing countries such as the Philippines. These countries are challenging India’s position as
the most attractive outsourcing place (CIA.gov, 2015). Diola (2014) specifies that multinational
companies are starting to make the decision to relocate 70% of their BPO call center services
worth “$30 billion in foreign exchange earnings” to the Philippines because “Filipino people
have a more neutral accent” (Diola, 2014). According to Diola, the spoken English of Filipino
call center agents sounds similar to standard American English.
Increasingly, U.S. and British call centers clients require a more neutral accent or “a
regionless international variety of English” to diminish customer complaints of “fake British or
American accents” (Cowie, 2007, pp. 316, 322). Hence, multinational companies expect accent
training agencies to develop an ideal neutral accent for Indian call representatives. Davies, an
experienced outsourcing consultant, defines neutral accent as accent “that taps into the ideal of a
nationless English which is neither British nor American, nor Indian” (Cowie, 2007, p. 322).
Yet, according to Kachru’s (1976) three Concentric Circles of World Englishes model, India is a
nation that is part of the Outer Circle of World Englishness based on its British past colonial
history. Figure 1.3 delineates the three varieties of World Englishes.

23
Figure 1.3 Kachru’s (1976) Three Concentric Circles of World Englishness Model
In Outer Circle countries, English serves as lingua franca between existing native
languages. For instance, both the Philippines and India are part of the Outer Circle of English
model due to their past colonial history with respectively U.S. and U.K. Thus, English, a widely
spoken language across these nations, serves as an integral institutional language in India or in
the Philippines in the Outer Circle nations’ 1) economy, 2) commercial, 3) business, and 4)
educational arenas. Kachru (1976) classified Outer Circle English as “norm developing” which
follows the model of the “norm providing” English spoken in the Inner Circle countries,
especially U.S. and U.K.
The next chapter introduces sociolinguistic profile of India to explain salient
characteristics of Indian English phonology. The terminology of neutral accent will be discussed
in later sections.
Expanding Circle
•China, Russia, Brazil
Outer Circle
• India, Philippines
Inner Circle
•USA, UK

24
Chapter 2: Sociolinguistic Profile of India
The Ethnologue (2017) presents the most recent information of the numerous languages
in India as follows: there are 462 languages, of which 448 are living and 14 are extinct. Of the
448 living languages, 420 are indigenous languages and 28 are non-indigenous; there are 64
institutional languages, 126 developing languages, 190 vigorous languages, 55 endangered
languages, and finally, 13 dying languages.
Institutional languages are languages that are taught in schools and used beyond the home
and the community as professional languages in businesses. The principal institutionalized
languages of India are English and Hindi. Hindi, the principal language of India is spoken by
378,000,000 of the population.
How have the native languages in India influenced spoken English language? How have
official languages in India influenced English language attractiveness?
Varieties of English in India
Kachru (2005) notes that “India is a major English-using country along with the U.S. and
the U.K.”, with 333 million Indians who are proficient in it (p. 15). Clearly, a nation with such
great linguistic diversity needs a lingua franca.
As Kachru (1975) reports, the Constitution of India recognizes 23 major languages, of
which:
1) Sixteen correspond to the Indo-Aryan language family (Assamese, Bengali, Dogri,
Gujarati, Hindi, Kashmiri, Konkani, Maithili, Marathi, Nepali, Odia, Punjabi,
Sanskrit, Sindhi, and Urdu);
2) Four correspond to the Dravidian language family (Kannada, Malayalam, Tamil,
Telugu);

25
3) Two correspond to the Tibeto-Burman family (Bodo, Manipuri);
4) One language corresponds to the Munda family (Santali).
English has served as a unifying factor in this multilingual nation. Yet, there is a diglossic
situation in India where English is the high variety. It is used as a tool for communication and
capital. Research indicates that there are three registers of spoken English in India which
correspond to three classes: upper, middle, and lower, as shown in Figure 2.1. There is also a
dialect of English known as “Babu English” spoken by the educated class. Babu English is one
type of a high variety English that is used in administrative settings.
The Pan-Indian features of English are more obviously seen in the low variety of
English. Kachru (2005) refers to this low register as the Butler English. It is also known as
Kitchen English, or again, Bearer English, which is used for casual conversations. As Kachru
(2005) illustrates, the Dravidian influence is included in Butler English on the pronunciation of
[ye] as <yexit> for [e] in the word <exit> and [wo] as <wonly> for [o] in the word <only> (p.
42).
Babu English and Butler English are two registers that are not likely to be available in
call centers, as the former, spoken by upper class individuals, may be heard in higher business
settings, whereas individuals who can only speak the latter (Butler English) are not likely to be
hired in most call centers. So, the register of English used by call center employees most often
corresponds to Educated Indian English, to the dialect used by the middle class.

26
Figure 2.1 The Three Registers of Indian English
Sailaja (2009) describes some features regarding spoken Educated Indian English. He
labels Indian English as “a standard variety [in which accent is] marked by regional variations”.
Sailaja notes that although “Received Pronunciation or RP of British English is taught in Indian
schools, British English accent has never been achieved” (p. 17). Yet, it is a variety of English
close to RP that is recognized as the Educated Indian Pronunciation (Sailaja, 2009).
In summary, English and Hindi are the major institutional languages spoken in India.
Native languages, Hindi particularly, have contributed pan-Indian features to the English spoken
in India. Indian English is the focus of this paper because call centers use it as its institutional
language.
Upper
Class:
Babu English
Middle Class:
Educated Indian English
Lower Class:
Butler English

27
The Prestige of English in India
Masani (2012) reports that “India claims to be the world’s largest English speaking
country”. Kachru (2005) sees the functions of English language in India as contradictory (p. 64).
On the one hand, English serves as a demarcating trait for the higher levels of the caste system;
on the other hand, it serves as the unifying factor that resolves language conflicts. Therefore,
most Indians are competent in at least two languages. In a nutshell, India is a multi-linguistic
society where students learn English and Hindi as school requirements. Hence, the influence of
the diverse native languages, especially Hindi in English is obvious particularly in its sound
system. (Kachru, 1976, p. 2).
A Linguistic Overview of Hindi
Hindi is the major language that impacts the variety of English used in call centers. On
September 14, 1949, Hindi became the official language of the Federal government in India.
Pandita (2014) reports that Hindi is spoken by 41% of the population (Pandita, 2014, p. 310).
Hindi has its roots in Sanskrit. It is classified as Indo-European, Indo-Iranian, Indo-
Aryan, western Hindi, and Hindustani (Ethnologue, 2016). During the 1960s, the formal variety
of Hindi language, called Shuddha, was standardized and became the Indian union’s national
language. Shuddha is considered a high register of the language. It is used in newspapers, in
government, and in academic literature. The low register of Hindi, called Hindustani, contains
loanwords from English, Persian, and Arabic. Hindustani is commonly used in everyday
interactions, in the media, and in entertainment (Bollywood movies, songs, and TV shows).
Furthermore, Hindi is spoken by 545 million people, and 77% of whom are native
speakers. It is used in the northern states of India, including Rajasthan, Dehli, Haryana,
Uttarakhand, Uttar Pradesh, Madhya Pradesh, Chhattisgarth, Himachal Pradesh, Jharkhand, and

28
Bihar; in Central India; and in various other parts of India. Hindi is understood in neighboring
countries such as Nepal, Bangladesh, Pakistan, and more distant countries: South Africa,
Mauritius, Fiji, Suriname, Guyana, Trinidad and Tobago (Omniglot, 2016).
Inventory of Hindi Phonemes
This section presents Hindi consonants and vowels sounds. It does not address
suprasegmentals; rather, it focuses only on obvious contrasting features between Hindi and
English segments, which are consonant and vowel sounds, in order to determine segments of
Indian English that are the most problematic for native speakers of American English.
Phonemes are the smallest sound units of a language that distinguish one word from
another. Ladefoged and Disner (2012) indicate that phonemes are “often thought [of] as different
sounds that can change the meaning of a word” (p. 194). They play a major role in
communication, as the substitution of one phoneme for another would contribute to breakdowns
in comprehension. On the other hand, allophones are sounds that are perceptibly different but do
not carry meaning. Thus, substitution of one allophonic sound for another by the speaker would
be perceived as accented speech by the listener. Phonemes and allophones are language-specific
in the sense that each language determines which distinct sounds carry meaning. For instance,
Celce-Murcia, et al. (2010) illustrate how phonemes and allophones are language-specific with
Hindi and English: /p/ and / pʰ/ are phonemes in Hindi, whereas they are allophones in English
(p. 51).
Hindi can be described as a non-tonal language that has at least 40 phonemes: 30
consonant sounds and 10 vowel sounds. Compared to Hindi, English has at least 44 phonemes:
25 consonant sounds and 20 vowel phonemes. Dow and Baer (2011) notes that: “the fact that
there are 200 ways to spell the 44 phonemes in English creates confusion” (p. 22). Hindi

29
speakers who are learning English will encounter some confusion in learning the sounds of
English phonemes, as English spelling does not equate with its sound.
Hindi consonants. Fairbanks and Misra (1966) report that “Hindi has voiced aspirated
consonants that do not exist in English: /bʰ, dʰ, Dʰ, jʰ, gʰ/” (pp. xviii-ix). Bansal (1969) specifies
characteristics of Hindi consonants that are not found in English, such as voiced bilabials and
velar aspirated stops, dental and retroflex consonants, voiced and voiceless palatal affricates, and
palatal nasals. The plosives /t, d/ are dental in Hindi, whereas in English the place of articulation
of /t, d/ are alveolar (Fairbanks & Misra, 1966, pp. xviii-ix). Kachru (2005) says that when
speaking English, some Hindi speakers replace “the alveolar plosives /t, d/ by their retroflex
counterparts /ʈ, ɖ/. which are pronounced with the tongue-tip curled up towards the hard palate”
(p. 44); the interdental fricatives /θ, ð/ are replaced by dental plosives /tʰ, d, dʰ/. Table 2.1 lists
the place and manner of articulation of Hindi consonants.

30
Table 2.1
Hindi Phonemic Distribution of Consonants
Place of articulation
Bilabial
Labiodental
Dental
Alveolar
Post-Alveolar
Retroflex
Palatal
Velar
Uvular
Glottal
Manner
of
articulati
on
Plosive k kʰ q Voiceless p pʰ t tʰ ʈ ʈʰ g gʰ Voiced b bʰ d dʰ ɖ ɖʰ Nasal Voiced m n ŋ
Tap or
Flap Voiced ɾ x h Fricative ɣ Voiceless F s ʃ Voiced z tʃ tʃʰ
Affricate
dʒ dʒʰ
Voiceless Voiced j
Approximant
Voiced
Lateral Approximant
Voiced l
General American English consonants. General American English (GAE) consonants
are generally classified by seven distinct places of articulation:
1) bilabial
2) labiodental
3) interdental
4) alveolar
5) palatal

31
6) velar
7) glottal
English also has five manners of articulation that are listed in the table below:
Table 2.2
General American English Manner of Articulation with Descriptions
Manner
of
articulation
Segments Description
Stops /p, b, t, d,
k, g/
“Air coming from the lungs is blocked before it is abruptly
released” ( Koffi, 2014, p.46)
Fricatives /f, v, θ, ð,
s, z, ʃ, ʒ,
h/
Air flows freely with a certain amount of friction when producing
these consonants.
Affricates /t ʃ, d ʒ/ Found in words such as <chocolate> and <job>, affricates are a
mixture of stops and fricatives.
Nasals /m, n / Air comes out through the nose.
Approximants /w, j, r, l/ “Consonantal sounds produced with a relatively unimpeded flow
of air through the mouth” (Maddieson, 2009, p.91).
Table 2.3, adapted from Fromkin, et al. (2014), summarizes General American English
phonemic distribution of consonants:

32
Table 2.3
American English Phonemic Distribution of Consonants
Place of articulation
Bilabial Labiodental Interdental Alveolar Palatal Velar Glottal
Manner of
articulation
Stop/Plosive Voiceless p t k Voiced b d g Nasal Voiced m n ŋ Fricative Voiceless f θ s ʃ h Voiced v ð z ʒ Affricate Voiceless Voiced Glide Voiced w Liquid Central r Lateral l
Contrary to English, which does not make a lexical distinction between the initial
voiceless plosive /p/ and aspirated initial voiceless plosive /pʰ/, Hindi uses /p/ and /pʰ/ as
contrastive minimal pairs. For instance, the Hindi sounds [pal] and [pʰ al] mean “moment” and
“fruit”, respectively (Sailaja, 2009).
In addition, Sailaja notes that Indian English does not have a rhotic /r/. Therefore, most
Indian English speakers do not pronounce words that have a final /r/. For instance, the word
<car> is pronounced as <ca> (p. 19). He says that in India, “an r-less accent is a prestige marker”
(Sailaja, 2009, p. 19).
Another noteworthy difference between Hindi and English consonants mentioned by
Sailaja (2009) is that Hindi speakers replace the English voiced palatal fricative [ʒ] by the voiced

33
alveolar fricative [z]. Also, Hindi lacks the semi-vowel /w/. Instead, it has the voiced
approximant labiodental / ʋ/ which sounds like [v]. For instance, <we will wait> sounds like <vi
vill vait> to an American ear. The consequences of this will be discussed in Chapter 4 on
intelligibility.
Hindi vowels. Hindi has ten oral vowels which can be nasalized. Per UCLA (1999),
nasalization of Hindi vowels is phonemic. Figure 2.2 (adapted from Maddieson and Disner,
2009) shows Hindi oral vowels only since English vowels are not phonemic (p. 270).
Figure 2.2 Hindi Vowel Chart (Adapted from Maddieson, & Disner, 2009, p. 270)
Hindi vowels have predictable sound features that can cause rule overgeneralization
when transferred in English. For instance, an important feature of Hindi vowels is that none of
them is reduced at the difference of English. Instead, there are short and long vowels (Kachru
(2005) as shown in Figure 2.1).

34
Yet, Wells (1982) cautions that “length distinctions are not always consistently made” (p.
626), and so forth, in Indian English, there is no distinction between tense and lax vowels
(Kachru, 2005, p. 45). For example, Wells (1982) shows that the distinction between the lax
vowels /ʌ / versus /ə/, and /ɒ/ versus /ɔ/, which are phonemic in English pronunciation, is
“dubious or variable” (p. 626). He adds that Indian English speakers generally do have control of
the difference between /ɛ/ and /æ/; however, the two phonemes are frequently substituted for
each other, since in Hindi there is no phonemic distinction between these two lax vowels (Wells,
1982). A further example of variable phonemic distinction lies between the tense vowel /a/ and
the lax vowel /ɔ/. Wells gives evidence that /a/ versus / ɔ/ confusion is particularly apparent “in
cases where words are spelt with a (thus /a/ in words such as want, sausage, all, caught, saw)”
(Wells, 1982, p. 627).
Some varieties of vowels pronunciations depend on the speaker’s regional background.
For instance, some Indian speakers with a Dravidian language background would add glides such
/w/ and /j/ before words that start with high vowels (Sailaja, 2008, p. 24). Punjabi English
speakers tend to blur the distinction between lax vowels. Telugu speakers do not use diphthongs.
Telugu speakers and other south Indian speakers’ vowel / ɒ/ is usually changed to /a/ (p. 25).
English vowels. According to Fromkin, et al. (2014), English has 11 monophthongs
(Figure 2.2). English vowels may be tense, meaning they are slightly longer in duration and
slightly higher than their counterparts, lax vowels. The tense vowels are /i, e, u, o, ɔ, a/, and the
lax vowels are / ɪ, ɛ, ʊ, ʌ, æ, ə/ (p. 211). Vowels are classified according to how the mouth opens
and closes and how the tongue moves forward, moves inward, or remains in the central position

35
of the mouth when forming the vowels. Thus, /i, ɪ, ɛ, æ/ are considered front vowels, /u, ʊ, o, ɔ,
a/ are considered back vowels, and / ə, ʌ/ are central vowels.
Figure 2.3 General American English Vowel Chart (Adapted from Fromkin, Rodman, & Hyams,
2014)
Pronunciation experts including Koffi (2014) and Celce-Murcia, et al. (2010) agree that
English vowels are difficult for phoneticians, teachers, and students to master. Furthermore,
vowels are problematic because they display more dialectal variation among native speakers in
the U.S. (Celce-Murcia, et al., p. 159).
Thus, this discussion focuses on one variety of English from the Inner Circle of World
Englishes as presented in Kachru’s (1976) model. The chosen standard used for the overview of
English vowels is General American English, (GAE), often labeled as an American accent
without marked regional characteristics, although it is not a uniform accent (Wells, 1982, p.

36
470). Wells (1982) affirms that GAE is the most acceptable variety of English used on television
networks throughout the U.S. (p.470). He defines GAE speech as (Figure 2.4):
the majority of American accents which do not show marked eastern or southern
characteristics, including those deriving basically from the northern speech of the
Hudson Valley and upstate New York and those deriving from the midland speech of
Pennsylvania. (Wells, 1982, p. 470)
Figure 2.4 General American English Area in the U.S. (Based on Wells 1982, p. 471)
The differences in the segmental inventory between Hindi and English are likely to cause
intelligibility problems for General American English hearers. These will be explored further in
the next chapter.

37
Chapter 3: Segmental Intelligibility
Intelligibility and Unintelligibility
Importance of intelligibility. Derwing (2010) places intelligibility among the nine
effective characteristics of pronunciation training (p. 29). Munro and Derwing (2008) qualify
intelligibility as “the single most important aspect of all communication” (p. 13). Munro and
Derwing (2008) and other scholars declare that intelligibility is the most basic element needed
for understanding oral speech without effort on the listeners’ end of the communication channel.
Bansal gives details on what a person must do to be perceived as intelligible:
To be intelligible, the speaker must articulate his sounds and words clearly, so that
the hearer does not have to stop to think what word was meant. The vowels should
be pronounced with the right quality and the consonants should be sharp and clear in
their articulation. (Bansal, 1969, p. 15)
Explanation of intelligibility definition. In the above definition, Bansal specifies that
speakers are intelligible when they pronounce their vowels “with the right quality” and their
consonants are "sharp and clear in their articulation”. Right quality can be described as a clear
and a discernible articulation, whether loud or soft, that is achieved despite external background
noise.
How unintelligibility occurs. Unintelligibility, on the other hand, occurs when sounds
from one language are negatively transferred into another confusion research studies explain how
unintelligibility occurs. The negative impact of foreign sounds on intelligibility is unavoidable
(Nelson, 2011, p. 32). It can be attributed to background noise or “psychological noise” (Koffi,
2014, p. 20). As Koffi explains, “psychological predispositions and attitudes of native speakers
can hinder the intelligibility of spoken English by second language speakers” (p. 21).

38
Consequently, during phone interactions, some American customers who may already be
in a state of mind that can be compared to psychological noise may become frustrated when they
detect accented English spoken on the other end of the line.
These definitions of intelligibility and unintelligibility are applicable in face-to-face
communications and during phone interactions.
Importance of intelligibility in call centers. The call center employee in India is
multilingual and the consonants and vowels of his/her native language may be transferred
negatively into English. Therefore, listeners who speak only English may have difficulties
perceiving Indian-accented English. As has been noted in previous sections, Indians who work in
IT, call centers, and other outsourced services speak various varieties of Indian English. Some
varieties appear to be unintelligible to some native speakers of American English. Their accent
may be described as “heavy”. Fromkin, Rodman, and Hyams (2014) explain that knowing a
language means knowing “what sounds are in that language and what sounds are not” (p. 2). She
gives the example of French speaking people who often may pronounce words like <this> as
[zis], because the English consonant sound [ð] is not in the French sound system (Fromkin, 2014,
p. 2).
To summarize, intelligibility is integral to communication, especially in phone
interactions where nonverbal cues are limited to oral sounds and to the voice tone (Munro &
Derwing, 2008, p. 13).
Working toward Intelligibility Solutions
American listeners tend to become distrustful when they hear an accented English voice
on the other end of the line (Lockwood, 2010). For this reason, some U.S. companies in India

39
have hired accent reduction training companies to reduce the accented English spoken by local
call representatives in India.
As was mentioned in an earlier section, Cowie (2007) has researched whether the term
“neutral accent” can be interpreted as closer to British or to American English.
She volunteered in a training agency whose call centers’ clients are global companies
mainly from the U.S., and also from the U.K, Australia, and Canada to provide curriculum of
English Language Teaching improvements for a six-month period. Some of these clients choose
to delegate to Indian call centers and accent reduction training agencies the role of identifying
neutral accented English hired call center agents should acquire. Thus, the older generation of
trainers above thirty years interviewed by Cowie in the observed training agency, responded that
accented English should sound more British, while the younger generation of trainers opted for a
more neutral accent that should sound more American.
To put it another way, Cowie (2007) explains that adherents of British accented English
claim that a neutral accent sounds like the English used by “BBC Asia newspaper readers on
Indian channels”, also referred to as educated English, or as Received Pronunciation Indian
English (p. 323). The younger generation of accent trainers, on the other hand, refer to neutral
accent as the English spoken by generally wealthier non-resident Indians (NRI) who were born,
grew up, and studied in the U.S. (p. 325).
However, despite the differing perceptions of neutral accents, the accent reduction
trainers in the accent reduction agency’s main target is to reduce the mother tongue influence of
the trainees ‘spoken English. Cowie collected trainees’ responses to the expectations of the
agency and future employers to find out what they believe a neutral accent means.

40
In a 3-week training period, the trainees were expected to produce satisfactory results of
neutral accents. They were required to read passages and to participate in private interviews with
their trainers. They were also assessed in evaluation sessions that were recorded through mock
telephone calls. Responding to the question of how neutral accent should sound, opinions of the
trainees diverged. Some of them modified their English to sound more American, whereas others
preferred to sound more British while reading telephone script passages.
The results of trainee mock telephone calls showed that some accommodated their
English with American accents, while the recorded English of other trainees sounded neither
British nor American. Rather, the recordings of the latter group showed characteristics of Indian
phonological rules in their spoken English. During the training of the call representatives who
were trained to speak to American customers, Cowie selected two trainees out of a batch of
eighteen observed trainees as her case studies to exemplify their sample used phonological
features that were not “supposed to be typical of the most educated end of the Indian English
spectrum” while being trained by the accent reduction agency (p. 325).
Problem segments. Cowie (2007) identifies several segments that cause intelligibility
issues for Indian speakers for English based on her case studies at the agency (p. 325), such as:
1) / ʋ /, the labiodental approximant is transferred for words that required an American
consonantal sound /v/ or a /w/ sound;
2) /v/ and /w/, at least half of the time, the distinction between /v/ and /w/ were made,
and
3) /p/, /t/, and /k/, aspirated /p/, /t/, and /k/ pronunciations vary greatly.
Typical Indian English speakers had problems with these phonological processes:
4) rhoticity

41
5) aspiration
6) L-velarization
In contrast to aspiration and l-velarization, rhoticity is not generally present in Indian
English (Cowie, 2007, p. 325). For instance, Rahul, one of the trainees, does not pronounce /r/ in
<apartment>. Vishal, another trainee, produces the trilled /r/ instead of the American rhotic / ɹ/.
He uses his / ɹ/ more consistently in reading passages and in mock interviews, but not in free
speech (Cowie, 2007, p. 326).
Addressing problem segments. To address this problem, Vishal’s trainers encouraged
him to use more American lexical items and more American pronunciations for high frequency
words like <address>. He was also encouraged to use more word fillers that sound American
such as <alright> or <uhm>.
Towards her conclusion, Cowie (2007) observes that most agents accommodate to adjust
to their American audience, similarly to Vishal, by adopting quick fix solutions such as
increasing their American high frequency words in a more American sounding voice (p. 327).
The problem with this recommendation, as Cowie (2007) points out, is the American customer
perception of fake American accent used by call center employees.
Nevertheless, heavily accented speech can be intelligible. Munro and Derwing (1995)
have found that there is no correlation between “heavy accent” and “low intelligibility. Actually,
Celce-Murcia, et al. (2010) determine that “there is general consensus that intelligibility and
comprehensibility are more important than accentedness for purposes of communication” (p. 33).
Some reports of intelligibility issues are related to mispronunciation of English words, along
with a faster diction. Sailaja (2009) notes that Indians tend to stress unimportant words. This
makes the perception of English words more confusing for American listeners (Lockwood,

42
2013). However, Munro and Derwing (1995) have not found relevant evidence to prove that
nonnative speakers who have attempted to reduce their accents have been successful in
becoming more intelligible (Munro & Derwing, 1995, p. 287).
They suggest that second language teachers should not focus on reducing accents, but on
“aspects of the learner’s speech that appear to interfere with listeners’ understanding.” They raise
two issues that currently prevent teachers from focusing on these important pedagogical
suggestions. First, it is not known precisely “which particular aspects of foreign-accented speech
are most detrimental to comprehensibility and intelligibility”, because of the lack of exhaustive
empirical research. Secondly, it is difficult to know exactly where problems of pronunciation are
because of variabilities such as individual differences in native listeners’ perceptions.
On the other hand, Bansal (1969) has emphasized that the Standard English referred to as
the Educated Indian pronunciation or Received Pronunciation (RP) was an attempt to attain the
goals established by the Government of India in 1958. These goals were to satisfy the criterion of
intelligibility (p. i). In his study, Bansal measured the intelligibility of Educated Indian English
within the Outer English Circle versus the Inner circle (see Figure 1.3) and Globish circle
English speakers through impressionistic methodology. One of his goals was “to discover
features in Indian English that hamper intelligibility” (p. i). The results show that U.K. listeners
and American listeners gave an average intelligibility score of 77% to Hindi English connected
speech, whereas Indian listeners gave a score 87% to the Hindi speaker’s connected speech
(Bansal, 1969, p. 66).

43
Relative Functional Load of English Consonants
and Mispronounced Segments
Employers do not disclose recordings that contain actual customer voices to protect
customers’ confidential information. Therefore, this researcher was not able to obtain call center
data to analyze. Instead, other means are used to measure the intelligibility of Indian-accented
English. One of the means used is the Relative Functional Load (RFL) data.
Celce-Murcia, et al. (2010) further explain “students’ first languages color their
perception and production of English in many ways. As discussed in the literature review,
contrastive differences cause learners to transfer sounds and patterns from their first language to
their second language, creating a particular accent in that language. (Celce-Murcia, et al, 2010, p.
279). Some phonemes are more likely to be confused than others because of how ‘close’
one phoneme is to another. Koffi (2014) contends that for hearers with little linguistic
knowledge, the confusion is more acute.
Koffi (2014) cites confusion studies such as Miller’s Auditory-Perceptual Theory and
Byrd and Mintz’s Cohort model to clarify the definition of RFL. The concept of RFL looks at the
phoneme level of the word and responds to the question of precisely what phoneme in the
problematic target spoken word drove to confusion. It asks whether the confusion resulted
because the competitive phoneme was perceptually distant from the target word (Koffi, 2014, p.
18).
Table 3.1 displays the correlation between Relative Functional Load and Intelligibility
ratings. This table is based on Catford’s intelligibility studies (Celce-Murcia et al., 2010, p. 471;
Koffi, 2014, p. 257, 2015) (Appendix C).

44
Table 3.1
Correlation between Relative Functional Load and Intelligibility
Levels Percentage Unintelligibility
1 80-100 Severe
2 60-79 High
3 40-59 Moderate
4 20-39 Low
5 1-19 Slight
In the next chapter, we examine with the relative functional load and intelligibility ratings
of some mispronounced segments of Hindi speakers whose reading recordings are found in the
Georges Mason University Speech Accent Archive. The Speech Accent Archive “uniformly
presents a large set of speech samples from a variety of language backgrounds. Native and non-
native speakers of English read the same paragraph and are carefully transcribed. The archive is
used by people who wish to compare and analyze the accents of different English speakers”
(Weinberger, 2015).

45
Chapter 4: Confusion
Introduction
It was noted in the previous section that real call center data is not accessible because of
confidentiality issues. Instead, data produced by Hindi speakers of English found in the Speech
Accent Archive (Weinberger, 2015) is used to gauge the intelligibility issues between call center
employees and American hearers. The “participants” in this study are 10 Hindi speakers who
recorded their speech for the Speech Accent Archive. Their English speech was compared with a
GAE speaker from Minnesota for the methodology (Appendix A and B). Table 4.1 presents
biometric information about the participants:
Table 4.1
Participants’ Biometric Information (Adapted from the George Mason Speech Accent Archive)
Speaker Age Gender Age of
English
onset
English
Learning
method
English
Residence
Length of
English
Residence
MN 143 42 Male 0 Naturalistic U.S., U.K. 42
Hindi 1 27 Male 2 Academic U.K., U.S. 3.5
Hindi 2 31 Male 3 Academic U.S., Canada 8
Hindi 3 42 Male 5 Academic U.S. 25
Hindi 4 28 Female 14 Academic U.S. 2
Hindi 5 64 Female 10 Academic U.S. 40
Hindi 6 27 Female 4 Academic U.S. 1
Hindi 7 60 Female 5 Academic U.S. 30
Hindi 8 19 Male 8 Academic U.S. 0.75
Hindi 9 31 Male 4 Academic U.S. 8
Hindi 10 19 Female 10.5 Naturalistic U.S. 8
To determine which segments may cause unintelligibility, the segmental data collected
from the participants was arranged in confusion tables to show which segments are prone to
unintelligibility and which are produced intelligibly. Table 4.2 focuses on consonants, while
Table 4.3 is devoted to vowels.

46
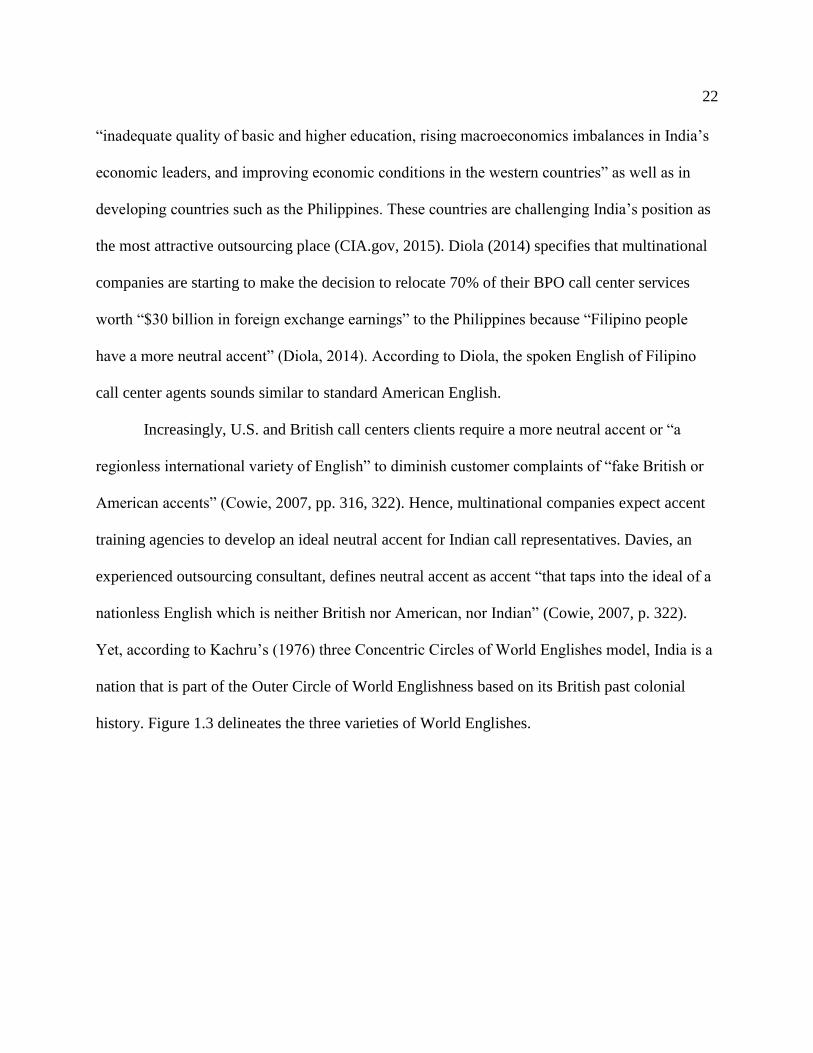
The confusion matrix tables (Table 4.2 and Table 4.3) show the total phonemes produced
by participants as “spoken stimuli”, whereas “perceived stimuli” represent what native speakers
actually heard. The bold numbers refer to instances of no intelligibility issues. Percentages of
positive transfer are also shown under the tables.
Consonants. Consonants are classified and analyzed according to their manner of
articulation, namely:
1) 300 stops
2) 379 fricatives and affricates
3) 180 nasals
4) 260 approximants
The confusion matrix table show the instances of positive and negative transfer of
consonants featuring:
1) stops
2) fricatives
3) nasals
4) approximants
47
Table 4.2
Consonant Confusion Matrix
Perceived stimuli by GAE listener
Stops Fricatives and Affricates Nasals Approximants
Spoken
stimuli
by
Hindi
Speaker
[p] [b] [t] [d] [k] [g] [s] [z] [f] [v] [θ] [ð] [ʃ] [tʃ] [m] [n] [ŋ] [l] [r] [w] Total
Percent of
positive
transfer
[p] 48 2 0 0 0 0 0 0 0 0 0 0 0 0 0 0 0 0 0 0 50 96%
[b] 1 49 0 0 0 0 0 0 0 0 0 0 0 0 0 0 0 0 0 0 50 98%
[t] 0 0 50 0 0 0 0 0 0 0 0 0 0 0 0 0 0 0 0 0 50 100%
[d] 0 0 4 46 0 0 0 0 0 0 0 0 0 0 0 0 0 0 0 0 50 92%
[k] 0 0 1 0 49 0 0 0 0 0 0 0 0 0 0 0 0 0 0 0 50 98%
[g] 0 0 0 0 3 47 0 0 0 0 0 0 0 0 0 0 0 0 0 0 50 94%
[s] 0 0 0 0 0 0 49 0 0 0 0 0 1 0 0 0 0 0 0 0 50 98%
[z] 0 0 0 0 0 0 39 61 0 0 0 0 0 0 0 0 0 0 0 0 100 61%
[f] 0 0 0 0 0 0 0 0 60 0 0 0 0 0 0 0 0 0 0 0 60 100%
[v] 0 0 0 0 0 0 0 0 11 18 0 0 0 0 0 0 0 0 0 0 29 62%
[θ] 0 0 33 0 0 0 1 0 0 0 15 1 0 0 0 0 0 0 0 0 50 30%
[ð] 0 0 2 26 0 0 0 0 0 0 0 31 0 0 0 1 0 0 0 0 60 52%
[ʃ] 0 0 0 0 0 0 1 0 0 0 0 0 19 0 0 0 0 0 0 0 20 95%
[tʃ] 0 0 0 0 0 0 0 0 0 0 0 0 0 10 0 0 0 0 0 0 10 100%
[m] 0 0 0 0 0 0 0 0 0 0 0 0 0 0 40 0 0 0 0 0 40 100%
[n] 0 0 0 0 0 0 0 0 0 0 0 0 0 0 0 110 0 0 0 0 110 100%
[ŋ] 0 0 0 0 1 0 0 0 0 0 0 0 0 0 0 0 29 0 0 0 30 97%
[l] 0 0 0 0 0 0 0 0 0 0 0 0 0 0 0 0 0 90 0 0 90 100%
[r] 0 0 0 0 0 0 0 0 0 0 0 0 0 0 0 0 0 0 120 0 120 100%
[w] 0 0 0 0 0 0 0 0 0 28 0 0 0 0 0 0 0 0 0 22 50 44%
Total 20 300 379 180 260 963 1119 86%
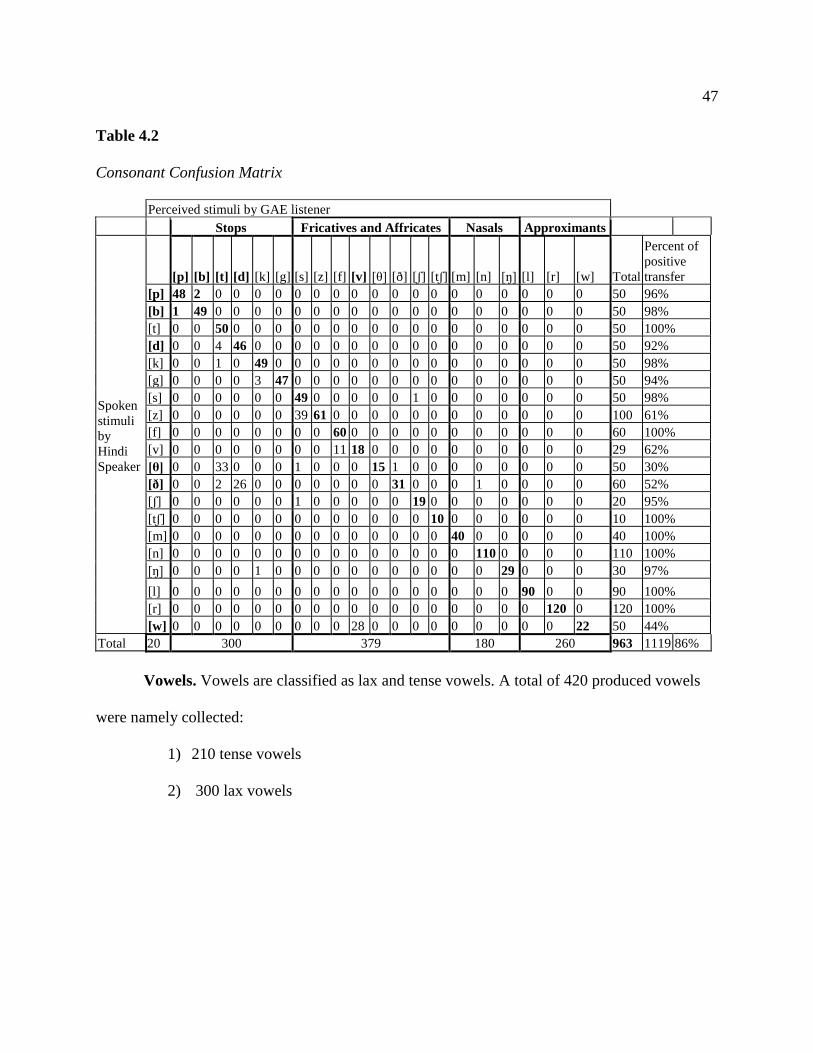
Vowels. Vowels are classified as lax and tense vowels. A total of 420 produced vowels
were namely collected:
1) 210 tense vowels
2) 300 lax vowels
48
Table 4.3
Vowel Confusion Matrix
Perceived stimuli by GAE listener
Vowel
Segments Tense Vowels Lax Vowels
[i] [e]/[ei] [o]/[oʊ] [u] [ɪ] [ɛ] [æ] [ɔ]/[ɑ] [ə]/[ʌ] [ʊ] Total Percent
Spoken
Stimuli
by Hindi
Speaker
[i] 80 0 0 0 0 0 0 0 0 0 80 100%
[e]/[ei] 0 43 0 0 0 0 7 0 0 0 50 86%
[o]/[oʊ] 0 0 48 0 0 0 0 1 1 0 50 96%
[u] 0 0 0 29 0 0 0 0 0 1 30 96%
[ɪ] 2 0 0 0 68 0 0 0 0 0 70 97%
[ɛ] 0 0 0 0 1 29 0 0 0 0 30 96%
[æ] 0 0 0 0 0 2 50 7 1 0 60 83%
[ɔ]/[ɑ] 0 0 2 0 0 0 0 57 0 1 60 95%
[ə]/[ʌ] 0 0 0 0 0 5 10 11 54 0 80 68%
[ʊ] 0 0 0 0 0 0 0 0 0 0 0 0%
Total 10 210 300 458 510 90%
Participants tended to transfer phonological processes such as rhoticity, nasalization,
allophones such as flaps, or at times, the segments were omitted in producing English consonants
and vowels. Still, as mentioned in previous chapters, only substitution of opposite phonemes
were the ones that were accounted for the tabulation of negative transfer. After providing the
number and percentage of positive and negative transfers, the following parts assess the
consequences of negative transfers by referring to the relative functional load of the segments
involved.
The next section is about mispronounced consonant that are likely to cause intelligibility
issues.

49
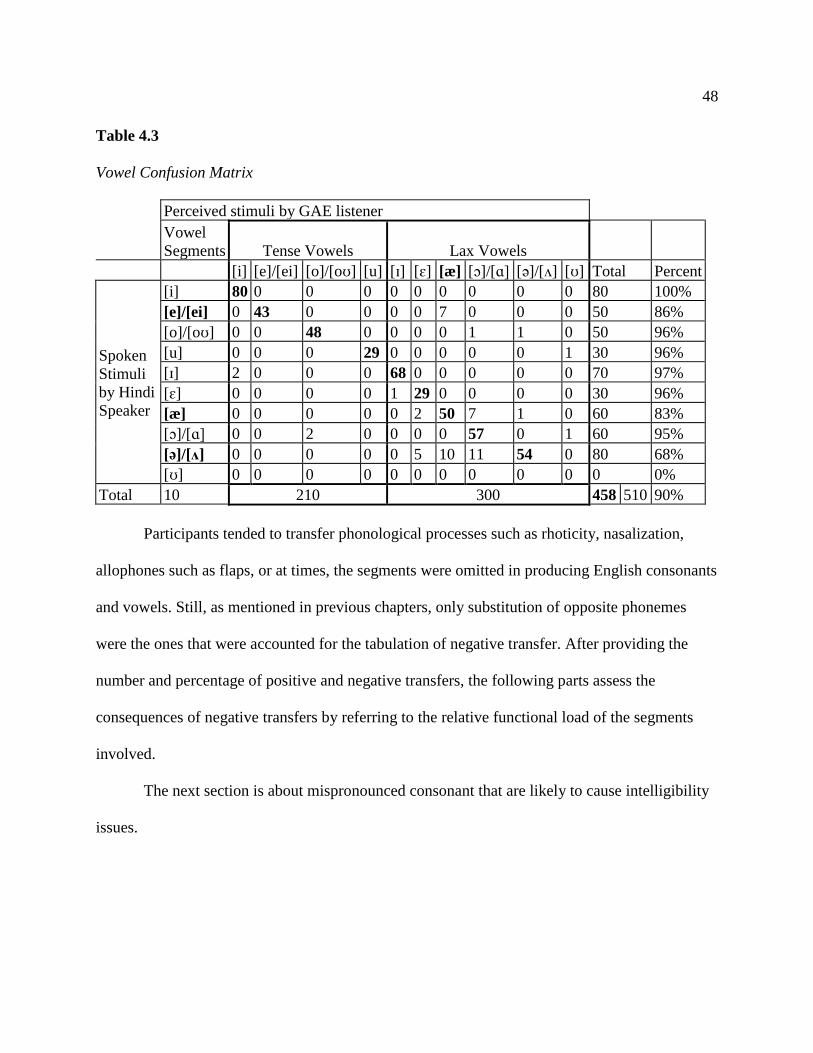
Confusion Data of Consonants
Based on the research findings, consequences of negative transfer are assessed, first in
general, and then by segment type, with implications. The most mispronounced consonants were
/θ, w, ð, z, d/, as it is represented in the pie chart below:
Figure 4.1 Hindi Speakers’ Consonants with the Greatest Negative Transfer Rate
Discussion. This thesis uses impressionistic assessment from the George Mason
University Speech Archive (Weinberger, 2015) to present specific features in the Indian accent
that cause intelligibility issues for customers.
For instance, according to Catford Systematic Description of English Phonology (Koffi,
2015), the Relative Functional Load of the following features: interdental fricatives / θ, ð/ and
dental plosives /t, d/ are below 20%. Thus, there is only slight intelligibility for English listeners
50
when Hindi speakers replace English words such as <thin, this> that contain the interdental
fricatives /θ, ð/ with the dental plosives (tʰ, d, dʰ).
Fairbanks and Misra (1966) also notes that Hindi has semi-consonants (j, r, l, w). Sailaja
(2009) explains that /w/ and /v/ are not distinguished by Hindi speakers, /v/ is an allophone of
/w/ (p.20). The relative functional load percentage of the minimal pairs v/w is 22%. In other
terms, the intelligibility rating is low. Sailaja (2009) gives as an example a Hindi movie
“advertisement that said: ‘villager, visionary, winner’ to serve as an alliterative play on words”
(p. 20). Likewise, the dark and clear varieties of /l/ have no distinction in Hindi.
Stops.
Figure 4.2 Hindi Speakers’ Total Negative Transfer Rate of Stops
The participants produced a total of 50 voiceless stops [p]. Of these, 48 were perceived
accurately, yielding an accuracy rate of 96%. In two instances [p] was confused with [b] (4%);
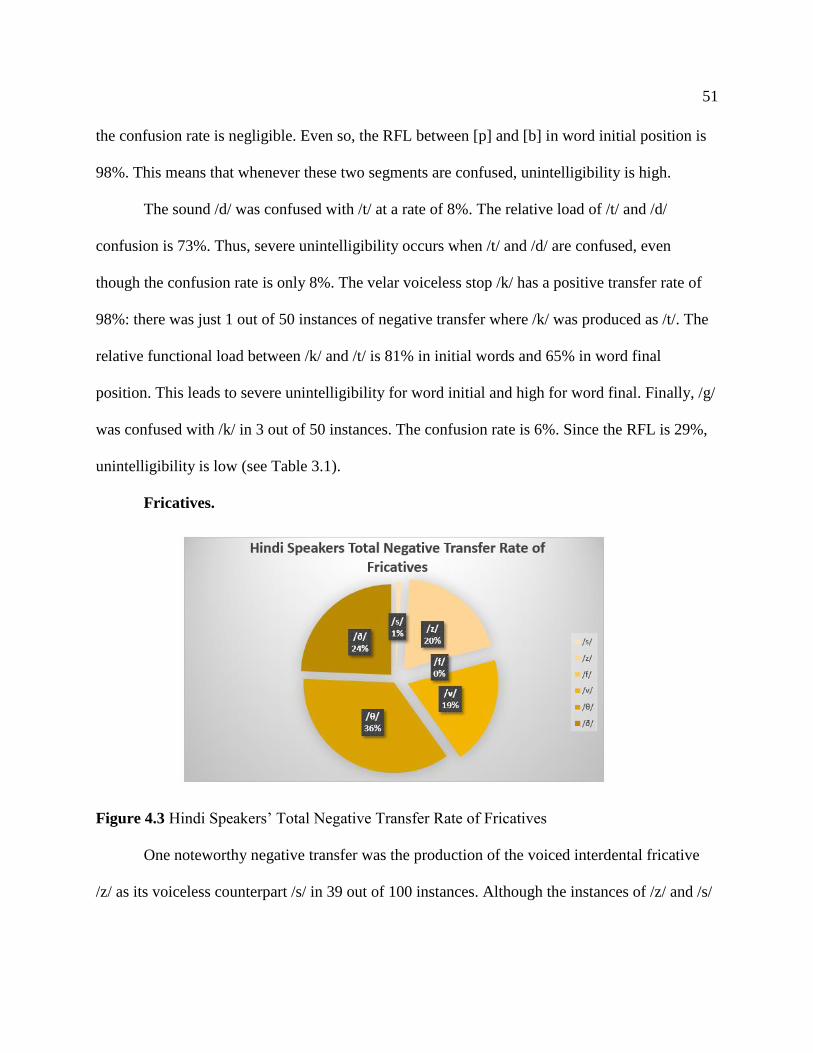
51
the confusion rate is negligible. Even so, the RFL between [p] and [b] in word initial position is
98%. This means that whenever these two segments are confused, unintelligibility is high.
The sound /d/ was confused with /t/ at a rate of 8%. The relative load of /t/ and /d/
confusion is 73%. Thus, severe unintelligibility occurs when /t/ and /d/ are confused, even
though the confusion rate is only 8%. The velar voiceless stop /k/ has a positive transfer rate of
98%: there was just 1 out of 50 instances of negative transfer where /k/ was produced as /t/. The
relative functional load between /k/ and /t/ is 81% in initial words and 65% in word final
position. This leads to severe unintelligibility for word initial and high for word final. Finally, /g/
was confused with /k/ in 3 out of 50 instances. The confusion rate is 6%. Since the RFL is 29%,
unintelligibility is low (see Table 3.1).
Fricatives.
Figure 4.3 Hindi Speakers’ Total Negative Transfer Rate of Fricatives
One noteworthy negative transfer was the production of the voiced interdental fricative
/z/ as its voiceless counterpart /s/ in 39 out of 100 instances. Although the instances of /z/ and /s/

52
confusion are many, the RFL is only 6%. Thus, such confusion rarely results in problems with
intelligibility.
Nasals. There was no instance of confusion among nasals or between nasals and any
other segments. Thus, there are no intelligibility issues regarding these segments. In fact,
nasalization is one of the main characteristics in Hindi; thus, Hindi speakers have no issues
transferring these segments in English.
Approximants. The approximant /w/ was very problematic. It was confused with /v/ in
28 out of 50 occurrences. This result confirms with Sailaja (2009) observations on Indian
English. The confusion rate is 44%. Even though, the RFL of /w/ versus /v/ is only 22%, this
confusion is perceptually salient and stigmatized.
Confusion Data of Vowels
Figure 4.4 Hindi Speakers’ Vowels with the Greatest Negative Transfer Rate
Figure 4.4, above, shows that the vowel segment [e] is produced as [æ] in 7 out of 50
instances. The error rate is 14%, and the RFL per Catford is 35%. This suggests a low
unintelligibility rating. The most noteworthy vowel confusions are related to the vowel sound
53
[æ], found in <hat>, which is replaced by [ʌ], [ɑ], and [ɛ]. The confusion rate is 18%. Koffi
(2015) indicates that [æ] is the third most frequent vowel in English. Consequently, this
substitution is likely to be noticeable. It is also very likely to create serious intelligibility issues,
as the RFL of / ʌ / versus /æ/ is 68%, and / æ/ and /ɔ/ has an RFL of 76%.
According to the confusion matrix of vowels (Table 2.3), the Hindi participants confused
/ æ/ as in <cat> with / ɔ/ as in <caught> in 7 out of 60 instances, or 11%. The data shows that
13% of Hindi English speakers confused / ʌ/ as in <cut> with / æ/ as in <cat>.

54
Chapter 5: Pedagogical Implications and Recommendations
Pedagogical Implications
In Indian schools, English language learning priorities are the following:
1) Vocabulary
2) Grammar
3) Fluency
Listening and pronunciation skills are not a priority. Teachers in public schools teach
English sounds by associating them with local language sounds through charts. For instance, a
Tamil learns English though a spelling chart in which the learner reads and memorizes the
spellings in the local language. As a result, the student’s global English pronunciation acquisition
is neglected. However, Maskara (2013) found that the need for good, intelligible English is real
if India is to remain an IT outsourcing destination. It is also a necessity for Indian students who
study abroad in the U.S., the U.K., Australia, and New Zealand. Indian professionals like doctors
or engineers traveling or working abroad need to be intelligible. Thus, pronunciation has become
a critical issue.
English Received Pronunciation International Phonetic Alphabet
Maskara (2013) proposes a pilot design as one solution for the teaching of Standard
English Phonetics to Indian students. Some concerns about the Standard English Phonetics that
Maskara addresses in a proposed pilot study consider: “how to teach international accent to the
student, at what level, who should teach, what should be the phonetics syllabus”. Another
consideration is “whether teaching English pronunciation may affect other aspects of English
learning” (Maskara, 2013).
55
For the proposed pilot study, English Received Pronunciation International Phonetic
Alphabet (IPA-RP) is chosen as the baseline because Indian English is closer to the Standard
British English. Next, Maskara advises comparing the prominent language of each state with RP
to find problems associated with each state of India. The three prominent languages that Maskara
focuses on are Hindi, Tamil, and Bengali.
The third recommendation that Maskara gives is to “prioritize the problem and design
the phonetics curriculum according to the priority order”. For instance, it was found in Chapter 4
of this study that [p] and [b] segments have a high RFL, which translates to severe
unintelligibility. This is a severe intelligibility issue because an American customer may likely
misunderstand the Indian English call agent when words containing the stop [p] are produced as
the stop [b]. Consequently, if Maskara’s third recommendation is followed, addressing the
confusion between [p] and [b] should be at the highest priority in the phonetics curriculum.
Implementation Guidelines
Guidelines for Indian Education System. Maskara (2013) recommends that students
should first become aware of phonetics; following that, the common problems across all the
states of India should be addressed. Finally, attention should be given to the state-specific
pronunciation issues.
Maskara (2013) proposes a scope and sequence curriculum. He proposes that IPA -RP be
taught from kindergarten to high school grades. For instance, “in the kindergarten, the teachers
should start teaching correct pronunciation by using native speakers’ rhymes, story, audio, and
video to motivate children to imitate the native speakers’ pronunciation” (Maskara, 2013, p. 6).
From 8th grade, Maskara proposes the introduction of the IPA-RT chart at that level and that
“some grade should be awarded based on pronunciation through assessments such as oral

56
repetition activities, multiple-choice hearing identification, reading aloud, simple dialogues, and
simple narrations” (Maskara, 2013, p. 6).
Guidelines for outsourced call center training agencies. According to Statista (2018),
India was still the global leading country for offshore business services in 2017, thanks to “its
financial attractiveness, the skills and availability of its people and the appropriateness of its
business environment for business process outsourcing and information technology outsourcing.
Revenues from outsourcing were $24.6 billion from business and 64.3 billion from information
technology (Statista, 2018).
Kumar Aquino, and Anderson (2007) indicate that potential language and communication
barriers between customers and India-based agents are the highest priority problem area to
consider when outsourcing to India (p. 338). Granered (2005) quotes a company spokesperson
who said: “They may be cheaper but I can certainly tell the difference when I am being served by
someone overseas” (p. 23). He advises callers and call center employees to adopt “a more
neutral outlook when handling calls in cross-cultural phone situations to reduce
misinterpretations of voice positions by the person on the other end of the line” (p. 55). He also
notes that call center employees should be trained to pay attention to their non-verbal cues in
their cadence and intonation to “carry a positive nature across wires and across cultures” (p. 55).
Furthermore, Kumar et al emphasize that “both guest satisfaction and profits are key
elements for outsourcing” (p. 337). Thus, they recommend that companies who want to
outsource to India “would first need to address potential language and communication
breakdowns perhaps, by investing more in training” (Kumar et al., 2007, p. 339).
Teachers in training agencies should be required to have command of a “highly
intelligible global or World English variety of pronunciation to serve as models” for their

57
trainees (Celce-Murcia et al., 2010, pp. 8-9). Thus, intense, comprehensive, and practical
traditional techniques such as the direct method’s “listen and imitate” could be practical ongoing
training activities for new call agent trainees (Lockwood, 2013, p. 271). In addition, Celce-
Murcia et al. (2010) recommend that pronunciation teachers need to do diagnostic work and be
selective in what they include in a pronunciation syllabus (p. 33). For instance, they refer to
Jenkins’s lingua franca core curriculum that prioritizes the teaching of tense and lax vowels and
eliminates the teaching of /θ, ð/ and [ɫ] (Celce-Murcia et al., 2010, p. 283), since /θ, ð/ can be
substituted with /t, d/, and [ɫ] can be replaced by a clear /l/ with no intelligibility issues. Jenkins’
tense-lax vowels distinction curriculum is an important recommendation, as it was determined in
this thesis that lax vowel /æ/ is confused with not only tense vowel /e/ but also with lax vowels /
ʌ/ and / ɔ/. In fact, Wells (1982) indicated that Indian English speakers know the pronunciation
of lax and tense vowels, but those whose command of English is not strong may lack phonemic
awareness of English lax vowels, since this is absent in their first language (p. 626).
In conclusion, Celce-Murcia et al. (2010) ‘s reference to Jenkins’s lingua franca core
curriculum can be applied to outsourced call centers in India. Furthermore, Maskara’s
recommendations to “prioritize the problem and design the phonetics’ curriculum according to
the priority order” would be more beneficial to teachers in training agencies than instructing
them to teach accent neutralization. The priority should be to teach articulation of /p/ versus. /b/,
/v/ versus. /w/, and to raise the phonemic awareness of the distinction between English lax
vowels, particularly / æ/ versus / ʌ, ɔ/.
This thesis addressed issues on the segmental level. The goal is not to neutralize accent.
Exhaustive training should continue in order to facilitate better communication between
American callers and Indian call agents.

58
Communication breakdowns are inevitable and will continue to occur. Therefore, the
goal of this thesis is not to provide a guide on how to prevent intelligibility issues, but to bypass
segmental intelligibility issues through the identification of problematic segments. The reader
can become more understanding of the varieties of English. Finally, the writer of this thesis
hopes that, thanks to the identification of intelligibility issues at the segmental level, less
psychological noise will occur between non-Indian English callers and Indian English call agents
in outsourced marketing and telemarketing call center interactions.
59
References
A.T. Kearney, Sethi, A., & Gott, J. (2017). 2017 A.T. Kearney global services location index.
Retrieved from A. T. Kearney website: https://www.atkearney.com/documents/20152
/793366/The+Widening+Impact+of+Automation.pdf/42b06cf4-e5f9-d8ec-a30c-
a82dd26d4953.
Bansal, R. K. (1969). The intelligibility of Indian English: Measurements of the intelligibility of
connected speech, and sentence and word material, presented to the listeners of different
nationalities. Hyderabad: Central Institute of English.
Bansal, R. K. (2015). The pronunciation of English in India. In S. Ramsaran (Ed.), Studies in the
pronunciation of English: A commemorative volume in honour of A.C. Gimson (pp. 219-
230). London: Routledge.
Bolton, K. (2013). World Englishes and international call centres. World Englishes, 32(4), 495-
502. doi:10.1111/weng.12057
Celce-Murcia, M., Brinton, D., Goodwin, J. M., & Griner, B. (2010). Teaching pronunciation: A
course book and reference guide. New York: Cambridge University Press.
CIA.gov. (2015). The World Factbook Central Intelligence Agency. Retrieved from https://ww
w.cia.gov/library/publications/the-world-factbook/geos/in.html.
Cowie, C. (2007). The accents of outsourcing: the meanings of "neutral" in the Indian call centre
industry. World Englishes, 26(3), 316-330. doi:10.1111/j.1467-971x.2007.00511.x
Derwing, T. (2003). What do ESL speakers say about their accents? Canadian Modern
Language Review, 59(4), 547-567. doi:10.3138/cmlr.59.4.547

60
Derwing, T. M. (2010). Utopian goals for pronunciation teaching. In Proceedings of the 1st
Pronunciation in Second Language Learning and Teaching Conference (pp. 24-37).
Diola, C. (2014, April 7).'Accent' matters: Philippines acquiring 70% of India call centers.
Retrieved from http://www.philstar.com/business/2014/04/07/1309878/accent-matters-
philippines-acquiring-70-india-call-centers.
Dow, R. S., & Baer, G. T. (2011). Self-paced phonics: a text for educators. Pearson.
Esposito, C. M., Khan, S., & Hurst, A. (n.d.). Breathy nasals in Indic Languages [Powerpoint
slides]. Retrieved from http://www.macalester.edu/academics/linguistics/facultystaff/
christinaesposito/documents/EspositoKhanHurstBreathinessandNasalityinIndicLanguage
sposter.pdf.
Ethnologue. (2016). Hindi. Retrieved from http://www.ethnologue.com/language/hin.
Ethnologue. (2017). Hindi. Retrieved from http://www.ethnologue.com/language/hin.
Fairbanks, G. H., & Misra, B. G. (1966). Spoken and written Hindi. Ithaca, NY: Cornell
University Press.
Flatworld Solutions Company. (2015).The outsourcing history of India. Retrieved from
Outsource2India (O2I website): http://www.outsource2india.com/why_india/articles/
outsourcing_history.asp.
Foreign Policy. (2012, November 26). 6- The end of Indian call centers. Retrieved from
http://foreignpolicy.com/2012/11/26/the-stories-you-missed-in-2012/.
Forey, G., & Lockwood, J. (2007). “I’d love to put someone in jail for this”: An initial
investigation of English in the business processing outsourcing (BPO) industry. English
for Specific Purposes, 26(3), 308-326. doi:10.1016/j.esp.2006.09.005

61
Fromkin, V., Rodman, R., & Hyams, N. (2014). Phonetics: the sounds of language. In An
introduction to language (9th ed., pp. 189-225). Canada: Cengage Learning.
Gaspar, J. E. (2014). Introduction to global business: Understanding the international
environment and global business functions. Buffalo, NY: Cengage Learning.
Granered, E. (2005). Global call centers: Achieving outstanding customer service across
cultures & time zones. Boston, MA: Nicholas Brealey International.
Grin, F. (2006). Economic considerations in language policy. The Encyclopedia of Applied
Linguistics (pp. 77-94). Malden, MA: Blackwell Publisher.
Handfield, R. (2006). A brief history of outsourcing. Retrieved from The supply chain resource
cooperative website: http://scm.ncsu.edu/scm-articles/article/a-brief-history-of-
outsourcing.
Hazan, V., & Simpson, A. (1998). The effect of cue-enhancement on the intelligibility of
nonsense word and sentence materials presented in noise. Speech Communication, 24(3),
211-226. doi:10.1016/s0167-6393(98)00011-9
Hofstede, G. (2016). India - Geert Hofstede. Retrieved from http://geert-hofstede.com/
india.html.
International Phonetic Alphabet. (2015). The International Phonetic Alphabet keyboard (2005
revised edition). Retrieved from www.internationalphoneticalphabet.org/ipa-sounds/ipa-
chart-with-sounds/.
Kachru, B. B. (1976). Indian English: A sociolinguistic profile of a transplanted language.
Kachru, B. B. (2005). Asian Englishes: Beyond the Canon (Asian Englishes today). Hong Kong:
Hong Kong University Press.

62
Kearney, A. T. (2017). The widening impact of automation. Retrieved from 2017 A. T. Kearney
Global Services Location Index website: http://www.atkearney.com/.
Klaveren, M. V., Tijdens, K., Hughie-Williams, M., & Martin, N. R. (2010). An overview report
of women's work and employment in India (3). Amsterdam: University of Amsterdam.
Klie, L. (2014). The new roles of customer service outsourcers. Customer Relationship
management, pp, 20-23. Retrieved from www.destinationCRM.com.
Koffi, E. (2009). The pronunciation of <-ED> in coda clusters in Somali-accented English
[PDF]. Retrieved from http://apling.public.iastate.edu/PSLLT/2009/koffi.pdf.
Koffi, E. (2014). English phonology and phonological processes [Students'workbook on L2
Phonology of English].
Koffi, E. (2015). The pronunciation of voiceless /th/ in seven varieties of L2 Englishes: focus on
intelligibility. Research Gate. Retrieved from https://www.researchgate.net/
publication/282024463
Kumar, S., Aquino, E. C., & Anderson, E. (2007). Application of a process methodology and a
strategic decision model for business process outsourcing. Information Knowledge
Systems Management, 6(4), 323-342.
Kumar, S., Holden, N., & Igo, L. (2009). A decision modelling framework to analyze offshore
outsourcing changes for U.S. manufacturers. Journal of Revenue and Pricing
Management, 8(5), 424-437. doi:10.1057/rpm.2009.2
Ladefoged, P., & Disner, S. F. (2012). Vowels and consonants (3rd ed.).
Lam, M., & Yu, C. (2013). English and Cantonese in a bilingual call centre in Hong Kong.
World Englishes, 32(4), 521-535. doi:10.1111/weng.12059
63
Lockwood, J. (2010). Are we getting the right people for the job? A study of English language
recruitment assessment practices in the business process outsourcing sector: India and the
Philippines. Journal of Business Communication, 49(2), 109-127.doi:10.1177/002194361
2436975
Lockwood, J. (2013). International communication in a technology services call centre in
India. World Englishes, 32(4), 536-550. doi:10.1111/weng.12060
Nelson, C. L. (2011). Intelligibility since 1969. Malden, MA: Blackwell Publishing, Ltd.
Maddieson, I., & Disner, S. F. (2009). Patterns of sounds. Cambridge: Cambridge University
Press.
Maps of the world. (2016). Maps of India. Retrieved from http://www.mapsofindia.com/
worldmap/.
Masani, Z. (2012, November 27). English or Hinglish? India's choice. Retrieved from
https://www.bbc.com/news/magazine-20500312.
Maskara, R. (2013). Introducing English pronunciation teaching in the Indian educational
system: 'why' and 'how'. Language in India, 13(3), 333-346.
McLeod, J. (2002). The history of India. Westport, CT: Greenwood Press.
Munro, M. J., & Derwing, T. M. (1995). Foreign accent, comprehensibility, and intelligibility
in the speech of second language learners. Language Learning. doi:10.1111/j.1467-
1770.1995.tb00963.x
Munro, M. J., & Derwing, T. M. (2008). Segmental Acquisition in Adult ESL Learners: A
longitudinal study of vowel production. Language Learning, 58(3), 479-502. doi:10.11
11/j.1467-9922.2008.00448.x

64
National Informatics Center. (2016). National portal of India. Retrieved from http://www.
ibef.org/.
Observatory of Economic Complexity. (2013). OEC-India (IND) exports, imports, and trade
partners. Retrieved from http://atlas.media.mit.edu/en/profile/country/ind/.
Omniglot. (2016). Hindi alphabet, pronunciation and language. Retrieved from http://www.
omniglot.com/writing/hindi.htm.
Optimal Outsourcing. (2015, April 16). What is outsourcing and offshoring? [Video file].
Retrieved from https://youtu.be/bobQQAF9rGk.
Oshri, I. (2015). The handbook of global outsourcing and offshoring: The definitive guide to
strategy and operations. Basingstoke, UK : Palgrave Macmillan.
Oshri, I., Kotlarski, J., & Willcocks, L. P. (2009). The handbook of global outsourcing and
offshoring. Retrieved from https://pdfs.semanticscholar.org/e986/0df418b4a3109fa91fc
54fdd9266a67865dc.pdf.
Pandita, R. (2014). Growth and distribution of Hindi, English, and Urdu periodicals in India: An
analysis (1941-2013). Journal of library and information media, 34(4), 309-316.
doi:10.14429/djlit.33.5920
PLS Environment Development. (2012). Hindi phonemic distribution (consonants). Retrieved
from http://www.pedagogymain.iitkgp.ernet.in/IDEWeb/hindi.jsp.
Raju, R. (2012). Intercultural communication training in IT outsourcing companies in India: A
case study. IEEE Transactions on Professional Communication, 55(3), 262-274.
doi:10.1109/TPC.2012.2207834
Rowe, A. C., Malhotra, S., & Kimberlee, K. (2013). Answer the call: Virtual migration in Indian
call centers [site.ebrary.com].
65
Sailaja, P. (2009). Indian English. Edinburgh, U.K.: Edinburgh University Press.
Scheiber, N. (2004, May 9). India is losing edge. The New York Times [NY], p. 3. Retrieved
from http://www.nytimes.com/.
Shastri, R. (2004). The economics of Indian Call center models. Customer Interaction Solutions,
23(5), 58.
Smith, B. Q. (2006). Outsourcing and digitized work spaces: some implications of the
intersections of globalization, development, and work practices. Journal of Adolescent &
Adult Literacy, 49(7), 596-607. doi:10.1598/jaal.49.7.5
Statista. (2018). Outsourcing: revenue by service type 2017. Retrieved from https://www.statista
.com/statistics/189800/global-outsourcing-industry-revenue-by-service-type/.
The Economist. (2012). At the front of the back-office business process outsourcing, 403(8790),
68. Retrieved from https://www.economist.com/business/2012/06/23/at-the-front-of-
the-back-office.
The Economist. (2013, January 19). Here, there and everywhere. Special report: Outsourcing
and offshoring. https://www.economist.com/schumpeter/2013/01/17/here-there-and-
everywhere
The Economist. (2013, January 19). India's outsourcing business on the turn. Retrieved from
http://www.economist.com/news/special-report/21569571-india-no-longer-automatic-
choice-it-services-and-back-office-work-turn.
The Economist. (2015, June 30). Literacy rate at 71% in rural India, 86% in urban: Survey—
The Economic Times. Retrieved from http://economictimes.indiatimes.com/news/
economy/indicators/literacy-rate-at-71-in-rural-india-86-in-urban
survey/articleshow/47886609.cms.
66
Theophilus, K. (2007). Hindi and Urdu. Retrieved from Optician website: http://opticianonline.
Net.
Transparency International. (2015). Transparency International—country profiles. Retrieved
from https://www.transparency.org/country/#IND.
UCLA. (1999). A brief profile of the Hindi language [PDF]. Retrieved from http://hindi.
linguistics.illinois.edu/documents/abriefprofileofthehindilanguage_000.pdf.
UNICEF. (2016). India statistics. Retrieved from http://www.unicef.org/
infobycountry/india_statistics.html.
U.S. International Trade Commission. (2010). An overview and examination of the Indian
services sector (ID-26). Office of industries. ITC.
U.S. International Trade Commission. (2014). Trade, investment, and industrial policies in
India: Effects on the U.S. economy (4501). ITC.
Vaddapali, M. K. (2012). Word accent in English spoken by students of engineering in India: A
pedagogical perspective on intelligibility (1930-2940) (Doctoral dissertation). Retrieved
from EBSCO Academic Onefile (via SFX). (1930-2940).
Walker, C., & Hartley, M. (2012, December 16). The culture shock of India's call centers.
Retrieved from http://www.forbes.com/sites/morganhartley/2012/12/16/the-culture-
shock-of-indias-call-centers/.
Warburton, K. (2015, March 31). 5 key cultural issues when outsourcing to India. Retrieved
from https://www.linkedin.com/pulse/5-key-cultural-issues-when-outsourcing-india-
keith-warburton.
Weinberger, S. (2015). Speech accent archive. George Mason University. Retrieved from
http://accent.gmu.edu.

67
Wells, J. C. (1982). Accents of English. New York: Cambridge University Press.
Winn, P. (2014, May 12). How the Philippines is crushing the Indian call center business.
Retrieved from http://theweek.com/articles/447063/how-philippines-crushing-indian-call-
center-business.
Yazan, B. (2015). Intelligibility. ELT Journal, 69(2), 202-204. doi:10.1093/elt/ccu073
World Bank. (2014). Total population data. Retrieved from https://data.worldbank.org/indicator/
sp.pop.totl?locations=in.
World Bank. (2018). GDP growth (annual %). Retrieved from https://data.worldbank.org/
indicator/ny.gdp.mktp.kd.zg?end=2017&locations=in&start=1961&view=chart.

68
Appendix A: Consonant System
MN 143 M is chosen as the “model” native speaker of English, as his English is considered a
variety of General American English. The following charts show the speech of 10 English as
Second Language speakers with Hindi as their first language. The data was collected from the
Speech Accent Archive (Weinberger, 2015). The data shows some phonological processes as
perceived by English listeners. The consonant tables are grouped under manner of articulation.
The use of tables were made by the researcher to identify the positive and negative instances when
Hindi speakers realize the observed phonological segment in relation to MN 143 M.
Stops
Table A.1 [p]
Words please spoons peas plastic scoop Total
MN
143M
[ph] [p] [ph] [ph] [p] [p]
Hindi 1M p p p p b 1/5
Hindi 2M ph p p p p 5/5
Hindi 3M p p p p p 5/5
Hindi 4F p p ph ph p 5/5
Hindi 5F p p p p b 5/5
Hindi 6F p p p p p 5/5
Hindi 7F p p p p p 5/5
Hindi 8M p p p p b 5/5
Hindi 9M p p p p p 5/5
Hindi 10F pʰ p p p p 5/5
Total 10 10 10 10 8 48/50
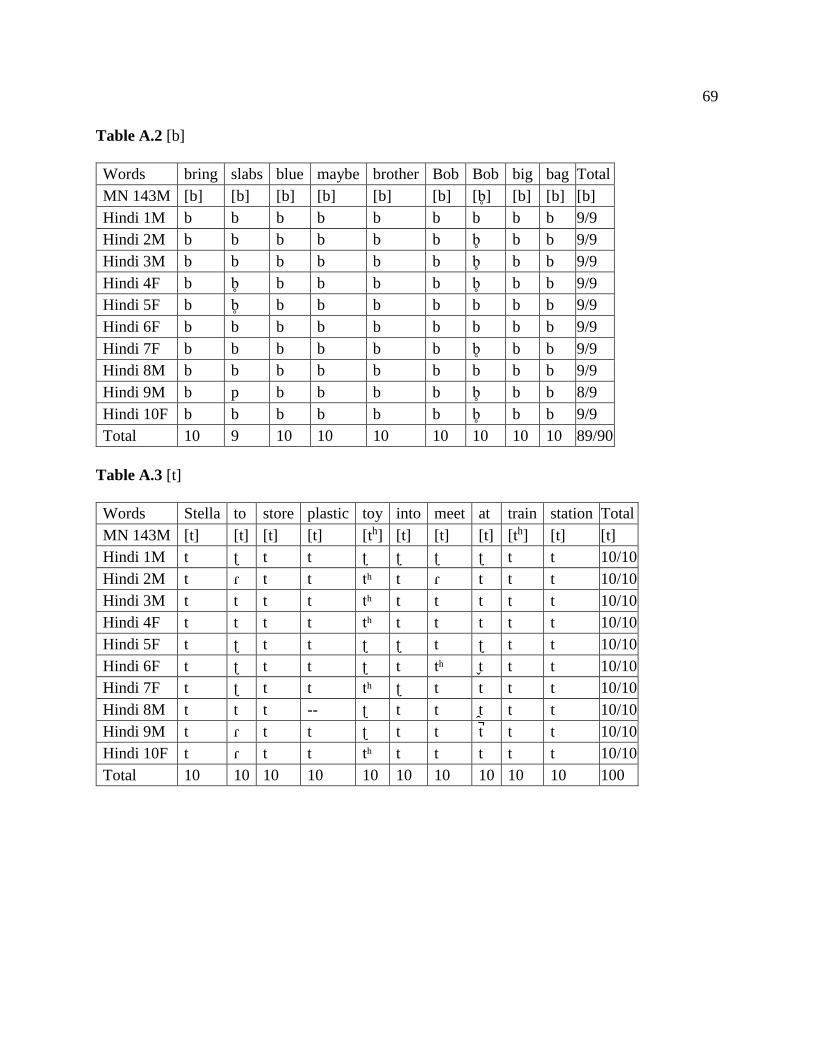
69
Table A.2 [b]
Words bring slabs blue maybe brother Bob Bob big bag Total
MN 143M [b] [b] [b] [b] [b] [b] [b] [b] [b] [b]
Hindi 1M b b b b b b b b b 9/9
Hindi 2M b b b b b b b b b 9/9
Hindi 3M b b b b b b b b b 9/9
Hindi 4F b b b b b b b b b 9/9
Hindi 5F b b b b b b b b b 9/9
Hindi 6F b b b b b b b b b 9/9
Hindi 7F b b b b b b b b b 9/9
Hindi 8M b b b b b b b b b 9/9
Hindi 9M b p b b b b b b b 8/9
Hindi 10F b b b b b b b b b 9/9
Total 10 9 10 10 10 10 10 10 10 89/90
Table A.3 [t]
Words Stella to store plastic toy into meet at train station Total
MN 143M [t] [t] [t] [t] [th] [t] [t] [t] [th] [t] [t]
Hindi 1M t ʈ t t ʈ ʈ ʈ ʈ t t 10/10
Hindi 2M t ɾ t t tʰ t ɾ t t t 10/10
Hindi 3M t t t t tʰ t t t t t 10/10
Hindi 4F t t t t tʰ t t t t t 10/10
Hindi 5F t ʈ t t ʈ ʈ t ʈ t t 10/10
Hindi 6F t ʈ t t ʈ t tʰ t t t 10/10
Hindi 7F t ʈ t t tʰ ʈ t t t t 10/10
Hindi 8M t t t -- ʈ t t t t t 10/10
Hindi 9M t ɾ t t ʈ t t t t t 10/10
Hindi 10F t ɾ t t tʰ t t t t t 10/10
Total 10 10 10 10 10 10 10 10 10 10 100

70
Table A.4 [d]
Words and need and Kids red and Wednesday Wednesday Total
MN 143M [--] [d] [--] [d] [d] [--] [--] [d] [d]
Hindi 1M -- ɾ d d d -- -- d 8/8
Hindi 2M d d d t d -- -- d 7/8
Hindi 3M d ɾ -- d d -- -- d 8/8
Hindi 4F -- d -- d d -- -- d 8/8
Hindi 5F -- d d d -- d -- d 8/8
Hindi 6F -- ɾ -- d d -- -- d 8/8
Hindi 7F -- d -- d d -- -- t 7/8
Hindi 8M -- d -- d d -- -- t 7/8
Hindi 9M -- d -- t d -- -- d 7/8
Hindi 10F -- ɾ -- d d -- -- d 8/8
Total 10 10 10 8 10 10 10 8 76/80
Note: [--] denotes a deleted segment.
Table A.5 [k]
Words Call ask six Thick snack plastic snake kids can scoop Total
MN 143 [kh] [k] [ks] [k] [k] [k] [k] [kh] [kh] [k] [k]
Hindi 1M k k ks k k k k k k k 10/10
Hindi 2M kʰ k ks t k k k k k k 9/10
Hindi 3M k k ks k k k k k k k 10/10
Hindi 4F kʰ k ks k k k k kʰ k k 10/10
Hindi 5F k k ks k k k kʰ k k k 10/10
Hindi 6F k k ks k k k k k k k 10/10
Hindi 7F k k ks k ʔ k k k k k 10/10
Hindi 8M k k ks k k k k k k k 10/10
Hindi 9M k k ks k k k k k k k 10/10
Hindi 10F kʰ k ks k k k k k k k 10/10
Total 10 10 10 10 10 10 10 10 10 10 99/100

71
Table A.6 [g]
Words big frog bags Go Total
MN 143M [g ] [g ] [g] [g] [g]
Hindi 1M g g g g 4/4
Hindi 2M g g g g 4/4
Hindi 3M g g g g 4/4
Hindi 4F g g g g 4/4
Hindi 5F g g g g 4/4
Hindi 6F k g g g 3/4
Hindi 7F g g g g 4/4
Hindi 8M g g k g 3/4
Hindi 9M k g g g 3/4
Hindi 10F g g g g 4/4
Total 8 10 9 10 37/40
Fricatives/Affricates
Table A.7 [s]
Words Stella ask six spoons snow slabs snack small plastic snake scoop station Total
MN
143M
[s] [s] [s] [s] [s] [s] [s] [s] [s] [s] [s] [s] [s]
Hindi
1M
s s s s s s s s s s s s 10/10
Hindi
2M
s s s s s s s s s s s s 10/10
Hindi
3M
s s s s s s s s s s s s 10/10
Hindi
4F
s s s s s s s s s s s s 10/10
Hindi
5F
s s s s s s s s s s s s 10/10
Hindi
6F
s s s s s s s s s s s s 10/10
Hindi
7F
s s s s s s s s s s s s 10/10
Hindi
8M
s s s s s s s s s s s s 10/10
Hindi
9M
s s s s ʃ s s s s s s s 9/10
Hindi
10F
s s s s s s s s s s s s 10/10
Total 10 10 10 10 9 10 10 10 10 10 10 10 119

72
Table A.8 [z]
Words please these things spoons slabs kids these things bags Wednesday Total
MN
143M
[z] [z] [z] [z] [z] [z] [z] [z] [z] [z] [z]
Hindi 1M s z s z z z z z z z 9/10
Hindi 2M s z z z z s s s s s 4/10
Hindi 3M s s s z z z s s z s 4/10
Hindi 4F s z z z s s z z s z 6/10
Hindi 5F z z s s s z s z z z 6/10
Hindi 6F z z z z z s z z z z 9/10
Hindi 7F z z z z z s z z s s 7/10
Hindi 8M z s z z z z s s s s 5/10
Hindi 9M s z s s s s z s s z 3/10
Hindi 10F s z z z z z z z z z 9/10
Total 4/10 8/10 6/10 8/10 7/10 5/10 6/10 6/10 5/10 6/10 61/100
Table A.9 [f]
Words from fresh five for frog for Total
MN 143M [f] [f] [f] [f] [f] [f] [f]
Hindi 1M f f f f f f 6/6
Hindi 2M f f f f f f 6/6
Hindi 3M f f f f f f 6/6
Hindi 4F f f f f f f 6/6
Hindi 5F f f f f f f 6/6
Hindi 6F f f f f f f 6/6
Hindi 7F f f f f f f 6/6
Hindi 8M f f f f f f 6/6
Hindi 9M f f f f f f 6/6
Hindi 10F f f f f f f 6/6
Total 10/10 10/10 10/10 10/10 10/10 10/10 60/60

73
Table A.10 [v]
Words of five of Total
MN 143M [f] [v] [v] [v]
Hindi 1M f f v 2/3
Hindi 2M f v v 3/3
Hindi 3M f v v 3/3
Hindi 4F v v v 3/3
Hindi 5F f v v 3/3
Hindi 6F v v v 3/3
Hindi 7F f f v 2/3
Hindi 8M f -- v 2/3
Hindi 9M f v f 2/3
Hindi 10F f v v 3/3
Total 8/10 7/10 9/10 24/30
Table A.11 [θ]
Words things with thick things three Total
MN 143M [θ] [θ] [θ] [θ] [θ] [θ]
Hindi 1M t t θ t t 1/5
Hindi 2M θ t t s t 1/5
Hindi 3M θ θ θ t θ 4/5
Hindi 4F t θ θ t t 2/5
Hindi 5F t t t t t 0/5
Hindi 6F θ t t θ t 2/5
Hindi 7F t t t t t 0/5
Hindi 8M t t t t t 0/5
Hindi 9M t θ t t t 1/5
Hindi 10F θ ð θ θ θ 4/5
Total 4/10 3/10 4/10 2/10 2/10 19/50

74
Table A.12 [ð]
Words these the brother the these the Total
MN 143M [n] [ð] [ð] [ð] [ð] [ð] [ð]
Hindi 1M d ð ð ð d ʈ 3/6
Hindi 2M d n ð ð d d 4/6
Hindi 3M d ð ð ð d d 3/6
Hindi 4F ð d ð ð d ð 2/6
Hindi 5F d d ð d d ɖ 5/6
Hindi 6F ð ð ð ð ð ð 6/6
Hindi 7F d d ð d d ð 4/6
Hindi 8M t d ð ð d d 2/6
Hindi 9M d ð ð d d d 3/6
Hindi 10F ð ð ð ð ð ð 6/6
Total 3/10 5/10 10/10 7/10 2/10 4/10 29/60
Affricates
Table A.13 [ʃ]
Words fresh station Total
MN 143M [ʃ] [ʃ] [ʃ]
Hindi 1M ʃ ʃ 2/2
Hindi 2M s ʃ 1/2
Hindi 3M ʃ ʃ 2/2
Hindi 4F ʃ ʃ 2/2
Hindi 5F ʃ ʃ 2/2
Hindi 6F ʃ ʃ 2/2
Hindi 7F ʃ ʃ 2/2
Hindi 8M ʃ ʃ 2/2
Hindi 9M ʃ ʃ 2/2
Hindi 10F ʃ ʃ 2/2
Total 10 10 20/20

75
Table A.14 [tʃ]
Words cheese Total
MN 143M [tʃ] [tʃ]
Hindi 1M tʃ 10/10
Hindi 2M tʃ 10/10
Hindi 3M tʃ 10/10
Hindi 4F tʃ 10/10
Hindi 5F tʃ 10/10
Hindi 6F tʃ 10/10
Hindi 7F tʃ 10/10
Hindi 8M tʃ 10/10
Hindi 9M tʃ 10/10
Hindi 10F tʃ 10/10
Total 10 10/10
Nasals
Table A.15 [m]
Words from maybe small meet Total
MN 143M [m] [m] [m] [m] [m]
Hindi 1M m m m m 4/4
Hindi 2M m m m m 4/4
Hindi 3M m m m m 4/4
Hindi 4F m m m m 4/4
Hindi 5F m m m m 4/4
Hindi 6F m m m m 4/4
Hindi 7F m m m m 4/4
Hindi 8M m m m m 4/4
Hindi 9M m m m m 4/4
Hindi 10F m m m m 4/4
Total 10 10 10 10 40

76
Table A.16 [n]
Words snow and snack need snake can into and Wednesday train station Total
MN 143M [n] [n] [n] [n] [n] [n] [n] [n] [n] [n] [n] [n]
Hindi 1M n n n n n n n n n n n 11/11
Hindi 2M n n n n n n n n n n n 11/11
Hindi 3M n n n n n n n n n n n 11/11
Hindi 4F n n n n n n n n n n n 11/11
Hindi 5F n n n n n n n n n n n 11/11
Hindi 6F n n n n n n n n n n n 11/11
Hindi 7F n n n n n n n n n n n 11/11
Hindi 8M n n n n n n n n n n n 11/11
Hindi 9M n n n n n n n -- n n n 11/11
Hindi 10F n n n n n n n n n n n 11/11
Total 10 10 10 10 10 10 10 10 10 10 10 110
Table A.17 [ŋ]
Words bring things things Total
MN 143M [ŋ] [ŋ] [ŋ] [ŋ]
Hindi 1M ŋ ŋ ŋ 3/3
Hindi 2M ŋ ŋ ŋ 3/3
Hindi 3M ŋ ŋ ŋ 3/3
Hindi 4F ŋ ŋ ŋ 3/3
Hindi 5F ŋ k ŋ 2/3
Hindi 6F ŋ ŋ ŋ 3/3
Hindi 7F ŋ ŋ ŋ 3/3
Hindi 8M ŋ ŋ ŋ 3/3
Hindi 9M ŋ ŋ ŋ 3/3
Hindi 10F ŋ ŋ ŋ 3/3
Total 10 10 10 /30

77
Approximants
Table A.18 [l]
Words please call Stella slabs blue also small plastic will Total
MN 143M [l] [lɣ] [l] [l] [l] [lɣ] [lɣ] [p] [lɣ] [l]
Hindi 1M l l l l l l l l l 90/90
Hindi 2M l l l l l l l l l 90/90
Hindi 3M l l l l l l l l l 90/90
Hindi 4F l l l l l l l l l 90/90
Hindi 5F l l l l l l l l l 90/90
Hindi 6F l l l l l l l l l 90/90
Hindi 7F l l l l l l l l l 90/90
Hindi 8M l l l l l l l l l 90/90
Hindi 9M l l l l l l l l l 90/90
Hindi 10F l l l l l l l l l 90/90
Total 10 10 10 10 10 10 10 10 10 90/90
Table A.19 [ɹ]/ [r]
Words her her from store fresh for frog brother three red her train Total
MN 143M [ɚ ] [ɚ] [ɹ] [ɹ] [ɹ] [ɔ˞] [ɹ] [ɚ] [ɹ] [ɹ] [ɚ ] [ɹ] [ɹ]/[r]
Hindi 1M -- ɚ ɹ ɹ r r ɹ r r r r ɹ 13/13
Hindi 2M ɚ ɹ ɹ ɹ ɹ ɹ ɹ ɹ ɹ ɹ ɹ ɹ 13/13
Hindi 3M ɚ ɚ ɹ ɹ r ɚ ɹ ɹ r r ɚ ɹ 13/13
Hindi 4F -- ɝ ɹ ɹ ɹ ɹ ɹ ɹ ɹ ɹ ɝ ɹ 13/13
Hindi 5F ɽ ɽ ɽ r r r ɽ r r ɽ ɽ r 13/13
Hindi 6F -- ɹ ɹ ɹ r ɹ ɹ ɹ r ɽ ɹ ɹ 13/13
Hindi 7F ɹ ɹ ɹ ɹ r ɹ ɹ ɹ r ɽ ɽ ɹ 13/13
Hindi 8M ɹ ɹ ɹ ɹ ɹ -- ɹ ɹ ɹ ɹ ɹ ɹ 13/13
Hindi 9M -- -- ɹ ɹ ɹ -- ɹ ɹ ɹ ɹ ɚ ɹ 13/13
Hindi 10F ɹ ɚ r ɹ r ɹ ɹ ɹ ɹ ɹ ɹ ɹ
Total 10/10 10/10 10/10 10/10 10/10 10/10 10/10 10/10 10/10 10/10 10/10 10/10 130/130

78
Table A.20 [w]
Words with we we will Wednesday Total
MN 143M [w] [w] [w] [w] [w] [w]
Hindi 1M v v v v v 0/5
Hindi 2M w w -- w v 1/5
Hindi 3M v v v v v 0/5
Hindi 4F w w w w v 1/5
Hindi 5F v v v v v 0/5
Hindi 6F v v v v v 0/5
Hindi 7F v v v v v 0/5
Hindi 8M w w w w w 5/5
Hindi 9M w w w w w 5/5
Hindi 10F w w w w w 5/5
Total 5/10 5/10 5/10 5/10 3/10 23/50

79
Appendix B: Vowel System
MN 143 M is chosen as the “model” native speaker of English, as his English is considered
a variety of General American English. The following charts show the speech of 10 English as
Second Language speakers with Hindi as their first language. The data was collected from the
Speech Accent Archive (Weinberger, 2015). The data shows some phonological processes as
perceived by English listeners. The vowels are classified as either tense vowels and lax vowels.
However, the analysis does not include the length of time participants took to produce each
segment. Only a negative transfer of two opposite phonemes was counted.
Tense Vowels
Table B.1 Vowel [i]
Words please these peas cheese we need meet three Total
MN 143M [i] [i] [i] [i] [i] [i] [i] [i] [i]
Hindi 1M i i i i i i i i 8/8
Hindi 2M i i iː iː i iː iː i 8/8
Hindi 3M i i iː iː i i iː iː 8/8
Hindi 4F iː iː iː iː i iː i i 8/8
Hindi 5F i iː iː iː i iː i iː 8/8
Hindi 6F iː i i iː i i i i 8/8
Hindi 7F i iː iː iː i i i iː 8/8
Hindi 8M iː iː iː iː i i i i 8/8
Hindi 9M i i i i i i i i 8/8
Hindi 10F i i iː i i i i i 8/8
Total 10/10 10/10 10/10 10/10 10/10 10/10 10/10 10/10 80/80

80
Table B.2 Vowel [e]/ [eɪ]
Words maybe snake Wednesday train station Total
MN 143M [eɪ] [eɪ] [eɪ] [eɪ] [eɪ] [e]/ [eɪ]
Hindi 1M eɪ æ eɪ eɪ eɪ 4/5
Hindi 2M eɪ æ eɪ eɪ eɪ 4/5
Hindi 3M eɪ eɪ eɪ eɪ eɪ 5/5
Hindi 4F eɪ æ eɪ eɪ eɪ 4/5
Hindi 5F eɪ æ eɪ eɪ eɪ 4/5
Hindi 6F eɪ æ eɪ eɪ eɪ 4/5
Hindi 7F eɪ eɪ e eɪ eɪ 5/5
Hindi 8M eɪ æ eɪ eɪ eɪ 4/5
Hindi 9M eɪ eɪ eɪ eɪ eɪ 5/5
Hindi 10F eɪ æ eɪ eɪ eɪ 4/5
Total 10/10 3/10 10/10 10/10 10/10 47/50
Table B.3 Vowel [o]/ [oʊ]
Words snow also go Total
MN 143M [oʊ] [o] [oʊ] [o]/ [oʊ]
Hindi 1M o o o 3/3
Hindi 2M o o o 3/3
Hindi 3M o o oʊ 3/3
Hindi 4F oʊ ɔ oʊ 3/3
Hindi 5F oʊ o o 3/3
Hindi 6F o ə oʊ 3/3
Hindi 7F o o oʊ 3/3
Hindi 8M oʊ o o 3/3
Hindi 9M o o o 3/3
Hindi 10F oʊ o oʊ 3/3
Total 10/10 10/10 10/10 30/30

81
Table B.4 Vowel [u]
Words spoons blue scoop Total
MN 143M [u] [u] [u] [u]
Hindi 1M u u u 3/3
Hindi 2M u u u 3/3
Hindi 3M u u u 3/3
Hindi 4F u u u 3/3
Hindi 5F ʊ u u 2/3
Hindi 6F u u u 3/3
Hindi 7F u u u 3/3
Hindi 8M u u uː 3/3
Hindi 9M u u u 3/3
Hindi 10F u u u 3/3
Total 9/10 10/10 10/10 29/30
Lax Vowels
Table B.5 Vowel [ɪ]
Words with six thick plastic kids big will Total
MN 143M [ɪ] [ɪ] [ɪ] [ɪ] [ɪ] [ɪ] [ɪ] [ɪ]
Hindi 1M ɪ ɪ ɪ ɪ ɪ ɪ ɪ 7/7
Hindi 2M ɪ ɪ ɪ ɪ ɪ ɪ ɪː 7/7
Hindi 3M ɪ ɪ ɪ ɪ ɪ ɪ ɪ 7/7
Hindi 4F ɪ ɪ ɪ ɪ ɪ ɪ ɪ 7/7
Hindi 5F ɪ ɪ i ɪ ɪ ɪ ɪ 6/7
Hindi 6F ɪ ɪ ɪ ɪ ɪ ɪ ɪ 7/7
Hindi 7F ɪ ɪ ɪ ɪ ɪː ɪ ɪ 7/7
Hindi 8M ɪ ɪ ɪ ɪ ɪ ɪ ɪ 7/7
Hindi 9M ɪ ɪ ɪ i ɪ ɪ ɪ 6/7
Hindi 10F ɪ ɪ ɪ ɪ ɪ ɪ ɪ 7/7
Total 10/10 10/10 9/10 9/10 10/10 10/10 10/10 68/70

82
Table B.6 Vowel [ɛ]
Words fresh red Stella Total
MN 143M [ɛ] [ɛ] [ɛ] [ɛ]
Hindi 1M ɛ ɛ ɛ 3/3
Hindi 2M ɛ ɛ ɛ 3/3
Hindi 3M ɛ ɛ ɛ 3/3
Hindi 4F ɛ ɛ ɛ 3/3
Hindi 5F ɛ e e 2/3
Hindi 6F ɛ ɛ ɛ 3/3
Hindi 7F ɛ ɛ ɛ 3/3
Hindi 8M ɛ ɛ ɛ 3/3
Hindi 9M ɛ ɪ ɛ 2/3
Hindi 10F ɛ ɛ ɛ 3/3
Total 10/10 8/10 9/10 27/30
Table B.7 Vowel [æ]
Words ask slabs snack plastic bags at Total
MN 143M [æ] [æ] [æ] [æ] [æ] [ə] [æ]
Hindi 1M a æ æ a æ æ 4/6
Hindi 2M æ æ æ æ æ æ 6/6
Hindi 3M æ æ æ æ æ æ 6/6
Hindi 4F a æ æ ʌ æ æ 4/6
Hindi 5F æ æ æ æ æ æ 6/6
Hindi 6F a æ æ ɑ æː æ 4/6
Hindi 7F aː æ ɛ æ ɛ æ 3/6
Hindi 8M æ æː æ æ æː æ 6/6
Hindi 9M a æ æ a æː æ 4/6
Hindi 10F æ æ æ æ æ æ 6/6
Total 5/10 10/10 9/10 6/10 9/10 10/10 49/60

83
Table B.8 Vowel [ɔ]/[ɑ]
Words call store small Bob also frog Total
MN 143M [ɔ] [ɔ] [ɔ] [ɑ] [ɑ] [ɑ] [ɔ]/ [ɑ]
Hindi 1M ɑ ɔ ɑ ɔ o ɑ 6/6
Hindi 2M ɔ ɔ ɔ ɑ ɔ ɔ 6/6
Hindi 3M ɑ ɔ ɑ ɑ ɑ ɑ 6/6
Hindi 4F ɔ ɔ ɔ ɑ ɔ ɔː 6/6
Hindi 5F ɔ ɔː ɔ ɔ ɔ ɔ 6/6
Hindi 6F ɔː ɔː ɔ o ɔː ɔː 5/6
Hindi 7F ɔ ɔ ɔ ɑː ɔ ɔ 6/6
Hindi 8M ɔ ɔː ɔ ɑː ɔ ɔː 6/6
Hindi 9M aʊ ɔ ɑ ɑ ɑ ɔ 5/6
Hindi 10F ɑ ɔː ɑ aː ɑ ɑ 5/6
Total 9/10 10/10 10/10 9/10 9/10 10/10 57/60
Table B.9 Vowel [ə]/[ʌ]
Words her from of a for can the and Total
MN 143M [ɚ] [ʌ] [ə] [ə] [ə] [ə] [ə] [ə] [ə]/[ʌ]
Hindi 1M ɜ ʌ ɔ ə ɔ æ ə æ 3/8
Hindi 2M ɚ ʌ ʌ ə ɔ ə ə ɛ 6/8
Hindi 3M ɚ ʌ ə ə ɚ ə ə æ 7/8
Hindi 4F ɜ ʌ ʌ ɛ ɔ ɛ ə æ 3/8
Hindi 5F ə ʌ ə ə ə æ ə æ 6/8
Hindi 6F ə ʌ ə ə ə ə ə æ 7/8
Hindi 7F ə ʌ ɔ ə ɔ æ ə ɛ 4/8
Hindi 8M ə ʌ ɔ ə ɔ ə ə æ 5/8
Hindi 9M ə ɔ ɔ ə ɔ ə ə æ 4/8
Hindi 10F ə ʌ ə ə ə ə ə ə 7/8
Total 8/10 9/10 6/10 9/10 4/10 6/10 10/10 1/10 53/80

84
Appendix C: Relative Functional Load
This adapted Catford’s Relative Functional Load table with the percentages that provide
intelligibility ratings was taken from Koffi (2015)
Table C.1 Relative Functional Load
Levels Percentage Unintelligibility
1 80-100 Severe
2 60-79 High
3 40-59 Moderate
4 20-39 Low
5 1-19 Slight