engineering-to-order versus make-to-stock strategy: …
TRANSCRIPT

Independent Journal of Management & Production (IJM&P) DOI: 10.14807/ijmp.v1i1.28 ISSN: 2236-269X
v. 1, n. 1, July – December 2010
1
ENGINEERING-TO-ORDER VERSUS MAKE-TO-STOCK STRATEGY: AN ANALYSIS AT TWO PRINTING COMPANIES
MSc. Paulo César Chagas Rodrigues
Universidade do Sagrado Coração (USC) - Brazil E-mail: [email protected]
Dr. Otávio J. Oliveira
São Paulo State University - Brazil E-mail: [email protected]
Submission: 04/17/2010
Accept: 25/10/2010 Abstract
Organizations are adopting industrial production models with priority given to reducing costs and increasing the quality of their processes and products. Optimizing and rationalization the inventory management is a great opportunity for these companies conquer these goals. The objective of this paper is to analyze inventory management at two printing companies located in the region of Bauru, where one adopts the Engineering-To-Order (ETO) production system and the other the Make-To-Stock (MTS) production system, highlighting their convergences and oppositions. For their achievement was chosen by the methodology of study of multiple cases (two cases). Data were collected through the intersection of the following tools: semi-structure, document analysis and observation in loco. Revisions are made in theoretical work on the following topics: logistics, management of materials and production planning and control. These themes guided the search, allowing a greatest criticism about the collected data and information generated. The two case studies were presented together with a comparative table of the main aspects of the influence of demand management strategy on the inventory management in two companies. Although the companies adopt different production strategies, there was no significant change observed in inventory management strategy.
Keywords: Inventory management; logistics; make-to-stock, engineering-to-order.
1 Introduction
The inventory-management models are differentiated by the degree to which the variables represent the reality, such as volume and size of the cargo stored, economic lot of buying and production and forecasting demand. The companies most concerned with the management of inventories take into account issues such as rate of production / receipt of materials, uncertainties in demand and in time, changes in price / cost, depending on the quantity purchased / produced, number of distribution centers, among other factors. The management of inventory has strategic importance for the success of companies since it gives support to production systems Engineer-To-Order (ETO) and

Independent Journal of Management & Production (IJM&P) DOI: 10.14807/ijmp.v1i1.28 ISSN: 2236-269X
v. 1, n. 1, July – December 2010
2
Make-To-Stock (MTS), using the increase or reduction in inventories as a factor generator of earnings productive and financial. The printing industry can be considered one of the most important industries in the world due to its importance as a fundamental element in disseminating knowledge that is documented, as well as its capacity for economic mobilization or its diversification in relation to the economic sectors it serves (ABIGRAF, 2007). With the objective of reducing costs, increasing production gains and adapting product and production process characteristics to market needs, the organizations are under pressure to review their production models so they can provide greater profitability and reliability. Besides that, many raw materials have relatively short expiration periods because they are perishable, and thus deteriorate. This will generate a loss in commercial value and may represent a waste. Inventory management seeks to minimize these possible losses through rational use, and is thus a fundamental tool in production planning. This research is restricted to the management review of inventory in production systems Engineer-To-Order (ETO) and Make-To-Stock (MTS) which are used in two companies in the graphics industry, whose plants are located in the city of Bauru . Thus, we tried to define the scope of analysis in relation to the object being studied (inventory management), in relation to the productive sector (graphics industry), and also in relation to the geographic focus (Bauru city / SP). According to ABIGRAF (2007), the printing industry is a very significant segment throughout the world, whether due to its importance as a fundamental element in disseminating the printed page, or its capacity for economic mobilization and/or its diversification in relation to the economic sectors it serves. With a production worth approximately R$ 17 billion, a 0.86% share of Brazil’s GDP, it exported approximately US$ 279 million and imported around US$ 319 million, generating a trade balance deficit in 2007 for the printing industry of US$ 40 million. Since exports are responsible for around 2% of all production, ABIGRAF estimates it should close 2008 with production growth in the order of 4% to 5%. Inventory management is an important strategic function for a company’s economic success, because it administers the raw material transformation process through several flow control mechanisms that have been developed by several companies; by the difficulty in understanding its behavior when seen as a whole, and by the empirical forms in which inventory management is applied at companies, falling on two fundamental aspects of decision-making: production scheduling and the control of material flows. Inventory management can generate benefits to local society, because when poorly planned, it can hide problems and even increase costs, resulting in debt, dismissals and even company insolvency. Thus, any job that scientifically contributes towards improvement in inventory management will also contribute, to a greater or lesser degree, towards minimizing the region’s social problems where the study is carried out, due to improvements at the companies. The issue will be addressed in this research is the discussion of how and if the production systems Engineer-To-Order (ETO) and Make-To-Stock (MTS) influence the management of stock in two companies in the graphics sector. This paper is structured as follows: in sections 2 and 3, a bibliographic review is conducted on material administration and production control and planning. Section 4 introduces the case study in which a brief description of the studied companies is given and a cross analysis of the cases and of the influence of the production system on

Independent Journal of Management & Production (IJM&P) DOI: 10.14807/ijmp.v1i1.28 ISSN: 2236-269X
v. 1, n. 1, July – December 2010
3
inventory management is made, listing a summary of the main characteristics. And Section 5 presents the conclusions about the study.
2 Administration of materials
The activity is the management of stocks held by the need to control the products and their waste. This type of activity is justified in relation to the advantages and disadvantages inherent in the existence of levels of stock. On the others hand, this action induces positive characteristics such as to allow the regulation and decomposition of the production process, providing a range of options to the customer, purchasing discounts depending on the quantity and protection against high prices (HEIZER; RENDER, 2001; PIZZOCARO, 2003). For Haller, Peikert and Thoma (2003), the management of inventories down clear rules of how to control the flow of material when inexpected situation happen, as the unexpectedly low processing, tools setbacks or when the line stops. If the flow of material worked is as it was planned, the management of inventories does not limit the flow, but it is active to work with in future emergency. Only the management of inventories in line is supplemented as long as there is a control of the material started inside the chain of proceedings. Shingo (2001) notes that for an effective reduction in production costs, waste must be analyzed and considered weighed because they are interrelated and are easily hidden by the complexity of a large organization. The concept of an economic lot EOQ (Economic Order Quantity) was developed by Ford and Harris in 1913 and based in the logic that the optimum amount to be produced is the one that has both a lower cost of application and stock recognizing the factor trade-off between the size and application, if the size of the lot increases, the stock increases and the frequency of deliveries and setup are reduced. The cost of application is the process of preparing the product (setup), transportation (freight) and issuing the request. Therefore, the bigger the amount produced, the lower the cost of preparation due to gains in scale. Conversely, the cost of stock is related to the capital invested in stock and thus the greater the amount of stock, greater is cost (CASTRO, 2005; HOPP; SPEARMAN, 2000). The authors also cite the following types of lots, as the most used by the organizations: economic lot of buying, production, with allowed absences, with discounts for volume and with restrictions. The economic models of lots should be developed by taking into account the varying estimates of demand as a way to be closer to the reality. Forecasts are basic inputs for many types of decisions in the planning of effective demand which is mainly responsible for the success of the supply chain and is of vital importance in the proper use of the equipment, to carry out the replacement of materials at the time and in the right quantity and for all other necessary activities for the industrial process are properly programmed (RITZMAN; KRAJEWSKI, 2003; MARTINS; LAUGENI, 2005; STEVENSON, 2005; ARNOLD; CHAPMAN, 2004). Can emphasize that it is never sure of the amount being requested by customers and the amount to be sent to storage, can not expect that the applications are actually received before starting to plan what to produce. Are used for both qualitative and quantitative techniques as a way to prepare the estimates (CHING, 2001; ARNOLD; CHAPMAN, 2004).

Independent Journal of Management & Production (IJM&P) DOI: 10.14807/ijmp.v1i1.28 ISSN: 2236-269X
v. 1, n. 1, July – December 2010
4
2.1 Policies for managing inventory
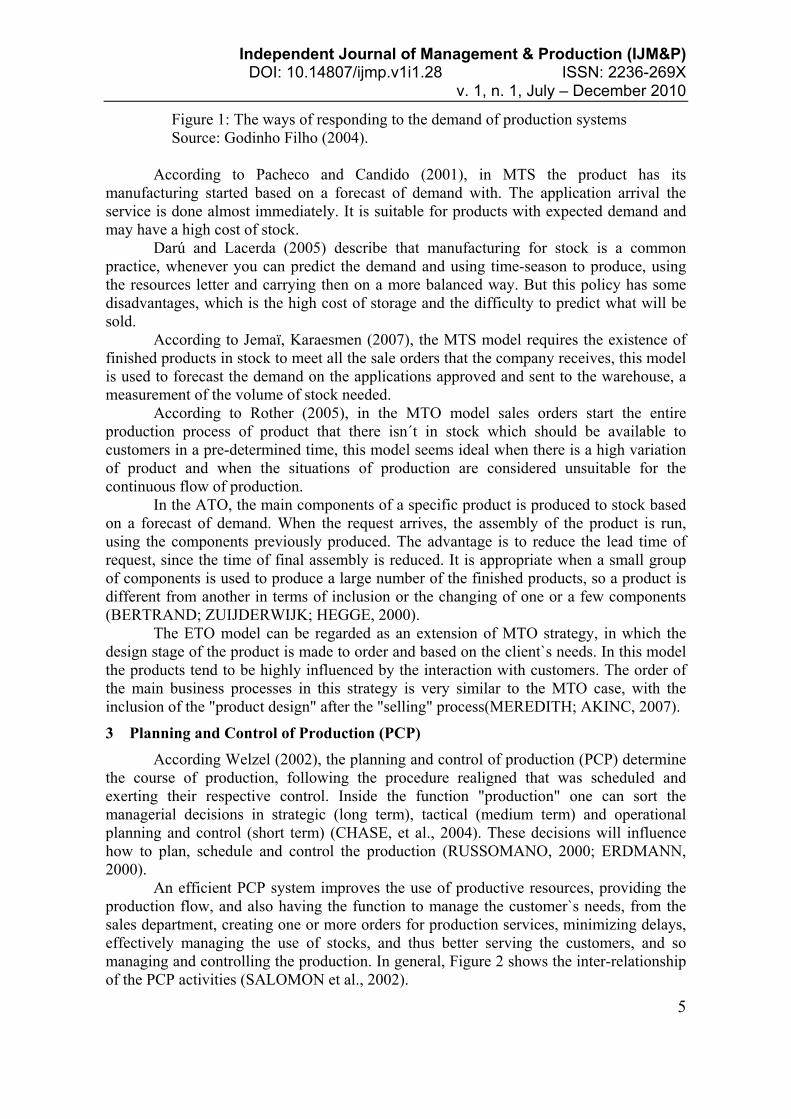
According to Darú (2005), a decision reflected in the positioning of the production is its policy of stock with respect to their finished items. This can be basically of four types: to produce for stock (Make-To-Stock - MTS), produce custom (Make-To-Order - MTO), assemble to order (Assembly-To-Order - ATO) or custom design (Engineering-To-Order - ETO). The possibility of keeping stocks in each production system is presented as separate, having its own interaction with customers. According to Godinho Filho (2004), the literature on management of production presents basically four ways to a production system to meet demand: MTO, ATO, MTO and ETO. Figure 1 shows these four basic forms of response to the demand, showing two ways to MTO strategy, whether they buy or not their ordered supplies. It can be noted in Figure 1 that these strategies can define the size and types of lead time of the production systems, it can also set the response time.
Independent Journal of Management & Production (IJM&P) DOI: 10.14807/ijmp.v1i1.28 ISSN: 2236-269X
v. 1, n. 1, July – December 2010
5
Figure 1: The ways of responding to the demand of production systems Source: Godinho Filho (2004).
According to Pacheco and Candido (2001), in MTS the product has its manufacturing started based on a forecast of demand with. The application arrival the service is done almost immediately. It is suitable for products with expected demand and may have a high cost of stock. Darú and Lacerda (2005) describe that manufacturing for stock is a common practice, whenever you can predict the demand and using time-season to produce, using the resources letter and carrying then on a more balanced way. But this policy has some disadvantages, which is the high cost of storage and the difficulty to predict what will be sold. According to Jemaï, Karaesmen (2007), the MTS model requires the existence of finished products in stock to meet all the sale orders that the company receives, this model is used to forecast the demand on the applications approved and sent to the warehouse, a measurement of the volume of stock needed. According to Rother (2005), in the MTO model sales orders start the entire production process of product that there isn´t in stock which should be available to customers in a pre-determined time, this model seems ideal when there is a high variation of product and when the situations of production are considered unsuitable for the continuous flow of production. In the ATO, the main components of a specific product is produced to stock based on a forecast of demand. When the request arrives, the assembly of the product is run, using the components previously produced. The advantage is to reduce the lead time of request, since the time of final assembly is reduced. It is appropriate when a small group of components is used to produce a large number of the finished products, so a product is different from another in terms of inclusion or the changing of one or a few components (BERTRAND; ZUIJDERWIJK; HEGGE, 2000). The ETO model can be regarded as an extension of MTO strategy, in which the design stage of the product is made to order and based on the client`s needs. In this model the products tend to be highly influenced by the interaction with customers. The order of the main business processes in this strategy is very similar to the MTO case, with the inclusion of the "product design" after the "selling" process(MEREDITH; AKINC, 2007).
3 Planning and Control of Production (PCP)
According Welzel (2002), the planning and control of production (PCP) determine the course of production, following the procedure realigned that was scheduled and exerting their respective control. Inside the function "production" one can sort the managerial decisions in strategic (long term), tactical (medium term) and operational planning and control (short term) (CHASE, et al., 2004). These decisions will influence how to plan, schedule and control the production (RUSSOMANO, 2000; ERDMANN, 2000). An efficient PCP system improves the use of productive resources, providing the production flow, and also having the function to manage the customer`s needs, from the sales department, creating one or more orders for production services, minimizing delays, effectively managing the use of stocks, and thus better serving the customers, and so managing and controlling the production. In general, Figure 2 shows the inter-relationship of the PCP activities (SALOMON et al., 2002).

Independent Journal of Management & Production (IJM&P) DOI: 10.14807/ijmp.v1i1.28 ISSN: 2236-269X
v. 1, n. 1, July – December 2010
6
Figura 2: Overview of the activities of PCP Fonte: Salomon (2002).
4 Case studies
The case study was conducted in two companies in the graphics sector, in which management strategies are employed in differentiated demand. In company "A" the strategy used is make-to-stock, and in "B" it was studied the make-to-order strategy which is used in the business unit forms of variable data. Company "A" employs nearly a thousand professionals in the city of Bauru, SP, which are distributed among the plant that has a built area of 40 thousand square meters, where the two plants are installed, which are called unit I and II and distribution center that has approximately 11 thousand square meters, to where all the production is transported. The delimited study in the company a is the school material product line, which we will analyze the process of manufacturing of the product model spiral notebook. Two ways to plan the production are used: the first one is through the planning the materials in process, inventory, routes of production, time of production. The second is through the dedication of the lines in a particular product category. The company started its activities in the year of 1985 in the city of Campinas, as the regional logistics favored the operation both in terms of supplies, and in commercial

Independent Journal of Management & Production (IJM&P) DOI: 10.14807/ijmp.v1i1.28 ISSN: 2236-269X
v. 1, n. 1, July – December 2010
7
terms. In 1989 its operation was transferred to the city of Bauru, whose potential had excellent prospects for the development of business in a long term. The company is currently working with four categories of products, each with particularities in relation to inventory management, and they are classified as follows: (a) daily planners, (b) school, (c) office and (d) home. As a means to exemplify the manufacturing of university notebooks, a sequence of photos will be shown beginning with the processing of rolls of paper that arrive at the factory and which weigh about one ton.
a) Printing and cutting
b) Intercalating lines
sheets
c) Cutting and perforating
lined sheets
d) Supplying cover, back
cover, dividers and sheet of adhesives
e) Assembling the
notebook
f) Packaging the
notebooks
g) Finalizing packaging h) Packing in cardboard
boxes
Figure 3: Script for manufacturing university notebooks Source: Tilibra (2007)
The company has the capacity to produce about 700 thousand notebooks per month. Manufacturing begins in September to serve the back-to-school season at the beginning of the school year, which in Brazil runs from January to March. At the end of the back-to-school period, the entire production focuses on demand from the northern hemisphere. There will be about 1000 product models that make up the product line for 2008, divided as shown in Table 1, which also presents their representativeness. Figure 4 shows a graph of the distribution of product models and their representativeness. The models that comprise the product lines are not managed in a single manner, first because the company

Independent Journal of Management & Production (IJM&P) DOI: 10.14807/ijmp.v1i1.28 ISSN: 2236-269X
v. 1, n. 1, July – December 2010
8
developed a planning approach by product line, and second, it respects each product category’s seasonality and criticalness. In the school category, of the 450 models produced, approximately 250 are exported to serve external clients and holding companies, when they are called intercompany sales.
Table 01: List of number of models per product Product line Number of models Representativeness %
School 450 46,20 Office 240 24,64 Daily Planners 104 10,68 Home 180 18,48
School46,20%
Office24,64%
Daily Planners10,68%
Home18,48%
Figure 4: Representativeness in % of model quantities
The delimitation of the study at company A will be the school product line. Since it is a line with seasonality and the Make-To-Stock production system is adopted, the manufacturing process for the spiral notebook will be analyzed. Based on seasonality, production capacity and the information system, top management, with the support of marketing, commercial, production, finance and supplies managers formulate demand projections. For formulating an economic production and purchase lot, top management and production and supplies managers work with models described by some authors in section 2.1 of this study and who are inserting them in the information system as a means to speed up decision making and avoid possible usage failures. Two means to plan production are adopted: the first is through planning materials in process, inventory, production scripts and production times. The second is through the relative dedication of lines to a specific product category. The production area has a Production Times and Methods (PTM) team that participates in product development. The team’s objective is to technically assess the product, and together with marketing personnel, develop it, elaborating a feasibility study to see if it is possible to produce the product following that script and determining cost, losses and material used.

Independent Journal of Management & Production (IJM&P) DOI: 10.14807/ijmp.v1i1.28 ISSN: 2236-269X
v. 1, n. 1, July – December 2010
9
The PTM team has elaborated new procedures aimed at reducing losses, thus avoiding a product leaving marketing with a very high loss level, which may result from time, setup, script and raw material. All possible product compositions are documented to assess costs and formulate a measurement standard. This documentation is comprised of product design, list of materials, machine efficiency, setup time and production time for a specific minimum lot of a product. The “ABC” classification method is used with the objective of defining production cycles, associated with stock volume, based on the classification of raw material inventory size, intermediate inventory, impact on cost and how to produce and improve processes. This classification method proved adequate for product categories without seasonality when all items classified as “A” have monthly replacement cycles and can impact production; items classified as “B” have bimonthly replacement cycles and can have a moderate impact on production; and items classified as “C” have quarterly replacement cycles and low impact on production. In relation to products affected by seasonality and that are closely tied to the back-to-school period at the start of the school year, the ABC classification method had to be reformulated to work with a classification by production volume. In other words, products classified as “A” have a volume of 100,000 units, which will be produced in minimum lots of 25,000 units; products classified as “B” have a volume of 50,000 units, which may be produced in minimum lots of 25,000 units; and products classified as “C” have an average volume of 5,000 units, which are produced in a single lot. The PCP team uses the 80-20 concept described in section 2.2 of this study as a means to define minimum lots to be produced each month, in which those classified as “A” shall have the smallest lots possible, but will be processed all month. Products classified as “B” and “C” will have larger lots, but will not be processed all month. The spiral notebook, with high raw material turnover, tends to have relatively few weeks of raw material in stock and in process. It uses the FIFO concept for paper, undulated cardboard, varnish and paint raw materials and LIFO for the others (wire, plastic, accessories), for both inventory management and accounting purposes. Since this is a very large volume of material and since there is no proportional area for storage, stock coverage varies between three and six weeks. In relation to the finished product, production to inventory is used, where the products are stored in the distribution center and FIFO is used. Finished products are packed in boxes, then pallets, and after placed on stands that will be labeled for identification. The main function of the PCP team is to analyze the quantity of existing raw material in stock, production capacity, what should be produced and in what time, thus triggering raw material purchases. There is a team dedicated to sales projections that observes the market and projects sales for the next month, and from that information determines how much to produce. Using the general sales plan, PCP elaborates the production plan, capacity analysis, critical resource analysis, critical material analysis and best script analysis, creating a plan with shorter deadlines, that is a monthly plan, as a means to measure volume produced that will determine the volume of acquired raw material, downtime due to lack of product, setup, maintenance, that is, if the time spent on production of the spiral notebook was not high. This is checked on a weekly basis.

Independent Journal of Management & Production (IJM&P) DOI: 10.14807/ijmp.v1i1.28 ISSN: 2236-269X
v. 1, n. 1, July – December 2010
10
Monthly planning is broken down into four weeks so the factory can receive weekly planning, once the material to be used has been studied and manufacturing scripts and possible breaks have been defined. Monthly planning also projects setup times per equipment and assembly as a means to take better advantage of downtimes. The notebook manufacturing process is carried out in two different parts of the factory since there is equipment with different technologies. The process described in Figure 5 is located in unit I.
Figure 5: Notebook manufacturing process at Unit I
The notebook manufacturing process described in Figure 6 is executed at Unit II since the equipment has different production capacity and flexibility. The entire supply process is manual, whereas the spiraling process is automatic, occurring right after quality control and the packing of notebooks in plastic packages and then in boxes. Each plastic package can contain up to five notebooks and each box up to six packages. The Make-to-Stock production strategy for the spiral notebook aims at hiding possible planning failures, thus ensuring there is no lack of supply of the product in the market during the demand period, which would be January to March, defined by the company as the back-to-school period.

Independent Journal of Management & Production (IJM&P) DOI: 10.14807/ijmp.v1i1.28 ISSN: 2236-269X
v. 1, n. 1, July – December 2010
11
Comparing the MTS production strategy adopted by the company and the one author Godinho Filho (2004) describes in section 2.4, a difference can be observed in the inventory formation point, because for the company it is interesting to form raw material inventory before the transformation and finished product process after distribution. The flow is shown in Figure 7 as a means to ensure compliance with requirements production may make and that become necessary.
Figure 6: Notebook manufacturing process at Unit II

Independent Journal of Management & Production (IJM&P) DOI: 10.14807/ijmp.v1i1.28 ISSN: 2236-269X
v. 1, n. 1, July – December 2010
12
Figure 7: Company’s Make-To-Stock process flow
The company began its activities in 1985, in the city of Campinas, because regional logistics favored the operation in terms of supplies as well a commercial terms. Four years later, the acquisition of new imported equipment drove the operation and made the company an important competitor in the sector. Operations were transferred to the city of Bauru, since the region’s potential for development offered excellent perspectives for long-term business growth. The company has a formally established organizational structure where administrative activities are delegated. The company’s main products are: forms in general, simple and continuous, adhesive labels and tags, rolls for commercial operations and variable data forms for product personalization. The delimitation of the study in Company B will be the product line of variable data form, which will be analyzed the manufacturing process that occurs in the unit located in the industrial district. The production planning of of variable data forms (invoices, tickets etc.) is done based, mainly in the, applications and supplemented by information on the amount of material in process, inventory, production routes, production time and through the dedication lines of a certain product category, according to the volume to be produced, the quality level and delivery criticality. Variable data form production planning (invoices, travel tickets etc.) is conducted based on orders and considering information about the quantity of materials in process, inventory, production scripts, production times and the relative dedication of lines to a specific product category, according to volume to be produced and quality level and criticalness in delivery. As an example, we cite: the printing line for variable data forms has four offset machines, which are classified as micro, small, medium and large printing volume. After printing, they go to the collating equipment, that is, the equipment that will make the invoice with all its copies and number the invoices as released by the federal internal revenue. Every possible composition of the product is documented to assess costs, which may be used as a means to measure performance. This documentation is comprised of

Independent Journal of Management & Production (IJM&P) DOI: 10.14807/ijmp.v1i1.28 ISSN: 2236-269X
v. 1, n. 1, July – December 2010
13
product design, list of materials, machine efficiency, setup time and production time and minimum production lot. Due to a stock coverage that ranges between three and four weeks, there are normally few weeks of raw materials in stock and in process. So FIFO is used for both inventory and accounting management. Due to the high volume of raw materials, possibly around 100 tons, the storage area measures approximately three meters in width by nine meters in length and five meters in height, for about 120 m³ of storage area. The production strategy adopted by this company is Engineering-To-Order, because before releasing the product manufacturing order to production, it is necessary to develop the project. This encompasses everything from elaborating the design of the form to measuring production cost, getting approval from the inspection body, in this case the Secretary of the Treasury, and then engraving the plates that will print the forms. The main function of the PCP team is to analyze the quantity of existing raw material in stock, available production capacity, what should be produced and in what time, and then raw materials are purchased. There is a team dedicated to sales projections and its main function is to observe the market and its variations. Some of the variables observed are: sales volume for the internal and external markets; domestic and international economic policies; final consumer purchasing power, among others, and from that information determine the volume of raw materials to stock. Demand projections are elaborated by top management based on information provided by the marketing department, sales, PCP, storeroom and production. This projection is made every four months and may suffer alterations during the period because it is continuously monitored by the PCP team. Elaboration is based on some variables, like: current and past demand, annual production capacity, etc. Part of raw material inventory stays with the supplier and it is made available as needed. If there is any error in projections, over or under, purchasing adjusts next month’s purchases so there is no stoppage in production. From the general sales plan, PCP plans production, analyzes capacity, resources and critical materials, best script, and then it elaborates a plan with shorter periods (weekly). In other words, a monthly plan is broken down into four weeks as a means to accompany volume produced and to purchase raw materials, measuring total cost and equipment availability. This check is carried out daily. The monthly plan is broken down into four weeks to inform the factory of the daily plan, after studying the material to be used, defining manufacturing scripts and possible breaks, so if there is any urgent order, it can be processed without compromising what is already being produced. The manufacturing process for variable data forms that will be printed on offset and collating machines according to order volume is shown in Figure 8.

Independent Journal of Management & Production (IJM&P) DOI: 10.14807/ijmp.v1i1.28 ISSN: 2236-269X
v. 1, n. 1, July – December 2010
14
Figure 8: Invoice manufacturing process
Stock in process is calculated in Kilograms. Calculation is based on number of copies, quantity, specific weight of the paper used and its dimensions; as per equation 06.
∗ ∗ ∗ ∗ (06) Where:
Kg – Kilograms; C – Length; L – Width; Gr – Specific Weight; Nv – Number of Copies; Q – Quantity.
The objective of this calculation is to have a uniform understanding between production, sales, marketing and accounting, thus permitting a simplified visualization of the produced volume and even to measure idle capacity in percent over the final months, as per equation 07.
(07) Where:
CO – Idle Capacity; CP – Productive Capacity; and VP – Volume Produced.
Comparing the ETO production strategy with the strategy adopted by the company, it is possible to observe a difference in the stock formation point, because for the company it is interesting to form raw material stock before the project process, so the company can quickly fill the order. In cases where there is a project that should use very

Independent Journal of Management & Production (IJM&P) DOI: 10.14807/ijmp.v1i1.28 ISSN: 2236-269X
v. 1, n. 1, July – December 2010
15
specific products, raw material stock formation will occur before manufacturing and stock in process before assembly. Figure 9 shows the Engineering-To-Order process flow as a means to ensure meeting requests production may make and that may prove necessary.
Figure 9: Company’s Engineering-To-Order process flow
4.1 Analysis of cross cases
At this stage, the research will be an intersection of the main features from the various processes that consist the management of the companie`s stocks studied. The two companies studied are considered to be large and, in consequence, they have a well-defined organizational structure, in concern to the definition of responsibilities between the productive activities, which are performed under the control of industrial managers with clear definition of technical and administrative functions. Company "A" has as production strategy "to make stock" (Make-To-Stock) because the in product "notebook" has seasonality, a limited production capacity and it has a peak demand increased in the period when studies are returning to school, January-March. Its production begins in June, reaching its heighost productivity in the months from October to December, when production starts to work twenty-four hours a day. Already Company "B" has as strategy of production "to develop on request" (Engineer-To-Order) for the product "form of variable data", since this product is customized according to the customer's need and it is not affected by seasonality, but with the need for customization which is required by the company`s customer who is willing to wait for a reasonable period of time, or up to five days and to be ready and to be dispatched. In this period of time includes the evaluation process and the acceptance by the tax department of the government. The layout of company "A" is by process or functional, since the resources are pretty similar. This layout is used because the same equipment can be used to manufacture different types of products, due to the characteristic of the same equipment that can be used to manufacture of "n" other products. The layout and the simulation of possible productive routes are structured with reference to the productive strategy Make-To-Stock. Therefore, there should be the size of

Independent Journal of Management & Production (IJM&P) DOI: 10.14807/ijmp.v1i1.28 ISSN: 2236-269X
v. 1, n. 1, July – December 2010
16
storage areas between the various transformation processes of raw materials and the manufacture of the finished product. Company "B" has a mixed layout, because it adopts both the functional and the linear. Equipment transformers are located close to each other, having an area of storage before and after each process, ie, there is a stock before off-set printing, another stock between the process printing and collation, and after collation, when the product is sent to the dispatch. Within this linear format, the off-set equipment, are positioned to work simultaneously, alloing to process than more an application, or an application in more than one printer, according to its criticality or volume. The collation equipments are also close to each other and working in parallel, to meet the entire volume production, defined by the PCP team. The layout is structured according to the productive strategy Engineering-To-Order. This occurs because the resources processors are in the process and functional models having, between them an area of storage, which has the lung function between the processes, since they are arranged in a linear fashion. Company "A" works the management of stocks using the methodology of the first to enter is the first to leave, since the turn of raw material in process is very high and the measurement of these stocks is made after the ABC classification. This measurement is made for backwards, or classify the final product, and from it, the decomposition and classification of the products are made according to their criticality in the process. It also works with the measurement of the economic lot of production because, there are two lines of spiral notebooks production, and the line of the unit I has low flexibility and a high volume production, because almost all the process is automated. The only processes that are not automated are the power of the cover, the cover and accessories. Already the production line of unit II has low production volume and high flexibility, according to the product`s composition. This occurs because in this production line almost everything is allowing a manual, greater human interference, being the only automated processes to espiralização and the packaging. A system to identify the lots is used during all the transformation process of raw materials, in order to monitor and know in which stage certain production order is. The volume of stocks in process can be considered high, given that the final product is influenced by the market whose demand is seasonal, for approximately three months, based on the demand the strategy of production MTS. Company "B" works the management of inventories also focusing on the methodology that which comes first is the first to leave, because the spin in the process of inventory is very high, the measurement of these stocks is given by the average cost of classification. This occurs as a way to link the discourse between the production, the warehouse, purchasing and accounting, since these departments are key pieces when defining the economic lot of buying, being defined after the volume of sales, production capacity and the volume of raw materials in stock. The inventories in process occur in three different stages during the production of custom form. These stocks in process are possible because of the high production capacity of the equipment off-set, and so we can observe a volume of raw materials to be processed before the press and soon after that because the collation equipments have a less productive capacity. These stocks stay between four to six hours to collect (printed) sheets for binding.

Independent Journal of Management & Production (IJM&P) DOI: 10.14807/ijmp.v1i1.28 ISSN: 2236-269X
v. 1, n. 1, July – December 2010
17
The management of inventory follows the guidelines that are based in the strategy of production ETO, so there won`t be an unnecessary generation of inventory and costs increased of storage and depreciation. In company "A", the stocks valuation is given by the ABC classification, to define the most important raw material in the final product, because if they leave oulett the production unsupplied, there will be loss and the rising of production costs. It was noted that the company has been developing quantitative models in order to measure the idle capacity from the business unit and equipment, the calculation of the batch production as a way to validate the idle capacity. This model aims to generate a measurement parameter that compared with the last n months will tell how a product was processed and allowed to generate rough estimates of how the overall performance has been. The company works with scheduled deliveries of raw material, since about 80% of the month stocks are stored in the provider that, along with the purchasing staff, PCP and warehouse, choose an interval time between the deliveries. The alignment of the stocks assessment with the strategy of production Make-To-Stock aims to regulate the volumes of stocks in process, raw material and finished product. In company "B", the valuation of stocks is given with the strategy Engineer-To-Order as a way to allow the measurement of volumes of raw stock and stock in process, approved and implemented requests that, are running or will run. The alignment of the assessment of stocks with the strategy Engineer-To-Order also allows to define the volume of stock that will be stored in the company and in the supplier, as well as supporting in the definintions in the ranges of delivery. In companies A and B ", the supply of raw material by the supplier is in a continuous manner and within a period. Deliveries are made by trucks and have an area for loading and unloading inside the plants. The inventories in the companies are sized to last at least from of three to six weeks of production, as they seek to state in the contracts with suppliers the form and time of delivery which can be adjusted during the contract`s period of time. For both companies, the main suppliers are defined based the product`s quality, delivery time, storage capacity, reliability in care of requests, among others. For company "A", the supply process of the raw material from the supplier to the company and from the stock to the production are aligned with the production strategy Make-To-Stock, since the volumes may not be very high, because they may create disturbances on the storage of raw materials that are being processed. As for company "B", the supply process of the raw material from the supplier to the company and from the stock to the production are aligned with the production strategy Engineer-To-Order. This occurs because the raw material willgo from out the storage area, when there isan order to manufacture, because the finish product has unique characteristics according to its quality, forms of production and design. Company "A" has several facilities in which the setup occurs in an isolated way and at different times during the manufacturing of the product "spiral notebook." The main setups occur in the equipments cut the sheet, which come in rolls to the pre-determined size in that equipments off-set in flexographic, in equipments to mount spiral notebooks according to the number of sheets that they should have, and the accessories they will have.

Independent Journal of Management & Production (IJM&P) DOI: 10.14807/ijmp.v1i1.28 ISSN: 2236-269X
v. 1, n. 1, July – December 2010
18
The production strategy Make-To-Stock does not influence the setup time of the equipments, because there will always be storage areas between the processes changing that should be keeping stocks volumes that will generate a lead time for the setup. In "B" the off-set equipment setup has an average time of twenty minutes, for changing the printing plates the ink supply system, the slides adjustment and printing rolls for the speeddefinition and the printing quality. In the collation equipment the setup occurs according to the number of lanes of forms, sizes and settings of the pressure rolls, not allowing placement tests. These processes are the two most important ones and impacting production and operating results of the company since it works with a pre-determined time and any unexpected fact can mean a loss in the productive income. The strategy Engineer-To-Order influences the setup time, because there may not occur delays because the supplies have a very light delivery lead time. Therefore, the setup stops should be scheduled to occur between an application and another, never during a request execution. In company "A", the forecast for a demand is prepared by the marketing department, based on the informations given by the production, sales, warehouse and PCP. This prediction has a duration of one year and it may suffer changes in the period elapsed, because it is a dynamic forecast that follows the trend market, being supported by all the departments involved. Its preparation is made from the selection of some variables, such as: the previous year's demand, the future demand, the productive capacity. The political environment. These variables will help to form the storage strategy of the raw material production, determining when the production should start and what should be the volume produced. In "B", the board prepares the estimates of demand based on the information given by the production, marketing, sales, warehouse and PCP, which are discussed in meetins with the departments. This forecast is prepared for the quarter and may suffer changes in the time elapsed since the PCP team has a responsibility to monitor its progress. Will be an influent factor from the production strategy ETO, since from the forecast of demand, will be defined the variables that will comprise the production strategy. It son preparation is made from the following variables: demand in the previous period, current and future, productive capacity, political environment etc. These aspects issues will guide the management strategy of stocks, since all the production follows the ETO model, which influences all the processes. The distribution of the finished product in company "A" is done by their own trucks, which run a pre-determined route between the factory and the distribution center. In this distribution center, the products are packed in order to reduce the risks of damage. When the sale is completed, depending on distance, volume and the delivery time, the product can travel by trucks, by logistics operators or by air, and they can be packed in boxes, which are grouped in pallets and / or containers. The productive strategy Make-To-Stock does not influence the distribution, because the volume of applications only begins to improve in in the months of october and november reachind its peak in december and decreasing again in the next year allowing them to be met almost immediately. In company "B", the distribution of the finished product takes place almost simultaneously to its finalization and, depending on the location of the customer and its

Independent Journal of Management & Production (IJM&P) DOI: 10.14807/ijmp.v1i1.28 ISSN: 2236-269X
v. 1, n. 1, July – December 2010
19
level of priority, it will be transported by trucks from the company, by logistics operators, or by mail. Thisoccurs because the company chose the strategy engineering-to-order. Table 2 shows a comparison of the main features analysed in the two companies.
Table 2: Summary of the main characteristics of the companies studied Features Company A Company B Founded 1928 1985 Number of workers
≅ 1.000 ≅ 300
Market School materials, agends, office
and house. Variable data forms (invoices,
tickets etc). Production strategy
Make-To-Stock (MTS). Engineer-To-Order (ETO).
Forecast preview
Executives consensus and anuually extrapolation.
Executives consensus and four.
Layout Por processo ou funcional. Misto de linear e funcional.
Setup Not influence the production
system. Influences the production system.
supplies Occurs before the beginning of
production. Can occurs in parallel to the
project.
Distribution There is a distribution center to attend its production strategy.
Occurs at the moment that the product is released to expedition having up to 2 hours lead time.
5 Conclusion
The printing industry has the characteristic of being very diverse, as it should have flexibility to meet from the public services to the manufacturing industry as a whole. The objective of this research was to analyse the influence of production systems Make-To-Stock and Engineer-To-Order on the management of stocks in the graphics sector in the region of Bauru city, through cross-analysis of information obtained during both studied cases and the theoretical framework. The purpose of defining the spectrum of the research is to not allow the loss of the focus, maintaining one of the main qualities that is to analyse the influence of the production Make-To-Stock and Engineer-To-Order on the inventory management. The definition allows the adoption of methods that enhance the research of influencing the way it should be guided, always observing and analyzing the results so all the variables can be answered, Goldenberg (2002) points out that the researcher should prepare questions related to the objectives of his study. After the analysis of the production system used in each of the companies presented in the case studies, its was prepared the cross-examination of the cases where it is possible to identify common procedures between them and those individuals and confections, in a condensed and simplified way, a table-summary containing its main components. After these procedures, it was developed the analyse of the influence of the production system on the management of inventories. During the data cross-examination, we could observe some differences in relation to the literature research, which are presented below:

Independent Journal of Management & Production (IJM&P) DOI: 10.14807/ijmp.v1i1.28 ISSN: 2236-269X
v. 1, n. 1, July – December 2010
20
a) production system Make-To-Stock: Godinho Filho (2004) observes that the response time is the distribution lead time, but what was found was the existence of the lead time for supplies and manufacturing, even though it was be produced for stocking there should be the measurement of time which in turn will generate the costs of production which should be visible throughout the process. Godinho Filho (2004) in Figure 1 doesn`t show the point of training of the inventories before the transformation process, but that must be displayed, because if there is no point of training of lead time and inventory of supplies, how will the production system Make-To-Stock happen? In Figure 10 is show a model that has the aim being against to what Godinho Filho (2004) describes in his work, which is presented the lead time for supplies, which should be measured in the formation of the response time.
Figure 10: Process flow of Make-To-Stock company's
b) production system Engineer-To-Order: Godinho Filho (2004), Machado Neto (2003) and Pessoti and Souza (2005) describe that it is an extension of the MTO system, which is given its emphasis on the design phase, where there is no point of formation of inventory lead time of supplies should only occur after the project, but it was possible to observe two distinct models, which may be adopted according to the specificity of the customer's request:
a) In the first case the client has make an order an application where you must use specific raw materials considered which has not in stock, the lead time of supplies might occur in parallel to the lead time of project or shortly after in case the supplier is ready for delivery;
b) In the second case, the client ordered where the raw materials used are considered normal, i.e. not specific, the ones already in stock, if the volume in stock is sufficient to initiate the process the lead time of supplies may occur after the project and it will have the function of recovery stocks; and
c) In both cases there should be the formation point of stocks after the production, since there may be a lead time between the manufacturing and

Independent Journal of Management & Production (IJM&P) DOI: 10.14807/ijmp.v1i1.28 ISSN: 2236-269X
v. 1, n. 1, July – December 2010
21
assembly processes as a result of other applications that have already been processed, as described in Figure 11.
Figure 11: Process flow of Engineering-To-Order company's
The completion of case studies and came to ratify outline the thought of how the management of stocks is influenced by the production system in the companies surveyed, and vice versa. The cases described in this study enabled observations and conclusions on the subject researched, as two companies of the graphic sector were studied that havin management strategies different demand and that, obviously, have similiarity in the way of managing their inventory. We also to had the opportunity note that currently the companies are very worried to maintain the production system synchronized with the management of stocks and vice versa, as a way to better meet the market requirements. Because this research has been conducted in only two companies in the graphics sector with distinct management strategies demand, one of the limitations is the generalize the procedures statistically and geographically impediment to generalize the findings to other productive sectors, not being possible to culture and hand - of the workforce with local characteristics.
References
ABIGRAF. Escolar paper Brasil 2006: artigos de papelaria têm o melhor desempenho da indústria gráfica. Disponível em: <http://www.businessguide.com.br/noticias/noticia_1360.htm>, acesso em: 20 dez 2007.
ALVES, A. S. (2008) Ferramentas de Supply Chain Management para a otimização de estoques. Disponível em: < http://www.administradores.com.br/producao_academica/ferramentas_de_supply_chain_management_para_a_otimizacao_de_estoques/994/>, acesso em: 29 ago 2008.

Independent Journal of Management & Production (IJM&P) DOI: 10.14807/ijmp.v1i1.28 ISSN: 2236-269X
v. 1, n. 1, July – December 2010
22
ARNOLD, J. R. T.; CHAPMAN, S. N. (2004) Introduction to materials management, 5 ed. New Jersey: Prentice-Hall.
BALLOU, R. H. (2003) Business logistics: supply chain management. 5 ed. New Jersey: Prentice Hall.
BERTRAND, J. W. M.; ZUIJDERWIJK, M.; HEGGE, H. M. H. (2000) Using hierarquical pseudo bills of material for customer order acceptance and optimal material replenishment in assemble to order manufacturing of nonmodular products. International Journal of Production Economics, n. 66, p.171-184.
BLOOMBERG, D. J.; LEMAY, S.; HANNA, J. B. (2002) Logistics. New Jersey: Prentice Hall.
BOVET, D. M.; THIAGARAJAN, S. (2000) Logística orientada para o cliente. HSM Management, São Paulo, ano 3, n. 18, p. 122-128, jan./fev.
BOWERSOX, D. J.; CLOSS, D. J. (2001) Logística empresarial: o processo de integração da cadeia de suprimento. São Paulo: Atlas.
CAMPI, T. (2008) Custos da cadeia logística e logística reversa. <http://www.e-science.unicamp.br/lalt/admin/publicacoes/documentos/publicacao_570_aula09.pdf>. Acesso em: 05 jul 2008.
CASTRO, R. L. (2005) Planejamento e controle da produção e estoques: um survey com fornecedores da cadeia automobilística brasileira. Dissertação (Mestrado em Engenharia de Produção). São Paulo: POLI/USP.
CHASE R. B.; JACOBS R. F.; AQUILANO N. J.; GRANDO A. e SIAMESI, A. (2004) Operations Management nella produzione e nei servizi. Milano: McGraw-Hill.
CHING, H. Y. (2004) Gestão de estoques na cadeia de logística integrada: Supply chain. 2 ed. São Paulo: Atlas.
CHRISTOPHER, M. (2007) Logística e gerenciamento da cadeia de suprimentos. 2 ed. São Paulo: Pioneira.
DARÚ,G. H.; LACERDA, V. C. (2005) Uma heurística para o sequenciamento da produção baseada na teoria das restrições. Dissertação (Mestrado em Engenharia Cívil) Curitiba: UFPR.
ERDMANN, R. H.(2000) Planejamento e controle da produção. Florianópolis: Papa-livros.
FARIA, A. C.; ROBLES., L. T.; BIO, S. R. (2004) Custos logísticos: discussão sob uma ótica diferenciada. In: CONGRESSO BRASILEIRO DE CUSTOS, 11., 2004, Porto Seguro. Anais... Porto Seguro: Fundação VISCONDE DE CAIRU.
FARIA, A. C.; COSTA, M. F. G. (2005) Gestão de custos logísticos. São Paulo: Atlas.
GARCIA, E. S.; REIS, L. M. T. V.; MACHADO, L. R.; FERREIRA FILHO, V. J. M. (2006) Gestão de estoques: otimizando a logística e a cadeia de suprimentos. Rio de Janeiro: E-papers.
GODINHO FILHO, M. (2004) Paradigmas estratégicos de gestão da manufatura: configuração, relações com o planejamento e controle da produção e estudo exploratório na indústria de calçados. Tese (Doutorado em Engenharia de Produção). São Carlos: UFSCAR.

Independent Journal of Management & Production (IJM&P) DOI: 10.14807/ijmp.v1i1.28 ISSN: 2236-269X
v. 1, n. 1, July – December 2010
23
HALLER, M.; PEIKERT, A.; THOMA, J. (2003) Cycle time management during production ramp-up. Robotics and computer integrated manufacturing, p.191-206.
HEIZER, J.; RENDER, B. (2001) Operations management. New Jersey: Prentice Hall.
HOPP, W. J.; SPEARMAN, M. L. (2000) Factory physics: foundations of manufacturing management. Chicago: Irwin.
JEMAÏ, Z.; KARAESMEN, F. (2007) Decentralized inventory control in a two-stage capacitated supply chain. IIE Transactions. p. 501-512.
LIMA, M. P. (2006) Custos logísticos: uma visão gerencial. Coppead, 1998. Disponível em: <http://www.coppead.ufrj.br/pesquisa/cel/new/fs-public.htm.>. Acesso em: 17 jul 2006.
MARTINS, P. G.; LAUGENI, F. P. (2005) Administração da produção. 2 ed. São Paulo: Saraiva.
MEREDITH, J.; AKINC, U. (2007) Characterizing and structuring a new make-to-forecast production strategy. Journal of Operations Management. n. 25, p.623-642.
PACHECO, R. F.; CÂNDIDO, M. A. B. (2001) Metodologia de avaliação da viabilidade de mudança de estratégia de gestão da demanda de MTO para ATO. Não publicado. PUCPR.
PIZZOCARO, S. (2003) Steps to industrial ecosystems. New models for interfirm interaction. Industrilal ecosystems/Interfirm Interaction. Politecnico di Milano.
RITZMAN, L. P.; KRAJEWSKI, L. J. (2003) Foundations of operations management. New Jersey: Prentice Hall.
ROTHER, M. (2005) Value-stream mapping in a make-to-order environment. Lean management institute.
RUSSOMANO, V. H. (2000) PCP: Planejamento e Controle da Produção. 6 ed. São Paulo: Pioneira.
SALOMON, V. A. P. CONTADOR, J. L.; MARINS, F. A. S.; SANTORO, M. C. (2002) Custos potenciais da produção e os benefícios do Planejamento e Controle da Produção. In: ENCONTRO NACIONAL DE ENGENHARIA DE PRODUÇÃO, 22., Curitiba. Anais... Curitiba: ABEPRO, 1 CD-ROM.
SHINGO, S. (2001) A Study of Toyota production system from industrial engineering viewpoint: revised. Tokyo: Japan Management Association.
SIMCHI-LEVI, D.; KAMINSKY, P.; SIMCHI-LEVI, E. (2003) Cadeia de suprimentos: Projeto e Gestão. São Paulo, Bookman.
STEVENSON, W. J. (2005) Operations Management. 8 ed. Columbus: McGraw-Hill.
WELZEL, E. (2002) O comércio eletrônico e o setor industrial: estudo de caso da Cremer S.A. In: SIMPÓSIO DE ADMINISTRAÇÃO DA PRODUÇÃO, LOGÍSTICA E OPERAÇÕES INTERNACIONAIS, 5., São Paulo. Anais… São Paulo: FGV, 1 CD-ROM.
TARGET. Brasil em foco 2006. Software de estudo e pesquisa. v. 4.60. Rio de Janeiro: Target Marketing Editora, 2006.
ZAGO, C. A.; ADAM, C.; NORO, G. B.; OLIVEIRA, J. H. R. (2005) Análise do processo logístico: o caso Bunge Santa Maria. In: SIMPÓSIO DE ENGENHARIA DE PRODUÇÃO, 12., 2005, Bauru. Anais... Bauru: FEB/UNESP.