engineering prag/ce -...
TRANSCRIPT


CIVIL ENGINEERING PRAG/CE3/Geotechnical/Ocean Engineering
EDITED BY
PAUL N. CHEREMISINOFF
NICHOLAS P. CHEREMISINOFF
Su LING CHENG
IN COLLABORATION WITH
S. Ahmed
M. S. S. Almeida
F. Aschieri
C. T. Bishop
G. E. BlightA. M. BrittoS. K. Chakrabarti
P.N. Cheremisinoff
M. A. Donelan
J. M. Golden
J. Hunt
G. P. Korfiatis
p C. Kotzias
0. Kusakabe
P.W. Mayne
K. Mizumura
T. S. NagarajA. Nakase
M. Noritake
H. S. OeyJ. A. R. OrtigaoV M. Paparozzi--
TECH NOMICPUBLISHING CO.INC
T ,ANCASTER • BASET,
S. Prakash
S. Saran
A. Sawicki
U. N. Saran
J. R. SchuringA. W S. Smith
B. R. Srinivasa Murthy
A. C. StamatopoulosCN. Sun
J. Takemura
B. R. Thamm
E. F. ThompsonFA. Uliana
H.-C. Wu
S. l. Xie

Published in the IIkstern Hemisphere by
Technomic Publishing Company, Inc.851 New Holland Avenue
Box 3535
Lancaster, Pennsylvania 17604 U.S.A.
Distributed in the Rest of the World by
Technomic Publishing AG
© 1988 by Technomic Publishing Company, Inc.All rights reserved
No part of this publication may be reproduced, stored in a
retrieval system, or transmitted, in any form or by any means,
electronic, mechanical, photocopying, recording, or otherwise,without the prior written permission of the publisher.
Printed in the United States of America
10987654321
Main entry under title:
Civil Engineering Practice 3-Geotechnical/0cean Engineering
A Technomic Publishing Company bookBibliography: p.
Includes index p. 867
Library of Congress Card No. 87-50629ISBN No. 87762-554-9


270 STABILITY
Cable
FIGURE 5. LPC stationary piston sampler (from Lemasson,1973)
13.Tso (0.5 dsoY
tso
3. LABORATORY TESfS
3.1 Introduction
A laboratory testing programme on soft foundation soilfor the design of an embankment would certainly include:
1. Index properties tests (liquid limit, plastic limit, wate,content, unit weight and sieve or sedimentation analysis
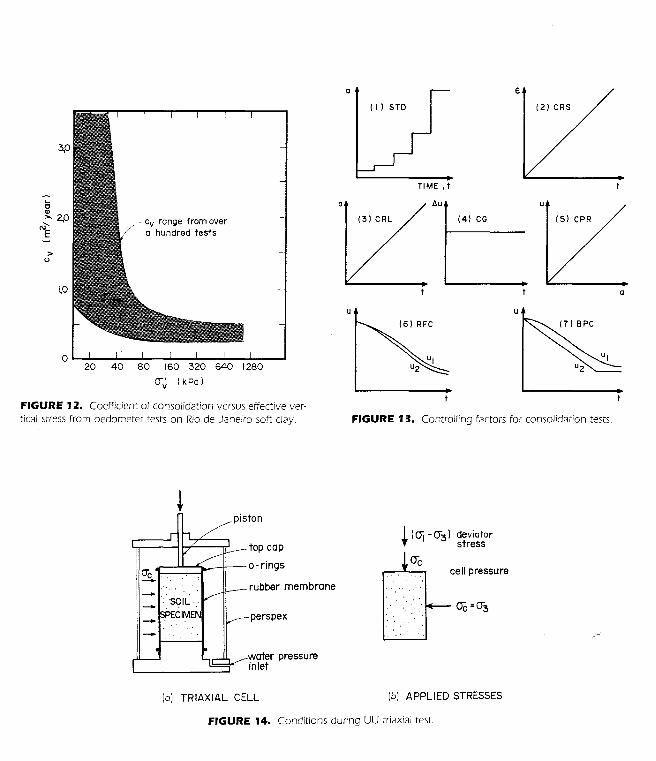
2. Oedometer tests3. Unconsolidated-undrained triaxial tests
4. Consolidated-undrained triaxial tests with pore pressuremeasurements
The index properties tests are well covered by many textbooks and will not be discussed here. Also, speciallaboratory tests such as plane strain or simple shear tests will notbe described in this section, as they are not commonly usedin engineering practice. The remaining tests will be treatedas follows.
3.2 Oedometer Tests
Oedometer tests are performed to obtain soil compressibility and soil consolidation parameters. A soil specimen istested under a zero lateral displacement condition in a steelring (Figure 6). Porous stones are employed on the top andbottom of the specimen to allow drainage during testing.Among the oedometer techniques, the incremental load testis the most common one in present day practice. The teststarts with a small value of pressure (e.g., 10 kPa) applied tothe specimen and remains constant during 24 hours. Verticaldisplacements are recorded during this period. The pressureincrement is, then, duplicated and the same sequence of operations is performed. The usual number of increments is 8to 10 and the test continues until a desired maximum vertical
pressure is reached. The pressure is, then, decreased to zeroin 3 or 4 stages, time being allowed for the specimen toswell. The readings obtained during a pressure stage enablea plot of specimen height versus log of elapsed time (Figure7). From this curve, according to the Casagrande or 15c:
method, a value for the coefficient of consolidation c, is ob
tained through the equation:
dc
Sampling Phases
a - Sample Insertion
b - Connecting the piston to the cable
c - Pushing down the sampler
d - End of pushing
e - Raising the piston rod
f - Raising the sampler
a b
PVC liner
Lowercouplingdevice
Piston rod
Uppercouplingdevice
} Piston
SteelPipes
Overshotcouplingdevice
piston allows vacuum to be formed on the top of the sampleand thus prevents downward movements when extracting itfrom the ground. This feature has been regarded (e.g.,Hvorslev, 1949) to produce a better quality sample. Otherprecautions to improve sample quality are:
1. To use a thick drilling mud to minimize the stress relief2. To provide, after sampling, adequate sealing against
water content variation
3. To avoid shock and vibration during transportation to thelaboratory
4. To provide adequate ambient temperature and moisturecontent storage facilities
Additionally, some more elaborate samplers, such as theone employed by the French Laboratories des Ponts etChaussees (Lemasson, 1973), are provided with a plastic internal liner which accommodates the soil until the start of
the testing programme. For releasing the sample, instead ofextrusion, the liner is longitudinally cut preventing furtherstressing to the soil.
where
Tso = time factor at 50% consolidation, which accord'~.:to Terzaghi's theory is 0.198
dso = specimen height at 50% of consolidation (Figure tso = time correspondent to 50% of consolidation
tained through Casagrande's method (Figure 7,


240
Rio de Janeiro cloySample depth 1.5- 2 m
O"Vc= 160 kPo
IELAPSED TIME )1/2 It (min)I/25 10 150
O.O~E
E- 0.5I--:2ILl:!ILlU 1.0« ...J I d90Q.
II)0...J
1.5« uf=a::ILl> 2.0
2.50
30 60 120ELAPSED TIME (mm)
FIGURE 8. The t90method for computing the coefficient of consolidation.
o~6"'---1015
Compressionindex, Cc
100vo
_____\_! OVm ( Casogrande)
Recompressionindex. Cs
Minimum"radius
8 I cs-'-!--«Cl::
Cl
(5>
EFFECTIVE PRESSURE. IT" (log scale)
FIGURE 10. Notation and terminology for oedometer =:pression curves.
420
10
20
~ Vertical consolidation~Oz
~~re rr~ '0 '/r«
0a::
I--I-- «lJ) 30 a::
...J
Cl« u 800
f=>
0:: w> 40I ""-
~2160
50~ 32060 I
III--..§40
0.1
I1010210:3104
ELAPSED TIME lminlFIGURE 9. Consolidation test data of Rio de Janeiro soft clay.


304 STABILITY
TABLE 5. Components of a Settlement Analysis(Lambe, 1964'.
nents for any successful deformation analysis are (Ladd e[ai., 1977):
Determination of subsoil section
1. Vertical and lateral extent of soils; location of com
pressible soils, drainage surfaces and any specialboundary conditions
2. Variation of initial pore pressure with depth
Stress analysis
1. Initial effective stress versus depth2. Magnitude, distribution and time rate of application of
surface load, including any shear stress betweenground surface and applied load
3. Stress distribution theory compatible with boundaryconditions; effect of rigid boundaries or layers
4. Variation of 0'1, 0'2 and 0'3 with consolidation; influenceof arching, change in Poisson's ratio
(a) A model to describe soil behaviour
(b) Suitable method to evaluate the required parameters(c) Computational procedure for applying the model to
practical problems
This section discusses (a) and (c) above, as (b) has beendiscussed in Section 3 and 4,
Total settlements are a sum of initial and long term settlements. These two components of settlements are discussedbelow.
6.2.2 INITIAL SETTLEMENTS
Initial settlements, also called immediate settlements or
undrained settlements, are the settlements which take placeimmediately after load application and are associated withundrained elastic shear deformation. Initial settlements ma::be computed from
(1 - 1'2)Si = t.a . b ~ . I (6.11
1. Representatives of samples tested2. Sample disturbance3. Environmental factors
4. Testing technique
Estimation of settlement and pore pressures
1. Method of analysis2. Rotation of principal planes3. Variation of my, k, Cv with consolidation4. Secondary compression
where t.a is the applied embankment load, b is the width ofthe embankment, E and v are the elastic parameters and I isthe stress influence factor, which depends on the geometryof the problem, obtained for instance from Poulos and Davis(1974).
If the soil is saturated, deformations are of undrainedtype, i.e., at constant volume. In this case, it is suggested toassume a Young's modulus K, determined from CD triaxialtests, and a Poisson's ratio vu = 0.5, consistent with undrained behaviour. However, the proper selection of Eu is
10.98
Ccrr'pressible layer
'(€*Ilf'
76
~
h
LHE~
5432a-0.2
a
0.5
~ La•...o.:- 1.5
2.5
FIGURE 66, Chart for calculating immediate settlement under em-bankment (after Giraud, 1973)


