engineering feelings of quality127129/fulltext02.pdfpaper b- interactive design support system by...
TRANSCRIPT

Linköping Studies in Science and Technology
Thesis No.1365
ENGINEERING FEELINGS of QUALITY
Ebru Ayas
LIU-TEK-LIC-2008:23
Division of Quality Technology and Management
Department of Management and Engineering

Printed by LiU-Tryck, Linköping, Sweden, 2008
No. 1365
LIU-TEK-LIC-2008:23
ISBN: 978-91-7393-898-3
ISSN 0280-7971 0
© Ebru Ayas

Table of Contents
1. INTRODUCTION ............................................................................................................................ 1
1.1 Background ............................................................................................................................................ 1
1.2. Overall Aim ............................................................................................................................................ 3
1.3. Research Questions ............................................................................................................................ 4
1.4. Structure of the Thesis ...................................................................................................................... 4
2.THEORETICAL FRAME OF REFERENCE .................................................................................. 6
2.1. Product Quality .................................................................................................................................... 6
2.1.1. Service Quality ............................................................................................................................. 8
2.2. Experiencing Quality of Products .............................................................................................. 11
2.3. Cognition-Emotion Interaction ................................................................................................... 12
2.3.1. Emotions in Western and Japanese Literature) ........................................................... 14
2.3.2. “Affect” attributed to products in Western Literature .............................................. 14
2.3.3. “Kansei” attributed to products in Japanese Literature ........................................... 16
2.4. Kansei values and product experience ............................................................................... 17
2.5. Engineering “Kansei” ...................................................................................................................... 18
2.6. Kansei as a System and Methods used to quantify Kansei ............................................... 19
3. RESEARCH PROCESS AND METHODS .................................................................................. 22
3.1. Overview ............................................................................................................................................. 22
3.2. Paper A- Overview of methodological procedure ............................................................... 24
3.3. Paper B-Overview of methodological procedure ................................................................ 28
3.4. Paper C- Overview of Methodological Procedure ............................................................... 30
3.4.1. Free associations to grasp Kansei of individuals ......................................................... 34
3.4.2. Interview Process .................................................................................................................... 34
3.4.3. Interview Questions................................................................................................................ 35

4. REVIEW OF THE STUDIES ....................................................................................................... 36
4.1. Overview ............................................................................................................................................. 36
4.2. Paper A-Designing "Quality Feeling" In Reach Trucks: A Kansei Engineering
Approach ..................................................................................................................................................... 36
4.2.1. Research issues......................................................................................................................... 36
4.2.2. Methods ....................................................................................................................................... 37
4.2.3. Results .......................................................................................................................................... 37
4.2.4. Discussion and Conclusions ................................................................................................. 38
4.3. Paper B- Interactive Design Support System by Genetic Algorithm ............................ 38
4.3.1. Research issues......................................................................................................................... 38
4.3.2. Methods ....................................................................................................................................... 39
4.3.3. Results .......................................................................................................................................... 39
4.3.4. Discussion and Conclusions ................................................................................................. 40
4.4. Paper C- Affective Design of Waiting Areas in Primary Healthcare ............................. 41
4.4.1. Research issues......................................................................................................................... 41
4.4.2. Methods ....................................................................................................................................... 41
4.4.3. Results .......................................................................................................................................... 41
4.4.4. Discussion and Conclusions ................................................................................................. 43
5. DISCUSSION ................................................................................................................................. 43
5.1. Addressing Research Questions ................................................................................................. 43
5.1.1. Paper A ......................................................................................................................................... 43
5.1.2. Paper B ......................................................................................................................................... 44
5.1.3. Paper C ......................................................................................................................................... 45
5.2. Results Discussion ........................................................................................................................... 46
5.3. Methods Discussion ........................................................................................................................ 48
5.3.1. Paper A: The method approach for feelings of quality .............................................. 48
5.3.2. Paper B: The method approach for feelings of quality .............................................. 49

5.3.3. Paper C: The method approach for feelings of quality .............................................. 49
5.4. Proposed Approaches to Identify Physical attributes and interactions ..................... 50
5.5. Questionnaires .................................................................................................................................. 51
5.6. Discussion of methods compared to traditional Kansei Engineering studies .......... 53
5.7. Discussion of Qualitative and Quantitative approaches for Kansei Engineering .... 55
5.8. What is designed into products: affect, Kansei etc.? .......................................................... 56
5.9. Research Contributions ................................................................................................................. 58
5.10. Future research .............................................................................................................................. 59
6. CONCLUSIONS ............................................................................................................................. 60
References ........................................................................................................................................ 62
APPENDIX I: Suggestions for further improvements of the reach truck ............................. 68
APPENDIX 2: Quality feeling questionnaire (Paper A- Part 2) .............................................. 70
APPENDIX 3: Quality feeling questionnaire (Paper C) ............................................................ 71


iii
ABSTRACT
There is an increasing emphasis on developing systematical research approaches for design of
products that appeal to people’s emotions and values. This thesis proposes methodological
developments for investigating people’s subjective emotional needs and values towards
quality and explores interactions of related physical design attributes for product design.
The overall aim of the licentiate thesis is to gain an understanding on Affective engineering of
products through exploring the concept of quality feeling and to develop methodological
approaches for this. Quality feeling can be described as a holistic concept considering
individuals’ perceptions, expectations, experiences, physical and psychological expressions for
a product or service. Affective Engineering methodology aims at translating human
psychological processes, such as feelings and emotions, into appropriate product design
attributes, such as size, shape, and surface characteristics.
The thesis presents three methodological approaches when evaluating products for affective
engineering and one approach for an interactive product design support system development.
The first study presented deals with feelings of quality for reach truck operator’s cabin
components. Components that would convey to give a higher total quality feeling were
identified and improvement opportunities were prioritized. The second study presented is
based on developing an interactive affective design and decision support system software for
design of the steering wheel from drivers’ individual and shared preferences. In the third study
affective values arising from judgments for important feelings of quality is the study basis. The
author presents research on identifying interactions of design attributes for affective values in
waiting areas of primary health care services.
Further, a new approach for applying Affective Engineering in design of complex contexts is
proposed.The proposed approach aims to handle contexts where feelings and design
attributes have complex interactions for products and services that give almost an infinite
number of design alternatives that are difficult to handle in traditional Kansei Engineering
studies.
With this thesis also an interactive product design and decision support system software is
developed for steering wheel design and proposed for educational and industrial use. The
proposed system works based on linking product design attributes to human feelings by
applying Genetic algorithms and provides potential basis for future product development and
improvements.
This thesis has also contributed with affective design recommendations applicable for vehicle
cabins and waiting areas in primary health care. Moreover, a number of existing methods in
Affective Engineering have been tested and methodological experience is drawn, including
advantages, disadvantages and limitations of using these methods.
Keywords: Product experience, Affective engineering, Kansei Engineering, Emotional design,
Services, Rough sets theory, Genetic algorithms.


v
Acknowledgements
I believe that in life people are affected and directed through their “Kansei” and maybe that led me to come to Sweden. I would like to thank to “people” who helped and supported me and I feel their power of love.
First, I would like to express my deepest gratitude to my supervisor Prof. Jörgen Eklund who provided me an optimal infrastructure for my work. Jörgen, without inspring support, discussions and excellent suggestions I wouldn’t be able to finish this study.
I also would like to give my special thanks to Prof. Musa Senel, chairman of Industrial Engineering Department, Anadolu University, Eskisehir, Turkey for supporting me to start Ph.D in Sweden.
I’m most grateful to my other supervisor Prof. Jens-Jörn Dahlgaard for many interesting and motivating discussions. He welcomed me at Quality Technology and Management department with my other colleagues and supported me.
I would like to thank Prof. Mitsuo Nagamachi, who is the inspiration source for me to start research on Kansei. Moreover I also would like to thank Prof. Shigekazu Ishihara for his valuable suggestions on my thesis.
I would like to thank Simon Schütte (Ph.D.) for providing a stimulating environment on Kansei Engineering which helped me to learn and grow.
I would like to thank Mattias Elg (Docent) for his support during my studies.
Mete thank you for being one of the most supportive persons for me in this life, you are a genius .
I give my special thanks to my colleagues at Quality Technology and Management department Anette, Beata, Bodil, Bozena, Jostein, Lars, Mats, Susanne and Vincent for their individual support and “fika” times.
All colleagues at IAV and Envtech, Hillevi, Ida, Anette, Martina, Sara and Maria. Thank you for your kind friendship. Kenneth thanks for enjoyable friendship.
Dag, thanks for commenting upon my work and for friendship.
I want to present my sincere thanks to all my colleagues at Anadolu University: Banu, Fehime, Ilgın, and Hulya.
Ahmet, Andreas, Birce, Barbro, Derya, Emine, Filiz, İlknur, Iain, Giota, Karin, Laurent, Mimmi (Paola), Marie, Mattias, Mehmet, Paulita, Rilda, Sebastien, Sena, Övgu, Valeria and Thom:Thank you for your sincere friendship and fun times. I also wish to thank to Aslı, Berna, Elvan, Gülcin and Tugba for their friendship.
I would like thank to Peter, you supported me in hard times. Sincere thanks also to Irene, Jan and Anna for their support and make living enjoyable in Sweden.
I also wish to thank Metin, Emine and Ozgur for their valuable support.
Finally, I want to thank to my relatives and loving family “Nazmi, Sükran, Erhan and mysister in
law Ebru”.


1
1. INTRODUCTION
This chapter starts with describing the background of the thesis. Afterwards the overall aim of the thesis and
aims of the studies are presented to the reader. The structure of the thesis is given as the last part of this
chapter.
1.1 Background
Unless a product satisfies customers‟ needs and is considered dependable, it will not
succeed in the marketplace (Mital, 2007). Therefore, the quality of a product is the
ultimate determinant of its success in the market and for the price customers are
willing to pay for it.
Product design for quality is moving beyond functionality and usability in satisfying
people‟s subjective quality needs and values (Childs et al., 2006). Designing products
that have potential to satisfy emotions (Wickelgren, 2005) and create feelings towards
quality is desired from most product manufacturers. Thus there is an increasing
emphasis on developing systematical research approaches for design of products that
appeal to people‟s emotions and values. The concepts “quality feeling" and “feelings
of quality” in this thesis are used to explain the same emotional phenomena discussed
above. The terms physical product attributes and product design attributes are also
used with the same meaning in this thesis.
To understand feelings towards quality, experiences with products are important.
When we feel or even imagine using a product, e.g. steering a new car, we associate
our experiences and expectations to different feelings in different stages of the product
experience.
Subjective product experiences are elicited by the interaction, including the degree to
which all our senses are stimulated, the meanings and values we attach to a product
and the feelings and emotions elicited with a product (Desmet and Hekkert, 2007).
The interaction with products can be a result of instrumental and non-instrumental
physical action, but may also consist of passive perception, or even remembering or
thinking of a product (Desmet and Hekkert, 2007).

2
To develop systematical research approaches to design feelings of qualities into
products, there are two major research issues to consider. The first is how to approach
the understanding of human emotions and feelings for quality. The second is how to
develop new and/or test effective methods that have the potential to link product
attributes to emotions and feelings. We need to bear in mind that the first issue when
understanding human emotions and feelings is still a research issue. The second issue to
find methods to identify interaction of design attributes and their influences on
emotions and feelings is also a developing research area within engineering.
In recent years, affective design has been applied increasingly in product development
to fulfill subjective needs and preferences of customers and users in product design.
Affective (Kansei) Engineering was proposed as a methodology attempted to define
the relationship between the feelings/impression/image of customers and design of
products in the early 1970‟ies (Nagamachi, 1995). Affective Engineering methodology
aims at translating human psychological processes, such as feelings and emotions, into
appropriate product design attributes, such as size, shape, surface and other
engineering characteristics (Nagamachi, 2001). The term Kansei represents the
integration of cognitive and affective states regarding a product.
Regarding affective design of product quality, different concepts such as total
ambience (functionality and styling) (Jindo and Hirosago, 1997), hedonic quality
(Helander and Tham, 2003), image /impression quality (Yun et al., 2001), feeling
quality (Lai et al., 2005), Kansei quality (Kang and Yamanaka, 2006) have been studied
in the literature. However estimating this feeling is difficult since there are few
methodological approaches to study limited type of products.
Based on the above arguments the research presented in this thesis is based on first
proposing methodological solutions when investigating people‟s subjective emotional
needs and values towards quality, and then exploring the interaction of related
physical design attributes for product for feelings of quality from an Affective
Engineering viewpoint.
To start research on quality feeling the reach truck named BT REFLEX gave inspiration
for the first study presented in Paper A. In order to give quality design improvement

3
solutions for an operator‟s cabin of a reach truck model, cooperation took place with
BT Industries AB, Sweden. The experienced feelings of quality for operator‟s cabin
components were identified and prioritized in this study.
The second study presented in Paper B is based on providing design solutions for the
operator‟s cabin elements of BT REFLEX, according to the feelings of qualities
identified from the first study. An interactive design and decision support system is
developed based on affective evaluation and through identifying interactions between
design attributes related to evaluations selecting the best alternative design for the
steering wheel component for drivers‟ individual preferences.
With the third study in Paper C, the author aimed at further research for feelings of
quality. Design of affective values arising from feelings of quality was the Paper Basis.
Instead of a tangible product, a physical service environment was chosen as the study
object, more precisely waiting areas in health care. Physical service environment in this
study is considered as a tangible-intangible product where related tangible and
intangible qualities interact.
1.2 Overall Aim
The overall aim of the licentiate thesis is to gain an understanding on affective
engineering of products through exploring the concept of quality feeling and to
develop methodological approaches for this. The aims of the three papers included in
this thesis are explained below.
In Paper A, the aim is to explore design improvements for feelings of quality in a reach
truck operator cabin and for its driving components.
In Paper B, the aim is to develop and design an interactive decision support system to
select product design attributes for design of steering wheel which take into account
interactions between design attributes and feeling quality criteria.
In Paper C, the aim is to understand perceived and desired quality feelings that
contribute to affective values in a service environment (servicescape) and related
physical design attributes and interactions. As study object waiting areas are selected.

4
1.3. Research Questions
The overall aim can be specified through several research questions in each study. The
following two questions are explored in Paper A. (1) By which emotional factors do
design components communicate quality feeling? (2) How do different components
contribute to the Total quality feeling perception from the operator‟s cabin?
Paper B deals with the following research question. (1) How can affective design and
decision support systems be developed for steering wheel design?
Paper C deals with three questions. (1) Are there differences regarding perceived
affective values between waiting areas? (2) What are the desired affective values when
experiencing waiting areas? (3) How do waiting area design attributes interact in
creating affective values?
1.4. Structure of the Thesis
This thesis includes six main parts. The first part introduces the background of the
thesis and the aims. The second part sets the frame of reference. The third part
provides an overview of the methods and their application in the studies. The fourth
part gives an overview of the papers. The fifth part discusses the results and the
methods and how the papers contribute to addressing the research question with a
framework generated from the results. The sixth part draws general conclusions and
points out future research directions. Three studies conducted by the author are
included in the last part of the thesis. The three papers included are referred to in the
text by the letters A, B and C.

5
The thesis is based on the three papers below.
Paper A. Ayas (Alikalfa), E., (2006), Designing "Quality Feeling" in Reach Trucks: A Kansei
Engineering Approach, Proceedings of the 9th International Quality Management for
Organizational Development (QMOD) Conference, August 9-11, Liverpool, England.
Paper B. Schütte, S., Ayas (Alikalfa), E., Schütte, R., Eklund, J. (2006), Developing Software
Tools for Kansei Engineering Processes: Kansei Engineering Software (KESo) and a Design
Support System Based on Genetic Algorithm, Proceedings of the 9th International Quality
Management for Organizational Development (QMOD) Conference, August 9-11, Liverpool,
England.
Paper C. Ayas, E., Eklund, J. and Ishihara, S. (2008), Affective Design of Waiting Areas in
Primary Healthcare, Accepted for publication, Vol 4 No: 20, Special Edition for Affective
Engineering, TQM Journal.
The following figure shows the papers in relation to where Affective Engineering is
used and what is investigated in this thesis. It is necessary to remember that the first
and second studies presented in Paper A and B are related to each other.
Figure 1.1. Papers included in the thesis and the important findings.
Research
theme
6
2. THEORETICAL FRAME OF REFERENCE
That all our knowledge begins with experience, there is indeed no doubt . . . but although our knowledge
originates with experience, it does not all arise out of experience. (Immanuel Kant 1998, p. 41)
This part of the thesis starts with an introduction of how we perceive quality of products including services. Then
an overview is given how emotions for products are discussed in western and Japanese literature. The Kansei
Engineering concept is then introduced as an approach to engineer feelings for products.
2.1. Product Quality
Products include physical goods, services, experiences, events, persons, places,
organizations, information and ideas (Kotler, 2000). Starting with the concept
definitions of product; a product is anything that can be offered to a market to satisfy a
want or need (Kotler, 2000). Ulrich and Eppinger (2003) break down products into
three different categories: User Driven Products, Technology Driven Products and the
third category – Technology and User Driven Products. Typically there is high user
interaction for the user and technology driven products. The user driven product is
derived from the functionality of its interface and/or its aesthetic appeal (Ulrich and
Eppinger, 2003). A complementary definition to user driven products is proposed
with the meta-product concept by Linn (1990). Meta as a word means in Gr.
“beyond”, “after”. It represents all the ideas and interpretations „behind‟ the physical
product, such as prejudices, status, nostalgia, group affiliation and so on (Monö,
1997).
The most pervasive definition of quality is the extent to which a product or service
meets and/or exceeds a customer's expectations (Buzzell and Gale, 1987; Grönroos,
1984; Zeithaml et al., 1990).
One indication of product quality according to Deming (1982) is the extent to which
different consumer‟s evaluations of the same product vary. Degree of “satisfaction”
from a product is proposed as an indicator of product quality by Gilmore (1974).
Ishikwan, (1983) argues the extent to which the product satisfies the consumer‟s
expectations is one implication of product quality (a similar approach to Gilmore,
1974).

7
Categories and dimensions to represent product qualities are discussed in literature by
several researchers. Two categories of qualities were defined by Nelson (1970):
“search qualities” and “experience qualities”. “Search qualities” refer to attributes a
consumer may evaluate before purchase of the product (Alford and Sherrell, 1996).
“Experience qualities” are attributes that can only be discerned during consumption or
after purchase of the product (Alford and Sherrell, 1996). “Search qualities” make it
more difficult to evaluate the product, because there are fewer qualities for the
consumer to use in his evaluation process (Alford and Sherrell, 1996). A third category
from Darby and Karni (1973), “credence qualities” refer to attributes that a consumer
may not be able to evaluate even after purchase and consumption due to the level of
knowledge required to understand what the product does (Alford and Sherrell, 1996).
Eight dimensions on product quality were provided by Garvin (1984) as a classification
framework, based on three approaches; product-based, user-based and manufacturing-
based (Table 2.1), with different dimensions: performance, features, durability,
conformance, reliability, serviceability, aesthetics, and perceived quality. This thesis
mainly focuses on user-based product quality dimensions which are aesthetics and
perceived qualities of products and services.
Later Kano et al. (1984) proposed the theory of “Attractive Quality” where quality
elements are classified into five classes depending on their ability to create customer
satisfaction or dissatisfaction about a product: “must be quality”, “attractive quality”,
“one dimensional quality”, “indifferent quality” and “reverse quality” (Kano, 2001). In
Paper A the quality elements in Kano‟s model are used to approach possible levels for
feelings of quality for products.
To understand product quality, Ulrich and Eppinger (2003) provide two example
criteria to question while evaluating a product “Does it satisfy customer needs?”, “Is it
robust and reliable?”.

8
Table 2.1. “Quality” dimensions relate to define product quality (adapted from Garvin,
1984).
In order to identify customer needs from products, a five step process is suggested by
Ulrich and Eppinger (2003):
1. Gather raw data from customers.
2. Interpret the data in terms of customer needs.
3. Organize the needs into hierarchy.
4. Establish the relative importance of needs.
5. Reflect on the results and the process.
2.1.1. Service Quality
Customers perceive services in terms of the quality of the service and how satisfied
they are overall with their experiences (Zeithaml and Bitner, 2003). There is a need to
make a distinction between customer satisfaction and perceived service quality.
Satisfaction can be defined as the judgment that a product or a service feature, or the
product or service itself, provides a pleasurable level of consumption related
fulfillment (Oliver, 1993). Customer satisfaction is influenced by the service quality,
Product Quality Dimension Definition
Product based
approach
Performance The primary operating characteristics of a product.
Features The secondary characteristics of a product that supplement
its basic functioning.
Durability The product‟s probability of failure-free performance over a
specified period of time.
Manufacturing based
approach
Conformance The degree to which a product‟s physical and performance
characteristics meet design specifications.
Reliability A measure of useful product life, i.e., the amount of use a
customer gets from a product before it deteriorates or must
be replaced.
Serviceability The ease, speed, courtesy, and competence of repair.
User based approach
Aesthetics How the product looks, feels, sounds, tastes or smells, a
matter of personal preferences.
Perceived Quality based on image, brand name, or advertising rather
than product attributes and, of course, is subjectively
assessed.

9
product quality and price as well as situational factors (Zeithaml and Bitner, 2003). In
services the quality of a particular product or service is whatever the customer
perceives it to be (Grönroos, 2001).
As shown in Figure 2.1, service quality is a focused evaluation that reflects the
customer‟s perception of elements such as interaction quality with the staff, physical
environment quality and outcome (technical) quality (Brady and Cronin, 2001) (see
perceived quality by Grönroos, 1983, 1998).
The quality dimensions are also defined as what the customer receives and how the
customer receives it; respectively the technical result or outcome of the process
(Outcome quality) and the functional dimension of the process (functional quality) by
Grönroos (2001).
The need for the physical environment of the service encounter as the third dimension
is explained by Grönroos (2001). Grönroos (2001) also proposes that where of the
service quality dimension needs to be added based on Rust and Oliver (1994) to what
and how dimensions of service quality. This dimension can be labeled as “servicescape
quality” Grönroos (2001). The term servicescape is introduced to the services
marketing literature by Bitner (1990) to describe various elements of the physical
environment of the service encounter.
It is important take affective responses into account in service quality evaluations
(Grönroos, 2001). The scales that are used in literature, such as SERVQUAL
(Parasuraman et al., 1988), PANAS (Watson, 2000) cover just limited exploration of
moods related to service quality dimensions. Moods may have positive or negative
effect on customer‟s evaluations. However emotions that customers feel when
consuming a service have not been included in perceived service quality models or in
models for measuring satisfaction for service (Grönroos, 2001). Method developments
are needed in this area, for which an approach is presented in Paper C.

10
Figure 2.1. Customer perceptions of quality and customer satisfaction (Zeithaml and Bitner,
2003).
In order to understand servicescape effects; environment surveys, direct observation,
experimental methods and photographic blueprints are used (Zeithaml and Bitner,
2003).
Environment surveys ask people (customers or employees) to express their needs and
preferences for different environmental configurations. An advantage of these surveys
is sample size can be large and many environmental variables can be explored
simultaneously; the primary disadvantage of this surveys is sometimes the results may
be less valid then other methods that is the survey questions may not truly reflect how
people feel or how they will behave Zeithaml and Bitner, 2003). Second method is
direct observations where trained observers make detailed notes of environmental
conditions (Zeithaml and Bitner, 2003). The advantage is that it is done by highly
trained observers. The disadvantages are primarily relates to time, costs and if
observers can interpret the environment in a right way (Zeithaml and Bitner, 2003).
Third method is experimental and involves groups of customers exposed to different
environmental configurations and measurements of their reactions (Zeithaml and
Bitner, 2003). The advantage of this method is the validity of results. Disadvantages
are time and costs. As fourth method, photographic blueprints are also used (Zeithaml
Interaction
quality
Physical
environment
quality
Outcome
quality
Service
quality
Product
quality
Situational
factors
Customer
satisfaction
Personal
factors
Cost

11
and Bitner, 2003). These provide a visualization of the service to the customer at each
step and are useful for unambiuous documentation of the physical evidence of the
service.
Considering the methods presented above in order to get associations for the relation
of service and physical environment design features to customer feelings and values
comprehensive methodological approaches are needed.
2.2. Experiencing Quality of Products
Product experience is defined as a change in core affect that is attributed to human-
product interaction (Desmet and Hekkert, 2007). Some researchers introduced
frameworks on product quality experiences. Jordan (2002) discusses that a product or
service should engage with humans at three abstraction levels: The first level is related
to performance of a product for the task for which it was designed. The second level
relates to the emotions associated with the product or service in the context of the
associated tasks. These emotions are part of the „user experience‟. The third level
reflects the aspiration qualities associated with the product or service (i.e. personal or
social factors).
Desmet and Hekkert (2007) define product experience with three levels as “the entire
set of affects that is elicited by the interaction between a user and a product, including
the degree to which all our senses are gratified (aesthetic experience), the meanings we
attach to the product (experience of meaning) and the feelings and emotions that are
elicited (emotional experience)”.
Russel et al. (1999) define pleasure and activation as dimensions of experience.
Activation, at the level of subjective experience, referred to a sense of mobilization or
energy (Russel et al., 1999). Pleasure, at the level of subjective experience, summarizes
how well one is doing (Russel et al., 1999).
Oppenheimer (2005) introduced a framework for developing the interaction between
user and product, using the metaphor of “conversation between people”. He calls
product interactions announce, explain, act, and notify to show possible ways the
product and its qualities communicate with consumers. Successfully communicating the

12
product concept gives the user a sense of comfort, an „„Okay, I know where to start‟‟
feeling. Although designers often think of „„first impressions‟‟ around the way a
product looks, the concept certainly applies to how the user thinks the product will
behave (Oppenheimer, 2005).
Table 2.2. Framework for understanding the interaction (Oppenheimer, 2005).
Proposed steps to investigate interaction with
the product
Example questions
Announce: What are you? What is it? What does the product serve for?
Explain: What do you do? What are all the things this product does?
How do you control it?
What would you do to perform the main
function?
Act: Do this for me. What did the user intend to do?
What does the user think he did?
Notify: Here is what I did. In the user‟s mind, what should happen next?
What does the user think actually happened next?
Is that what the user expected?
2.3. Cognition-Emotion Interaction
How psychological and physiological needs can be considered in product design to fit
customers‟ mind and body? This requires understanding of customer psychological
needs, expectations, moods and experiences, and understanding of the related
physiological needs including ergonomic criteria for design of physical design
attributes.
When determining the psychological needs, two systems appear to dominate decision
making of the human mind: the affective and cognitive systems. Over the years, there
has been a discussion whether emotions and cognition are separate and which system
that follows the other or has a role in genesis of the other; if emotions precede
cognitive process or cognitive process precede emotions (Arnold, 1960; Smith and
Lazarus, 1993).

13
Scherer (2003) discusses that one of the most intriguing aspects of the cognition-
emotion interaction is the recursive chaining that can be shown in Figure 2.2. to exist
between these influence processes. The first source of recursive effects is the feedback
from the pattern of emotional reactions in the different response modalities on the
outgoing appraisal process (arrow 1) (Scherer, 2003).The second source of recursive
effects is shown in arrows 2 and 3 which show the impact of decisions or behaviours
that have been determined by specific emotional reactions both on the emotion itself,
especially the component of subjective experience or feeling (arrow 2) and on the
ongoing appraisal processes (arrow 3) (Scherer, 2003).
Figure 2.2. Recursive effects between cognition and emotion.
Subjective experience or feeling is argued as one of the most important components of
emotion by Scherer (2003). One of the terminological confusion is the frequent
tendency to use the terms “emotion” and “feeling” as synonyms (for further discussion
see Scherer, 2003; Russell, 2003). “Feelings” are explained as affective states that
might grow out of a specific event or might be produced by a vague condition and
moreover those who experience the affect may or may not be aware of what
generated the feeling for it (Berkowitz, 2003).
Perception and
cognitive
representation
Perception
Memory
Appraisal
Emotional
Reaction
Attention
Judgement
Attitudes
Decisions
Problem solving
,
Desi
3
1
2

14
2.3.1. Emotions in Western and Japanese Literature
Affect and Kansei terms are introduced respectively in Western and Japanese literature
as comprehensive psychological concepts to represent emotions towards products. A
detailed discussion of these two terms will be provided in the following parts.
2.3.2. “Affect” attributed to products in Western literature
Affective responses are generated by attributions derived from product attribute
satisfaction which, in turn, influence global satisfaction judgments (Oliver, 1993).
Attributed affect symbolizes the attribution of core affect to an object (the person,
condition, thing or an event), i.e. the mental state is directed (Russel, 1999). Affect or
“core affect” defined as the neurophysiologic state that is consciously accessible as a
simple, non-reflective feeling that is an integral blend of hedonic (pleasure–
displeasure) and arousal (sleepy–activated) values by Russel (2003). According to
Zajonc (2000) core affect is mental but not cognitive or reflective.
Affective quality is defined in the literature as the ability to cause a change in the affect
by Russel (1999). These affective qualities are present in the objects, e.g. products or
services. Perceptions of affective qualities are argued by Russel (2003) as represented
by several terms in the literature as synonyms: evaluation, automatic evaluation,
affective judgment, appraisal, affective reaction, primitive emotion, affective responses.
Mehrabian and Russell (1974) offered evidence that all stimuli, including large-scale
environments, are perceived in terms of their affective qualities. Osgood‟s (1957) work
with the semantic differential found that affective quality is also exist in the meaning
of words Russel, Ward and Pratt (1981) suggested that two dimensions sleepy/arousing
and pleasant/unpleasant could be sufficient to measure affect toward environments
(Figure 2.3). From the affective quality dimensions, Pleasant quality is subjective
depending on how much the individual likes or dislikes the environment (Lovelock
and Wirtz, 2004). The vertical dimension is the Arousal quality. This dimension of
affective quality is dependent on environments‟ “information load”, i.e. its degree of
novelty (unexpected, surprising, new, and familiar) and complexity (number of
elements, extent of motion or change) (Lovelock and Wirtz, 2004). If the
environment is pleasant, increasing arousal can lead to excitement and stronger

15
positive consumer response. If the environment is unpleasant, increasing arousal level
will move consumers into the distressing region (Lovelock and Wirtz, 2004).
Figure 2.3. Structural representation of affective appraisal for environments.
How to assess core affect, mood and evaluation is depending on “feelings”. Also these
concepts are integrated to one another in evaluation. Russell et al. (1999) explain this
approach:
Core affect is assessed by asking “how one is feeling right now”. When extended over
moderate lengths of time, core affect becomes a mood and is assessed by asking “how
one generally felt during that period”. Evaluation is assessed by asking “how one feels
about X”. When extended over time, evaluation becomes an attitude and is assessed by
asking “how one generally feels about X”.
Building on an earlier discussion by Wyer and Carlston (1979), Schwarz and Clore
(1983, 1988) identified yet another process of evaluation. This process is based on the
notion that feelings are sources of information (in Pham, 1998). Schwarz and Clore
(1988) call this process the “How do-I-feel-about-it?' „heuristic (hereafter HDIF
heuristic). According to the HDIF heuristic, if the target is not present in the direct
physical environment, people may still perform their evaluations by examining their
affective responses to a mental representation of the target (Pham, 1998).
arousing
distressing exciting
unpleasant pleasant
relaxing
sleepy
gloomy

16
2.3.3. “Kansei” attributed to products in Japanese literature
In literature, researchers from different countries provide several definitions of the
Kansei concept related to their own research. In Japan the translation terminology for
“Kansei” draws back to Amane Nishi (1829-1897), the first person who used Kansei as
a philosophical term for “sensibility” (Nagasawa, 2004).
In 1921, Teiyu Amano used the German term “Sinnlichkeit” (sensitivity) in Critique of
Pure Reason to translate the word Kansei (Kant, 2003). As an opposite term of Kansei
“Risei” (close to "Logic process", reason (Nagasawa, 2004)) is later also argued by Levy
(2007).
However the words “sensitivity” and “sensibility” alone are not exact meanings of
Kansei. It is argued that „to Kansei‟ means “to feel to the core” (Nagasawa, 2004). The
word of Kansei, if used in engineering and business, should be considered to be a series
of information processing processes of sensation, perception, cognition, sentiment and
expression (Nagasawa, 2004).
Kansei later is described by Nagamachi (2001) as a Japanese word for "individual's
subjective impression from a certain artifact, environment, or situation using all the
senses of sight, hearing, feeling, smell, taste as well as recognition". It is then explained
as the mental process of experiencing the product and described as “psychological
feelings and image regarding a product” (Namagachi, 2002).
The Japanese Society of Kansei Engineering, established at 1998, makes the definition
of “Kansei” as the integrated functions of the mind, and that various functions exist in
during receiving and sending information. The definitions presented above might
show that the term Kansei represent the integration of cognitive and affective states.
“Kansei” feelings can be captured in several ways, according to Nagamachi (2001):
People‟s behaviours and actions.
Words (spoken).
Facial and body expressions.
Physiological responses (e.g. heart rate, body temperature).

17
2.4. Kansei values and product experience
Quality has been defined also as value (Feigenbaum, 1951). In a product‟s life stage
two categories of values exist: „use values‟ and „Kansei values‟ (Fujita and Nishikawa,
2001). Use values mean fundamental functions for products to exist as useful goods.
Kansei values mean something apart from the former such as ease of use and aesthetics
(Fujita and Nishikawa, 2001).
Under this categorization, product life stages are typically understood as the following
sequence as shown in Figure 2.4. These are: „market-in stage,‟ where use values
dominate the characteristics of products, since a product is still creating a new market
segment; „growing-up stage,‟ where Kansei values must be put over use values, since a
product becomes a certain existing in the market; „maturated stage‟, where Kansei
values become competitive features beyond use values, since all competitors offer the
same functionality and differentiation through additional values has become marketing
tactics (Fujita and Nishikawa, 2001).
Figure 2.4. Product life stages under use values versus Kansei values (Fujita and Nishikawa,
2001).
Kansei values play an important role in addition to mere appearance (e.g. aesthetics)
in creating image built on what people see and what they experience, which carries
people from “what looks good” to “what looks good to use” (Nakada, 1997). Both of
these approaches of course integrate design aesthetics with usability.
Value addition
Kansei values
Use values
Maturated
Growing-up
Market in

18
Kansei values are developed through a series of steps by our senses according to
Nakada (1997); (a) the desire to be close (the sense of sight), (b) the desire to touch
(the sense of touch), (c) the desire to move (the sense of hearing and equilibrum).
Nagasawa (2006) proposes value creation through examining “customer experiences”.
This indicates the value of something that impresses and appeals on the Kansei, e.g.
senses and impressions that users and customers directly feel and are impressed with
(Nagasawa, 2006). Furthermore, customer experience values were classified in five
modules proposed by Schmitt (2003) and applied by Nagasawa ( 2006) in Table 2.3.
Table 2.3. Modules of Strategic Experience Value provided by Schmitt (2003).
Class Contents of Experience Value
SENSE Sensitive experience value to appeal on the five senses.
FEEL Emotional experience value to appeal on feeling and mood.
THINK Intellectual experience value to appeal on creativity and cognition.
ACT Behavioral experience value and life style to appeal on physical behavior.
RELATE Relative experience value to appeal on confirmative group and cultural.
2.5. Engineering “Kansei”
Kansei Engineering is widely used in Asian region, while there is no single unified word
for Kansei Engineering in English or western countries. The German philosopher
Baumgarten and his work AESTHETICA (1750), which was the first study that
influenced Kansei Engineering (Harada, 1997). However, current Kansei Engineering is
defined as the transdisciplinary engineering that extends over humanities, social and
natural science. (www.jske.org, 2004). Mr. Ken‟ichi Yamamoto, Former President of
Mazda Motor Co used “Kansei” (1986) in international context when giving lectures
on the design success of Japanese cars by Kansei Engineering in U.S.
Kansei Engineering gives emphasis to understanding the whole product experience
from cognitive and emotional perspectives and aims to synthesize the two
perspectives to get the whole picture on the total product experience. The interaction

19
between physical design attributes and emotional needs is another research area
receiving great interest from Kansei Engineering researchers. Nagamachi, (1999)
emphasizes capturing and understanding customers‟/users‟ emotional values for
products and the importance of human factors by using ergonomics to complement
product design.
In the engineering field, Kansei Engineering was proposed by Nagamachi in the 1970‟s
to understand and quantify human needs (psychological and physiological) for
product design.
Perhaps, Kansei Engineering approach is also one of the most extensive concepts that
emphasize the importance of the subjective aspect of usability (Han et al., 2000). Han
et al., 2000 proposed a method of explaining the relationship between usability and
design elements of a product based on Kansei Engineering. Usability is evaluated by
them as a combination of objective performance measures and subjective image/
impression aspects of usability.
Nagamachi (1989) proposed Kansei Engineering as a framework to gather all the
current and the future possible methods to design customer‟s Kansei (affective
responses) into tangible and intangible products. According to (Nagamachi, 2001)
there are three focal points of Kansei Engineering:
• How to accurately understand consumer “Kansei”
• How to reflect and translate “Kansei understanding into product design
• How to create a system and organization for “Kansei” orientated design.
Schütte (2005) developed a general model covering the process of Kansei Engineering.
This model is given in Paper B (Schütte et al., 2006).This general model is taken as
basis to explain the methodological process flow of the studies in this thesis.
2.6. Kansei as a System and Methods used to quantify Kansei
It is discussed in the literature that it is high importance to see Kansei as a system, and
to understand Kansei from a systematic point of view. For that reason a framework to
present research on Kansei which explains and analyses the Kansei is shown in Figure
2.5 (Shiizuka and Watada 2006). The horizontal axis represents expression and
learning and the vertical axis represents Kansei. In the lower end of the vertical axis,

20
the „natural Kansei‟ of real human beings and in the upper end „artificial Kansei‟, which
realizes or expresses natural Kansei „artificially‟ are represented. The field of natural
Kansei is devoted to understand human emotion and cognitively. Cognitive science
and multivariate analyses were studied from this perspective in lower third and fourth
quadrants. Artificial Kansei, is placed in the upper portion of the two-dimensional
space. The research for artificial Kansei; first by Kansei expressions in the first quadrant
and second for Kansei recognition in the second quadrant are presented. In particular,
by employing Kansei methods, new perspectives and new methodologies can be
utilized in universal and information design (Shiizuka and Watada, 2006).The research
area in this thesis is placed in the fourth quadrant of this Kansei research classification.
Figure 2.5. A framework of Kansei system (Shiizuka and Watada, 2006).
Kansei Engineering has three main research areas: “evaluation” which measures human
emotion and sensibility by various subjective and psycho- physiological measurement
methods; “simulation” in which reaction of emotion and sensibility can be obtained in
advance in a simulated environment and “application” which applies the research
results into manufacturing of specific products.
Natural Kansei
Cognitive science
Modelling
Kansei System
Artifical Kansei
Measurement
Expression
“Kansei recognition”
theory
“Kansei Expression” theory
Smart-agent system
Cognitive system
Design
Soft computing
Multivariate
analysis
Second
quadrant
First
quadrant
Third
quadrant
Fourth
quadrant

21
According to the Kansei research classification above an overview of methods used in
Kansei Engineering is provided below to examine natural Kansei and artificial Kansei in
Figure 2.4.
Table 2.4. Methods used in Kansei Engineering.
Kansei Methods
Natural
Kansei
Subjective
measurement
Semantic
Differentials
Self reports
Likert scales
Psycho physiological
measurement
Electromyography (EMG),
Heart rate
Electroencephalography (EEG)
Event-related potential (ERP)
Functional magnetic resonance
imaging (fMRI)
Data Reduction
Factor Analysis
Cluster Analysis
Correspondence
Analysis
Modelling
Soft computing
Quantification Theory
I,II,III,IV
Structural Equation
Modelling
Logistic and Ordinal
Regression
Neural Networks
Rough Sets Analysis
Simulation
Virtual Reality
Human machine interfaces
Fuzzy Logic
Genetic algorithms
Artificial
Kansei
Kansei
Recognition
Theory
Robot mimic
human Kansei
Recognition
Fuzzy inference system
Compare to product design research Kansei machine vision technology is also a
developing area. Some initiative examples for Kansei machine vision technology are
e.g. in inspection of cosmetics and jewelry (Nagata et al., 1992) applied by simulating
human vision, individual authentication in security systems (Samal, 1992) applied for
monitoring human beings e.g. and e.g. face engineering (Koshimizu, et al., 1999),
surgical simulation (Toriwaki, 1996) as applications of human-machine Interfaces.

22
3. RESEARCH PROCESS AND METHODS
To study feelings of quality for products, general information about the conducted research and the methods used to link product design attributes are given in the first part of this chapter. In the next part the research process conducted in each study will be examined and presented. First, the interviews and the questionnaires used for the data collection are presented. Following that, the analysis methods and the use of these are explained.
3.1. Overview
In Table 3.1, the research processes applied are summarized according to the types of
studies, the participants attended, data collection methods, data analysis software and
the role of the author during the studies.
Table 3.1. Overview of the research.
Paper A Paper B Paper C
Type of
study
Laboratory experiment Interactive design software
development.
Exploratory study
Participants University students (N=47) in an
Ergonomics and Design course,
Mechanical Engineering,
Linköping University.
The software is developed as
a PhD course project and
approved.
88 participants (60 patients
and 28 personnel) at six
primary health centers.
Data
collection
methods
Questionnaire and ratings
Part I – 7 degree SD scales
Part II- 7 degree Likert scales
Open Ended questions
100 degree VAS scales Interview
Free association method
Computerized and Manual Computerized Manual
Software
type and/or
language
SPSS C# language is used. SPSS
ROSE (Rough Sets )
Researcher
role
Study design together with
supervisors.
Search of available literature.
Data collection.
Data analysis.
Article writing as main author.
Study design.
Search of available literature.
Software development.
Study design together with
supervisors.
Search of available literature.
Data collection
Data analysis.
Article writing as main
author.

23
An outline of the qualitative and quantitative methods and tools used for the studies
are shown in Table 3.2 also classified according to research areas on Kansei. The
nature of collected data has an influence on the selection of analysis methods. The
methods applied in the first study is based on quantitative data while in the second
study is based on qualitative data.
Table 3.2. Overview of methods used in relation to Kansei Engineering.
The latter sections gave an overview of methodological procedures towards feelings
of quality applied during each study. The procedures are explained in more detail
below so that the reader can follow each step of the methodological approaches.
Kansei Engineering
Application Areas
Process
Steps
METHODS Paper A Paper B Paper C
Product Semantic
Structure
Identification
Spanning the
semantic space
Data collection
Several resources
Free association
Input data
reduction
Affinity Analysis
Pareto Analysis
χ2 Independency
test
Kansei Structure
Identification
Data reduction Factor Analysis
Product Physical
Structure
Identification
Spanning the space
of properties
Data collection
Several resources
Free association
Product Relationship
Identification
Synthesis of
semantic and
physical space
Data modeling
and synthesis
Rough Sets
Analysis
Important product
component
selection for quality
improvements
Multivariate
Regression
Analysis
Model
validation
All possible
regressions
Mapping Kansei Mapping products
according to
perceived qualities
Data reduction Correspondence
Analysis
Kansei Design
Support System
Development
Linking physical
design attributes to
feelings and
preferences
Data collection Rating scales
Data analysis Genetic
algorithms

24
3.2. Paper A- Overview of methodological procedure
The study on the operator cabin of a fork lift truck was performed in 11 steps and two
stages, as described below and in Figure 3.2.
Step 1: The domain for the study is determined as understanding quality feelings for
the interior cabin of the truck.
Step 2: Two evaluation stages I-II are determined to complement each other for
quality feeling analysis .
The first stage is determined as the quality evaluation of product components
steering wheel, hydraulic controls, driver„s seat, pedals, control console,
dashboard, overhead guard and interior cabin surfaces with Kansei words
selected to represent quality feeling. These words are given in Table I in Paper
A. Pictures of product components are shown in Appendix I.
The second stage is determined as evaluation of overall quality feeling of
product components and the interior cabin.
Stage 1. Quality feeling evaluation of product components
Step 3: Semantic space related quality feeling for vehicles is spanned from several
resources: magazines related to vehicles (e.g. Industrial Vehicle Technology), literature
and interviews with drivers. The product components to be evaluated are defined at
this step.
Step 4: Affinity Analysis is used as a tool for grouping the collected Kansei words for
quality feeling.
Step 5: 20 Kansei words are selected by a focus group for the operator cabin
components.
Step 6a: Semantic differential scales are constructed with the representative words for
operator cabin components shown in Figure 3.1. This technique is used to examine
differences among the meaning of obtained Kansei words for each product
component rated by the same participant group.

25
Figure 3.1. An example of an evaluation page for interior cabin components with Kansei
words.
Step 7: A questionnaire is designed and the data is collected for the first and second
stages. Computerized data collection is used for the first stage. In Figure 3.1 an
example page for first stage of data collection is shown and questionnaire for manual
data collection for the second stage is given in Table 3.3.
Step 8: Data evaluation and analysis is performed.
Step 9: Reliability analysis is applied to summarize the degree of difference between
questionnaire items and Cronbach's alpha values are used to check the internal
consistency of questionnaire items.
Step 10: Questionnaire items (words) from semantic differentials scales are analyzed
with factor analysis.
Step 11: “Kansei factors” are identified from the factor analysis results for product
components as descriptors of quality feeling.
Stage 2. Overall quality feeling evaluation of product
Step 2: The second stage is evaluation of overall quality feeling for product
components and the interior cabin.
Step 3: Rating scales are constructed to evaluate quality feeling of product
components. The whole questionnaire is given in Appendix 2.
Ergonomic
Not at all Very much
Next Kansei Word
26
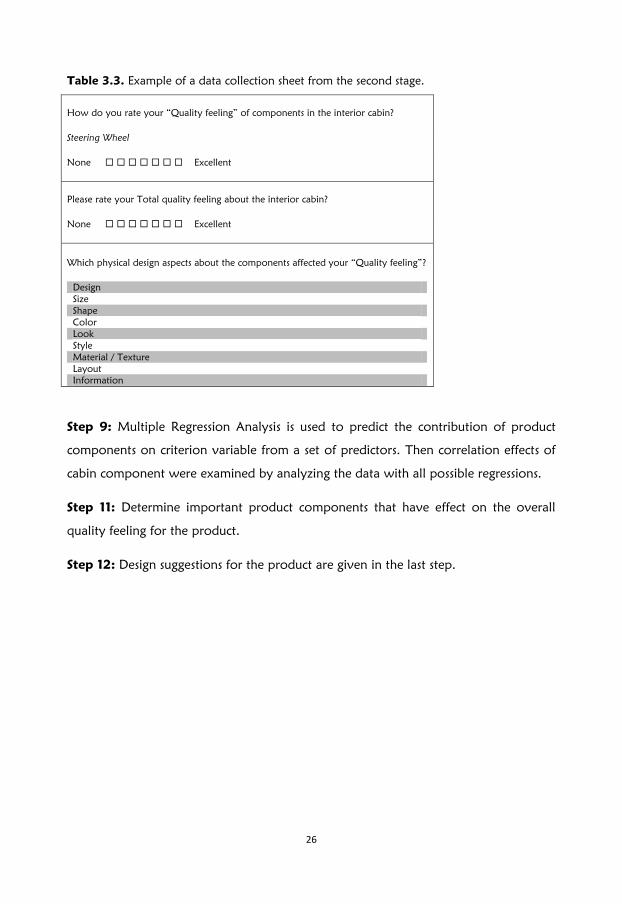
Table 3.3. Example of a data collection sheet from the second stage.
How do you rate your “Quality feeling” of components in the interior cabin?
Steering Wheel None Excellent
Please rate your Total quality feeling about the interior cabin?
None Excellent
Which physical design aspects about the components affected your “Quality feeling”?
Design
Size
Shape
Color
Look
Style
Material / Texture
Layout
Information
Step 9: Multiple Regression Analysis is used to predict the contribution of product
components on criterion variable from a set of predictors. Then correlation effects of
cabin component were examined by analyzing the data with all possible regressions.
Step 11: Determine important product components that have effect on the overall
quality feeling for the product.
Step 12: Design suggestions for the product are given in the last step.

27
Figure 3.2. Methodological procedure for Paper A.
Stage I
Quality feeling evaluation of
product components using Kansei
words.
Feeling of Quality
Step 1
Step 2
Step 3
Step 4
Step 5
Step 6
Step 7
Step 8
Step 9
Step 10
Stage II
Overall quality feeling evaluation
of product components and the
product.
Span the semantic space.
Affinity analysis to group the
words.
Choose Kansei words.
Construct semantic differentials scales.
Identify product components.
Construct rating scales for product
components and the product.
Data Collection.
Data Analysis.
Reliability analysis.
Factor Analysis (PCA).
Extract “Kansei factors” that
represent Quality feeling for
product components.
Multiple regression analysis.
Determine “important product
components” that effect the
overall quality feeling for the
product.
Provide design suggestions for the
product.
Step 11

28
3.3. Paper B-Overview of methodological procedure
The outline of the design and decision support system developed for steering wheel
design based on Genetic algorithms is explained below and shown in Figure 3.3.
The algorithm of the proposed system is outlined in Figure 3.3 as follows:
Figure 3.3. Methodological procedure for developing design support system based on GA.
Algorithm
I. Proposed design samples consist of calculated parameters by GA.
II. GA begins with a population of “chromosomes” (e.g. candidate solutions to a
problem) and moves them to a new population using selection together with the
genetic operators, crossover and mutation. Design parameters are coded to bit array.
The bit array is called gene array. Each chromosome consists of “genes” where each
gene represents an instance of a particular “allele” (e.g. 0 or 1).
1) Determine criteria weights 2) Determine GA parameters
END
Generate initial samples at random
Evaluate steering wheel samples
Selection
Crossover
Mutation
Is the user
satisfied?
No
Yes
Genetic Algorithm
Sample database

29
III. Enter emotional criteria for the product. The system enables the use of Kansei
words from the semantic space extracted for a product as criteria weights.
IV. The design support sytem generates N rule-sets randomly, and encode the rule-sets
as chromosomes. Set iteration counter to 1 (i.e., t = 1), and initialize the upper bound
of generation.
V. The user evaluates design samples in the computer environment. The fitness value is
calculated based on the evaluation.
VI. Apply genetic operators (selection, crossover, mutation) to the population and
generate new population. Set t = t + 1 and go to Step II. Selection operator chooses
the fitter chromosomes from the population to participate in the reproduction.
Crossover operator exchanges subparts of two chromosomes to exploit the search
space. Mutation operator randomly changes the values of some genes to include new
genetic material to the population. GA continues to perform the selection, crossover,
and mutation operators until the termination criterion is reached (Kapanoglu and
Alikalfa, 2004).
VII. The system repeats these operations until the user can receive a satisfactory
sample. In the system, subjective evaluations toward design samples are regarded as a
fitting function and the system calculates suitable design parameters using the Genetic
Algorithm.
The evaluation page for a design sample is given in Figure 3.4. The description of the
evaluation page is as follows:
• The option “Show parameters as tree view” shows detailed information about
current steering wheel as a hierarchical tree view.
• The picture shows the evaluated steering wheel sample.
• The information about current iteration and evaluated chromosome (steering
wheel) of population is displayed below the evaluation picture.
• On the right side of the screenshot, there is a user evaluation area. In this area,
there are weights of the criteria and user feedback about related criteria is shown.
The Genetic Algorithm (GA) is based on the process of Darwin‟s theory of evolution.
By starting with a set of potential solutions and changing them over generations, GAs
converge to the best „fit‟ (optimum or near optimum) solution (Holland, 1992). The
natural selection process of the GA extracts the useful design items from a multitude of

30
design attributes in Kansei studies (Tsuchiya et al., 1996). The method is capable of
solving the difficulty in treating numerous independent variables concurrently in a
very short computation (Tsuchiya et al., 1996).
Figure 3.4. Program evaluation page for a steering wheel sample.
The fitness value for each chromosome is calculated as the following:
Fitness value=(Importance of Kansei word_1 for the user*rating scale value for
Kansei word_1 + Importance of Kansei word_2 for the user*rating scale value
for Kansei word_2+…..+ Importance of Kansei word_n for the user *rating
scale value for Kansei word_n).
In this sample Fitness value is calculated as =(4*58+6*21+….+4*15)=897.
3.4. Paper C- Overview of Methodological Procedure
The study on identifying affective design of waiting areas was performed in 10 steps
and two stages, as described below and in Figure 3.5.
Step 1: The domain is decided to be quality. It defines the context of the application
for a particular type of product in a Kansei Engineering study.
Step 2: The participants are identified. This step is related to the selection of domain.
Step 3 and 4: Data collection is performed through in depth interviews, where free
association is used as a method. First, participants talk about important feelings for

31
them (Kansei words). Thereafter the participants relate their feelings to design
attributes.
Step 5: The semantic space of feelings (Kansei words) and the space of design
attributes collected in the previous step are recorded.
Step 6: Based on the data recorded, the relationship of feeling statements to design
attributes are verified for each participant.
Stage I. Mapping perceived quality feelings
Step 7: The data gathered for the first research question is classified accroding to the
perceived Affective qualities for the physical environment according to Russell et al.
(1981).
Step 8: Correspondence analysis (CA) is applied to investigate the “perceived affective
values” for the selected waiting areas. Step 9: Mapping products according to
perceived affective quality dimensions.
Step 10: Check χ2 significance test results after CA.
Stage II. Identifying common feelings as affective values and investigating
related design attributes
Step 7: An MS Excel database (named as a Kansei database) is constructed to store the
feeling and design attribute responses. The responses are classified under quality
dimensions.
Step 8: Through statistical methods (e.g. χ2 Independency Tests), significance of
common Kansei words is tested for all participants. The common feelings identified in
this step are assumed to indicate Kansei values.
Step 9: Data mining methods are used to discover useful design patterns associated
with the Kansei values (see Step 7). “Rough Sets” (RS) method is a applied to extract
decision rules between the Kansei values and design attribute categories from the data
set. Data extraction quality is also checked for validation. There are different

32
validation algorithms in RS theory that may be used due to data nature and the nature
of the aim (minimization or maximization) of the study.
Rough Sets Theory
Kansei Engineering involves much human evaluation data which usually contain
considerable rough and ambiguous information with uncertainty and non-linear
characteristics (Nishino et al., 2006). In order to deal with these characteristics
Nagamachi et al. (2006) proposes rough set theory as a systematic knowledge
discovery tool with analytical power in dealing with rough, uncertain, and ambiguous
data and one of the most promising alternatives for solving Kansei Engineering
problems.
The Rough set approach has important advantages such as identifying relationships
that would not be found by using statistical methods, allowing qualitative and
quantitative data, and finding minimal sets of data (Pawlak, 1982). Nishino et al.
(2006) argue that in Kansei rule extraction there are two important points; first how
to handle variation in individual human evaluation data such as feeling or sense, and
second how to decide from the extracted specific and general decision rules for the
most interesting and appropriate rules while applying the Rough set model. Different
approaches have been used to handle those problems (see the discussions in Nishino et
al., 2006).
Step 10: Decision rules are extracted by algorithms that are used in RS (e.g. minimal
covering rule (LEM2) algorithm, Michalski Qm measure, m-method, dual beta-lower
and upper approximations (Nishino et al. 2006).
Step 11: Identify interactions of design attributes for the selected feeling/s.

33
Figure 3.5. Methodological procedure for Paper C.
Identify the participants
Data collection: Free association method
Stage I
Perceived feelings for different
products
Stage II
Desired important feelings and
related design attributes
Quality
Classification of perceived
feelings under affective quality
dimensions
Mapping products according
to perceived affective quality
dimensions
Test of significance for verification
of perceived qualities
Record semantic
space
Record design
attributes
Verify Kansei words and their relation to
design attributes with each participant
Build Kansei database from responses
Choose significant
feelings to represent
affective (Kansei) values
responses
Analyze data using data mining methods
Extract decision rules for Kansei values
based on design attributes.
Step 1
Step 2
Step 3
Step 4
Step 5
Step 6
Step 7
Step 8
Step 9
Step 10
Identify interactions of design attributes.
Step 11

34
3.4.1. Free associations to grasp Kansei of individuals
One of the intentions with the second study is to test methods to understand human
thinking on products to employ in Affective engineering. Another aim is to help
participants think and realize their needs towards a product or an environment, and
to enable participants to state feelings that are important for them and relating their
feelings to design attributes. Therefore, Free association technique is used in this study
to understand how people think and make associations in their minds about a certain
object/environment. This method remains an essential aspect of psychoanalytic
technique today (Kernberg, 2004) and is used in qualitative research mainly for
conducting psychoanalysis (Parker, 2004). By asking the patient open ended questions
to say whatever comes to mind, the psychoanalyst is eliciting the kind of narrative that
is not structured according to conscious logic, but according to unconscious logic. In
other words, the associations follow pathways defined by emotional motivations,
rather than rational intentions (Hollway and Jefferson, 2000).
Free association (Psychodynamic theory) is a technique used in psychology, devised by
Sigmund Freud (1913). This technique assumes that all memories are arranged in a
single associative network, and that sooner or later the subject will stumble across the
crucial memory (Encyclopædia Britannica, 1911).
3.4.2. Interview Process
Interviews were conducted by the author and a graduate student of psychology. First
contacts have been established with the primary health centres. Then previsits are
codncuted. During the previsits, the study was introduced to the health centre
manager and the manager informed the staff. The study has also been introduced to
the staff on the interview day and they were asked for voluntary participation to
express their ideas on waiting rooms/areas. The receptionists played also an important
role in execution of this study. They were informed about the study and were in
charge of informing the patients and asking for their participation. Participation was
voluntary. If a patient refused to participate, information was given to the next
patient.

35
Patients who were going to wait for at least 15 minutes before their appointment are
asked for participation. They also received an information handout about the study
including the aim, confidentiality and contact information. The process of interviewing
was planned beforehand. Places were found in each health centre so that interviews
could be conducted in privacy.
3.4.3. Interview Questions
The main interview questions used are presented in Table 3.4. Accordingly, the same
questions were also applied to the staff. The responses were documented by note-
taking. The questionnaire for Paper C is given in Appendix 3.
Table 3.4. Interview questions used in the study
Participants Interview questions
Patients and staff (1)How do you feel in the waiting area?
(2)What important feelings would you like to get from a waiting area?
Patients (3)Try to think how do you relate your important feelings to design features in a
waiting area?
The following Table 3.5 shows an example from coded raw data in MS Excel. As can
be seen each participant stated varying feeling needs and different context of related
design attributes. For example, in a „safe‟ waiting room a participant wants to have
clean and high furniture and good lightning.
Table 3.5. Example of raw data collected.
Waiting
room no.
Patient Feeling Physical design attributes
Design attribute 1 Design attribute 2 Design attribute 3
6 3 safety clean furniture high furniture good lightning
5 3 calm warm colours (red) furniture design soft textiles
5 4 caretaking privacy integrity amusement

36
4 .REVIEW OF THE STUDIES
In the following part an overview of the three papers included in this licentiate thesis are
presented.
4.1. Overview
Before summarizing the studies, their aims, the literature field relating to the studies
and the overall results are outlined and introduced in Table 4.1.
Table 4.1. Summary of the appended papers.
Paper A Paper B Paper C
Aim To identify and analyze
aspects of “Quality
Feeling” in a reach truck
operator cabin.
Developing an affective interactive
design support system for customer
for design of steering wheel of
reach truck.
The overall aim of the study is to
understand waiting areas from
an affective design perspective.
Literature
search
Kansei Engineering
studies on vehicles.
Kansei Engineering studies on
Interactive Decision Support and
Genetic Algorithm applications.
Influence of the physical
environment in waiting rooms.
Results Reach truck operator
cabin components give
rise to different
perceived dimensions
representing quality
feeling.
Linking human affective needs to
the interaction of product
attributes give promising results by
the developed software.
To generate Kansei value for
`Calm` feeling in waiting rooms;
well design of lightning, sitting
places and plants are needed in
health centres.
4.2. Paper A- Designing "Quality Feeling" In Reach Trucks: A
Kansei Engineering Approach
In the following sections research issues, methods and results of Paper A are going to
be presented to the reader.
4.2.1. Research issues
Paper A focuses on identifying and analyzing aspects of “quality feeling” in a reach
truck operator cabin. The study starts with examining literature with Kansei
Engineering applications on vehicles. The literature studies mainly focus on the interior
and exterior of vehicles and focus on clarifying the relationship between the driver's
physiological responses and emotions to physical vehicle behavior, driving Kansei
about forklift trucks, design of comfortable vehicle interiors and specifically evaluation
37
of lift truck components to understand human Kansei towards design attributes. No
studies were identified to examine an operator cabin of a vehicle from a quality
feeling perspective. Quality Kansei is also defined from the author‟s point of view.
Inspired by Kano‟s attractive quality model (1984), levels of quality feeling for a
product from customer‟s point of view is also introduced in the paper.
The aim is to investigate the specific concept of “quality feeling” (feeling for quality)
for reach truck operator cabin components. To gain experience from a general
perspective on product design two research questions have been formulated in this
study. (1) By which emotional factors do design components communicate quality
feeling? (2)How do different components contribute to the Total quality feeling?
4.2.2. Methods
Kansei Engineering methodology was applied on how each component representing a
reach truck operator cabin evoke quality feeling and how users experience quality
feeling. A questionnaire is developed consisting of two main parts. The former part
concerned specially determined Kansei words to be rated and describing perceived
quality feeling of eight operator cabin components on 7-degree SD scales. The latter
part was designed so that the overall quality feeling perception of the operator cabin
components are rated with 7 degree Likert scales.
To obtain the Kansei words, 265 describing words were collected initially from
different resources that could reflect, describe and evoke the quality feeling about
operator cabin components. 20 of them were selected after Affinity analysis and then
these words were reduced to Kansei factors to represent quality feeling for each
component. Four methods are applied in different stages of data evaluation namely
Affinity Analysis, Reliability Analysis, Factor Analysis and Multiple Regression Analysis.
4.2.3. Results
The interior cabin surfaces were found as the most effective component in order to
increase “Total quality feeling” in the reach truck driver cabin. The underlying Kansei
factors, to design this component for Quality feeling were found to be “robust”,
“ergonomic”, “nice to touch”, “high-Tech” and “spacious”. As well, the steering wheel

38
and the dashboard are second in importance to enhance the “Total quality feeling” in
the reach truck operator cabin. In Kansei factors extracted for all components are
given in results discussion part of this thesis in Table 5.1. Appendix I suggestions from
qualitative responses for quality design improvements are also given.
4.2.4. Discussion and Conclusions
From the experiences gained during the research, quality feeling can be described as
the core of all kinds of perceptions about a product or service. In this study, the
concept of quality feeling is transferred into a set of verbal expressions to define it. It is
also investigated on a general perception level. Here it is determined for which
component/s it is of high importance to raise their quality feeling. In general, the
results indicate that vehicle cabin components give rise to different dimensions of
quality feelings in the Semantic Space. These dimensions contribute to the Total quality
feeling of the users and their satisfaction about the product.
4.3. Paper B- Interactive Design Support System by Genetic
Algorithm
In the following sections research issues, methods, and results of Paper B are going to
be presented to the reader.
4.3.1. Research issues
In todays‟ world customers‟ demands for products are diversifying and the trend in
launching new products and existing product developments are moving towards
personalized products. The vehicle manufacturers therefore need to develop new
systems that incorporate human intuition and emotion where a customer can
personally participate in the design process. For this study the steering wheel is chosen
as a component for quality feeling improvement of operator‟s cabin, based on the
findings from Paper A. The steering wheel is not just a vehicle control mechanism, but
also plays an important role for the vehicle operator protection system (Yang et al.,
2005). On the other hand, design of such a system will require consideration of
countless types of product attribute interactions, emotional preferences and user
friendliness. Time, efficiency and costs are also important restrictions.

39
Genetic Algorithm (GA) has been chosen as method to relate emotional preferences to
steering wheel physical design attributes. What affects driver‟s preferences is a
combination of several physical design attributes rather than one physical design
attribute.The natural selection process of the GA extracts the useful design items from
a multitude of design attributes in Kansei studies (Tsuchiya et al., 2001). The method is
capable of solving the difficulty in treating numerous independent variables
concurrently in a very short computation (Tsuchiya et al., 1996). There exist other
Kansei Engineering applications of Genetic algorithms in literature, such as eye glass
frame (Yanagisawa and Fukuda, 2003), canned coffee (Tsuchiya et. al, 1999), 3-D
virtual creation system (Kaino and Hagiwara), evaluation of food advertisements
(Tsuchiya et. al, 2001), fashion design (Kim and Cho, 2000) and human-oriented
image retrieval system (Cho and Lee, 2002).
4.3.2. Methods
A typical steering wheel is comprised of a metal insert, a steel hub, and a layer of
material (molding) to cover part of the insert. There are 20 parameters selected for
the study. Considering the possible combination of these design attributes there are
31.104.000.000 design solutions that can be searched using the related chromosome
structure. The GA parameters used for the Paper Are; Population Size = 20, Crossover
Rate = % 65, Mutation Rate = % 5,Tournament Size = 2, Maximum Iteration = 100
and Random Seed Number = 1. A customer rates each generated design sample based
on his or her degree of satisfaction. The product attribute space has to be constructed
on beforehand and customer emotional preferences for the product, such as
“attractive impression”, “robust impression”, “high-tech impression” need to be
loaded as weighing criteria. Then the customer evaluates the product samples on a 100
degree scale.
4.3.3. Results
The outcome of this study is the interactive design and decision software developed
for steering wheel design. The developed system is based on Genetic operations and
written in C# language. Emotional criteria and customers‟ subjective evaluations for
design samples are used to calculate the fitness value for the evaluated steering wheel

40
sample. The user enters into the system one or more adjective words representing his
or her Kansei or, simply, the user requirement. Here, all adjectives used to describe a
product can be considered as Kansei words. The user first rates these words. Then the
user evaluates a population of steering wheel design samples selected from the image
database with those words. The program after that identifies the relationship between
words and steering wheel properties. For the new design population the genetic
system “learns” the preferred design attributes and shows new design samples based
on the findings from the previous evaluation.
4.3.4. Discussion and Conclusions
It is rarely possible to analyze nonlinear interactions of product attributes with
statistical models. A person usually does not relate a “sportive” steering wheel in his
mind to just one design attribute such as material but also shape and other
characteristics are related to each other. Therefore, heuristics are used to approach
non-linear characteristics of human-product interaction in this study. The system allows
the customer to participate in the design process and express his or her choices.
Another advantage of this design support system is that it enables the use of Kansei
semantic space (emotional preferences) that has been extracted before for a product as
criteria coefficients. The designed system has several advantages for further
applications. First of all, a large number of parameters (colour, shape etc.) can be used
according to different product design applications. A group of people or individuals
can make evaluations and/or a joint design can be determined.
41
4.4. Paper C- Affective Design of Waiting Areas in Primary
Healthcare
In the following sections research issues, methods and results of Paper C are going to
be presented to the reader.
4.4.1. Research issues
Developing healthcare services from the understanding of patients‟ needs in waiting
areas is a growing concern (Arneill and Devlin, 2003; Leather et al., 2003). However,
exploring Kansei values and needs for design of waiting areas in primary healthcare
are not given the same emphasis. Kansei” is defined as “individual's psychological
feeling and image resulting from a series of information processes from a certain
artifact, environment, or situation” (Nagamachi, 1999). There is a need to distinguish
between functional and affective (Kansei) values for an object or an environment and
to show how the two interact. Therefore, in this research, the Kansei Engineering
methodology is proposed to examine the interaction between servicescape design
attributes that influence affective values.
4.4.2. Methods
Correspondence analysis (CA) was applied to investigate the “perceived affective
values” for the selected waiting areas. Commonly desired feelings of the participants
were derived based on the χ2 and Pareto analysis results. Following the interactions
between design attributes for the commonly desired feelings were analyzed by the RS
method (Pawlak, 1982).
4.4.3. Results
The responses (N= 192) for the waiting areas were classified under three headings,
Affective Qualities, Technical Quality and Interaction Quality. χ2 analysis was applied
to the data gathered for common feelings. As a result the calm, welcome and safety-
security feelings appeared as significant for patients and staff. To create calm feeling in
waiting areas, privacy, colours, plants and location of play areas for children interact.
Good design of lighting, seating arrangements and minimal noise are also needed.

42
The desired Affective Qualities from waiting areas are Relaxing, Pleasant and Arousing.
Considering Pleasant Qualities; pleasantness, comfort and warm feelings are important.
Calm is found to be the most important for Relaxing Quality. On the other hand, fresh
feeling together with bracing appeared important to provide Arousing Quality.
Security-safety, functionality and privacy appear as the main design issues for Technical
Qualities. Welcoming environments including staff that cares and gives attention to
patients are the important characteristics to improve Interaction Quality with the staff
working at primary health centres.
4.4.4. Discussion and Conclusions
The diversity of feelings can be seen from the participants responses how they state
their feelings e.g. for a desired waiting room environment: a participant express his
/her feelings desires as “calm, homelike and integrity”, another participant states as
“fresh and stillness”, next one states as “comfortable, safety and welcoming” and so
on.
The interactions between affective values and physical design attributes were shown
by examining the relationship between calm feeling and design solutions. It is argued
that by distinguishing important feelings from intangible and tangible quality
characteristics that generate Kansei values, waiting experiences can be created that
connect with people on a deeper level and transform the environment into spaces of
greater significance. It is also suggested in this study that interactions between designs
attributes need to be considered to understand and reflect human feelings in product
design.

43
5. DISCUSSION
The first part of this chapter is devoted to addressing the research questions and discussion of results from
the studies. The part concerns a methodological result discussion of Affective Engineering methodology
considering how and in which way products were evaluated.
5.1. Addressing Research Questions
In this part answers found for the research questions are divided into each study
paper. Detailed discussion on study results are provided in the next part of the
chapter.
5.1.1. Paper A
By which emotional factors do design components communicate quality feeling?
The Kansei factors identified for reach truck operator cabin components for feelings of
quality is given in Table 5.1. Looking at Kansei factors it can be seen that different
quality feeling dimensions support each other for cabin components.
If we consider design improvements for e.g. Interior cabin surfaces ergonomic, high-
tech, nice to touch, robustness and spaciousness are the needed Kansei design factors.
The physical design attributes for interior cabin surfaces need to be selected
considering these feelings and further validated if the applied design reflect those
feelings.
How do different components contribute to give the Total quality feeling?
“Interior cabin surfaces”, “steering wheel”, “dashboard”, “overhead guard”,
“dashboard” and “hydraulic controls” have relative importance in the order presented
to contribute to Total quality feeling of the operator cabin. Among the components,
Interior cabin surfaces, Steering wheel and dashboard have the highest relative
importance in that order for improvements of the existing product.

44
Table 5.1. Extracted feelings of quality Kansei design factors for reach truck operator cabin
components.
Reach truck operator cabin components
Steering
Wheel
Driver’s
Seat
Pedals Dashboard Interior
Cabin
Surfaces
Control
Console
Hydraulic
Controls
Overhead
Guard
Attractive-
Nice to
Touch
Attractive High-
Quality
Attractive Ergonomic Attractive-
Nice to
touch
High-tech-
Attractive
Attractive
Ergonomic Comfort Nice to
touch
Comfort High-tech Ergonomic Functional
-Reliable
Ergonomic
Functional High-Quality Productive Ergonomic Nice to
touch
High-tech Heavy Heavy-
Robust
High-tech Heavy User-
Friendly
Functional Robust
Heavy Robust Precision
Reliable
Spacious Heavy Spacious Robust Spacious -
Supportive
Spacious
Robust Supportive
Spacious
5.1.2. Paper B
How can affective design support systems be developed to help decision making for
steering wheel design?
Genetic algorithms are applied with this study as a heuristics approach to identify
interactions between numerous product design variables to design feelings and suggest
design solutions. This approach through the interaction of generations of design
samples and customer's subjective evaluations evolve to give an optimum design
solution for the customer.

45
5.1.3. Paper C
Are there differences regarding perceived affective values between waiting areas?
Significant differences were found according to the perceived affective qualities for the
selected environments. Waiting area C is perceived with positive qualities such as
Relaxing Quality and Exciting Quality, while waiting areas D and F are perceived with
Pleasant Quality. Waiting areas A, B and E are perceived with Unpleasant and Gloomy
qualities. Gloomy quality can be thought as an interaction of unpleasant and sleepy
qualities. Perception of these Affective qualities attributed to environment can be
related to other factors that may affect satisfaction of patients from the service given
at the health centre.
What are the desired affective values when experiencing waiting areas?
The desired affective values from common feelings are summarized under three
headings, Affective qualities, Technical quality and Interaction quality in Table 4.3.
Particular feelings appear as important for participants from service quality
dimensions. Approximately half of the participant‟s responses are related to affective
qualities for a desired environment. From affective qualities Relaxing and Pleasant
feeling qualities are important and received the same amount of responses from the
participants. From Relaxing qualities, participants would like to feel calm in the
waiting areas distinguishing from the other type of feelings. Considering Pleasant
Qualities; pleasantness, comfort and warm feelings are important. On the other hand,
fresh feeling together with bracing appeared important to provide Arousing Quality.
Security-safety, functionality and privacy appear as the main design issues for Technical
Qualities. Welcoming environments including staff that cares and gives attention to
patients are the important characteristics to improve Interaction Quality with the staff
working at primary health centres.
How do waiting area design attributes interact in creating affective values?
Calm is the commonly desired feeling that would appeal to affective values. Therefore
design attribute interactions were analyzed as an example for this feeling in creating
affective values. To create calm feeling in waiting areas, privacy, colours, plants and

46
location of play areas for children are interacting design attributes. Good design of
lighting, seating arrangements and minimal noise are also needed.
Table 4.3. Breakdown of quality dimensions according to the Kansei Engineering Type I
approach.
Kansei levels
Level 0 Level 1 Level 2 Level 3
Feeling of
Quality
Feelings for
Affective Qualities
(54%)
Relaxing quality
(47%)
calm (90%)
Pleasant quality
(46% )
pleasant
(38%)
Arousing quality
(7%)
fresh (57%)
Feelings for
Technical Quality (28%)
Security-safety (42%)
Functionality (25%)
Privacy (21%)
Feelings for
Interaction Quality
(18%)
Welcome (57%)
Caring staff (12%)
Staff that give attention (11%)
5.2. Results Discussion
Paper A
Considering Paper A, in general results show that a comprehensive evaluation is
necessary to understand how products communicate with customers/users in terms of
quality. It is identified that the operator cabin components have different contibutions
to quantify Total quality feeling about the product.
By a further research study physical design attribute interactions can be examined to
give physcial design suggestions for each Kansei factor identified for the cabin
components.

47
Paper B
In Paper B, Genetic algorithms are proposed and applied to develop an interactive
design support system for steering wheel design which also considers the subjective
quality feeling preferences. It is shown that Genetic algorithms can cope with the
change and the diversification of customer's demand interactively. This system needs
to be tested with drivers to gain experience on their preferences.
While developing an interactive affective design and decision support system, based
on my experiences two main aspects are how to approach, understand and prioritize
human Kansei feelings as an input to the design system and second to choose method
approaches to be able to propose design solutions. These aspects may affect
application power of such a tool to design of products. Usability aspects of graphical
interface are also need to be tested.
Paper C
Looking at the results from the first level in Table 4.3, we can make a distinction
between three levels of service quality that are Affective Qualities, Technical Quality
and Interaction Quality. The results implicate that the participants tend to evaluate
different qualities holistically. With this study, the author has observed that some
feelings interact with each other when perceiving waiting areas. To give an example,
“calm” as a feeling is related to “privacy” feeling and also related to “functionality”
e.g. reduced noise level. The study conducted in Paper C can also be extended further
to analyze design attribute interactions for common feelings that belong to other type
of desired qualities to enhance the desired service experience.
In the broad level of environmental design, taking positive-negative interactions both
for feelings and physical design attributes into account is inevitable.The framework
proposed in this paper should also be developed further in order to better handle
studies of complex contexts and environments with extremely many design
alternatives.

48
5.3. Methods Discussion
The studies follow different approaches for collection and structure identification of
Kansei words towards quality feeling, which may lead to relatively different
advantages and disadvantages. First of all, the method approaches were discussed
how the Kansei words determined in the studies. Different way of data collection is
used for semantic structure and physical attribute identification in Paper A and C
which have different outcomes discussed below.
5.3.1. Paper A: The method approach for feelings of quality
The first study employs traditional tools for Kansei word collection from available
resources and then semantic structure identification. In the first study Kansei words
(the first level) that may represent feelings of quality are collected from several
resources. Affinity Analysis is then used as a manual expert method for grouping the
collected Kansei words and selecting the representatives. The major disadvantage of
Affinity analysis is that focus group from experts may fail (Schütte, 2005).
In this step, statistical methods could be used as alternative way by first rating the
collected words with a customer group and obtaining factor dimensions for Semantic
structure identification. These words are thereafter used to evaluate the product. The
evaluations are submitted to Factor Analysis and Kansei factors are identified from the
second level Kansei words.
It is not verified in the first study that Kansei words selected were the most important
words for the participants to express their feelings for the product. Instead Kansei
words (second level) are selected cautiously from each affinity cluster to be a
representative of all feelings towards quality in the first study. Another way of
minimizing the risks with this type of product evaluation could be asking participants
to prioritize the Kansei words before the data collection and using these as decision
weights when building up a mathematical model.
The author suggests that one important method conclusion to consider from this study
is to select a possible variety of feelings to represent participants that fit the customers‟
psychological situation.

49
5.3.2. Paper B: The method approach for feelings of quality
For this study, the Semantic space for design of steering wheel is obtained from the
previous study in Paper A. The following Kansei factors were included: attractive-nice
to touch, ergonomic, functional, high-tech, reliable, robust, and spacious were used to
evaluate the study object. In the developed system the emotional evaluation criteria
for feelings of quality can be entered to the system on beforehand. Evaluation can be
made by individuals or by a user group. The space of physical product properties
needs to be defined in the system earlier.
5.3.3. Paper C: The method approach for feelings of quality
The third study uses a new approach for collection of words and semantic structure
identification compared to traditional Kansei Engineering studies. Here, the
participants are encouraged to think about their own experiences and have expressed
their own words to represent important feelings for the product. These words are
assumed as Kansei words obtained from the Semantic structure identification.
One of the difficulties with the applied data collection in this study is individually
different vocabularies to reflect feelings. Synonym words are needed to be used with
this type of data collection. It is also assumed in this study that the feelings presented
are “important” due to the formulation of the interview questions.
Compared to Paper A, one step further is aimed in this study by identifying commonly
desired feelings from important feelings to understanding affective values for a
product. In order to identify commonly desired feelings, Pareto diagrams and χ2
Independency tests were found useful. Perceived quality dimensions identified in
literature were found helpful to see which service quality dimensions are commonly
desired.
Correspondence Analysis is found useful in mapping the perceived affective qualities
for selected waiting rooms. Correspondence analysis is identical to Quantification
Theory Type 3 and is seen as a generalization of Principal Component Analysis (PCA)
where the variables to be analyzed are categorical instead of quantitative. So it has the
same function as Factor analysis in principal when used for qualitative data.

50
5.4. Proposed Approaches to Identify Physical attributes and interactions
The author addresses identifying the space of physical design attributes for the product
with two new approaches in Paper B and C.
The reasons of using these approaches is that first of all in Kansei Engineering there is
no consistent way of collecting the Space of physical product attributes for the
products (Schütte, 2005). In a framework model proposed by Schütte et al. (2004),
Space of physical product attributes are identified independently the from the
Semantic Space which consist of Kansei words and, based on the product alternatives,
prototypes and views from the product design team and company. Second, it is
difficult to identify if the Kansei word used for evaluating the product is directly
related to that physical product attribute. When participants evaluate several products
in Kansei Engineering, they do not rate the physical design attributes. Participants in
such studies rate the Kansei words. The properties of products are coded before the
evaluation. According to the product evaluations, the properties are then identified by
techniques such Quantification Theory etc. This research area has to be improved also
pointed out by Schütte (2005).
In Paper A, open ended questions are used to understand the product design aspects
for the interior cabin of a reach truck. The design attribute categories for the interior
cabin are defined on beforehand.
In Paper B, the space of possible design parameters are defined on beforehand. The
user evaluates a population of steering wheel design samples selected from the image
database with Kansei words. The first generation design sample is generated
randomly. The program after that identifies the relationship between words and
steering wheel properties. For the new design population the genetic system “learns”
the preferred design attributes and shows new design samples based on the findings
from the previous evaluation. So there is no need for a statistical evaluation to
identify the needed design attributes, the program identifies according to the user
preferences. This approach proposed by the author as an alternative to study product
design attributes and their interactions.
51
In Paper C, the author addresses this problem with another new approach.
Participants first talk about important feelings they want to perceive from a product
and they relate to the “potential physical product attributes” based on their
preferences. In this study, design attributes for the environment are determined by the
participants freely. Hence there can always be a risk that participants‟ answers do not
cover the whole space of design attributes. However, the intention with the study was
to see how a specific feeling common for participants can be related to design
attributes and if there are interactions between design attributes that can be extracted
from that. This way of collecting potential product attributes also allow us to discover
new and latent physical product attributes. As an example, one patient would like to
see a tropic design in the waiting environment. The participant then relates it to palm
like plants and so on. Then the Kansei words and related physical product attributes
are collected in relation to each other.
5.5. Questionnaires
For Paper A, SD scales are used for data collection. 7 degree scales are used in the
study, even though other type of scales could be used. The inter-reliability of the scales
constructed for each interior cabin component were validated and found highly
reliable. The questionnaire and scales can be modified and applied for other products
to quantify quality feeling. A limitation for Paper A can be that the analysis of data
was conducted without grouping the participants into female and male groups. The
number of subjects was also another limitation for conducting further statistical
analysis on item scale reliability. On the other hand, inter consistency of the scales
could be validated.
The questionnaire is designed in English and the subjects were mainly Swedish citizens.
Not making an evaluation in their tongue might have effects on the evaluations of the
cabin components. Therefore, providing dictionary meanings of those words to the
participants during the evaluations was found supportive.
Among the three studied third study is considered as an exploratory study. With a
follow-up study, a quantitative approach could have been used for further research
conducted in Paper C. One way could be employing scales that are used in literature,
such as SERVQUAL (Parasuraman et al., 1988), PANAS (Watson, 2000) or

52
combination of environmental and psychological measurement scales. By using these
types of scales we can only measure moods for the selected product however we can
not identify feeling-product attribute interactions.
It is also assumed before the data analysis that the collected data is homogenous and
that the participants were treated in the same way by the two interviewers.
First of all in using all scale types the quality of data collected is important to have an
explanatory power of the investigated phenomena.
In Paper A Likert scales are constructed to investigate how each cabin component in
reach truck contributes the underlying Total quality feeling (a single issue). Likert scales
help to assess individuals with differing viewpoints to be discriminated from each
other by accumulation of the scores for the questionnaire items (Wilson and Corlett,
1998).
The intention with using SD scales in this study is to discover how groups interpret the
meaning of words. Thus an advantage of using SD scales is that with an individual
scale a unique aspect of the quality feeling unrelated to other questionnaire items may
be examined.
The scales are labeled with “not at all” and “very much” on the two ends of both
Likert and SD scales. The reason of not to using opposite meanings of words in ends of
the scales is that sometimes there is no opposite word of adjectives (unambiguous
labels) and there can be word confusion.
In Paper B 100 degree simple VAS scales are used. The reason to use such scale is while
evaluating a product in the virtual environment it is easier for the user to drag the
mouse to the desired point. Another reason is that there is no neutral region marked
in the scale so user is encouraged to make a choice between negative and positive
sides.
Different contexts for product evaluations
The evaluation environments for products may have positive /negative psychological
effects on the results from the studies conducted. Paper A was performed in a
laboratory environment. Paper B considers evaluating products in virtual

53
environment. In Paper C the interviews take place in the real environment. One
advantage of using laboratory environment is participants can focus on the study on
the other hand maybe this type of evaluation environment does not reflect the real
conditions to use the product.
Usability aspects of user interfaces
The graphical user interface used for data collection in the first study is a modified
version of MS EXCEL software by Schütte (2005). Usability aspects of this interface are
not tested. The usability aspects of the software developed for interactive design is
neither tested. Usability is an important aspect in Kansei Engineering for designing
surveys on interactive computer systems, e.g. presenting alternatives to common
designs reduce the number of survey subject and the time required for the researchers
collect the data (Cooper and Kamei, 2002).Therefore, future studies should include a
usability test also for the software evaluation.
5.6. Discussion of methods compared to traditional Kansei
Engineering studies
More structured data collection methods are needed to understand customer‟s
affective needs. With the approaches presented here the author wants to point out the
needs for methodological developments to distinguish between functional and
affective values for an object or an environment and to show how the two
dimensions of values interact for future improvements.
In traditional Kansei Engineering studies participants generally do ratings with SD scales
for comparison of several products with a cumbersome number of words. This may
affect the quality of the raw data in a negative way even before the analysis. The
reason is that it takes too much time and the participants can loose their focus and
attention after sometime to evaluate the products.
Therefore, the free association method together with RS method as analysis method is
applied as a method approach in Paper C and Genetic algorithm approach has applied
in Paper B to approach the goals presented above.

54
The qualitative free association method used in this study may help reducing long data
collection times in Kansei Engineering studies and hence reduce time needed for
participants.
On the other hand there is limited number of methods in the literature to evaluate the
collected data in an effective way. The Rough set approach has important advantages
to analyze such kind of data, such as identifying relationships that would not be found
by using other statistical methods, allowing qualitative and quantitative data, and
finding minimal sets of data (Pawlak, 1982). Nishino et al. (2006) argue that in Kansei
rule extraction there are two important points; first of all how to handle variation in
individual human evaluation data such as feeling or sense and second how to decide
from the extracted specific and general decision rules upon the most interesting and
appropriate rules while applying the Rough set model. These criteria should be well
thought while deriving conclusions from RS analysis of data while providing product
design solutions for companies.
In order to use RS effectively in decision making, the data should be collected with
care. The number of responses for a specific feeling is also likely to affect the
extraction quality of the necessary design attributes. A limitation of this paper is that
design solutions were proposed considering only one psychological feeling, in order
not to make the paper too complex.
Using heuristics such as neural networks or Genetic algorithms are also needed when
the design search space is large and complex or expert knowledge is difficult to encode
to narrow the search space. These methods are needed when no mathematical analysis
is available and traditional search methods fail.
As a last point of discussion, the methods used in this thesis are not compared with
other alternative methods that exist in the literature.

55
5.7. Discussion of Qualitative and Quantitative approaches for
Kansei Engineering
Both qualitative and quantitative methods are applied in the studies for Kansei data
collection and analysis. The choice of method depends on type of customer needs
(physiological, social, symbolic, hedonic and cognitive), product type, available
resources and the aims of research.
The quantitative methods are needed to provide evaluations of products and
comparing alternatives, and also when a systematic quantifiable approach of
assessment and evaluation is possible. Qualitative approaches are needed when the
product is complex and difficult to quantify. When analyzing a complex product
quantitative and qualitative approaches may also be used to together and
complement one another which the author experienced as an efficient approach to
examine products in a holistic way as shown with the Paper C.
Sampling in qualitative studies involves decisions not only about who observe or
interview, but also about settings, events and social processes (Miles and Huberman,
1994). In complex cases, sampling is made to get characteristics of settings, events and
processes and conceptually the people themselves are secondary.
-Is the sampling relevant to the conceptual frame and the research questions?
The study was undertaken at six health centres chosen to represent socially and
regionally distinct areas in the county. One of the health centres replied that they did
not want to participate. For that reason another comparable health centre replaced
that primary healthcentre.
-Can believable descriptions and explanations be produced ones that are true to life?
The patients were interviewed while they waited to see a physician or being there to
have laboratory tests. Layout of the health centers and the presence of other people
may have an effect on the research. In-depth interviews were conducted with
approximately ten patients and five staff working in different positions at each of
these centers. Every statement is verified by the participants at the end of interviews.
Of course there can be circumstances that people may not reflect true feelings. That

56
was attempted to be minimized by choosing a psychological approach of data
collection.
5.8. What is designed into products: affect, Kansei etc.?
A central issue for this thesis is what is designed into products, and whether it is
feelings, emotions, affective responses, usability, hedonomics, ergonomics or Kansei.
The concepts exist today have high correlation to each other in this research field.
When the author started her academic career, she found herself in a dilemma where
many definitions of each concept exist and different kinds of research have been made
to symbolize each of them. Russel (2003) provides a comprehensive review and
discussion on psychological construction of emotion and asks two important questions
that stimulate the author‟s thoughts on emotions in this manner:
(1)“Are emotions to be conceptualized as brain modes, actions or action tendencies,
reflexes, instincts, attitudes, cognitive structures, motives, sensations, or feelings?”
(2) “Are emotions biologically fixed modules (and hence reducible to biology) or
socially constructed roles (and reducible to sociology)? Are they discrete categories or
bipolar dimensions? Are they cognitive, precognitive, or postcognitive?”
It is not clear yet if Affect and Kansei provide the similar meaning in Japanese and
European cultures. However, the researches for both concepts have very much in
common. As an example, Semantic differential technique is used both to measure
affective qualities and Kansei words for products.
When I think about the product experiences every research under investigating
user/customer/consumer preferences involves somehow psychological experience
based on physical experience, or memory without physical interaction with an object;
or just psychological experiences. These experiences are inseparable from human
decision making. In science at least there has been found a clear distinction between
physical (regarding senses) and psychological (inner: cognitive and affective)
experience.
In literature, researchers discuss several concepts; however in real life we can see that
people have different psychological experiences and reactions due to their culture,

57
linguistics etc. Even vocabularies differ to describe psychological experience. People
may have deep or opposite experiences related to products due to their backgrounds
as individuals. The concept of feelings, emotions etc. even differ due to the reasons
presented above. Further, new concepts such as “pleasurable products” or trends like
“funology” appear and the dilemma continues.
Literature presents various commonly used methods to investigate and measure
human judgments towards the concepts the author question above. Khalid and
Helander (2006) have a discussion looking at this dilemma from affective,
hedonomics, emotional design perspectives and from different cultural experiences etc.
Regarding products including services it is said that quality is in the eye of the
beholder. Feelings of quality is beyond the eyes of the beholder…
In the following figure 5.1, the author summarizes the process of investigating
subjective product qualities based on her experiences. Based on several ways of
interactions and experiences for a product, human feelings are approached to be
quantified and be measured by engineering techniques. As Nagasawa (2004) discusses
“what is observed is not Kansei but the causes and the consequences of the Kansei
process”.
Starting with a simple need like an ergonomic steering wheel, the customer realizes
his/her needs and different levels of interactions extract so that one person who wants
an “ergonomic” eg. steering wheel as his/her first value then comes up with “nice to
touch”. Following these two affective values(ergonomic and nice to touch) also have
an interaction in the person‟s mind according to personal selection criteria for physical
attributes and emotional experiences. Then the next higher research level is examining
the interaction effects of Kansei needs of what customer have in mind and so on. The
highest degree of affective values can be explained as “core Kansei”. It is the
representation of group of all important feelings and their interactions.

58
Figure 5.1. A general overview of the research presented in this thesis.
According to the author‟s experiences, the result when using the Kansei Engineering
approach is dependent on the several important factors presented briefly below.
A good collaboration with the company.
Careful planning of the settings, participants, data collection strategies etc.
A research group with expertise within the product development area.
A knowledge base to realize how to treat the product design problem.
5.9. Research Contributions
Within this thesis, first of all an interactive product design and decision support system
based on linking product design attributes to human feelings has been developed.
Further, a new approach for applying Affective Engineering in design of complex
contexts is proposed. The proposed approach aims to handle contexts where feelings
and design attributes have complex interactions for products and services. Experiences
from application of these and other methods have created better understanding of
methods usage in Affective Engineering and of design recommendations.
More, the concept of “quality feeling” has been explored for tangible and intangible
products and found to be useful in that people identify it as meaningful. Even though
different individuals have different preferences in this respect, there are also many
similarities. Experience has also been gained for examination of both tangible and
intangible products.
Product
Experience
Subjective
Product
Qualities
Aesthetics
Perceived
Gathering feeling
responses for product
properties (X)
Input (X)
Use of Kansei
Engineering
methods
Analysis: Employ X
as an estimator of
Y= f(X)
Investigate Output
(Y): Quality feeling,
and affective values
Human
Interaction
59
This thesis has also contributed with affective design recommendations applicable for
vehicle cabins and waiting areas in primary health care.
It has also been tested how to analyze qualitatively collected data with a quantitative
approach. Moreover, existing methods in Affective Engineering were tested and
methodological experience is gained for limitations, advantages and disadvantages of
using several methods.
5.10. Future research
There are several opportunities for future research. Quality feeling is a comprehensive
concept which offers new opportunities. In order to widen the research experience
towards this concept, more applications are needed with other types of products.
Moreover the existing research should be broadened. The design and decision support
system can be applied and tested in a next study with different occupational groups.
The software ought to be modified for development of other products where
complex interactions occur between design properties.
60
6. CONCLUSIONS
This thesis proposes methodological development approaches for investigating
people‟s subjective emotional needs and values towards quality, and explores
interactions of related physical design attributes for product design.
Affective Engineering or Kansei Engineering is being used to explore the concept of
quality feeling for both products and services. Quality feeling can be described as a
holistic concept integrating individuals‟ perceptions, expectations, experiences, physical
and psychological expressions for a product or service.
This thesis used and evaluated several methods and developed a new approach to
better analyze affective needs in complex situations. Such complex settings and
products that give almost an infinite number of design alternatives that evoke many
different feelings are difficult to handle in traditional Kansei Engineering studies.
First reason is that in traditional Kansei Engineering studies it is difficult to control if
the Kansei words evaluated for products are important for the participants to express
their feelings for the product. Another reason is, it has been observed that different
feelings and quality dimensions interact with each other which make the affective
product design research more complicated.
It is rarely possible to analyze non-linear interactions of product attributes with
statistical models. In this sense applying Rough sets theory as a method was found
useful to approach qualitative and quantitative data which usually contain
considerable rough and ambiguous information with uncertainty and non-linear
characteristics. Both qualitative and quantitative methods were used and tested in the
applied studies. Qualitative methods are more advantageous to capture hidden and
desired feelings, which may help to discover affective needs for a product in a better
way.
The results from this thesis show that it is important to understand people‟s attitudes
towards objects when they describe the feelings of quality, since they may express
their needs in different ways.There are besides differences between products and
services according to how people percieve and evaluate them. Quality feelings from

61
products relate to technical, functional and aesthetic product qualities for the certain
feelings. For services, physical environment qualities, interaction qualities with the staff
and technical qualities appear to be the main factors that interact with the feelings of
quality.
The methodologies developed and used were found to be useful for identifying such
relationships between quality feelings and product attributes, both for design of
vehicle interiors, vehicle interior components and for service environments.
With this thesis also an interactive product design and decision support system
software is developed for steering wheel design and proposed for educational and
industrial use. The proposed system works based on linking product design attributes
to human feelings by applying Genetic algorithms and provides potential basis for
future product development and improvements.
The proposed methodological and analysis approaches support product designers and
design research groups to learn more about the interactions between physical
attributes and customer‟s/users‟ affective needs. In this way, this thesis can contribute
in giving a theoritical foundation for future applications. It can also be concluded that
Kansei Engineering can increase the quality feeling of products by proposing physical
design attribute solutions.

62
REFERENCES
Alford, B. L. and Sherrell, D. L. (1996). "The Role of Affect in Consumer Satisfaction Judgments of
Credence-Based Services," Journal of Business Research, 37, 1 (September), pp. 71 - 84.
Baumgarten, A. G. (1961). Aesthetica. Hildesheim, Georg Olms Verlagsbuchhandlung.
Berkowitz, L. (2003), Affect, aggression, and antisocial behavior. In R. Davidson, K. Scherer, and H.
Goldsmith (Eds.), Handbook of Affective Sciences (pp. 804-823). New York/Oxford, UK: Oxford
University Press.
Bitner, M.J. (1992). "Servicescape: the impact of physical surroundings on customers and employees",
Journal of Marketing, Vol. 56, pp. 57-71.
Brady, M., Cronin, J. (2001). "Some new thoughts on conceptualizing perceived service quality: a
hierarchical approach", Journal of Marketing, Vol. 65 No.3, pp.34-49.
Buzzell, R. D. and Gale, B. T. (1987). The PIMS Principles: Linking Strategy to Performance, New
York: The Free Press.
Childs, T. H,C., Dalgarno, K.W., Mckay, A. (2006). ―Delivering mass produced bespoke and
appealing products‖, Special Issue on Advanced Manufacturing Technology, JSME International
Journal Series C, Vol. 49 No. 1, pp. 2-10.
Cooper, E. and Kamei K. (2002). ―Small Multiple Ordered Evaluation and Interface Design for
Interactive Surveys‖, Kansei Engineering International, Vol.3 No.4 (012).
Darby, M. and Karni, E. (1973).‖ Free Competition and Optimal Amount of Fraud‖, Journal of Law
and Economics 16: 67-88.
Deming, W. E. (1982). Out of the Crisis: Quality, Productivity and Competitive Position, Cambridge
University Press, New York
Desmet, P.M.A. and Hekkert, P. (2007).‖Framework of product experience‖. International Journal of
Design, 1(1), 13-23.
Encyclopædia Britannica, (1911) Eleventh edition.
Evers Kuijt-L.F.M., Krause F., Vinka P. (2003). ―Aspects to improve cabin comfort of wheel loaders
and excavators according to operators‖, Applied Ergonomics 34, pp. 265–271.
Feigenbaum, A.V. (1951). Total Quality Control, McGraw-Hill, New York, NY.
Freud, S., (1913). On beginning the treatment?, Standard Edition of the Complete Psychological
Works of Sigmund Freud XII. London: Hogarth Press, p. 135.
Fujita, K., Nishikawa, T. (2001). ―Value-Adds Assesment Method for Product Deployment Across
Life Stages Through QFD‖, International Conference on Engineering Design, ICED 01 Glasgow,
Proceedings, pp. 405-412.
Garvin, D. A., (1984). "What Does 'Product Quality' Really Mean?" Sloan Management Review,
(Fall), pp.25-43.

63
Gilmore, H.L. (1974). "Product conformance cost", Quality Progress, Vol. 7 pp.16-19.
Grönroos, C. (1984). ―A service quality model and its marketing implications‖, European Journal of
Marketing, 18(4), pp.36–44.
Grönroos, C. (2000). Service Management and Marketing: A Customer Relationship Management
Approach, 2nd Edition, Wiley.
Han, S., Yun M., Kim K., Kwakh J. (2000). ―Evaluation of product usability: development and
validation of usability dimensions and design elements based on empirical models‖, International
Journal of Industrial Ergonomics 26, pp. 477-488.
Harada, A. (1997). The framework of Kansei Engineering, Report of Modelling the Evaluation
Structure of Kansei, pp 49-55.
Harada, A.(1998). Modelling the Evaluation Structure of Kansei using Network Robot, Report of
Modelling the Evaluation Structure of Kansei, 1998 Conference, pp15-19.
Harada, A. (1998). On the definition of Kansei, Report of Modeling the Evaluation Structure of
Kansei 1998 Conference, Vol.2.
Helander, M. G., and Tham, M. P. (2003). Hedonomics - Affective human factors design.
Ergonomics, 46(13/14), 1269-1272.
Holland, J.H., (1992). Adaptation in natural and artificial systems. (Ann Arbor, MI: Universityof
Michigan Press, 1975).
Hollway, W., Jefferson, T. (2000), Doing Qualitative Research Differently, Free Association,
Narrative and the Interview Method, Sage, London.
Ishikwan, K., (1983). Guide to Quality Control, Tokyo: Asian Productivity Organization.
Japanese Society of Kansei Engineering, www.jske.org.
Jindo,T. and Hirosago, K. (1997). ―Application of Kansei Engineering studies to car interior‖,
Industrial Journal of Industrial Ergonomics, Vol 19 pp:105-114.
Jordan, P. W. (2002). Pleasure with Products: Beyond Usability (edited with William S. Green),
Taylor and Francis.
Kano, N. (2001). ―Life Cycle and Creation of Attractive Quality‖, 4th Quality management and
Organizational Development Conference QMOD Proceedings.
Kano, N., Seraku, N., Takahashi F., Tsuji S. (1984). ―Attractive quality and must-be quality‖, The
Journal of Japanese Society for Quality Control, Vol.14 No:2.
Kang, N. and Yamanaka, T. (2006). ―Kansei Quality of Products‖, Proceedings of KEIS 2006, Aizu
Wakamatsu, Japan.
Kant, Immanuel (2003). Critique of Pure Reason, Dover Publications, USA.
Kapanoglu M and Alikalfa M. (2004) . ―Genetics-based Machine Learning to Job Shop Scheduling‖.
The 4th International Symposium on Intelligent Manufacturing Systems IMS2004; 2004:1048-56.
64
Khalid, H. M and Helander, M.G. (2006). ―Customer Emotional Needs in Product Design‖,
Concurrent Engineering, Vol. 14, pp. 197-206.
Kernberg, O. (2004), Contemporary Controversies in Psychoanalytic Theory, Techniques, and their
Applications, Yale University Press, New Haven, CT.
Kim, H.S, Cho SB. (2000). ―Application of interactive genetic algorithm to fashion design‖. Eng
Applic Artif Intell; Vol. 13(6), pp.635-44.
Koshimizu, H., Masafumi, T., Takayuki, F. (1999) ―On Kansei Facial Image Processing for
Computerized Facial Caricaturing System PICASSO, IEEE, Volume:6, Page(s): 294-299.
Lai, H., Chang, Y.M., Chang, H. (2005). ―A robust design approach for enhancing the quality feeling
of a product:a car profile case study‖, International Journal of Industrial Ergnomics, Vol 35 pp:445-
460.
Lee, S.H., Harada, A., Stappers, P.J. (2002). Pleasure with Product: Beyond Usability, Taylor and
Francis, London, pp.219-220.
Levy, P., (2007). Interdisciplinary Design for the Cyberspace by an approach in Kansei Information—
Methodology and Workgroup Communication Tool Design Approach in Kansei, Doctoral thesis,
University of Tsukuba.
Mehrabian, A. and Russell, J.A. (1974). ―An approach to environmental psychology‖. Cambridge,
MA: The MIT Press.
Miles M.B., Huberman A.M. (1994). Qualitative Data Analysis: A Sourcebook of New Methods.
Newbury Park, CA: Sage.
Mital, A. (2007). Product Development, Elsevier, Butterworth Heinemann.
Nagamachi, M. (1991a). Comfort Science, Kaibundo, Tokyo.
Nagamachi, M. (1995). ―Kansei Engineering: A new ergonomic consumer-oriented technology for
product development‖, International Journal of Industrial Ergonomics, Vol. 15 (1), pp. 311-346.
Nagamachi, M. (1996). ―Kansei engineering and implementation of human-oriented product design‖,
In: Koubek, R.J., Karwowski, W. (Eds.), Manufacturing Agility and Hybrid Automation, IEA Press,
Louisville, KY, pp. 77-80.
Nagamachi, M. (2001). ―Kansei Engineering: A powerful ergonomic technology for product
development‖, in M. G. Helander, H. M. Khalid and M. P. Tham (eds), Proceedings of the
International Conference on Affective Human Factors Design (London: ASEAN Academic Press),
pp.9 – 14.
Nagamachi, M. (2002). ―Kansei engineering as a powerful consumer-oriented technology for product
development‖, Applied Ergonomics, Volume 33, Issue 3, pp. 289-294.
Nagamachi, M., Nishino, T. (1999). ―HousMall: an application of kansei engineering to house design
consultation‖, Proceedings of the International Conference of TQM and Human Factors, pp. 349–354.

65
Nagamachi, M., Okazaki, Y., and Ishikawa, M. (2006). ―Kansei engineering and application of the
rough sets model‖. Proceedings of IMechE 2006, Vol. 220, Part I: Journal of Systems and Control
Engineering, pp.763-768.
Nagamachi. M. (2002). ―Technical note: Kansei engineering as a powerful consumer-oriented
technology for product development‖, Applied Ergonomics, Vol 33, pp. 289–294.
Nagasawa, S. (2004). ―Present state of Kansei engineering in Japan‖, Systems, Man and Cybernetics‖,
IEEE International Conference, Vol. 1, pp. 333-338.
Nagasawa, S. (2006). Customer Experience Management Influencing on Human Kansei to MOT,
Lecture Notes In Computer Science, Springer-Verlag.
Nagata, N., Kamei, M., Akane, M., and Nakajima, H.: ―Development of a Pearl Quality Evaluation
System Based on an Instrumentation of ―Kansei‖,‖ Trans.IEE Japan, Volume:112-C, No:2(1992)
Nakada, N. (1997). ―Kansei engineering research on the design of construction machinery‖,
International Journal of Industrial Ergonomics, Vol 19, pp. 129-146.
Nelson, P. (1970). ―Information and Consumer Behaviour,‖ Journal of Political Economy, Vol. 94, pp.
796-821.
Niedenthal, P. M., Halberstadt, J. B.,Innes-Ker, A. H. (1999). ―Emotional response categorization‖,
Psychological Review, Vol 106, pp. 337-361.
Nishino T., Nagamachi M., Sakawa M., Kato K., Tanakaa, H. (2006). ―Comparative Study on
Approximations of Decision Class and Rule Acquisition by Rough Sets Model‖, Kansei Engineering
International, Vol.5 No.4 (020).
Nishino, T., Nagamachi, M., and Ishihara, S. (2001). ―Rough set analysis on Kansei evaluation of
colour‖. Proceedings of The International Conference on Affective Human Factors Design, pp.109-
115. Singapore.
Nishino, T., Nagamachi, M., and Tanaka, H. (2006). ―Variable precision bayesian rough set model and
its application to Kansei Engineering‖. In J.F. Peters, and A. Skowron, Transactions on Rough Sets V,
LNCS ,Vol. 4100, pp.190-206. Berlin: Springer-Verlag.
Oliver, R.L.,(1993). ―A Conceptual Model of Service Quality and Service Satisfaction‖, in T.A.
Swartz, D.E. Bowen, and S.W. Brown (Ed.), Advances in Services Marketing and Management
Research and Practice, JAI Press, Greenwich, CT, Vol. 2, pp. 65–68.
Oppenheimer, A. (2005). ―From Experience: Products Talking to People—Conversation Closes the
Gap between Products and Consumers‖, Journal of Product Innovation Management ,Vol 22 (1) , pp.
82–91.
Osgood, C. E., Suci, G. J., and Tannenbaum, P. H. (1957). The Measurement of Meaning,
Champagne, IL: University of Illinois Press.
Osgood, C.E. (1952). ―The Nature and Measurement of Meaning‖, Psychological Bulletin, IL:
University of Illinois Press.

66
Parasuraman, V., Zeithaml, A. and Berry, L.L. SERVQUAL: (1988). ―A multiple-item scale for
measuring consumer perceptions of service quality‖, Journal of Retailing 64 (Spring), pp. 12–37.
Parker, I. (2004), Qualitative Psychology, McGrawHill Education, Berkshire.
Pawlak, Z. (1992). Rough Sets: Theoretical Aspects of Reasoning about Data, Kluwer Academic
Publishers.
Pham, Michel Tuan (1998). "Representatives, Relevance, and the Use of Feelings in Decision
Making," Journal of Consumer Research, Vol 25 (2), pp.144-58.
Russell, J. A., (2003). ―Core Affect and the Psychological Construction of Psychological Review‖,
American Psychological Association, Inc. Vol. 110, No. 1, pp.145–172.
Russell, J. A., Ward, L. M., Pratt, G.A. (1981). ―Affective Quality Attributed to Environments - A
Factor Analysis Study," Environment and Behaviour, Vol. 13, pp.259-288.
Russell, J., Barrett, A.; Feldman, L., (1999). ―Core affect, prototypical emotional episodes, and other
things called emotion: Dissecting the elephant‖. Journal of Personality and Social Psychology. 1999
May Vol .76(5), pp. 805-819.
Samal, A.: ―Automatic Recognition and Analysis of Human faces and Facial Expressions: A survey‖,
Pattern Recognition, Volume: 25 , Page(s): 65-77(1992)
Scherer, K R. (2003). Introduction: Cognitive components of emotion. In R. J. Davidson, H.
Goldsmith, K. R. Scherer (Eds.). Handbook of the Affective Sciences , New York and Oxford: Oxford
University Press pp. 563-571.
Schmitt, B. H. (2003). Customer Experience Management. New York: John Wiley.
Schütte, S. (2005). Engineering emotional values in product design- Kansei Engineering in
development. Institute of Technology. Linköping, Linköping University. 2005-01-1072.
Schütte, S., Eklund, J., Axelsson, J.R.C., Nagamachi, M., (2004). ―Concepts, methods and tools in
Kansei Engineering‖, Theoretical Issues in Ergonomics Science, Vol.5, 3, pp. 214-232.
Schwarz, N, and Gerald L. Clore ( 1983). "Mood, Misattribution, and Judgments of Well-Being:
Informative and Directive Functions of Affective States," Journal of Personality and Social
Psychology, 45 (September), pp. 513-523.
Schwarz, N, and Gerald L. Clore (1988). "How Do I Feel about It? The Informative Function of
Affective States," in Affect, Cognition, and Social Behavior, ed. Klaus Fiedler and Joseph Forgas,
Toronto: Hogrefe, pp.44-62.
Shiizuka, H. and Watada, J. (2006). ―Overview of the Kansei system‖, IMechE Proc. IMechE Vol.
220 Part I: J. Systems and Control Engineering.
SPSS Inc. (2006). SPSS Base 15.0 for Windows User's Guide. SPSS Inc., Chicago IL.

67
Sung-Bae, C., Lee, J-Y. (2002). A Human-Oriented Image Retreval System Using, IEEE Multimedia,
9(2): 52-60.
Toriwaki, J. (1996) ―Overview Medical Vision-New Development of Medical Image Processing in
Multimedia Environment-J.ITE, Volume: 50, Page(s):1431-1434.
Tsuchiya, T., Ishihara, S., Matsubara, Y., Nagamachi, M., (1999). ―A Method for Learning Decision
Tree and Its Application for Design of Canned Coffee‖, Proceedings of the International Conference
on TQM and Human Factors, I-385/390.
Tsuchiya, T., Ishihara, S., Matsubara, Y., Nagamachi, M.,(2002). ―Evaluation of Food Advertisement
in Terms of Genetic Algorithm‖, Proceedings of HCI International 2001, Vol.2, pp.325-328.
Urban, G.L., Hauser, J.R., Nikhilesh, D. (2003). Essentials of New Product Management, Prentice
Hall, New Jersey.
Watson, D., Hubbard, B., Wiese, D. (2000). ―General Traits of Personality and Affectivity as
Predictors of Satisfaction in Intimate Relationships: Evidence from Self- and Partner-Ratings‖, Journal
of Personality, Vol. 68 No. 3, pp. 413–449.
Wickelgren, M., (2005). Engineering Emotion. Values as Means in Product Development, Göteborg,
Bokförlaget BAS.
Wilson, J.R. and Corlett, E.N. (1995). (eds) Evaluation of Human Work: a practical ergonomics
methodology, 2nd ed., Taylor & Francis.
Wyer, R. S., Carlston, D. E., (1979). Social Cognition, Injuence, and Attribution, Hillsdale, NJ:
Erlbaum.
Yanagisawa, H., Fukuda, S., (2003). Interactive Design Support System by Customer Evaluation and
Genetic Evolution: Application to Eye Glass Frame. KES 2003: pp.481-487.
Yun, M. H., Han, S. H., Ryu, T. and Yoo, K. (2001). Determination of critical design variables based
on the characteristics of product image/impression: case study of office chair design, Proceedings of
the Human Factors and Ergonomics Society 45 th Annual Meeting (Santa Monica, CA: Human
Factors and Ergonomics Society), pp.712 – 716.
Yokoi, K. and Shimizu, Y. (2005). ―Kansei study for landscape‖, Kansei Engineering International,
Vol.6, No.1, pp.45-50.
Zane, Z., Yang, S., Raman, V., Deren, M., (2005). ―Virtual Tests for Facilitating Steering Wheel
Development‖, SAE International, Delphi Corporation.
Zeithaml, Valarie A., A. Parasuraman, and Leonard L. Berry (1990). Delivering Quality Service, New
York: The Free Press.
Zeithaml, V.A., Bitner, M.J. (2003). Services Marketing, McGraw Hill, Singapore.

68
APPENDIX I: Suggestions for further improvements of the reach truck
According to qualitative responses the design attributes and the possible design improvements
were discussed below for design of reach truck in general and specific improvements and the
quality perceptions of cabin components. The pictures of the study object and the interior
cabin components that were shown in Figure A.1.
In general design of the interior cabin looks traditional. Reducing the industrial feel and
designing like the interior of a car can give the feeling of fun to drive. Angular and round
design is used in the cabin. Round design is preferred by most of the participants and softly
rounded forms are desired. Designs of the components need to be proportional to give a
more heavy feeling. In the other hand pedals and driver seat can be designed more suitable
for human body. Spacious design is required in general. Steering wheel can be designed more
stable and robust. Some parts of it‟s material can be changed with metal to give more robust
feeling. Besides for the left handed people an arm rest place while using steering wheel is
needed. The electronic hydraulic controls can have better shape and design; they have the
same design for each direction and in order to give a more robust feeling they can be replaced
with a joystick. Driver’s seat was found hard to adjust. It can be adjusted with an electronic
mechanism. Material of the seat was found nice to touch however makes the person feel like
it is absorbing all the dust. In order to create a seat back sink depth that looks deep or to use
new materials which will not easily become dirty or which are easy to clean to not lose the
“Kansei” feeling of soft/gentle/comfortable is suggested by Nakada (1997). The pedals are not
in the same shape and size which are perceived to give low quality feeling. Besides less plastic
sounds are expected from the pedals. Furthermore they can be designed to give more
feedback when they are used. The control console was found hard to adjust. Material of the
control console is too plastic and too light which gives a feeling of toy. The adjustment of
control console can be changed according to clock direction to remove when getting out of
the truck.The layout of the dashboard seems almost too simple and of less quality. Improving
dashboard layout and controls can show them more powerful. Besides it is observed difficult
to reach the dashboard through control console. The display on the dashboard is difficult to
see through control console, its position can be changed to another part of the dashboard to
make it easier to see. Nicer material can be used for the dashboard. Buttons look old and give
loose feeling. Buttons can be designed with lights showing that they are “on”. Designs of the
buttons are varied and consistent design can be better to give better quality feeling. Less
“plastic” sounds from the controls and buttons are preferred. They can be designed with more
signs and symbols to give information about the functions of the buttons. Design is too plastic

69
for the buttons. Colour changes to some buttons can make them easier to recognize and differ
between them. Less buttons are preferred also some buttons can be designed with
multifunction. Moreover they can be designed bigger to give more reliable feeling. Emergency
button is perceived as far and not easily accessible for emergency case. It can be placed on the
control console. For improvement of the interior cabin unexpected attractive quality features
can be added to delight the drivers. For example; some controls can be placed on steering
wheel.
Steering wheel Hydraulic controls Operator‟s seat
Pedals Control console Dashboard
verhead guard Interior cabin surfaces The study object reach truck
Figure A.1 Study object reach truck and it‟s components in Paper A.

70
APPENDIX 2: Quality feeling questionnaire (Paper A- Part 2)
SURNAME-NAME:
1- How do you rate your quality feeling of these components in the reach truck cabin?
Steering Wheel None Excellent
Electronic Hyd.Controls None Excellent
Driver’s seat None Excellent
Truck’s pedals None Excellent
Control Console None Excellent
Dashboard None Excellent
Overhead guard None Excellent
Interior Cabin Surfaces None Excellent
2- Please rate your Total quality feeling about the interior cabin?
a-) None Excellent
b-) Please explain which aspects about the components affected your quality feeling?
Design:
Size:
Shape :
Color :
Look :
Style:
Material/Texture:
Layout:
Information:
3. How can the quality feeling be improved in the interior cabin of the fork-lift truck?
Thank you!

71
APPENDIX 3: Quality feeling-questionnaire (Paper C)
1. What would you like to do while you are waiting?
.......................................................................................................................................................
.......................................................................................................................................................
.....................................................................................................................................................
2. Which things are important for you while waiting?
.......................................................................................................................................................
.......................................................................................................................................................
.......................................................................................................................................................
3. What would you like to have while you wait?
.......................................................................................................................................................
.......................................................................................................................................................
.......................................................................................................................................................
4. What would you dislike while you wait in the waiting area?
.......................................................................................................................................................
.......................................................................................................................................................
.......................................................................................................................................................
5. How do you feel in the waiting area?
.......................................................................................................................................................
.......................................................................................................................................................
.......................................................................................................................................................

72
6. What important feelings would you like to get from a waiting area?
.......................................................................................................................................................
.......................................................................................................................................................
7. Try to think how do you relate your important feelings to design features in a waiting area?
.......................................................................................................................................................
.......................................................................................................................................................
Feeling Design
Parameter 1
Design
Parameter 2
Design
Parameter 3

73
8. Can you describe how does your dream waiting room look like?
.......................................................................................................................................................
.......................................................................................................................................................
.......................................................................................................................................................
Feeling Design
Parameter 1
Design
Parameter 2
Design
Parameter 3
Comments..................................................................................................................................................................
.......................................................................................................................................................... ...........................
.....................................................................................................................................................................................
......................................................
Demografic Information
Gender: M
K
How old are you? ........
