energy-water-climate change risk analysis w estern e lectricity c oordinating c ouncil
TRANSCRIPT

W E S T E R N E L E C T R I C I T Y C O O R D I N A T I N G C OU N C I L
Energy-Water-Climate ChangeRisk Analysis

2
W E S T E R N E L E C T R I C I T Y C O O R D I N A T I N G C OU N C I L
Presentation Topics
• A few words about climate change and uncertainty
• Overview of risks to reliability of:– Transmission, Generation (and Production &
Transportation)– Mediating influence of Demand impacts– Consideration of energy-climate-water-land nexus
• A few strategic considerations

3
W E S T E R N E L E C T R I C I T Y C O O R D I N A T I N G C OU N C I L
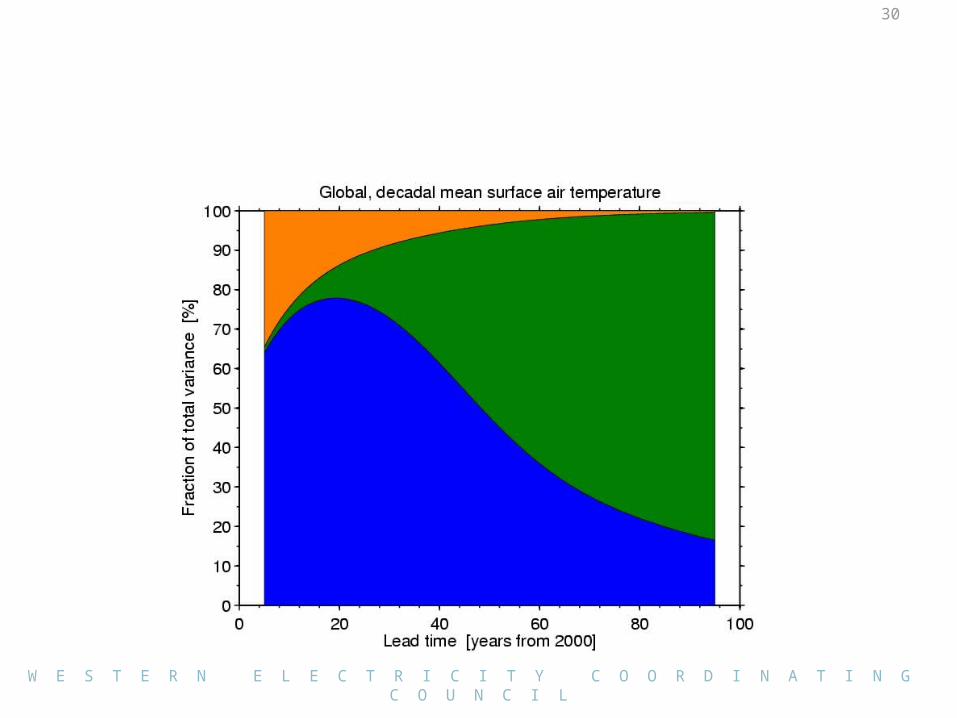
No statistically significant difference in
change between scenarios within next
20 years.
Note: Currently observed warming is tracking near the upper range.

4
W E S T E R N E L E C T R I C I T Y C O O R D I N A T I N G C OU N C I L

5
W E S T E R N E L E C T R I C I T Y C O O R D I N A T I N G C OU N C I L
Future Temperature ChangeLow Emissions Scenario (RCP 2.6) High Emissions Scenario (RCP 8.5)
Annual Avg (2071-2099) Annual Avg (2071-2099)
Warmest Day (2081-2100)
Warmest Day (2081-2100)

6
W E S T E R N E L E C T R I C I T Y C O O R D I N A T I N G C OU N C I L
Future Precipitation Change
Summer Average(High Emissions, 2071-2099)
Winter Average(High Emissions, 2071-2099)
20-Year Storm Recurrence(High Emissions, 2081-2100)

7
W E S T E R N E L E C T R I C I T Y C O O R D I N A T I N G C OU N C I L

8
W E S T E R N E L E C T R I C I T Y C O O R D I N A T I N G C OU N C I L
A few words initial words about uncertainty
• Engineering standards generally don’t reflect the fact that climate is changing. i.e., they don’t reflect the full uncertainty• E.g., NOAA Atlas 14, Precipitation-Frequency Atlas of the United States
• Temperature change more certain than hydrologic change; large-scale change more certain than small-scale change
• The resolution of the climate information sometimes belies the deep uncertainty underlying it.– E.g., the sign of precipitation change is not known with certainty for much of the United
States, even if we were able to perfectly predict future greenhouse gas levels

9
W E S T E R N E L E C T R I C I T Y C O O R D I N A T I N G C OU N C I L
A few words initial words about uncertainty (cont.)
• There is significant additional uncertainty in:– Translating climate drivers into impacts on electricity system assets– Accounting for interacting effects of electricity system impacts– Accounting for indirect effects via changes in hydrology and land cover (i.e., the energy-
water-land-climate nexus)
• The scientific community generally does not assign probabilities to emission scenarios.– However, it is, in some cases, possible to assign probabilities to impacts, given a
particular climate change.
• Nonetheless, it is possible to make improved decisions in the face of this uncertainty. Keys include:– Characterizing the uncertainties as fully as possible– Adopt a Robust Decision Making approach (more on that later)– Identify metrics and indicators that can be used, over time, to indicate which path one is
on

10
W E S T E R N E L E C T R I C I T Y C O O R D I N A T I N G C OU N C I L
Risks to Transmission
• Higher temperatures reduce transmission capacity– 9 oF warming decreases transmission line capacity 7-8%– Exacerbated by high nighttime temperatures (and low wind)– See, e.g., IEEE 738 2006 Standard For Calculating the Current ‐
Temperature of Bare Overhead Conductors• Higher temperatures diminish transformer and substation
capacity– Decreased transformer capacity of approximately 0.7% for each
1°C of higher ambient temperature– E.g., 2-4% diminishment by end-of-century in CA under high
emissions scenario• Higher temperatures increase line sag– Small increase in line length can have dramatic effect on sag– Outage potential from line contact
Temperature Threats to Transmission Reliability

11
Risks to TransmissionTemperature Threats to Transmission Reliability (cont.)• Higher load, driven by increase in demand, will increase
T&D losses– average system losses increase about 1.5% per 1% increase in
load– E.g., 1-3% increase in T&D losses by end-of-century under high
demand scenario in CA• Higher temperatures impair transformer performance (above
30 C)– E.g., substations in CA could lose 0.7-0.8% of capacity in the
2005-2034 period•Temperature extremes may accelerate transformer aging• High temperatures may jeopardize infrastructure operation
and maintenance activities through labor restrictions
Peak Load/Capita vs. Temperature
Sathaye et al. (2013)
By the end of the century, the electrical grid may need to carry more than 20% more peak power per capita than it does today (CA estimated at 23.7%). It will need to do so in the face ‐of a decrease in the capacity of fully loaded transmission lines (CA estimated at 7.5%). This ‐does not account for changes in population and energy efficiency.

12
W E S T E R N E L E C T R I C I T Y C O O R D I N A T I N G C OU N C I L
Risks to TransmissionCase Study of Temperature Threats to Reliability
Example: July 2006 heat wave in California
• Over 80,000 customers in the LA DWP service territory lost power for days as 860 distribution line transformers malfunctioned or stopped working
• 1.2 million PG&E customers lost power 1,150 distribution line transformers failed. High loads heated transformers and warmer-than-normal air failed to cool them, tripping circuit breakers, braking fuses, and burning insulation, causing short circuits inside transformers.

13
Risks to TransmissionSea Level Rise & Storm Surge Threats to T&D Infrastructure• Increases in storm surge and waves could increase scouring of transmission tower bases. • Increases in sea level rise and/or storm surge could lead to increased corrosion of
electrical components and shorting, particularly buried lines
Substations exposed to a “100-year” flood with a 1.4m Sea Level Rise

14
W E S T E R N E L E C T R I C I T Y C O O R D I N A T I N G C OU N C I L
Risks to TransmissionStorm and Wildfire Threats to T&D Infrastructure• Increases in precipitation intensity could scour transmission tower bases• An increase in occurrence or intensity of high winds (highly speculative) could increase
damage, particularly through tree-on-line damage• Increases in lightning strikes can damage lines and distribution poles; they can also lead
to fires that cause indirect damage– New paper indicates ~50% increase in U.S. lightning strikes this century
• Increases in wildfires threaten transmission and distribution lines. Causes include potential for increase in number of dry days, drought (particularly in SW), and fuel loading (e.g., Pine Bark Beetle).– Direct fire damage (particularly wood distribution line poles)– Soot accumulation on insulators can cause leakage– Ionized air and smoke can act as a conductor, causing arcing between lines– Fire retardants can also affect operations
• Combinations of changes in precipitation and wildfire could increase landslide risk to T&D infrastructure

15
W E S T E R N E L E C T R I C I T Y C O O R D I N A T I N G C OU N C I L
Wildfire ImpactsEnd-of-Century Probability that a Wildfire Affects a Line
For three different climate models and a low (B1) and high (A2) greenhouse gas emission scenario.
From Sathaye et al (2012). Uses Westerling et al (2009) fire model.
Exposure potential greatest in areas with high fuel loading and drying.

16
Risks to GenerationAir Temperature Effects on Combustion Generation• Three reasons why air temperature influences capacity and efficiency of a natural gas
turbine:1. Hot air is less dense, so the air mass in the turbine at higher temperatures is lower for a given
volume intake.2. Ambient temperature influences air’s specific volume, which influences the compression
work and the power consumed by the compressor.3. Pressure ratio within the turbine is reduced at higher temperatures, consequently reducing
mass flow.• Power plant capacity reductions:
– Combined cycle: ~0.3–0.7% per degree change‐– Simple cycle: ~1.0% per degree change
• ~90% of expected growth in per capita peak demand will come from temperature‐ ‐induced cooling demand, and 10% from temperature induced generation loss‐– Does not account for transmission losses– By end of century, CA may require more than a 30% increase in per capita peak capacity

17
W E S T E R N E L E C T R I C I T Y C O O R D I N A T I N G C OU N C I L
Risks to GenerationHydrologic Effects on Generation
• Increases in drought conditions (particularly in the SW) may threaten reliability due to insufficient supply of cooling water– Drought conditions often exacerbated by
high temperature.• Warmer intake temperatures will reduce
thermal gradient, thus generation efficiency.– However, temperature effects are less on
wet-cooled power plants than air-cooled

18
W E S T E R N E L E C T R I C I T Y C O O R D I N A T I N G C OU N C I L
Risks to GenerationHydrologic Effects on Generation
• Regulatory thermal limits more likely to be reached in the future, e.g.:– 40 CFR Part 423 – Steam Electric Power Generating Point Source Category
Provides guidelines for effluent limitations, based on best available technology and flow and concentration1
– Colorado Water Quality Division – Permit for Discharges of Cooling WaterTemperature limitations for effluent water are based on classification of the receiving stream as aquatic life warm or cold ; determined on a case-by-case basis.2
– California Thermal Plan3
Cold Interstate Waters: elevated discharges are prohibitedWarm Interstate Waters: discharges shall not cause temperatures to increase more than 5 degrees above natural temperature

19
W E S T E R N E L E C T R I C I T Y C O O R D I N A T I N G C OU N C I L
Risks to GenerationSea Level Rise and Storm Effects on Generation
W E S T E R N E L E C T R I C I T Y C O O R D I N A T I N G C O U N C I L
• Sea level rise and increases in storm surge and waves could: (a) cause direct physical damage to power plants; (b) increase erosion damage to buildings and access roads; (c) increase salt water exposure, leading to increased corrosion of electrical components and shorting
Electricity Facilities Less thanFour Feet above Local High Tide
Power Plants at Risk from Combined Effects of SLR and “100-Year” Storm

20
W E S T E R N E L E C T R I C I T Y C O O R D I N A T I N G C OU N C I L
Risks to GenerationA Case Study of Risks to Thermoelectric Reliability
During the summers of 2007 and 2008, the Laramie River Station, a coal-fired power plant in Wheatland, WY, risked running out of cooling water because of drought. To avert a production cutback or shutdown, operators drew on water sources typically used for irrigation.

21
Risks to Generation
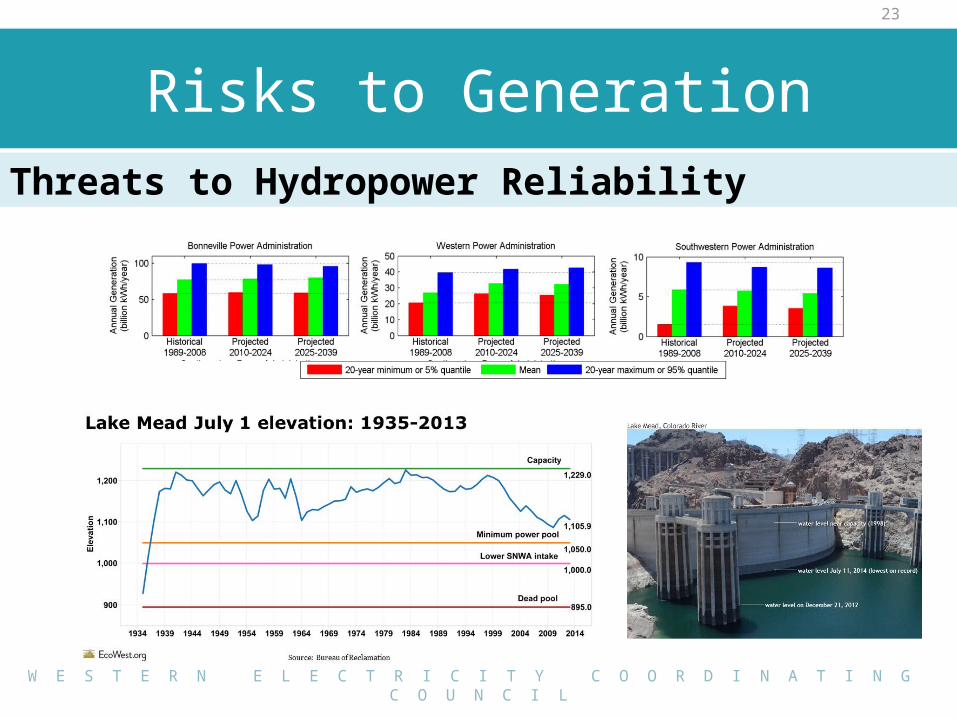
• Reductions in water available for generation due to:– Reductions in annual runoff particularly in SW
o …but, increases in parts of the PNW (generation increase may not be realized if the short-term runoff exceeds hydraulic capacity of reservoir systems; dumping)
o Y2Y variability can be huge. E.g., For BPA in 2010, low streamflows resulted in $104M gross increase in purchased power and net loss of $233M from prior year
– Earlier spring runoff pulse reduces reliability in meeting summer demand spike for run-of-river generation (snow-fed basins)
– Increases in reservoir evaporation– Increases in water demand:
o Climate factors: Higher temperatures increase ag. and municipal demand
o Non-climate factors: e.g., fracking, pop. Growth– Note mitigating role of improvements in water use efficiency
Threats to Hydropower Reliability
22
W E S T E R N E L E C T R I C I T Y C O O R D I N A T I N G C OU N C I L
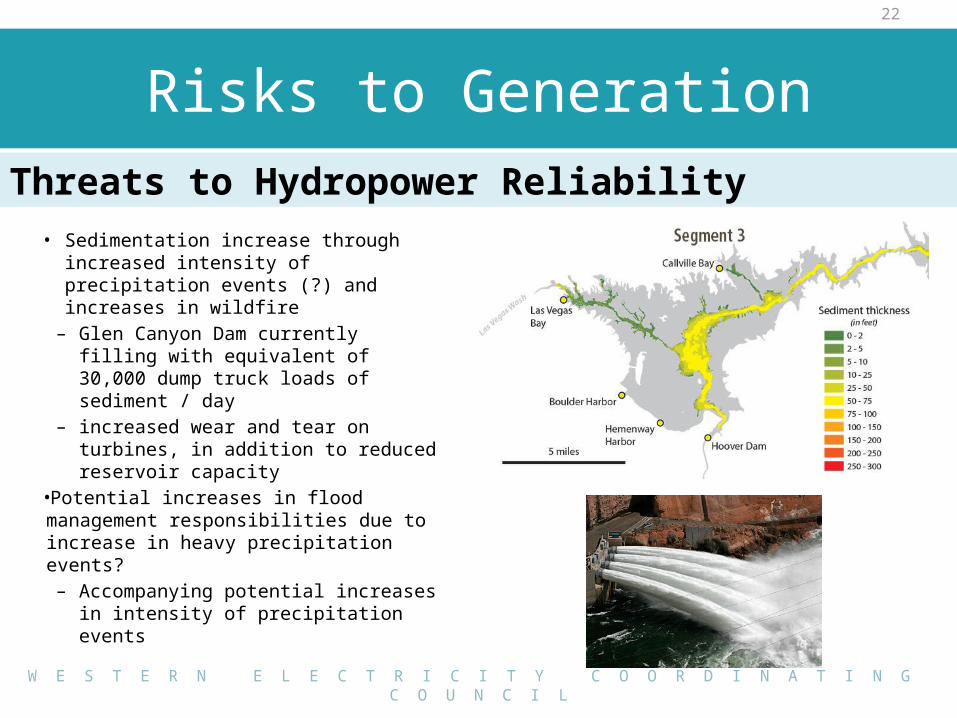
Risks to GenerationThreats to Hydropower Reliability• Sedimentation increase through
increased intensity of precipitation events (?) and increases in wildfire– Glen Canyon Dam currently filling
with equivalent of 30,000 dump truck loads of sediment / day
– increased wear and tear on turbines, in addition to reduced reservoir capacity
•Potential increases in flood management responsibilities due to increase in heavy precipitation events?– Accompanying potential increases
in intensity of precipitation events
23
W E S T E R N E L E C T R I C I T Y C O O R D I N A T I N G C OU N C I L
Risks to GenerationThreats to Hydropower Reliability

24
Risks to GenerationThreats to Reliability of Other Renewables
Wind PowerChanges in Wind Speed, Pattern, Duration:
Highly uncertain in WECC region• Directly impact generation• Variability impacts grid reliability• Energy content of wind is proportional to the wind speed to the power of 3
(with upper and lower limits)• 1°C rise in temperature lowers air density and power by approximately 0.33% • Even if average annual wind speeds remain unaltered, a change in diurnal wind
pattern can affect daily wind power production, significantly improving—or reducing—the match between wind energy input to the grid and daily load demands.
• Offshore wind affected by changes in wind loading and sea wave loading• Sea level rise could damage turbine foundations in low-lying coastal areas.

25
Risks to GenerationThreats to Reliability of Other RenewablesSolar Power PVChanges in cloud cover:
Highly uncertain in WECC region• Increase lowers efficiency/output• Rapid fluctuations in cloud cover can destabilize grid; solar photovoltaic panel output
can decrease/increase by 40%–80% within a few seconds• Infrastructure at risk from storms
Temperature increases lower cell efficiency and energy output • For 25 C rated solar cells, output typically decreases by about 0.25% (amorphous cells)
to 0.5% (most crystalline cells) for each temperature rise of 1 C. Cell temperatures can easily reach > 50.C (output can be 12% below rated output)
Concentrated solar power (CSP) systems can require a large amount of water for coolingand may not be feasible in water constrained areas with projected decreases in water availability (dry cooling systems don’t have the same constraint, but are less efficient)

26
W E S T E R N E L E C T R I C I T Y C O O R D I N A T I N G C OU N C I L
Risks to Generation
Balancing Hydro-Wind in the Pacific Northwest• BPA manages the bulk of transmission balancing
services in the Pacific Northwest • > 4 GW of wind capacity recently added to BPA • Spring 2011: low energy demand
(heating/cooling), high winds and water flow = excess power – BPA curtailed wind generation to meet
environmental regulations, maximized hydro/min dissolved gas levels
– Cost of wind curtailment was borne by wind operators and purchasers.
Case Study of Reliability Risks to Other Renewables

27
W E S T E R N E L E C T R I C I T Y C O O R D I N A T I N G C OU N C I L
Demand-side Drivers of Risks to Reliability
Temperature Increase • Net demand for electricity will increase (cooling > heating)• Net increase in US energy expenditures of 10 to 22% would result if average
annual temperatures were to rise by 4.5°F and 9°F warming • Increased water demands for biofuel production
Reduced Water Availability• Increased demand for energy for irrigation, municipal and waste water
pumping • Increased competing water demands (i.e., domestic, agricultural)
Extreme Events• Extremes increase the peak demand to cool and heat buildings. • Warming on a seasonal scale, such as a hot summer, has a different impact
on generation and reliability than a two-day heat wave• In California, peak energy demand is projected to increase between 10 and
20 percent by the end of the century due to an increase in heat waves

28
W E S T E R N E L E C T R I C I T Y C O O R D I N A T I N G C OU N C I L
Production and TransportationRisks to Reliability
• Drought constraints on coal processing• Flooding effects on road and rail transport of fuels• Drought / low river level constraints on coal shipment• Water constraints on hydraulic fracturing for natural gas extraction

29
W E S T E R N E L E C T R I C I T Y C O O R D I N A T I N G C OU N C I L
Additional Information Needs• Consistent WECC-wide analysis of exposure of transmission and generation assets to
all weather and climate hazards, including temperature extremes, river flooding, drought, sea level rise and storm surge, high wind, lightning strikes, wildfire, and icing
• WECC-wide inventory of risk mitigation infrastructure already installed, including cooling equipment and flood protection
• Quantitative, WECC-wide analysis of potential impacts, using the aforementioned information
• Cost analysis of: (a) climate change impacts and (b) the range of risk mitigation measures
• Ongoing knowledge development through focused monitoring and measurement activities: Efforts to increase knowledge of the system (e.g., utility, grid) in light of climate change, such as investments in weather and hydrologic monitoring, and impacts data, can provide critical information to decision makers given the uncertainty surrounding future climate variability and change.
30
W E S T E R N E L E C T R I C I T Y C O O R D I N A T I N G C OU N C I L