energy uplift (operating...
TRANSCRIPT

Section 4 Energy Uplift
2016 Quarterly State of the Market Report for PJM: January through March 155© 2016 Monitoring Analytics, LLC
Energy Uplift (Operating Reserves)Energy uplift is paid to market participants under specified conditions in order to ensure that resources are not required to operate for the PJM system at a loss.1 Referred to in PJM as operating reserve credits, lost opportunity cost credits, reactive services credits, synchronous condensing credits or black start services credits, these payments are intended to be one of the incentives to generation owners to offer their energy to the PJM energy market for dispatch based on incremental offer curves and to operate their units at the direction of PJM dispatchers. These credits are paid by PJM market participants as operating reserve charges, reactive services charges, synchronous condensing charges or black start services charges.
In PJM all energy payments to demand response resources are also uplift payments. The energy payments to these resources are not part of the supply and demand balance, they are not paid by LMP revenues and therefore the energy payments to demand response resources have to be paid as out of market uplift. The energy payments to economic DR are funded by real-time load and real-time exports. The energy payments to emergency DR are funded by participants with net energy purchases in the Real-Time Energy Market.
OverviewEnergy Uplift Results• Energy Uplift Charges. Total energy uplift charges decreased by $147.3
million, or 79.0 percent, in the first three months of 2016 compared to the first three months of 2015, from $186.4 million to $39.1 million.
• Energy Uplift Charges Categories. The decrease of $147.3 million in the first three months of 2016 is comprised of a $33.9 million decrease in day-ahead operating reserve charges, a $102.7 million decrease in balancing operating reserve charges, a $6.0 million decrease in reactive services charges, a $0.0 million decrease in synchronous condensing charges and a $4.7 million decrease in black start services charges.
1 Loss is defined as gross energy and ancillary services market revenues less than total energy offer, which are startup, no load and incremental offers.
• Average Effective Operating Reserve Rates in the Eastern Region. Day-ahead load paid $0.105 per MWh, real-time load paid $0.031 per MWh, a DEC paid $0.483 per MWh and an INC and any load, generation or interchange transaction deviation paid $0.378 per MWh.
• Average Effective Operating Reserve Rates in the Western Region. Day-ahead load paid $0.105 per MWh, real-time load paid $0.031 per MWh, a DEC paid $0.355 per MWh and an INC and any load, generation or interchange transaction deviation paid $0.250 per MWh.
• Reactive Services Rates. The DPL, PENELEC and AEP control zones had the three highest local voltage support rates: $0.049, $0.002 and $0.000 per MWh. The reactive transfer interface support rate averaged $0.0000 per MWh.
Characteristics of Credits• Types of units. Combined cycles received 15.1 percent of all day-ahead
generator credits and 24.0 percent of all balancing generator credits. Combustion turbines and diesels received 89.3 percent of the lost opportunity cost credits. Coal units received 0.0 percent of all reactive services credits.
• Concentration of Energy Uplift Credits. The top 10 units receiving energy uplift credits received 54.0 percent of all credits. The top 10 organizations received 86.9 percent of all credits. Concentration indexes for energy uplift categories classify them as highly concentrated. Day-ahead operating reserves HHI was 5397, balancing operating reserves HHI was 4165, and lost opportunity cost HHI was 5101.
• Economic and Noneconomic Generation. In the first three months of 2016, 88.1 percent of the day-ahead generation eligible for operating reserve credits was economic and 74.0 percent of the real-time generation eligible for operating reserve credits was economic.
• Day-Ahead Unit Commitment for Reliability. In the first three months of 2016, 3.1 percent of the total day-ahead generation MWh was scheduled as must run by PJM, of which 39.9 percent received energy uplift payments.
2016 Quarterly State of the Market Report for PJM: January through March
156 Section 4 Energy Uplift © 2016 Monitoring Analytics, LLC
Geography of Charges and Credits• In the first three months of 2016, 91.2 percent of all uplift charges allocated
regionally (day-ahead operating reserves and balancing operating reserves) were paid by transactions at control zones or buses within a control zone, demand and generation, 4.1 percent by transactions at hubs and aggregates and 4.7 percent by interchange transactions at interfaces.
• Generators in the Eastern Region received 70.3 percent of all balancing generator credits, including lost opportunity cost and canceled resources credits.
• Generators in the Western Region received 29.3 percent of all balancing generator credits, including lost opportunity cost and canceled resources credits.
• External generators received 0.4 percent of all balancing generator credits, including lost opportunity cost and canceled resources credits.
Energy Uplift Issues• Lost Opportunity Cost Credits. In the first three months of 2016, lost
opportunity cost credits decreased by $42.0 million compared to the first three months of 2015. In the first three months of 2016, resources in the top three control zones receiving lost opportunity cost credits, AEP, Dominion and ComEd, accounted for 64.7 percent of all lost opportunity cost credits, 50.1 percent of all day-ahead generation from pool-scheduled combustion turbines and diesels, 46.5 percent of all day-ahead generation not committed in real time by PJM from those unit types and 58.3 percent of all day-ahead generation not committed in real time by PJM and receiving lost opportunity cost credits from those unit types.
• Con Edison – PJM Transmission Service Agreements Support. Certain units located near the boundary between New Jersey and New York City have been operated to support the transmission service agreements between Con Ed and PJM, formerly known as the Con Ed – PSEG Wheeling Contracts. These units are often run out of merit and received substantial operating reserves credits.
Energy Uplift Recommendations• Impact of Quantifiable Recommendations. The impact of implementing
the recommendations related to energy uplift proposed by the MMU on the rates paid by participants would be significant. For example, in the first three months of 2016, the average rate paid by a DEC in the Eastern Region would have been $0.043 per MWh under the MMU proposal, which is $0.440 per MWh, or 91.2 percent, lower than the actual average rate paid.
RecommendationsThe MMU recognizes that many of the issues addressed in the recommendations are being discussed in PJM stakeholder processes. Until new rules are in place, the MMU’s recommendations and the reported status of those recommendations are based on the existing market rules.
• The MMU recommends that PJM not use closed loop interface constraints to artificially override the nodal prices that are based on fundamental LMP logic in order to: accommodate rather than resolve the inadequacies of the demand side resource capacity product; address the inability of the power flow model to incorporate the need for reactive power; accommodate rather than resolve the flaws in PJM’s approach to scarcity pricing; or for any other reason. (Priority: Medium. First reported 2013. Status: Not adopted.)
• The MMU recommends that PJM not use price setting logic to artificially override the nodal prices that are based on fundamental LMP logic in order to reduce uplift. (Priority: Medium. First reported 2015. Status: Not adopted.)
• The MMU recommends that PJM initiate an analysis of the reasons why some combustion turbines and diesels scheduled in the Day-Ahead Energy Market are not called in real time when they are economic. (Priority: Medium. First Reported 2012. Status: Not adopted.)
• The MMU recommends that PJM clearly identify and classify all reasons for incurring operating reserves in the Day-Ahead and the Real-Time Energy Markets and the associated operating reserve charges in order for
Section 4 Energy Uplift
2016 Quarterly State of the Market Report for PJM: January through March 157© 2016 Monitoring Analytics, LLC
all market participants to be made aware of the reasons for these costs and to help ensure a long term solution to the issue of how to allocate the costs of operating reserves. (Priority: Medium. First reported 2011. Status: Adopted 2014.)
• The MMU recommends that PJM revise the current operating reserve confidentiality rules in order to allow the disclosure of complete information about the level of operating reserve charges by unit and the detailed reasons for the level of operating reserve credits by unit in the PJM region. (Priority: High. First reported 2013. Status: Partially adopted.)
• The MMU recommends the elimination of the day-ahead operating reserve category to ensure that units receive an energy uplift payment based on their real-time output and not their day-ahead scheduled output. (Priority: Medium. First reported 2013. Status: Not adopted. Stakeholder process.)
• The MMU recommends reincorporating the use of net regulation revenues as an offset in the calculation of balancing operating reserve credits. (Priority: Medium. First reported 2009. Status: Not adopted. Stakeholder process.)
• The MMU recommends not compensating self-scheduled units for their startup cost when the units are scheduled by PJM to start before the self-scheduled hours. (Priority: Low. First reported 2013. Status: Not adopted. Stakeholder process.)
• The MMU recommends seven modifications to the energy lost opportunity cost calculations:
— The MMU recommends that the lost opportunity cost in the energy market be calculated using the schedule on which the unit was scheduled to run in the energy market. (Priority: High. First reported 2012. Status: Adopted 2015.)
— The MMU recommends including no load and startup costs as part of the total avoided costs in the calculation of lost opportunity cost credits paid to combustion turbines and diesels scheduled in the Day-Ahead Energy Market but not committed in real time. (Priority: Medium. First reported 2012. Status: Adopted 2015.)
— The MMU recommends using the entire offer curve and not a single point on the offer curve to calculate energy lost opportunity cost. (Priority: Medium. First reported 2012. Status: Adopted 2015.)
— The MMU recommends calculating LOC based on 24 hour daily periods or multi-hour segments of hours for combustion turbines and diesels scheduled in the Day-Ahead Energy Market but not committed in real time. (Priority: Medium. First reported 2014. Status: Not adopted.)
— The MMU recommends that units scheduled in the Day-Ahead Energy Market and not committed in real time should be compensated for LOC based on their real-time desired and achievable output, not their scheduled day-ahead output. (Priority: Medium. First reported 2015. Status: Not adopted.)
— The MMU recommends that units scheduled in the Day-Ahead Energy Market and not committed in real time be compensated for LOC incurred within an hour. (Priority: Medium. First reported 2013. Status: Not adopted.)
— The MMU recommends that only flexible fast start units (startup plus notification times of 30 minutes or less) and short minimum run times (one hour or less) be eligible by default for the LOC compensation to units scheduled in the Day-Ahead Energy Market and not committed in real time. Other units should be eligible for LOC compensation only if PJM explicitly cancels their day-ahead commitment. (Priority: Medium. First reported 2015. Status: Not adopted.)
• The MMU recommends that up to congestion transactions be required to pay energy uplift charges. (Priority: High. First reported 2011. Status: Not adopted. Stakeholder process.)
• The MMU recommends eliminating the use of internal bilateral transactions (IBTs) in the calculation of deviations used to allocate balancing operating reserve charges. (Priority: High. First reported 2013. Status: Not adopted. Stakeholder process.)
• The MMU recommends allocating the energy uplift payments to units scheduled as must run in the Day-Ahead Energy Market for reasons other than voltage/reactive or black start services as a reliability charge to real-

2016 Quarterly State of the Market Report for PJM: January through March
158 Section 4 Energy Uplift © 2016 Monitoring Analytics, LLC
time load, real-time exports and real-time wheels. (Priority: Medium. First reported 2014. Status: Not adopted. Stakeholder process.)
• The MMU recommends reallocating the operating reserve credits paid to units supporting the Con Edison – PJM Transmission Service Agreements. (Priority: Medium. First reported 2013. Status: Not adopted. Stakeholder process.)
• The MMU recommends that the total cost of providing reactive support be categorized and allocated as reactive services. Reactive services credits should be calculated consistent with the operating reserve credits calculation. (Priority: Medium. First reported 2012. Status: Not adopted. Stakeholder process.)
• The MMU recommends including real-time exports and real-time wheels in the allocation of the cost of providing reactive support to the 500 kV system or above, which is currently allocated solely to real-time RTO load. (Priority: Low. First reported 2013. Status: Not adopted. Stakeholder process.)
• The MMU recommends enhancing the current energy uplift allocation rules to reflect the elimination of day-ahead operating reserves, the timing of commitment decisions and the commitment reasons. (Priority: High. First reported Q2, 2012. Status: Not adopted. Stakeholder process.)
ConclusionEnergy uplift is paid to market participants under specified conditions in order to ensure that resources are not required to operate for the PJM system at a loss. Referred to in PJM as day-ahead operating reserves, balancing operating reserves, energy lost opportunity cost credits, reactive services credits, synchronous condensing credits or black start services credits, these payments are intended to be one of the incentives to generation owners to offer their energy to the PJM energy market at marginal cost and to operate their units at the direction of PJM dispatchers. These credits are paid by PJM market participants as operating reserve charges, reactive services charges, synchronous condensing charges or black start charges.
In PJM all energy payments to demand response resources are also uplift payments. The energy payments to these resources are not part of the supply and demand balance, they are not paid by LMP revenues and therefore the energy payments to demand response resources have to be paid as out of market uplift. The energy payments to economic DR are funded by real-time load and real-time exports. The energy payments to emergency DR are funded by participants with net energy purchases in the Real-Time Energy Market.
From the perspective of those participants paying energy uplift charges, these costs are an unpredictable and unhedgeable component of participants’ costs in PJM. While energy uplift charges are an appropriate part of the cost of energy, market efficiency would be improved by ensuring that the level and variability of these charges are as low as possible consistent with the reliable operation of the system and that the allocation of these charges reflects the reasons that the costs are incurred to the extent possible.
The goal should be to reflect the impact of physical constraints in market prices to the maximum extent possible and thus to reduce the necessity for out of market energy uplift payments. When units receive substantial revenues through energy uplift payments, these payments are not transparent to the market because of the current confidentiality rules. As a result, other market participants, including generation and transmission developers, do not have the opportunity to compete to displace them. As a result, substantial energy uplift payments to a concentrated group of units and organizations has persisted for more than ten years.
One part of addressing the level and allocation of uplift payments is to eliminate all day-ahead operating reserve credits. It is illogical and unnecessary to pay units day-ahead operating reserve credits because units do not incur any costs to run and any revenue shortfalls are addressed by balancing operating reserve credits.
The level of energy uplift paid to specific units depends on the level of the unit’s energy offer, the unit’s operating parameters, the details of the rules which define payments and the decisions of PJM operators. Energy

Section 4 Energy Uplift
2016 Quarterly State of the Market Report for PJM: January through March 159© 2016 Monitoring Analytics, LLC
uplift payments result in part from decisions by PJM operators, who follow reliability requirements and market rules, to start units or to keep units operating even when hourly LMP is less than the offer price including energy, no load and startup costs. Energy uplift payments also result from units’ operational parameters that may require PJM to schedule or commit resources during noneconomic hours. The balance of these costs not covered by energy revenues are collected as energy uplift rather than reflected in price as a result of the rules governing the determination of LMP.
PJM’s goal should be to minimize the total level of energy uplift paid and to ensure that the associated charges are paid by all those whose market actions result in the incurrence of such charges. For example, up to congestion transactions continue to pay no energy uplift charges, which means that all others who pay these charges are paying too much. In addition, the netting of transactions against internal bilateral transactions should be eliminated. The goal should be to minimize the total incurred energy uplift charges and to increase the transactions over which those charges are spread in order to reduce the impact of energy uplift charges on markets. The result would be to reduce the level of per MWh charges, to reduce the uncertainty associated with uplift charges and to reduce the impact of energy uplift charges on decisions about how and when to participate in PJM markets.
But it is also important that the reduction of uplift payments not be a goal to be achieved at the expense of the fundamental logic of an LMP system. For example, the use of closed loop interfaces to reduce uplift should be eliminated because it is not consistent with LMP fundamentals and constitutes a form of subjective price setting. The same is true of what PJM terms its price setting logic.
Energy UpliftThe level of energy uplift credits paid to specific units depends on the level of the resource’s energy offer, the LMP, the resource’s operating parameters and the decisions of PJM operators. Energy uplift credits result in part from decisions by PJM operators, who follow reliability requirements and market rules, to start resources or to keep resources operating even when hourly LMP is less than the offer price including energy, no load and startup costs.
Credits and Charges CategoriesEnergy uplift charges include day-ahead and balancing operating reserves, reactive services, synchronous condensing and black start services categories. Total energy uplift credits paid to PJM participants equal the total energy uplift charges paid by PJM participants. Table 4-1 and Table 4-2 show the categories of credits and charges and their relationship. These tables show how the charges are allocated.

2016 Quarterly State of the Market Report for PJM: January through March
160 Section 4 Energy Uplift © 2016 Monitoring Analytics, LLC
Table 4‑1 Day‑ahead and balancing operating reserve credits and chargesCredits Received For: Credits Category: Charges Category: Charges Paid By:
Day‑Ahead
Day-Ahead Import Transactions and Generation Resources
Day-Ahead Operating Reserve Transaction
Day-Ahead Operating Reserve Generator
Day-Ahead Operating Reserve
Day-Ahead Load
in RTO RegionDay-Ahead Export Transactions
Decrement Bids
Economic Load Response ResourcesDay-Ahead Operating Reserves for
Load ResponseDay-Ahead Operating Reserve for Load Response
Day-Ahead Loadin RTO RegionDay-Ahead Export Transactions
Decrement Bids
Unallocated Negative Load Congestion Charges Unallocated Positive Generation Congestion Credits
Unallocated CongestionDay-Ahead Load
in RTO RegionDay-Ahead Export TransactionsDecrement Bids
Balancing
in RTO, Eastern or Western Region
Generation ResourcesBalancing Operating
Reserve Generator
Balancing Operating Reserve for Reliability
Real-Time Load plus Real-Time Export Transactions
Balancing Operating Reserve for Deviations
Deviations
Balancing Local Constraint Applicable Requesting Party
Canceled ResourcesBalancing Operating Reserve Startup
CancellationBalancing Operating Reserve for Deviations
Deviations in RTO RegionLost Opportunity Cost (LOC) Balancing Operating Reserve LOC
Real-Time Import TransactionsBalancing Operating Reserve Transaction
Economic Load Response ResourcesBalancing Operating Reserves for Load
ResponseBalancing Operating Reserve for Load Response
Deviations in RTO Region
Table 4‑2 Reactive services, synchronous condensing and black start services credits and chargesCredits Received For: Credits Category: Charges Category: Charges Paid By:
Reactive
Resources Providing Reactive Service
Day-Ahead Operating ReserveReactive Services Charge Zonal Real-Time LoadReactive Services Generator
Reactive Services LOCReactive Services Condensing
Reactive Services Local Constraint Applicable Requesting PartyReactive Services Synchronous Condensing LOC
Synchronous Condensing
Resources Providing Synchronous Condensing
Synchronous CondensingSynchronous Condensing
Real-Time Load Synchronous Condensing LOC Real-Time Export Transactions
Black Start
Resources Providing Black Start ServiceDay-Ahead Operating Reserve
Black Start Service ChargeZone/Non-zone Peak Transmission Use and Point to Point Transmission Reservations
Balancing Operating ReserveBlack Start Testing

Section 4 Energy Uplift
2016 Quarterly State of the Market Report for PJM: January through March 161© 2016 Monitoring Analytics, LLC
Energy Uplift ResultsEnergy Uplift ChargesTotal energy uplift charges decreased by $147.3 million or 79.0 percent in the first three months of 2016 compared to the first three months of 2015. Table 4-3 shows total energy uplift charges in the first three months of the years 2001 through 2016.2
Table 4‑3 Total energy uplift charges: January through March, 2001 through 2016
(Jan‑Mar)Total Energy Uplift Charges (Millions) Change (Millions) Percent Change
2001 $63.4 NA NA2002 $26.7 ($36.7) (57.9%)2003 $97.9 $71.2 266.6%2004 $98.7 $0.9 0.9%2005 $109.0 $10.3 10.4%2006 $69.8 ($39.2) (35.9%)2007 $113.0 $43.2 61.8%2008 $103.9 ($9.1) (8.1%)2009 $101.7 ($2.2) (2.1%)2010 $105.7 $4.1 4.0%2011 $130.3 $24.6 23.2%2012 $122.7 ($7.6) (5.9%)2013 $258.9 $136.2 111.0%2014 $742.8 $483.9 186.9%2015 $186.4 ($556.3) (74.9%)2016 $39.1 ($147.3) (79.0%)
Table 4-4 compares energy uplift charges by category for the first three months of 2015 and 2016. The decrease of $147.3 million in the first three months of 2016 is comprised of a decrease of $33.9 million in day-ahead operating reserve charges, a decrease of $102.7 million in balancing operating reserve charges, a decrease of $6.0 million in reactive services charges, no change in synchronous condensing charges and a decrease of $4.7 million in black start services charges.
2 Table 4-3 includes all categories of charges as defined in Table 4-1 and Table 4-2 and includes all PJM Settlements billing adjustments. Billing data can be modified by PJM Settlements at any time to reflect changes in the evaluation of energy uplift. The billing data reflected in this report were current on April 20, 2016.
The decrease in total energy uplift charges was mainly a result of low natural gas prices in the first three months of 2016 compared to the first three months of 2016.
Table 4‑4 Energy uplift charges by category: January through March 2015 and 2016
CategoryJan ‑ Mar 2015
Charges (Millions)Jan ‑ Mar 2016
Charges (Millions)Change
(Millions)Percent Change
Day-Ahead Operating Reserves $55.2 $21.3 ($33.9) (61.4%)Balancing Operating Reserves $120.2 $17.5 ($102.7) (85.4%)Reactive Services $6.3 $0.3 ($6.0) (96.0%)Synchronous Condensing $0.0 $0.0 $0.0 0.0% Black Start Services $4.7 $0.0 ($4.7) (99.6%)Total $186.4 $39.1 ($147.3) (79.0%)
The decrease in energy uplift charges in the first three months of 2016 was greatest for February. Total energy uplift charges decreased by $92.1 million from February 2015. Table 4-5 compares monthly energy uplift charges by category for 2015 and 2016.

2016 Quarterly State of the Market Report for PJM: January through March
162 Section 4 Energy Uplift © 2016 Monitoring Analytics, LLC
Table 4‑5 Monthly energy uplift charges: 2015 and 20162015 Charges (Millions) 2016 Charges (Millions)
Day‑Ahead Balancing
Reactive Services
Synchronous Condensing
Black Start Services Total
Day‑Ahead Balancing
Reactive Services
Synchronous Condensing
Black Start Services Total
Jan $16.8 $24.5 $1.8 $0.0 $1.7 $44.8 $7.4 $7.5 $0.00 $0.0 $0.0 $14.9 Feb $31.4 $71.0 $2.4 $0.0 $1.1 $105.9 $7.6 $6.2 $0.0 $0.0 $0.0 $13.9 Mar $7.0 $24.7 $2.1 $0.0 $1.9 $35.8 $6.4 $3.8 $0.2 $0.0 $0.0 $10.3 Apr $3.1 $8.5 $1.7 $0.0 $0.1 $13.4 May $5.7 $15.4 $0.7 $0.0 $0.2 $22.0 Jun $9.1 $8.6 $0.5 $0.0 $0.0 $18.2 Jul $5.1 $11.9 $0.1 $0.0 $0.0 $17.1 Aug $4.5 $9.0 $0.1 $0.0 $0.0 $13.6 Sep $4.1 $8.9 $0.6 $0.0 $0.0 $13.7 Oct $3.0 $5.5 $0.4 $0.0 $0.1 $9.0 Nov $4.3 $6.3 $0.1 $0.0 $0.0 $10.7 Dec $4.6 $4.2 $0.1 $0.0 $0.0 $8.9 Total (Jan - Mar) $55.2 $120.2 $6.3 $0.0 $4.7 $186.4 $21.3 $17.5 $0.3 $0.0 $0.0 $39.1 Share (Jan - Mar) $0.3 $0.6 $0.0 $0.0 $0.0 $1.0 $0.5 $0.4 $0.0 $0.0 $0.0 $1.0 Total $98.7 $198.7 $10.5 $0.0 $5.2 $313.1 $21.3 $17.5 $0.3 $0.0 $0.0 $39.1 Share $0.3 $0.6 $0.0 $0.0 $0.0 $1.0 $0.5 $0.4 $0.0 $0.0 $0.0 $1.0
Table 4-6 shows the composition of the day-ahead operating reserve charges. Day-ahead operating reserve charges consist of day-ahead operating reserve charges that pay for credits to generators and import transactions, day-ahead operating reserve charges for economic load response resources and day-ahead operating reserve charges from unallocated congestion charges.3 Day-ahead operating reserve charges decreased by $33.9 million or 61.4 percent in the first three months of 2016 compared to 2015. Day-ahead operating reserve charges remain high primarily because of uplift payments to units scheduled as must run by PJM. Units are typically scheduled as must run by PJM in the Day-Ahead Energy Market when the day-ahead model does not reflect certain real-time conditions or requirements (for example, reactive or ALR black start) or when units have parameters that extend beyond the 24 hour day-ahead model.
Table 4‑6 Day‑ahead operating reserve charges: January through March, 2015 and 2016
TypeJan ‑ Mar 2015
Charges (Millions)Jan ‑ Mar 2016
Charges (Millions)Change
(Millions)Jan ‑ Mar
2015 ShareJan ‑ Mar
2016 ShareDay-Ahead Operating Reserve Charges $55.0 $21.3 ($33.7) 99.7% 100.0%Day-Ahead Operating Reserve Charges for Load Response $0.2 $0.0 ($0.2) 0.3% 0.0%Unallocated Congestion Charges $0.0 $0.0 $0.0 0.0% 0.0%Total $55.2 $21.3 ($33.9) 100.0% 100.0%
3 See PJM. OATT Attachment K-Appendix § 3.2.3 (c). Unallocated congestion charges are added to the total costs of day-ahead operating reserves. Congestion charges have been allocated to day-ahead operating reserves ten times, totaling $26.9 million.
Section 4 Energy Uplift
2016 Quarterly State of the Market Report for PJM: January through March 163© 2016 Monitoring Analytics, LLC
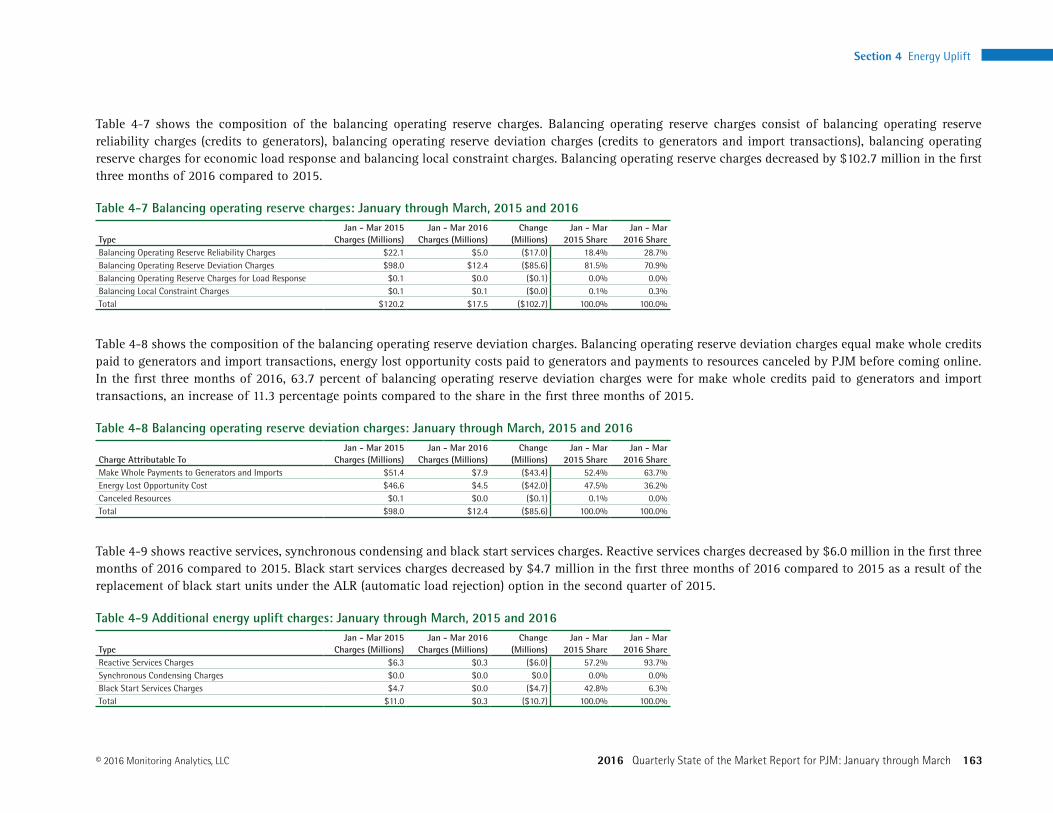
Table 4-7 shows the composition of the balancing operating reserve charges. Balancing operating reserve charges consist of balancing operating reserve reliability charges (credits to generators), balancing operating reserve deviation charges (credits to generators and import transactions), balancing operating reserve charges for economic load response and balancing local constraint charges. Balancing operating reserve charges decreased by $102.7 million in the first three months of 2016 compared to 2015.
Table 4‑7 Balancing operating reserve charges: January through March, 2015 and 2016
TypeJan ‑ Mar 2015
Charges (Millions)Jan ‑ Mar 2016
Charges (Millions)Change
(Millions)Jan ‑ Mar
2015 ShareJan ‑ Mar
2016 ShareBalancing Operating Reserve Reliability Charges $22.1 $5.0 ($17.0) 18.4% 28.7%Balancing Operating Reserve Deviation Charges $98.0 $12.4 ($85.6) 81.5% 70.9%Balancing Operating Reserve Charges for Load Response $0.1 $0.0 ($0.1) 0.0% 0.0%Balancing Local Constraint Charges $0.1 $0.1 ($0.0) 0.1% 0.3%Total $120.2 $17.5 ($102.7) 100.0% 100.0%
Table 4-8 shows the composition of the balancing operating reserve deviation charges. Balancing operating reserve deviation charges equal make whole credits paid to generators and import transactions, energy lost opportunity costs paid to generators and payments to resources canceled by PJM before coming online. In the first three months of 2016, 63.7 percent of balancing operating reserve deviation charges were for make whole credits paid to generators and import transactions, an increase of 11.3 percentage points compared to the share in the first three months of 2015.
Table 4‑8 Balancing operating reserve deviation charges: January through March, 2015 and 2016
Charge Attributable ToJan ‑ Mar 2015
Charges (Millions)Jan ‑ Mar 2016
Charges (Millions)Change
(Millions)Jan ‑ Mar
2015 ShareJan ‑ Mar
2016 ShareMake Whole Payments to Generators and Imports $51.4 $7.9 ($43.4) 52.4% 63.7%Energy Lost Opportunity Cost $46.6 $4.5 ($42.0) 47.5% 36.2%Canceled Resources $0.1 $0.0 ($0.1) 0.1% 0.0%Total $98.0 $12.4 ($85.6) 100.0% 100.0%
Table 4-9 shows reactive services, synchronous condensing and black start services charges. Reactive services charges decreased by $6.0 million in the first three months of 2016 compared to 2015. Black start services charges decreased by $4.7 million in the first three months of 2016 compared to 2015 as a result of the replacement of black start units under the ALR (automatic load rejection) option in the second quarter of 2015.
Table 4‑9 Additional energy uplift charges: January through March, 2015 and 2016
TypeJan ‑ Mar 2015
Charges (Millions)Jan ‑ Mar 2016
Charges (Millions)Change
(Millions)Jan ‑ Mar
2015 ShareJan ‑ Mar
2016 ShareReactive Services Charges $6.3 $0.3 ($6.0) 57.2% 93.7%Synchronous Condensing Charges $0.0 $0.0 $0.0 0.0% 0.0%Black Start Services Charges $4.7 $0.0 ($4.7) 42.8% 6.3%Total $11.0 $0.3 ($10.7) 100.0% 100.0%
2016 Quarterly State of the Market Report for PJM: January through March
164 Section 4 Energy Uplift © 2016 Monitoring Analytics, LLC
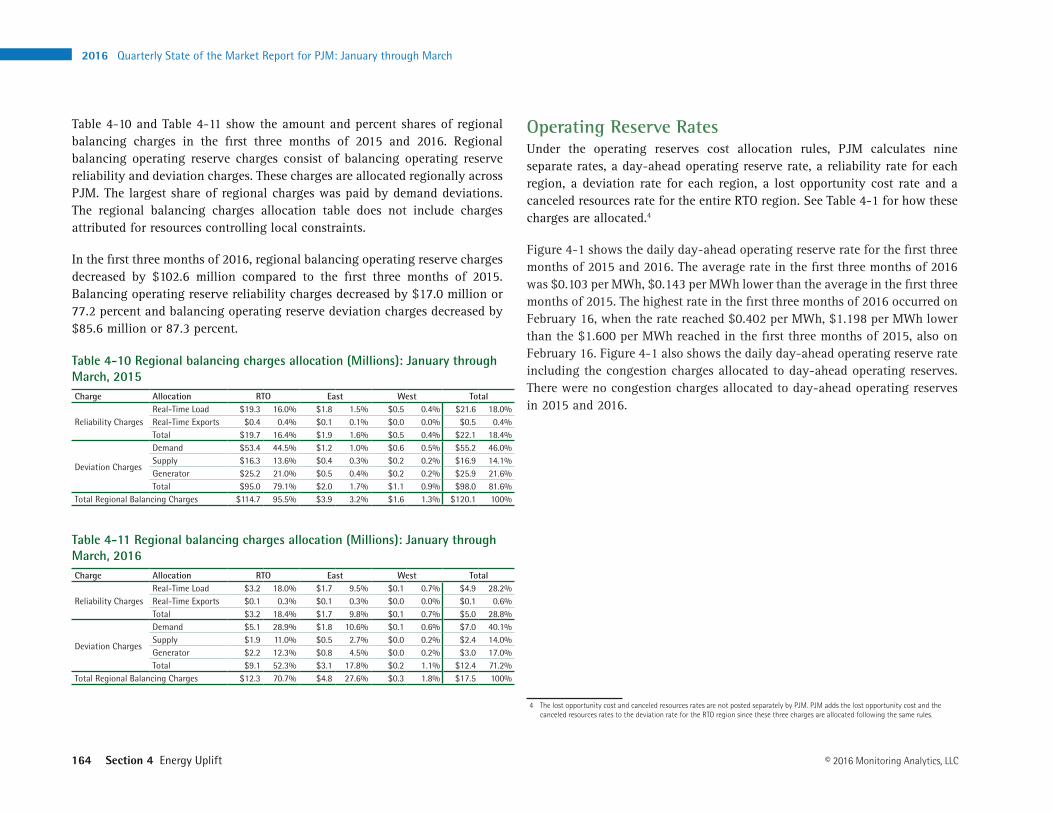
Table 4-10 and Table 4-11 show the amount and percent shares of regional balancing charges in the first three months of 2015 and 2016. Regional balancing operating reserve charges consist of balancing operating reserve reliability and deviation charges. These charges are allocated regionally across PJM. The largest share of regional charges was paid by demand deviations. The regional balancing charges allocation table does not include charges attributed for resources controlling local constraints.
In the first three months of 2016, regional balancing operating reserve charges decreased by $102.6 million compared to the first three months of 2015. Balancing operating reserve reliability charges decreased by $17.0 million or 77.2 percent and balancing operating reserve deviation charges decreased by $85.6 million or 87.3 percent.
Table 4‑10 Regional balancing charges allocation (Millions): January through March, 2015Charge Allocation RTO East West Total
Reliability ChargesReal-Time Load $19.3 16.0% $1.8 1.5% $0.5 0.4% $21.6 18.0%Real-Time Exports $0.4 0.4% $0.1 0.1% $0.0 0.0% $0.5 0.4%Total $19.7 16.4% $1.9 1.6% $0.5 0.4% $22.1 18.4%
Deviation Charges
Demand $53.4 44.5% $1.2 1.0% $0.6 0.5% $55.2 46.0%Supply $16.3 13.6% $0.4 0.3% $0.2 0.2% $16.9 14.1%Generator $25.2 21.0% $0.5 0.4% $0.2 0.2% $25.9 21.6%Total $95.0 79.1% $2.0 1.7% $1.1 0.9% $98.0 81.6%
Total Regional Balancing Charges $114.7 95.5% $3.9 3.2% $1.6 1.3% $120.1 100%
Table 4‑11 Regional balancing charges allocation (Millions): January through March, 2016Charge Allocation RTO East West Total
Reliability ChargesReal-Time Load $3.2 18.0% $1.7 9.5% $0.1 0.7% $4.9 28.2%Real-Time Exports $0.1 0.3% $0.1 0.3% $0.0 0.0% $0.1 0.6%Total $3.2 18.4% $1.7 9.8% $0.1 0.7% $5.0 28.8%
Deviation Charges
Demand $5.1 28.9% $1.8 10.6% $0.1 0.6% $7.0 40.1%Supply $1.9 11.0% $0.5 2.7% $0.0 0.2% $2.4 14.0%Generator $2.2 12.3% $0.8 4.5% $0.0 0.2% $3.0 17.0%Total $9.1 52.3% $3.1 17.8% $0.2 1.1% $12.4 71.2%
Total Regional Balancing Charges $12.3 70.7% $4.8 27.6% $0.3 1.8% $17.5 100%
Operating Reserve RatesUnder the operating reserves cost allocation rules, PJM calculates nine separate rates, a day-ahead operating reserve rate, a reliability rate for each region, a deviation rate for each region, a lost opportunity cost rate and a canceled resources rate for the entire RTO region. See Table 4-1 for how these charges are allocated.4
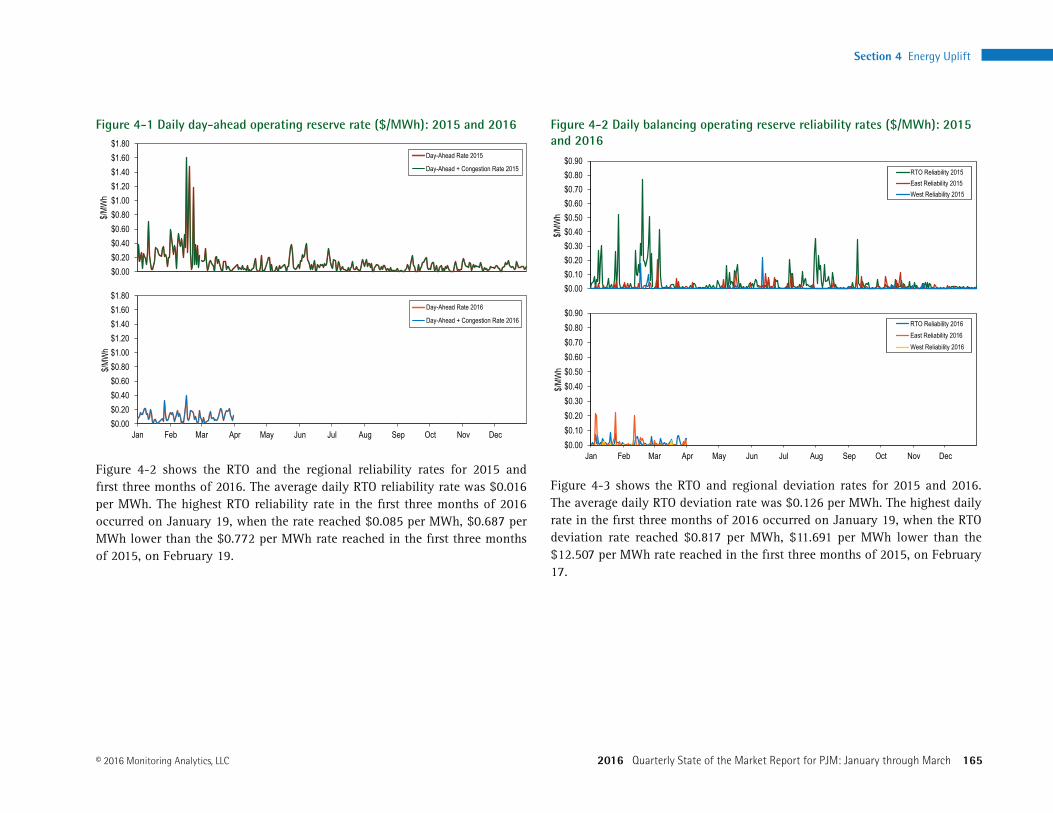
Figure 4-1 shows the daily day-ahead operating reserve rate for the first three months of 2015 and 2016. The average rate in the first three months of 2016 was $0.103 per MWh, $0.143 per MWh lower than the average in the first three months of 2015. The highest rate in the first three months of 2016 occurred on February 16, when the rate reached $0.402 per MWh, $1.198 per MWh lower than the $1.600 per MWh reached in the first three months of 2015, also on February 16. Figure 4-1 also shows the daily day-ahead operating reserve rate including the congestion charges allocated to day-ahead operating reserves. There were no congestion charges allocated to day-ahead operating reserves in 2015 and 2016.
4 The lost opportunity cost and canceled resources rates are not posted separately by PJM. PJM adds the lost opportunity cost and the canceled resources rates to the deviation rate for the RTO region since these three charges are allocated following the same rules.
Section 4 Energy Uplift
2016 Quarterly State of the Market Report for PJM: January through March 165© 2016 Monitoring Analytics, LLC
Figure 4‑1 Daily day‑ahead operating reserve rate ($/MWh): 2015 and 2016
$0.00$0.20$0.40$0.60$0.80$1.00$1.20$1.40$1.60$1.80
$/MW
h
Day-Ahead Rate 2015
Day-Ahead + Congestion Rate 2015
$0.00$0.20$0.40$0.60$0.80$1.00$1.20$1.40$1.60$1.80
Jan Feb Mar Apr May Jun Jul Aug Sep Oct Nov Dec
$/MW
h
Day-Ahead Rate 2016
Day-Ahead + Congestion Rate 2016
Figure 4-2 shows the RTO and the regional reliability rates for 2015 and first three months of 2016. The average daily RTO reliability rate was $0.016 per MWh. The highest RTO reliability rate in the first three months of 2016 occurred on January 19, when the rate reached $0.085 per MWh, $0.687 per MWh lower than the $0.772 per MWh rate reached in the first three months of 2015, on February 19.
Figure 4‑2 Daily balancing operating reserve reliability rates ($/MWh): 2015 and 2016
$0.00$0.10$0.20$0.30$0.40$0.50$0.60$0.70$0.80$0.90
$/MW
h
RTO Reliability 2015East Reliability 2015West Reliability 2015
$0.00$0.10$0.20$0.30$0.40$0.50$0.60$0.70$0.80$0.90
Jan Feb Mar Apr May Jun Jul Aug Sep Oct Nov Dec
$/MW
h
RTO Reliability 2016East Reliability 2016West Reliability 2016
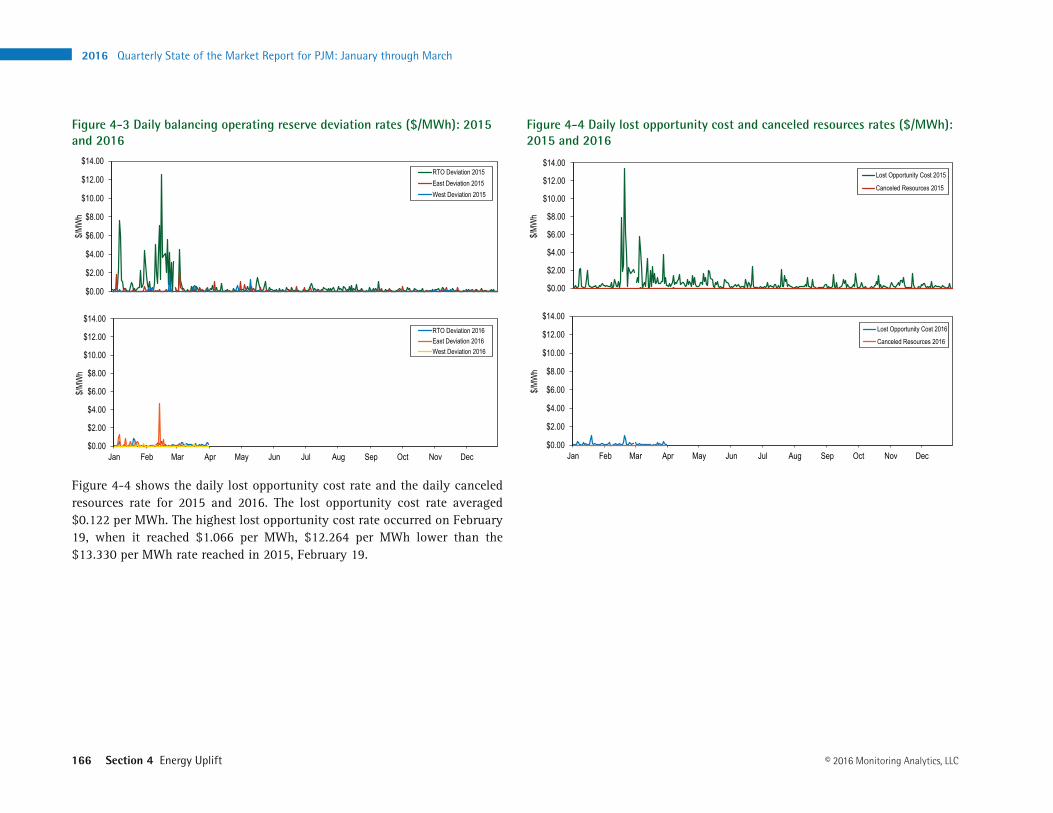
Figure 4-3 shows the RTO and regional deviation rates for 2015 and 2016. The average daily RTO deviation rate was $0.126 per MWh. The highest daily rate in the first three months of 2016 occurred on January 19, when the RTO deviation rate reached $0.817 per MWh, $11.691 per MWh lower than the $12.507 per MWh rate reached in the first three months of 2015, on February 17.
2016 Quarterly State of the Market Report for PJM: January through March
166 Section 4 Energy Uplift © 2016 Monitoring Analytics, LLC
Figure 4‑3 Daily balancing operating reserve deviation rates ($/MWh): 2015 and 2016
$0.00
$2.00
$4.00
$6.00
$8.00
$10.00
$12.00
$14.00
$/MW
h
RTO Deviation 2015East Deviation 2015West Deviation 2015
$0.00
$2.00
$4.00
$6.00
$8.00
$10.00
$12.00
$14.00
Jan Feb Mar Apr May Jun Jul Aug Sep Oct Nov Dec
$/MW
h
RTO Deviation 2016East Deviation 2016West Deviation 2016
Figure 4-4 shows the daily lost opportunity cost rate and the daily canceled resources rate for 2015 and 2016. The lost opportunity cost rate averaged $0.122 per MWh. The highest lost opportunity cost rate occurred on February 19, when it reached $1.066 per MWh, $12.264 per MWh lower than the $13.330 per MWh rate reached in 2015, February 19.
Figure 4‑4 Daily lost opportunity cost and canceled resources rates ($/MWh): 2015 and 2016
$0.00
$2.00
$4.00
$6.00
$8.00
$10.00
$12.00
$14.00
$/MW
h
Lost Opportunity Cost 2015
Canceled Resources 2015
$0.00
$2.00
$4.00
$6.00
$8.00
$10.00
$12.00
$14.00
Jan Feb Mar Apr May Jun Jul Aug Sep Oct Nov Dec
$/MW
h
Lost Opportunity Cost 2016
Canceled Resources 2016

Section 4 Energy Uplift
2016 Quarterly State of the Market Report for PJM: January through March 167© 2016 Monitoring Analytics, LLC
Table 4-12 shows the average rates for each region in each category in the first three months of 2015 and 2016.
Table 4‑12 Operating reserve rates ($/MWh): January through March, 2015 and 2016
RateJan ‑ Mar 2015
($/MWh)Jan ‑ Mar 2016
($/MWh)Difference ($/MWh)
Percent Difference
Day-Ahead 0.246 0.103 (0.143) (58.1%)Day-Ahead with Unallocated Congestion 0.246 0.103 (0.143) (58.1%)RTO Reliability 0.091 0.016 (0.075) (82.2%)East Reliability 0.018 0.018 0.000 0.9% West Reliability 0.004 0.001 (0.003) (75.5%)RTO Deviation 1.415 0.126 (1.289) (91.1%)East Deviation 0.113 0.157 0.044 39.0% West Deviation 0.065 0.011 (0.054) (82.5%)Lost Opportunity Cost 1.364 0.122 (1.241) (91.0%)Canceled Resources 0.003 0.000 (0.003) (97.7%)
Table 4-13 shows the operating reserve cost of a one MW transaction in the first three months of 2016. For example, a decrement bid in the Eastern Region (if not offset by other transactions) paid an average rate of $0.483 per MWh with a maximum rate of $4.907 per MWh, a minimum rate of $0.047 per MWh and a standard deviation of $0.597 per MWh. The rates in Table 4-13 include all operating reserve charges including RTO deviation charges. Table 4-13 illustrates both the average level of operating reserve charges by transaction types and the uncertainty reflected in the maximum, minimum and standard deviation levels.
Table 4‑13 Operating reserve rates statistics ($/MWh): January through March, 2016
Rates Charged ($/MWh)
Region Transaction Maximum Average MinimumStandard Deviation
East
INC 4.886 0.378 0.008 0.609 DEC 4.907 0.483 0.047 0.597 DA Load 0.402 0.105 0.002 0.072 RT Load 0.297 0.031 0.000 0.053 Deviation 4.886 0.378 0.008 0.609
West
INC 1.805 0.250 0.008 0.278 DEC 1.829 0.355 0.047 0.274 DA Load 0.402 0.105 0.002 0.072 RT Load 0.091 0.017 0.000 0.021 Deviation 1.805 0.250 0.008 0.278
Reactive Services RatesReactive services charges associated with local voltage support are allocated to real-time load in the control zone or zones where the service is provided. These charges result from uplift payments to units committed by PJM to support reactive/voltage requirements that do not recover their energy offer through LMP payments. These charges are separate from the reactive service revenue requirement charges which are a fixed annual charge based on approved FERC filings. Reactive services charges associated with supporting reactive transfer interfaces above 345 kV are allocated to real-time load across the entire RTO. These charges are allocated daily based on the real-time load ratio share of each network customer.
While reactive services rates are not posted by PJM, a local voltage support rate for each control zone can be calculated and a reactive transfer interface support rate can be calculated for the entire RTO. Table 4-14 shows the reactive services rates associated with local voltage support in the first three months of 2015 and 2016. Table 4-14 shows that in the first three months of 2016 the DPL Control Zone had the highest rate. Real-time load in the DPL Control Zone paid an average of $0.049 per MWh for reactive services associated with local voltage support, $0.011 or 27.4 percent lower than the average rate paid in the first three months of 2015.

2016 Quarterly State of the Market Report for PJM: January through March
168 Section 4 Energy Uplift © 2016 Monitoring Analytics, LLC
Table 4‑14 Local voltage support rates: January through March, 2015 and 2016
Control ZoneJan ‑ Mar 2015
($/MWh)Jan ‑ Mar 2016
($/MWh)Difference ($/MWh)
Percent Difference
AECO 0.000 0.000 0.000 0.0% AEP 0.006 0.000 (0.005) (92.2%)AP 0.000 0.000 0.000 0.0% ATSI 0.118 0.000 (0.118) (100.0%)BGE 0.000 0.000 0.000 0.0% ComEd 0.000 0.000 0.000 NADAY 0.000 0.000 0.000 0.0% DEOK 0.000 0.000 0.000 0.0% DLCO 0.000 0.000 0.000 0.0% Dominion 0.091 0.000 (0.091) (100.0%)DPL 0.038 0.049 0.011 27.4% EKPC 0.000 0.000 0.000 0.0% JCPL 0.000 0.000 0.000 0.0% Met-Ed 0.008 0.000 (0.008) (100.0%)PECO 0.000 0.000 0.000 0.0% PENELEC 0.036 0.002 (0.034) (93.4%)Pepco 0.000 0.000 0.000 0.0% PPL 0.000 0.000 0.000 0.0% PSEG 0.000 0.000 0.000 0.0% RECO 0.000 0.000 0.000 0.0%
Figure 4-5 shows the daily RTO wide reactive transfer interface rate in the first three months of 2015 and 2016. The average rate in the first three months of 2016 was zero, compared to the $0.0056 per MWh average rate in the first three months of 2015.
Figure 4‑5 Daily reactive transfer interface support rates ($/MWh): 2015 and 2016
$0.00
$0.05
$0.10
$0.15
$0.20
$0.25
$0.30
$0.35
$0.40
$/MW
h
2015 Rate
$0.00
$0.05
$0.10
$0.15
$0.20
$0.25
$0.30
$0.35
$0.40
Jan Feb Mar Apr May Jun Jul Aug Sep Oct Nov Dec
$/MW
h
2016 Rate
Balancing Operating Reserve DeterminantsTable 4-15 shows the determinants used to allocate the regional balancing operating reserve charges in the first three months of 2015 and 2016. Total real-time load and real-time exports were 20,066,741 MWh or 9.2 percent lower in the first three months of 2016 compared to 2015. Total deviations summed across the demand, supply, and generator categories were 2,314,630 MWh or 6.7 percent higher in the first three months of 2016 compared to 2015.

Section 4 Energy Uplift
2016 Quarterly State of the Market Report for PJM: January through March 169© 2016 Monitoring Analytics, LLC
Table 4‑15 Balancing operating reserve determinants (MWh): January through March 2015 and 2016Reliability Charge Determinants (MWh) Deviation Charge Determinants (MWh)
Real‑Time Load
Real‑Time Exports
Reliability Total
Demand Deviations
(MWh)
Supply Deviations
(MWh)
Generator Deviations
(MWh)Deviations
Total
Jan - Mar 2015RTO 213,419,611 5,236,430 218,656,041 20,073,206 5,898,113 8,506,064 34,477,383East 101,402,083 3,881,322 105,283,405 10,406,860 3,299,513 4,167,763 17,874,136West 112,017,528 1,355,108 113,372,636 9,517,416 2,487,200 4,338,302 16,342,918
Jan - Mar 2016RTO 194,989,510 3,599,790 198,589,300 20,424,011 7,707,437 8,660,565 36,792,013East 91,356,425 2,370,642 93,727,068 10,491,685 4,201,587 5,001,837 19,695,109West 103,633,084 1,229,148 104,862,232 9,782,106 3,434,507 3,658,728 16,875,341
DifferenceRTO (18,430,102) (1,636,640) (20,066,741) 350,805 1,809,325 154,501 2,314,630 East (10,045,658) (1,510,680) (11,556,338) 84,825 902,074 834,074 1,820,973 West (8,384,444) (125,960) (8,510,404) 264,689 947,307 (679,574) 532,422
Deviations fall into three categories, demand, supply and generator deviations. Table 4-16 shows the different categories by the type of transactions that incurred deviations. In the first three months of 2016, 27.7 percent of all RTO deviations were incurred by participants that deviated due to INCs and DECs or due to combinations of INCs and DECs with other transactions, the remaining 72.3 percent of all RTO deviations were incurred by participants that deviated due to other transaction types or due to combinations of other transaction types.
Table 4‑16 Deviations by transaction type: January through March 2016Deviation Category
Deviation (MWh) ShareTransaction RTO East West RTO East West
Demand
Bilateral Sales Only 265,844 225,136 40,708 0.7% 1.1% 0.2%DECs Only 2,857,204 1,289,942 1,417,043 7.8% 6.5% 8.4%Exports Only 741,811 365,268 376,543 2.0% 1.9% 2.2%Load Only 14,276,528 6,984,072 7,292,456 38.8% 35.5% 43.2%Combination with DECs 1,778,395 1,412,039 366,357 4.8% 7.2% 2.2%Combination without DECs 504,228 215,230 288,998 1.4% 1.1% 1.7%
Supply
Bilateral Purchases Only 239,084 198,376 40,708 0.6% 1.0% 0.2%Imports Only 1,890,176 820,881 1,069,295 5.1% 4.2% 6.3%INCs Only 4,541,573 2,497,368 1,972,862 12.3% 12.7% 11.7%Combination with INCs 1,018,024 669,495 348,529 2.8% 3.4% 2.1%Combination without INCs 18,580 15,467 3,113 0.1% 0.1% 0.0%
Generators 8,660,565 5,001,837 3,658,728 23.5% 25.4% 21.7%Total 36,792,013 19,695,109 16,875,341 100.0% 100.0% 100.0%
2016 Quarterly State of the Market Report for PJM: January through March
170 Section 4 Energy Uplift © 2016 Monitoring Analytics, LLC
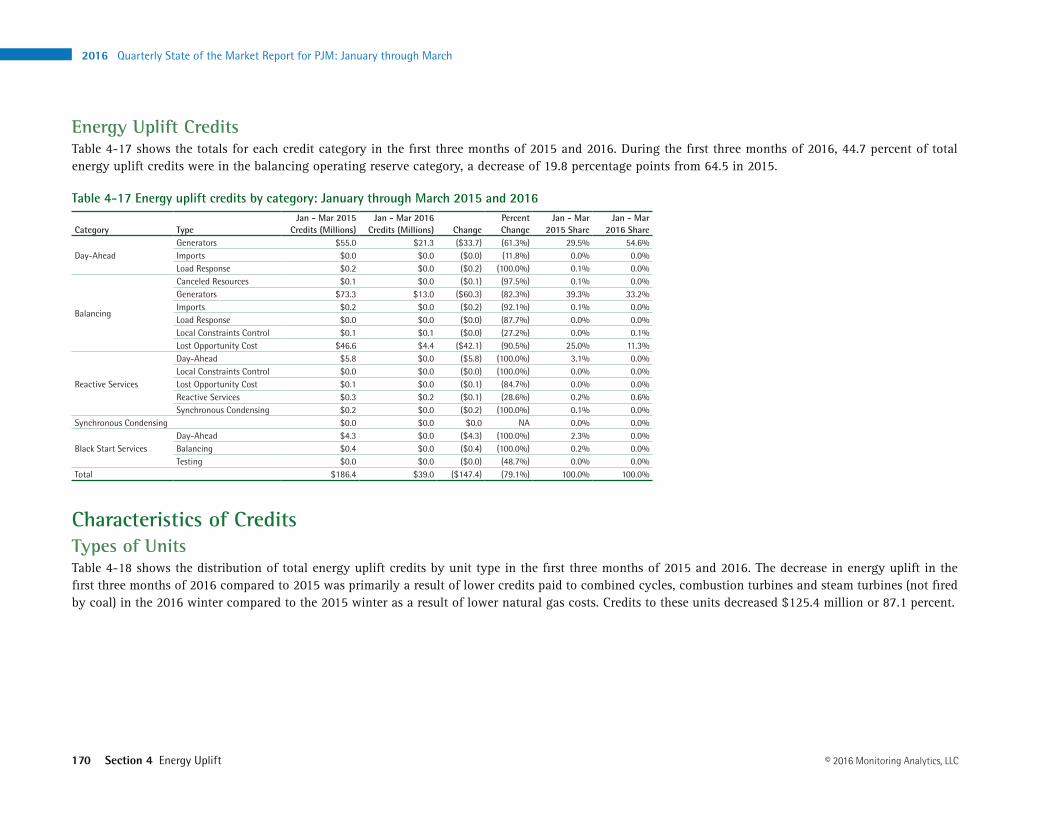
Energy Uplift CreditsTable 4-17 shows the totals for each credit category in the first three months of 2015 and 2016. During the first three months of 2016, 44.7 percent of total energy uplift credits were in the balancing operating reserve category, a decrease of 19.8 percentage points from 64.5 in 2015.
Table 4‑17 Energy uplift credits by category: January through March 2015 and 2016
Category TypeJan ‑ Mar 2015
Credits (Millions)Jan ‑ Mar 2016
Credits (Millions) ChangePercent Change
Jan ‑ Mar 2015 Share
Jan ‑ Mar 2016 Share
Day-AheadGenerators $55.0 $21.3 ($33.7) (61.3%) 29.5% 54.6%Imports $0.0 $0.0 ($0.0) (11.8%) 0.0% 0.0%Load Response $0.2 $0.0 ($0.2) (100.0%) 0.1% 0.0%
Balancing
Canceled Resources $0.1 $0.0 ($0.1) (97.5%) 0.1% 0.0%Generators $73.3 $13.0 ($60.3) (82.3%) 39.3% 33.2%Imports $0.2 $0.0 ($0.2) (92.1%) 0.1% 0.0%Load Response $0.0 $0.0 ($0.0) (87.7%) 0.0% 0.0%Local Constraints Control $0.1 $0.1 ($0.0) (27.2%) 0.0% 0.1%Lost Opportunity Cost $46.6 $4.4 ($42.1) (90.5%) 25.0% 11.3%
Reactive Services
Day-Ahead $5.8 $0.0 ($5.8) (100.0%) 3.1% 0.0%Local Constraints Control $0.0 $0.0 ($0.0) (100.0%) 0.0% 0.0%Lost Opportunity Cost $0.1 $0.0 ($0.1) (84.7%) 0.0% 0.0%Reactive Services $0.3 $0.2 ($0.1) (28.6%) 0.2% 0.6%Synchronous Condensing $0.2 $0.0 ($0.2) (100.0%) 0.1% 0.0%
Synchronous Condensing $0.0 $0.0 $0.0 NA 0.0% 0.0%
Black Start ServicesDay-Ahead $4.3 $0.0 ($4.3) (100.0%) 2.3% 0.0%Balancing $0.4 $0.0 ($0.4) (100.0%) 0.2% 0.0%Testing $0.0 $0.0 ($0.0) (48.7%) 0.0% 0.0%
Total $186.4 $39.0 ($147.4) (79.1%) 100.0% 100.0%
Characteristics of CreditsTypes of UnitsTable 4-18 shows the distribution of total energy uplift credits by unit type in the first three months of 2015 and 2016. The decrease in energy uplift in the first three months of 2016 compared to 2015 was primarily a result of lower credits paid to combined cycles, combustion turbines and steam turbines (not fired by coal) in the 2016 winter compared to the 2015 winter as a result of lower natural gas costs. Credits to these units decreased $125.4 million or 87.1 percent.

Section 4 Energy Uplift
2016 Quarterly State of the Market Report for PJM: January through March 171© 2016 Monitoring Analytics, LLC
Table 4‑18 Energy uplift credits by unit type: January through March 2015 and 2016
Unit TypeJan ‑ Mar 2015
Credits (Millions)Jan ‑ Mar 2016
Credits (Millions) ChangePercent Change
Jan ‑ Mar 2015 Share
Jan ‑ Mar 2016 Share
Combined Cycle $56.7 $6.6 ($50.1) (88.4%) 30.5% 16.8%Combustion Turbine $61.2 $11.1 ($50.1) (81.9%) 32.9% 28.4%Diesel $0.9 $0.3 ($0.5) (60.2%) 0.5% 0.9%Hydro $0.3 $0.0 ($0.3) (99.0%) 0.2% 0.0%Nuclear $0.2 $0.1 ($0.1) (32.5%) 0.1% 0.3%Steam - Coal $40.3 $19.9 ($20.4) (50.7%) 21.7% 50.9%Steam - Other $26.0 $0.8 ($25.1) (96.8%) 13.9% 2.1%Wind $0.6 $0.2 ($0.4) (65.4%) 0.3% 0.5%Total $186.1 $39.0 ($147.1) (79.0%) 100.0% 100.0%
Table 4-19 shows the distribution of energy uplift credits by category and by unit type in the first three months of 2016. Combined cycle units received 15.1 percent of the day-ahead generator credits in the first three months of 2016, 24.5 percentage points lower than the share received in the first three months of 2015. Combined cycle units received 24.0 percent of the balancing generator credits in the first three months of 2016, 22.5 percentage points lower than the share received in the first three months of 2015. Combustion turbines and diesels received 89.3 percent of the lost opportunity cost credits in the first three months of 2015, 0.7 percentage points higher than the share received in the first three months of 2015.
Table 4‑19 Energy uplift credits by unit type: January through March 2016
Unit TypeDay‑Ahead Generator
Balancing Generator
Canceled Resources
Local Constraints
Control
Lost Opportunity
CostReactive Services
Synchronous Condensing
Black Start Services
Combined Cycle 15.1% 24.0% 0.0% 0.0% 1.1% 80.8% 0.0% 0.0%Combustion Turbine 3.3% 51.1% 0.0% 0.0% 83.5% 18.8% 0.0% 100.0%Diesel 0.0% 0.7% 0.0% 0.0% 5.7% 0.4% 0.0% 0.0%Hydro 0.0% 0.0% 100.0% 0.0% 0.0% 0.0% 0.0% 0.0%Nuclear 0.0% 0.0% 0.0% 0.0% 2.7% 0.0% 0.0% 0.0%Steam - Coal 79.6% 21.1% 0.0% 84.5% 2.5% 0.0% 0.0% 0.0%Steam - Others 2.0% 3.1% 0.0% 0.0% 0.0% 0.0% 0.0% 0.0%Wind 0.0% 0.1% 0.0% 15.5% 4.5% 0.0% 0.0% 0.0%Total (Millions) $21.3 $13.0 $0.0 $0.1 $4.4 $0.3 $0.0 $0.0
Table 4-19 also shows the distribution of reactive service credits and black start services credits by unit type. In the first three months of 2016, coal units received 0.0 percent of all reactive services credits, compared to 57.0 percent in the first three months of 2015.
Concentration of Energy Uplift CreditsThere continues to be a high level of concentration in the units and companies receiving energy uplift credits. This concentration results from a combination of unit operating characteristics, PJM’s persistent need to commit specific units out of merit in particular locations and the fact that the lack of transparency makes it almost impossible for competition to affect these payments.
Figure 4-6 shows the concentration of energy uplift credits. The top 10 units received 54.0 percent of total energy uplift credits in the first three months of 2016, compared to 38.1 percent in 2015. In the first three months of 2016, 226 units received 90 percent of all energy uplift credits, compared to 246 units in 2015.

2016 Quarterly State of the Market Report for PJM: January through March
172 Section 4 Energy Uplift © 2016 Monitoring Analytics, LLC
Figure 4‑6 Cumulative share of energy uplift credits in January through March of 2015 and 2016 by unit
38.1%
66.7%
80.8%
178
54.0%
75.8%
85.4%
140
0%
10%
20%
30%
40%
50%
60%
70%
80%
90%
100%
1 28 55 82 109
136
163
190
217
244
271
298
325
352
379
406
433
460
487
514
541
568
595
622
649
676
703
730
757
784
811
838
865
892
919
946
973
1,000
Accu
mulat
ed P
erce
nt of
Ener
gy U
plift C
redit
s
Number of units
Jan - Mar 2015
Top 10 Units Jan - Mar 2015
Top 50 Units Jan - Mar 2015
Top 100 Units Jan - Mar 2015
Units with 90% of Credits in Jan - Mar 2015
Jan - Mar 2016
Top 10 Units Jan - Mar 2016
Top 50 Units Jan - Mar 2016
Top 100 Units Jan - Mar 2016
Units with 90% of Credits in Jan - Mar 2016
Table 4-20 shows the credits received by the top 10 units and top 10 organizations in each of the energy uplift categories paid to generators.
Table 4‑20 Top 10 units and organizations energy uplift credits: January through March 2016
Top 10 Units Top 10 Organizations
Category TypeCredits
(Millions)Credits Share
Credits (Millions)
Credits Share
Day-Ahead Generators $16.3 76.3% $21.0 98.4%
Balancing
Canceled Resources $0.0 100.0% $0.0 100.0%Generators $4.9 37.5% $11.0 84.5%Local Constraints Control $0.1 100.0% $0.1 100.0%Lost Opportunity Cost $2.5 56.6% $3.9 88.4%
Reactive Services $0.2 99.7% $0.3 100.0%Synchronous Condensing $0.0 0.0% $0.0 0.0%Black Start Services $0.0 100.0% $0.0 100.0%Total $21.1 54.0% $33.9 86.9%
Table 4-21 shows balancing operating reserve credits received by the top 10 units identified for reliability or for deviations in each region. In the first three months of 2016, 80.1 percent of all credits paid to these units were allocated to deviations while the remaining 19.9 percent were paid for reliability reasons.
Table 4‑21 Identification of balancing operating reserve credits received by the top 10 units by category and region: January through March 2016
Reliability DeviationsRTO East West RTO East West Total
Credits (Millions) $0.9 $0.1 $0.0 $2.0 $1.8 $0.0 $4.9 Share 18.0% 1.9% 0.0% 42.1% 38.0% 0.0% 100.0%
In the first three months of 2016, concentration in all energy uplift credit categories was high.5 6 The HHI for energy uplift credits was calculated based on each organization’s share of daily credits for each category. Table 4-22 shows the average HHI for each category. HHI for day-ahead operating reserve credits to generators was 5397, for balancing operating reserve credits to generators was 4165, for lost opportunity cost credits was 5101 and for reactive services credits was 9883.
5 See 2015 State of the Market Report for PJM, Volume II: Section 3: “Energy Market” at “Market Concentration” for a discussion of concentration ratios and the Herfindahl-Hirschman Index (HHI).
6 Table 4-22 excludes local constraints control categories.

Section 4 Energy Uplift
2016 Quarterly State of the Market Report for PJM: January through March 173© 2016 Monitoring Analytics, LLC
Table 4‑22 Daily energy uplift credits HHI: January through March 2016
Category Type Average Minimum MaximumHighest Market Share (One day)
Highest Market Share (All days)
Day-AheadGenerators 5397 2440 10000 100.0% 37.9%Imports 10000 10000 10000 100.0% 68.6%Load Response NA NA NA NA NA
Balancing
Canceled Resources 10000 10000 10000 100.0% 100.0%Generators 4165 1230 9554 97.7% 21.2%Imports 10000 10000 10000 100.0% 100.0%Load Response 10000 10000 10000 100.0% 52.1%Lost Opportunity Cost 5101 1507 10000 100.0% 23.3%
Reactive Services 9883 6772 10000 100.0% 81.2%Synchronous Condensing NA NA NA NA NABlack Start Services 10000 10000 10000 100.0% 45.5%Total 3432 871 7583 86.6% 24.7%
Economic and Noneconomic Generation7
Economic generation includes units scheduled day ahead or producing energy in real time at an incremental offer less than or equal to the LMP at the unit’s bus. Noneconomic generation includes units that are scheduled or producing energy at an incremental offer higher than the LMP at the unit’s bus. Units are paid day-ahead operating reserve credits based on their scheduled operation for the entire day. Balancing generator operating reserve credits are paid on a segmented basis for each period defined by the greater of the day-ahead schedule and minimum run time. Table 4-23 shows PJM’s day-ahead and real-time total generation and the amount of generation eligible for operating reserve credits. In the Day-Ahead Energy Market only pool-scheduled resources are eligible for day-ahead operating reserve credits. In the Real-Time Energy Market only pool-scheduled resources that follow PJM’s dispatch instructions are eligible for balancing operating reserve credits.
The MMU analyzed PJM’s day-ahead and real-time generation eligible for operating reserve credits to determine the shares of economic and noneconomic generation. Each unit’s hourly generation was determined to be economic or noneconomic based on the unit’s hourly incremental offer, excluding the hourly no load cost and any applicable startup cost. A unit could be economic
7 The analysis of economic and noneconomic generation is based on units’ incremental offers, the value used by PJM to calculate LMP. The analysis does not include no load or startup costs.
for every hour during a day or segment, but still receive operating reserve credits because the energy revenues did not cover the hourly no load costs and startup costs. A unit could be noneconomic for an hour or multiple hours and not receive operating reserve credits whenever the total energy revenues covered the total offer (including no load and startup costs) for the entire day or segment. In the first three months of 2016, 37.2 percent of the day-ahead generation was eligible for day-ahead operating reserve credits and 35.1 percent of the real-time generation was eligible for balancing operating reserve credits.8
Table 4‑23 Day‑ahead and real‑time generation (GWh): January through March 2015
Energy Market Total GenerationGeneration Eligible for Operating
Reserve CreditsGeneration Eligible for Operating
Reserve Credits PercentDay-Ahead 200,618 74,729 37.2%Real-Time 197,748 69,454 35.1%
Table 4-24 shows PJM’s economic and noneconomic generation by hour eligible for operating reserve credits. In the first three months of 2016, 88.1 percent of the day-ahead generation eligible for operating reserve credits was economic and 74.0 percent of the real-time generation eligible for operating reserve credits was economic. A unit’s generation may be noneconomic for a portion of their daily generation and economic for the rest. Table 4-24 shows the separate amounts of economic and noneconomic generation even if the daily generation was economic.
8 In the Day-Ahead Energy Market only pool-scheduled resources are eligible for day-ahead operating reserve credits. In the Real-Time Energy Market only pool-scheduled resources that operate as requested by PJM are eligible for balancing operating reserve credits.

2016 Quarterly State of the Market Report for PJM: January through March
174 Section 4 Energy Uplift © 2016 Monitoring Analytics, LLC
Table 4‑24 Day‑ahead and real‑time economic and noneconomic generation from units eligible for operating reserve credits (GWh): January through March 2015
Energy MarketEconomic
GenerationNoneconomic
GenerationEconomic
Generation PercentNoneconomic
Generation PercentDay-Ahead 65,842 8,887 88.1% 11.9%Real-Time 51,366 18,089 74.0% 26.0%
Noneconomic generation only leads to operating reserve credits when units’ generation for the day or segment, scheduled or committed, is noneconomic, including no load and startup costs. Table 4-25 shows the generation receiving day-ahead and balancing operating reserve credits. In the first three months of 2016, 4.0 percent of the day-ahead generation eligible for operating reserve credits received credits and 3.4 percent of the real-time generation eligible for operating reserve credits was made whole.
Table 4‑25 Day‑ahead and real‑time generation receiving operating reserve credits (GWh): January through March 2015
Energy MarketGeneration Eligible for
Operating Reserve CreditsGeneration Receiving
Operating Reserve Credits
Generation Receiving Operating Reserve Credits
PercentDay-Ahead 74,729 2,979 4.0%Real-Time 69,454 1,763 2.5%
Day-Ahead Unit Commitment for ReliabilityPJM may schedule units as must run in the Day-Ahead Energy Market when needed in real time to address reliability issues of various types. PJM puts such reliability issues in four categories: voltage issues (high and low); black start requirements (from automatic load rejection (ALR) units); local contingencies not modeled in the Day-Ahead Energy Market; and long lead time units not able to be scheduled in the Day-Ahead Energy Market.9 Participants can submit units as self-scheduled (must run), meaning that the unit must be committed, but a unit submitted as must run by a participant is not eligible for day-ahead
9 See PJM. “Item 12 - October 2012 MIC DAM Cost Allocation,” PJM Presentation to the Market Implementation Committee (October 12, 2012) <http://www.pjm.com/~/media/committees-groups/committees/mic/20121010/20121010-minutes.ashx>.
operating reserve credits.10 Units scheduled as must run by PJM may set LMP if raised above economic minimum and following the dispatch signal and are eligible for day-ahead operating reserve credits. Table 4-26 shows the total day-ahead generation and the subset of that generation scheduled as must run by PJM. In the first three months of 2016, 1.5 percent of the total day-ahead generation was scheduled as must run by PJM, 1.7 percentage points lower than the first three months of 2015.
Table 4‑26 Day‑ahead generation scheduled as must run by PJM (GWh): 2015 and 2016
2015 2016Total Day‑
Ahead Generation
Day‑Ahead PJM Must Run
Generation Share
Total Day‑Ahead
Generation
Day‑Ahead PJM Must Run
Generation ShareJan 77,937 2,143 2.7% 73,821 935 1.3% Feb 74,224 2,904 3.9% 66,367 979 1.5% Mar 68,201 1,857 2.7% 60,431 1,047 1.7% Apr 55,957 1,138 2.0% May 61,955 1,523 2.5% Jun 68,558 1,447 2.1% Jul 75,490 1,201 1.6% Aug 73,934 922 1.2% Sep 66,927 616 0.9% Oct 58,731 763 1.3% Nov 58,517 486 0.8% Dec 62,976 551 0.9% Total (Jan - Mar) 220,362 6,904 3.1% 200,618 2,961 1.5% Total 803,408 15,552 1.9% 200,618 2,961 1.5%
Pool-scheduled units are made whole in the Day-Ahead Energy Market if their total offer (including no load and startup costs) is greater than the revenues from the Day-Ahead Energy Market. Such units are paid day-ahead operating reserve credits. Pool-scheduled units scheduled as must run by PJM are only paid day-ahead operating reserve credits when their total offer is greater than the revenues from the Day-Ahead Energy Market.
10 See PJM. “PJM eMkt Users Guide,” Section Managing Unit Data (version July 9, 2015) p. 42, <http://www.pjm.com/~/media/etools/emkt/ts-userguide.ashx>.

Section 4 Energy Uplift
2016 Quarterly State of the Market Report for PJM: January through March 175© 2016 Monitoring Analytics, LLC
It is illogical and unnecessary to pay units day-ahead operating reserves because units do not incur any costs to run and any revenue shortfalls are addressed by balancing operating reserve payments.
Table 4-27 shows the total day-ahead generation scheduled as must run by PJM by category. In the first three months of 2016, 56.4 percent of the day-ahead generation scheduled as must run by PJM received operating reserve credits, all paid through normal day-ahead operating reserve credits, not black start or reactive services. The remaining 43.6 percent of the day-ahead generation scheduled as must run by PJM did not need to be made whole.
Table 4‑27 Day‑ahead generation scheduled as must run by PJM by category (GWh): January through March 2016
Black Start Services
Reactive Services
Day‑Ahead Operating Reserves Economic Total
Jan 0 0 375 560 935Feb 0 0 584 395 979Mar 0 0 712 335 1,047Total (Jan - Mar) 0 0 1,671 1,291 2,961Share 0.0% 0.0% 56.4% 43.6% 100.0%
Total day-ahead operating reserve credits in the first three months of 2016 were $21.3 million, of which $18.2 million or 85.3 percent was paid to units scheduled as must run by PJM, and not scheduled to provide black start or reactive services.
Geography of Charges and CreditsTable 4-28 shows the geography of charges and credits in the first three months of 2016. Table 4-28 includes only day-ahead operating reserve charges and balancing operating reserve reliability and deviation charges since these categories are allocated regionally, while other charges, such as reactive services, synchronous condensing and black start services are allocated by control zone, and balancing local constraint charges are charged to the requesting party.
Charges are categorized by the location (control zone, hub, aggregate or interface) where they are allocated according to PJM’s operating reserve rules. Credits are categorized by the location where the resources are located. The shares columns reflect the operating reserve credits and charges balance for each location. For example, transactions in the AEP Control Zone paid 14.8 percent of all operating reserve charges allocated regionally, and resources in the AEP Control Zone were paid 6.1 percent of the corresponding credits. The AEP Control Zone received less operating reserve credits than operating reserve charges paid and had 16.0 percent of the deficit. The deficit is the sum of the negative entries in the balance column. Transactions in the PSEG Control Zone paid 5.1 percent of all operating reserve charges allocated regionally, and resources in the PSEG Control Zone were paid 16.5 percent of the corresponding credits. The PSEG Control Zone received more operating reserve credits than operating reserve charges paid and had 20.9 percent of the surplus. The surplus is the sum of the positive entries in the balance column. Table 4-28 also shows that 91.2 percent of all charges were allocated in control zones, 4.1 percent in hubs and aggregates and 4.7 percent in interfaces.

2016 Quarterly State of the Market Report for PJM: January through March
176 Section 4 Energy Uplift © 2016 Monitoring Analytics, LLC
Table 4‑28 Geography of regional charges and credits: January through March 2015Shares
Location Charges (Millions) Credits (Millions) Balance Total Charges Total Credits Deficit SurplusZones AECO $0.5 $1.5 $1.0 1.4% 3.9% 0.0% 4.6%
AEP $5.1 $1.9 ($3.2) 13.2% 4.8% 15.4% 0.0%AP $2.1 $0.7 ($1.4) 5.4% 1.7% 6.7% 0.0%ATSI $2.6 $0.4 ($2.2) 6.7% 1.0% 10.3% 0.0%BGE $1.9 $10.9 $9.1 4.8% 28.2% 0.0% 42.8%ComEd $3.8 $1.7 ($2.1) 9.9% 4.4% 10.0% 0.0%DAY $0.7 $0.5 ($0.2) 1.8% 1.4% 0.7% 0.0%DEOK $1.0 $0.2 ($0.8) 2.6% 0.6% 3.7% 0.0%DLCO $0.5 $0.1 ($0.4) 1.4% 0.3% 2.0% 0.0%Dominion $4.5 $3.3 ($1.1) 11.6% 8.6% 5.4% 0.0%DPL $1.0 $3.6 $2.6 2.7% 9.4% 0.0% 12.3%EKPC $0.6 $0.5 ($0.1) 1.6% 1.3% 0.6% 0.0%External ($0.0) $0.1 $0.1 -0.0% 0.2% 0.0% 0.3%JCPL $1.1 $0.3 ($0.8) 2.8% 0.8% 3.6% 0.0%Met-Ed $0.8 $0.3 ($0.5) 2.1% 0.7% 2.5% 0.0%PECO $2.0 $0.1 ($1.9) 5.1% 0.2% 8.9% 0.0%PENELEC $1.1 $0.3 ($0.8) 2.9% 0.8% 3.9% 0.0%Pepco $1.6 $5.7 $4.1 4.2% 14.6% 0.0% 19.2%PPL $2.3 $0.2 ($2.1) 5.8% 0.5% 9.8% 0.0%PSEG $2.0 $6.4 $4.4 5.1% 16.5% 0.0% 20.8%RECO $0.1 $0.0 ($0.1) 0.2% 0.0% 0.3% 0.0%All Zones $35.3 $38.7 $3.4 91.1% 100.0% 69.8% 60.0%
Hubs and AEP - Dayton $0.1 $0.0 ($0.1) 0.2% 0.0% 0.3% 0.0%Aggregates Dominion $0.1 $0.0 ($0.1) 0.2% 0.0% 0.3% 0.0%
Eastern $0.0 $0.0 ($0.0) 0.1% 0.0% 0.2% 0.0%New Jersey $0.0 $0.0 ($0.0) 0.1% 0.0% 0.2% 0.0%Ohio $0.0 $0.0 ($0.0) 0.0% 0.0% 0.0% 0.0%Western Interface $0.0 $0.0 ($0.0) 0.0% 0.0% 0.1% 0.0%Western $1.4 $0.0 ($1.4) 3.6% 0.0% 6.5% 0.0%RTEP B0328 Source $0.0 $0.0 $0.0 0.0% 0.0% 0.0% 0.0%All Hubs and Aggregates $1.6 $0.0 ($1.6) 4.2% 0.0% 7.6% 0.0%
Interfaces CPLE Imp $0.0 $0.0 $0.0 0.0% 0.0% 0.0% 0.0%Hudson $0.0 $0.0 ($0.0) 0.0% 0.0% 0.0% 0.0%IMO $0.2 $0.0 ($0.2) 0.4% 0.0% 0.8% 0.0%Linden $0.1 $0.0 ($0.1) 0.2% 0.0% 0.4% 0.0%MISO $0.4 $0.0 ($0.4) 1.1% 0.0% 1.9% 0.0%Neptune $0.2 $0.0 ($0.2) 0.5% 0.0% 0.9% 0.0%NIPSCO $0.0 $0.0 ($0.0) 0.0% 0.0% 0.0% 0.0%Northwest $0.0 $0.0 ($0.0) 0.1% 0.0% 0.2% 0.0%NYIS $0.3 $0.0 ($0.3) 0.9% 0.0% 1.6% 0.0%OVEC $0.0 $0.0 ($0.0) 0.1% 0.0% 0.2% 0.0%South Exp $0.1 $0.0 ($0.1) 0.2% 0.0% 0.4% 0.0%South Imp $0.5 $0.0 ($0.5) 1.2% 0.0% 2.3% 0.0%All Interfaces $1.8 $0.0 ($1.8) 4.7% 0.0% 8.6% 0.0%Total $38.7 $38.7 $0.0 100.0% 100.0% 86.0% 60.0%
Section 4 Energy Uplift
2016 Quarterly State of the Market Report for PJM: January through March 177© 2016 Monitoring Analytics, LLC
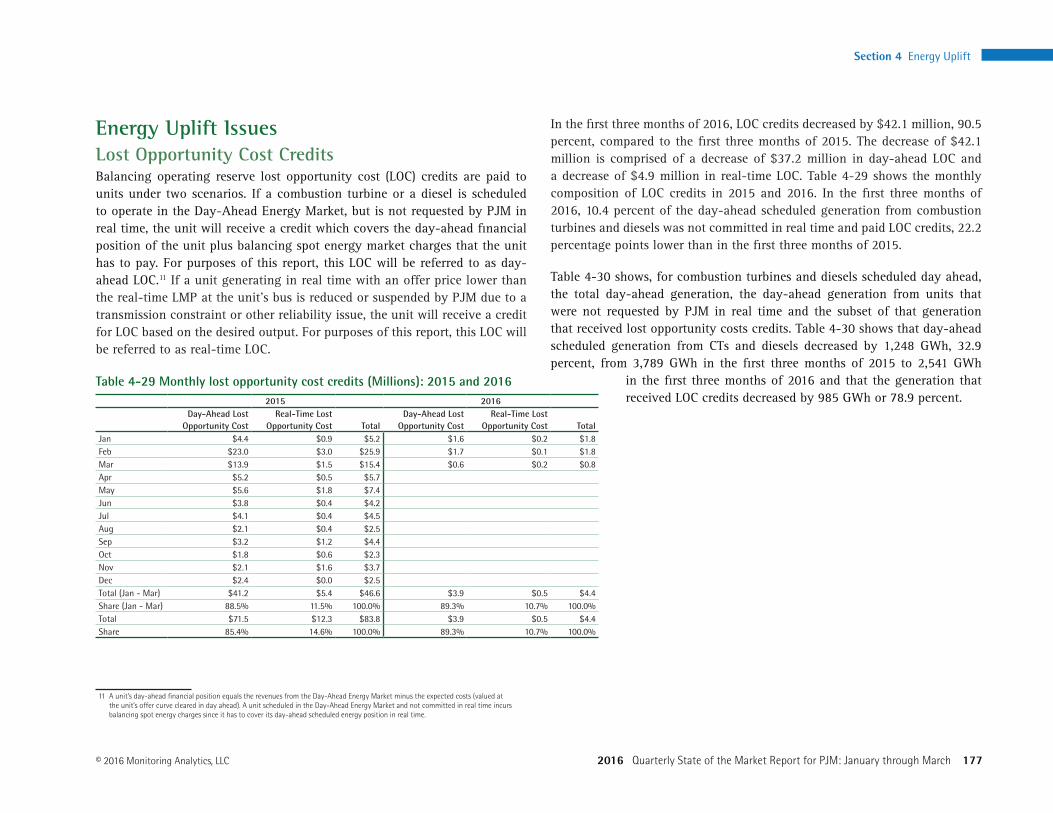
Energy Uplift IssuesLost Opportunity Cost CreditsBalancing operating reserve lost opportunity cost (LOC) credits are paid to units under two scenarios. If a combustion turbine or a diesel is scheduled to operate in the Day-Ahead Energy Market, but is not requested by PJM in real time, the unit will receive a credit which covers the day-ahead financial position of the unit plus balancing spot energy market charges that the unit has to pay. For purposes of this report, this LOC will be referred to as day-ahead LOC.11 If a unit generating in real time with an offer price lower than the real-time LMP at the unit’s bus is reduced or suspended by PJM due to a transmission constraint or other reliability issue, the unit will receive a credit for LOC based on the desired output. For purposes of this report, this LOC will be referred to as real-time LOC.
Table 4‑29 Monthly lost opportunity cost credits (Millions): 2015 and 20162015 2016
Day‑Ahead Lost Opportunity Cost
Real‑Time Lost Opportunity Cost Total
Day‑Ahead Lost Opportunity Cost
Real‑Time Lost Opportunity Cost Total
Jan $4.4 $0.9 $5.2 $1.6 $0.2 $1.8 Feb $23.0 $3.0 $25.9 $1.7 $0.1 $1.8 Mar $13.9 $1.5 $15.4 $0.6 $0.2 $0.8 Apr $5.2 $0.5 $5.7 May $5.6 $1.8 $7.4 Jun $3.8 $0.4 $4.2 Jul $4.1 $0.4 $4.5 Aug $2.1 $0.4 $2.5 Sep $3.2 $1.2 $4.4 Oct $1.8 $0.6 $2.3 Nov $2.1 $1.6 $3.7 Dec $2.4 $0.0 $2.5 Total (Jan - Mar) $41.2 $5.4 $46.6 $3.9 $0.5 $4.4 Share (Jan - Mar) 88.5% 11.5% 100.0% 89.3% 10.7% 100.0%Total $71.5 $12.3 $83.8 $3.9 $0.5 $4.4 Share 85.4% 14.6% 100.0% 89.3% 10.7% 100.0%
11 A unit’s day-ahead financial position equals the revenues from the Day-Ahead Energy Market minus the expected costs (valued at the unit’s offer curve cleared in day ahead). A unit scheduled in the Day-Ahead Energy Market and not committed in real time incurs balancing spot energy charges since it has to cover its day-ahead scheduled energy position in real time.
In the first three months of 2016, LOC credits decreased by $42.1 million, 90.5 percent, compared to the first three months of 2015. The decrease of $42.1 million is comprised of a decrease of $37.2 million in day-ahead LOC and a decrease of $4.9 million in real-time LOC. Table 4-29 shows the monthly composition of LOC credits in 2015 and 2016. In the first three months of 2016, 10.4 percent of the day-ahead scheduled generation from combustion turbines and diesels was not committed in real time and paid LOC credits, 22.2 percentage points lower than in the first three months of 2015.
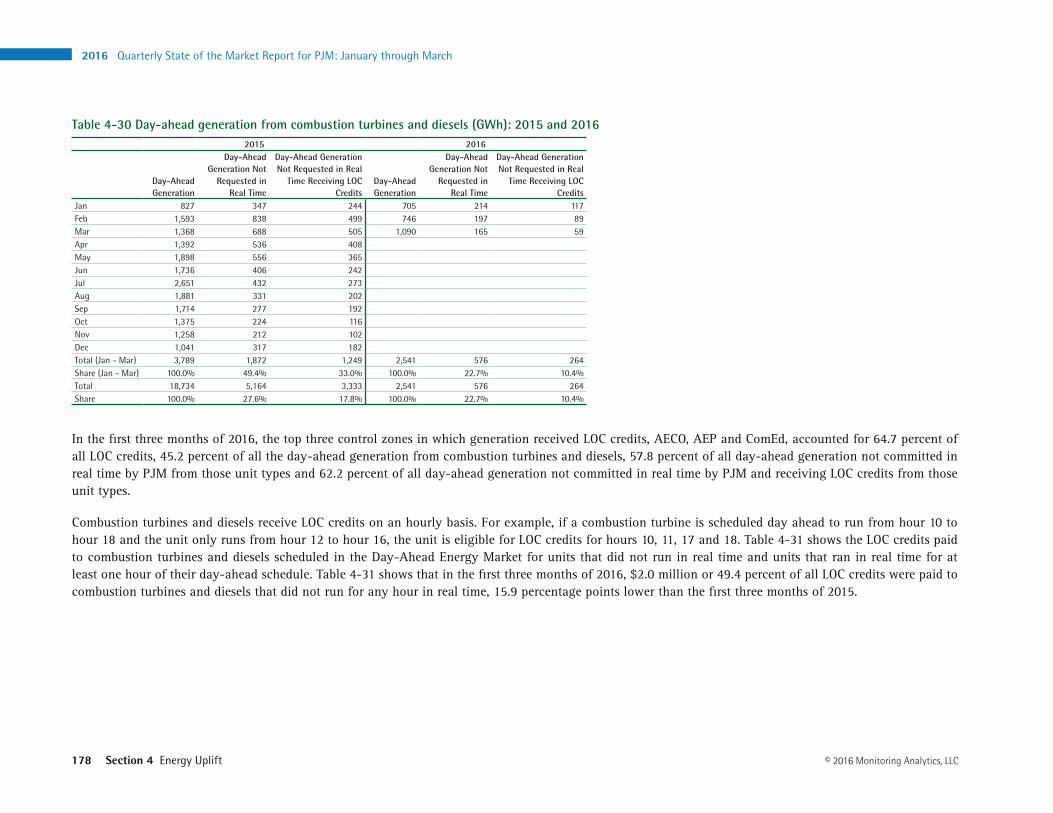
Table 4-30 shows, for combustion turbines and diesels scheduled day ahead, the total day-ahead generation, the day-ahead generation from units that were not requested by PJM in real time and the subset of that generation that received lost opportunity costs credits. Table 4-30 shows that day-ahead scheduled generation from CTs and diesels decreased by 1,248 GWh, 32.9 percent, from 3,789 GWh in the first three months of 2015 to 2,541 GWh
in the first three months of 2016 and that the generation that received LOC credits decreased by 985 GWh or 78.9 percent.
2016 Quarterly State of the Market Report for PJM: January through March
178 Section 4 Energy Uplift © 2016 Monitoring Analytics, LLC
Table 4‑30 Day‑ahead generation from combustion turbines and diesels (GWh): 2015 and 20162015 2016
Day‑Ahead Generation
Day‑Ahead Generation Not
Requested in Real Time
Day‑Ahead Generation Not Requested in Real
Time Receiving LOC Credits
Day‑Ahead Generation
Day‑Ahead Generation Not
Requested in Real Time
Day‑Ahead Generation Not Requested in Real
Time Receiving LOC Credits
Jan 827 347 244 705 214 117 Feb 1,593 838 499 746 197 89 Mar 1,368 688 505 1,090 165 59 Apr 1,392 536 408May 1,898 556 365Jun 1,736 406 242Jul 2,651 432 273Aug 1,881 331 202Sep 1,714 277 192Oct 1,375 224 116Nov 1,258 212 102Dec 1,041 317 182Total (Jan - Mar) 3,789 1,872 1,249 2,541 576 264Share (Jan - Mar) 100.0% 49.4% 33.0% 100.0% 22.7% 10.4%Total 18,734 5,164 3,333 2,541 576 264Share 100.0% 27.6% 17.8% 100.0% 22.7% 10.4%
In the first three months of 2016, the top three control zones in which generation received LOC credits, AECO, AEP and ComEd, accounted for 64.7 percent of all LOC credits, 45.2 percent of all the day-ahead generation from combustion turbines and diesels, 57.8 percent of all day-ahead generation not committed in real time by PJM from those unit types and 62.2 percent of all day-ahead generation not committed in real time by PJM and receiving LOC credits from those unit types.
Combustion turbines and diesels receive LOC credits on an hourly basis. For example, if a combustion turbine is scheduled day ahead to run from hour 10 to hour 18 and the unit only runs from hour 12 to hour 16, the unit is eligible for LOC credits for hours 10, 11, 17 and 18. Table 4-31 shows the LOC credits paid to combustion turbines and diesels scheduled in the Day-Ahead Energy Market for units that did not run in real time and units that ran in real time for at least one hour of their day-ahead schedule. Table 4-31 shows that in the first three months of 2016, $2.0 million or 49.4 percent of all LOC credits were paid to combustion turbines and diesels that did not run for any hour in real time, 15.9 percentage points lower than the first three months of 2015.

Section 4 Energy Uplift
2016 Quarterly State of the Market Report for PJM: January through March 179© 2016 Monitoring Analytics, LLC
Table 4‑31 Lost opportunity cost credits paid to combustion turbines and diesels by scenario (Millions): 2015 and 2016
2015 2016
Units that did not run in real time
Units that ran in real time for at least one hour of
their day‑ahead schedule TotalUnits that did not
run in real time
Units that ran in real time for at least one hour of
their day‑ahead schedule TotalJan $2.4 $2.0 $4.4 $0.9 $0.7 $1.6 Feb $15.4 $7.5 $23.0 $0.8 $0.9 $1.7 Mar $9.1 $4.8 $13.9 $0.2 $0.4 $0.6 Apr $3.0 $2.2 $5.2 May $3.0 $2.6 $5.6 Jun $2.2 $1.6 $3.8 Jul $2.5 $1.6 $4.1 Aug $1.3 $0.8 $2.1 Sep $1.7 $1.5 $3.2 Oct $1.0 $0.8 $1.8 Nov $1.2 $0.9 $2.1 Dec $1.8 $0.6 $2.4 Total (Jan - Mar) $26.9 $14.3 $41.2 $2.0 $2.0 $3.9 Share (Jan - Mar) 65.3% 34.7% 100.0% 49.4% 50.6% 100.0%Total $44.6 $27.0 $71.5 $2.0 $2.0 $3.9 Share 62.3% 37.7% 100.0% 49.4% 50.6% 100.0%
Table 4‑32 Day‑ahead generation (GWh) from combustion turbines and diesels receiving lost opportunity cost credits by value: 2015 and 201612
2015 2016Economic Scheduled
Generation (GWh)Noneconomic Scheduled
Generation (GWh) Total (GWh)Economic Scheduled
Generation (GWh)Noneconomic Scheduled
Generation (GWh) Total (GWh)Jan 246 102 348 144 43 187Feb 497 335 832 102 60 161Mar 543 140 682 62 64 126Apr 366 168 534May 280 258 538Jun 240 125 365Jul 259 124 383Aug 163 123 286Sep 217 74 292Oct 149 59 208Nov 121 70 191Dec 214 75 289Total (Jan - Mar) 1,285 576 1,861 307 167 474Share (Jan - Mar) 69.1% 30.9% 100.0% 64.8% 35.2% 100.0%Total 3,294 1,653 4,946 307 167 474Share 66.6% 33.4% 100.0% 64.8% 35.2% 100.0%
12 The total generation in Table 4-32 is lower than the day-ahead generation not requested in real time in Table 4-30 because the former only includes generation from units that received lost opportunity costs during at least one hour of the day. Table 4-32 includes all generation, including generation from units that were not committed in real time and did not receive LOC credits.
PJM may not run units in real time if the real-time value of the energy (generation multiplied by the real-time LMP) is lower than the units’ total offer (including no load and startup costs). Table 4-32 shows the total day-ahead generation from combustion turbines and diesels that were not committed in real time by PJM and received LOC credits. Table 4-32 shows the scheduled generation that had a total offer (including no load and startup costs) lower than its real-time value (generation multiplied by the real-time LMP), defined here as economic scheduled generation, and the scheduled generation that had a total offer greater than its real-time value or noneconomic scheduled generation. In the first three months of 2016, 64.8 percent of the scheduled generation not committed by PJM from units receiving LOC credits was economic and the remaining 35.2 percent was noneconomic.
The MMU recommends that PJM initiate an analysis of the reasons why some combustion turbines and diesels scheduled in the Day-Ahead Energy Market are not committed by PJM in real time when they are economic.
Closed Loop InterfacesPJM implemented closed loop interfaces with the stated purpose of improving the incorporation of reactive constraints into energy prices and to allow emergency DR to set price.13 PJM applies closed loop interfaces so that it can use units needed for reactive support to set the energy price when they would not
13 See PJM/Alstom. “Approaches to Reduce Energy Uplift and PJM Experiences,” presented at the FERC Technical Conference: Increasing Real-Time and Day-Ahead Market Efficiency Through Improved Software in Docket No. AD10-12-006 <http://www.ferc.gov/june-tech-conf/2015/presentations/m2-3.pdf> (June 23, 2015).

2016 Quarterly State of the Market Report for PJM: January through March
180 Section 4 Energy Uplift © 2016 Monitoring Analytics, LLC
otherwise set price under the LMP algorithm. PJM also applies closed loop interfaces so that it can use emergency DR resources to set the real-time LMP when DR resources would not otherwise set price under the fundamental LMP logic. Of the 17 closed loop interface definitions, 11(65 percent) were created for the purpose of allowing emergency DR to set price.
Closed loop interfaces are used to model the transfer capability into a specific area. Areas or regions are defined in PJM by hubs, aggregates or control zones, all comprised of buses. Closed loop interfaces are not defined by buses, but defined by the transmission facilities that connect the buses inside the loop with the rest of PJM. PJM reduces the interface real transfer capability to a level that will artificially make marginal the resource selected by PJM. Table 4-33 shows the closed loop interfaces that PJM has defined.
Table 4‑33 PJM closed loop interfaces14 15 16
Interface Control Zone(s) Objective Effective Date Limit CalculationAPS-East AP Allow emergency DR resources / unit(s) needed for reactive to set real-time LMP June 19, 2015 Limit equal to actual flowATSI ATSI Allow emergency DR resources / unit(s) needed for reactive to set real-time LMP July 17, 2013 Limit equal to actual flowBC BGE Allow emergency DR resources / unit(s) needed for reactive to set real-time LMP June 19, 2015 Limit equal to actual flowBC/PEP BGE and Pepco Reactive Interface (not an IROL). Used to model import capability into the BGE/PEPCO/Doubs/Northern Virginia area NA PJM Transfer Limit CalculatorBlack River ATSI Allow emergency DR resources set real-time LMP September 1, 2014 Limit equal to actual flowCleveland ATSI Reactive Interface (IROL) NA PJM Transfer Limit CalculatorCOMED ComEd Reactive Interface (IROL) NA PJM Transfer Limit CalculatorDOM-Chesapeake Dominion Allow emergency DR resources / unit(s) needed for reactive to set real-time LMP August 14, 2015 Limit equal to actual flowDPL DPL Allow emergency DR resources / unit(s) needed for reactive to set real-time LMP June 19, 2015 Limit equal to actual flowNew Castle ATSI Allow emergency DR resources set real-time LMP July 1, 2014 Limit equal to actual flowPENELEC PENELEC Allow emergency DR resources / unit(s) needed for reactive to set real-time LMP April 22, 2015 Limit equal to actual flowPepco Pepco Allow emergency DR resources / unit(s) needed for reactive to set real-time LMP June 19, 2015 Limit equal to actual flowPL-Wescosville PPL Allow emergency DR resources / unit(s) needed for reactive to set real-time LMP July 24, 2014 Limit equal to actual flowPN-Erie PENELEC Allow emergency DR resources set real-time LMP April 22, 2015 Limit equal to actual flowPS North PSEG Objective not identified. Interface was modeled in 2014/2015 Annual FTR auction NA NASeneca PENELEC Allow unit(s) needed for reactive to set day-ahead and real-time LMP February 1, 2014 Limit equal to actual flowWarren PENELEC Allow unit(s) needed for reactive to set day-ahead and real-time LMP September 26, 2014 Limit equal to actual flow
Figure 4-7 shows the approximate geographic location of PJM’s closed loop interfaces.14 See PJM. “Manual 3: Transmission Operations,” Revision 48 (December 1, 2015) at “Section 3.8: Transfer Limits (Reactive/Voltage Transfer
Limits),” for a description of reactive interfaces.15 See closed loop interfaces definitions at <http://www.pjm.com/markets-and-operations/etools/oasis/system-information.aspx>.16 See the PS North interface definition at <http://www.pjm.com/pub/account/auction-user-info/model-annual/Annual-PJM-interface-
definitions-limits.csv>.
Figure 4‑7 PJM Closed loop interfaces map
Section 4 Energy Uplift
2016 Quarterly State of the Market Report for PJM: January through March 181© 2016 Monitoring Analytics, LLC
PJM’s uses closed loop interfaces to artificially use the strike price of emergency DR to set LMP. This use of closed loop interfaces permits subjective price setting by PJM. PJM has not explained why the economic fundamentals require that DR strike prices set LMP when the resource is not marginal. Although DR should be nodal, DR is not nodal and cannot routinely set price in an LMP model. The MMU has recommended that DR be nodal so that it can set price when appropriate. The current PJM rules permit emergency DR to set a strike price as high as $1,849. There are no incentives for DR to set strike prices at an economically rational level because emergency DR is guaranteed the payment of its strike price whenever called. The MMU has recommended that emergency DR have an offer cap no higher than generation resources, that emergency DR be required to make offers in the Day-Ahead Energy Market like other capacity resources and the emergency DR be paid LMP rather than a guaranteed strike price when called on. PJM’s use of closed loop interfaces is a result of significant deficiencies in the rules governing DR. PJM’s use of closed loop interfaces is also a result of significant issues with PJM’s scarcity pricing model which is not adequately locational. PJM uses closed loop interfaces and emergency DR strike prices as a substitute for improved scarcity pricing.
In a DC power flow model, such as the one used by PJM for dispatch and pricing, units scheduled for reactive support are only marginal when they are needed to supply energy above their economic minimum. With the use of closed loop interface, these units are forced to be marginal in the model even when not needed for energy, by adjusting the limit of the closed loop interface. This artificially creates congestion in the area that can only be relieved by the units providing reactive support inside the loop. The goal is to reduce energy uplift from the noneconomic operation of units needed for reactive support by forcing these units to be marginal when they are not, raising energy prices and thereby reducing uplift.17
The MMU has recommended and supports PJM’s goal of having dispatcher decisions reflected in transparent market outcomes, preferably LMP, to the maximum extent possible and to minimize the level and rate of energy uplift 17 See “PJM Price-Setting Changes,” presented to the EMUSTF at <http://www.pjm.com/~/media/committees-groups/task-forces/
emustf/20131220/20131220-item-02c-price-setting-option.ashx>.
charges. But part of that goal is to avoid distortion of the way in which the transmission network is modeled. The use of closed loop interfaces is a distortion of the model.
The MMU recommends that PJM not use closed loop interface constraints to artificially override the nodal prices that are based on fundamental LMP logic in order to: accommodate rather than resolve the inadequacies of the demand side resource capacity product; address the inability of the power flow model to incorporate the need for reactive power; accommodate rather than resolve the flaws in PJM’s approach to scarcity pricing; or for any other reason.
Market prices should be a function of market fundamentals and energy market prices should be a function of energy market fundamentals. PJM has not explained why the other consequences of deviating from market fundamentals do not outweigh any benefits of artificially creating constraints in order to let reactive resources set price when they are not in fact marginal. PJM has not explained why the use of closed loop interfaces to permit emergency DR to set price is not simply a crude workaround to a viable solution, consistent with the LMP model, which would be to make DR nodal. The need for closed loop interfaces to let emergency DR set price is primarily a result of the fact that DR is zonal, or subzonal with one day’s notice, and therefore cannot be dispatched nodally or set price nodally. The reduction of uplift is a reasonable goal in general, but the reduction of uplift is not a goal that justifies creating distortions in the price setting mechanism.
Price Setting LogicIn November 2014, PJM implemented a software change to its day ahead and real time market solution tools that would enable PJM to reduce energy uplift by artificially selecting the marginal unit for any constraint. The goal is to make marginal any unit committed by PJM to provide reactive services, black start or transmission constraint relief if such unit would otherwise run with an incremental offer greater than the correctly calculated LMP. PJM calls this approach price setting logic.
2016 Quarterly State of the Market Report for PJM: January through March
182 Section 4 Energy Uplift © 2016 Monitoring Analytics, LLC
The application of the price setting logic reduces energy uplift payments by artificially increasing the LMP. The price setting logic is a form of subjective pricing because it varies from fundamental LMP logic based on an administrative decision to reduce energy uplift.
PJM and Alstom presented examples of this approach at the FERC Technical Conference: Increasing Real-Time and Day-Ahead Market Efficiency Through Improved Software.18 The presentation shows a two bus model connected by one transmission line, three generators (A, B and C) and load at one of the buses. In the solution based on the fundamental LMP logic that PJM has used since the inception of markets, two of the generators are committed (A at 50 MW and B at 50 MW) to serve load (100 MW). The LMP is set at $50 per MWh (the offer of generator A) at both buses. Generator B has to be made whole (paid energy uplift) because the LMP ($50 per MWh) does not cover the generator’s offer ($100 per MWh). Generator B does not set the LMP because its economic minimum is higher than the relief needed to relieve the constraint. This solution is not acceptable for PJM because the most expensive generator would have to be made whole. In order to reduce energy uplift, PJM shows two alternatives. Solution 2: Reduce the economic minimum of generator B to zero MW. Solution 3: Reduce the limit of the transmission line to a level that would make the LMP higher at the bus where the most expensive generator is connected.
In solution 2, generator B is dispatched at 10 MW, despite the fact that this is physically impossible. This allows generator A to increase its output to 80 MW, which makes the transmission constraint binding and causes price separation between the two buses. This is an artificial result, not consistent with actual dispatch, designed to achieve an administrative goal.
In solution 3, the line limit is reduced from 80 MW to 40 MW, despite the fact that this is not the actual limit. As a result, generator A is dispatched to 40 MW (10 MW less than the original solution), the transmission line constraint is binding and congestion occurs. The goal is met and energy uplift is reduced
18 See PJM/Alstom. “Approaches to Reduce Energy Uplift and PJM Experiences,” presented at the FERC Technical Conference: Increasing Real-Time and Day-Ahead Market Efficiency Through Improved Software in Docket No. AD10-12-006 <http://www.ferc.gov/june-tech-conf/2015/presentations/m2-3.pdf> (June 23, 2015).
to zero because the LMPs at both buses are increased so that they equal or exceed the generators’ offers. Again, this is an artificial result, not consistent with actual dispatch, designed to achieve an administrative goal.
Attempting to reduce uplift at the expense of fundamental LMP logic is not consistent with the objective of clearing the market using a least cost approach. The result of PJM’s price setting logic in this example is to increase total production costs.
The MMU recommends that PJM not use price setting logic to artificially override the nodal prices that are based on fundamental LMP logic in order to reduce uplift.
Confidentiality of Energy Uplift InformationAll data posted publicly by PJM or the MMU must comply with confidentiality rules. Prior to March 31, 2016, confidentiality rules did not allow posting data for three or fewer PJM participants and did not permit aggregation for a geographic area smaller than a control zone.19
Energy uplift charges are out of market, non-transparent payments made to resources operating at PJM’s direction. Energy uplift charges are highly concentrated in a small number of zones and paid to a small number of PJM participants. These costs are not reflected in PJM market prices. Current confidentiality rules prevent the publication of detailed data concerning the reasons and locations of these payments, making it difficult for other participants to compete with the resources receiving energy uplift payments. Uplift charges are not included in the transmission planning process meaning that transmission solutions are not considered. The confidentiality rules were implemented in order to protect competition. The application of confidentiality rules in the case of energy uplift information does exactly the opposite. Energy uplift is not a market and the absence of relevant information creates a barrier to entry. The MMU recommends that PJM revise the current energy uplift confidentiality rules in order to allow the disclosure of energy uplift credits by zone, by owner and by resource. PJM partially 19 See PJM. Manual 33: Administrative Services for the PJM Interconnection Operating Agreement, Revision 12 (March 31, 2016)at “Market
Data Postings.”

Section 4 Energy Uplift
2016 Quarterly State of the Market Report for PJM: January through March 183© 2016 Monitoring Analytics, LLC
adopted the MMU recommendation at the March 31, 2016, Markets and Reliability Committee (MRC).20 PJM adopted a rule permitting the posting of energy uplift information by control zone, regardless of the number of PJM participants receiving energy uplift payments in that control zone.
Energy Uplift RecommendationsRecommendations for Calculation of Credits
Day-Ahead Operating Reserve EliminationThe only reason to pay energy uplift in the Day-Ahead Energy Market is that a day-ahead schedule could cause a unit to incur losses as a result of differences between the Day-Ahead and Balancing Markets. Units cannot incur losses in the Day-Ahead Energy Market. Units do not incur costs in the Day-Ahead Energy Market. There is no reason to pay energy uplift in the Day-Ahead Energy Market. All energy uplift should be paid in real time including energy uplift that results from differences between day-ahead and real-time schedules. Paying energy uplift in the Day-Ahead Energy Market results in overpayments.
Day-ahead operating reserve credits are paid to market participants under specific conditions in order to ensure that units are not scheduled in the Day-Ahead Energy Market by PJM to operate at a loss in real time. Balancing operating reserve credits are paid to market participants under specific conditions in order to ensure that units are not operated by PJM at a loss in real time. Units are paid day-ahead operating reserve credits whenever their total offer (including no load and startup costs and based on their day-ahead scheduled output) is not covered by the day-ahead energy revenues (day-ahead LMP times day-ahead scheduled output). Units are paid balancing operating reserve credits whenever their total offer (including no load and startup costs and based on their real-time output) are not covered by their day-ahead energy revenues, balancing energy revenues and a subset of net ancillary services revenues.21
20 See the Markets and Reliability Committee (March 31, 2016) minutes <http://www.pjm.com/~/media/committees-groups/committees/mrc/20160418-special/20160418-item-01-draft-minutes-mrc.ashx>
21 The balancing operating reserve credit calculation includes net DASR revenues, net synchronized reserve revenues, net non-synchronized reserve revenues and reactive services revenues.
Units scheduled in the Day-Ahead Energy Market do not operate until committed or dispatched in real time. Therefore, it cannot be determined if a unit was operated at a loss until the unit actually operates or does not operate. The current operating reserve rules governing the day-ahead operating reserve credits assume that units are going to operate exactly as scheduled because they are made whole based on their day-ahead scheduled output. A unit’s real-time output may be greater or lower than their day-ahead scheduled output. Units dispatched in real time by PJM above their day-ahead scheduled output could be paid energy uplift in the form of balancing operating reserve credits if by increasing their output they operate at a loss because their offers are greater than the real-time LMP. Units dispatched in real time by PJM below their day-ahead scheduled output could be paid energy uplift in the form of balancing operating reserve credits if by decreasing their output the units operate at a loss or incur opportunity costs because real-time LMP is greater than the day-ahead LMP. The balancing operating reserve credits and lost opportunity costs credits ensure that units recover their total offers or keep their net revenues in real time.
Units scheduled in the Day-Ahead Energy Market that receive day-ahead operating reserve credits and for which real-time operation results in additional losses, are paid energy uplift in the form of balancing operating reserve or lost opportunity cost credits to ensure that they do not operate at a loss. This determination is not symmetrical because units scheduled in the Day-Ahead Energy Market that receive day-ahead operating reserve credits and for which real-time operation results in reduced losses or not loss do not have a reduction in energy uplift payments.
Units that follow PJM dispatch instructions are made whole through operating reserve credits to ensure that they do not operate at a loss. In order to determine if a unit operated at a loss, it needs to be committed or dispatched. The day-ahead scheduled output is one of PJM’s dispatch instructions, but it does not determine if a unit actually operated at a loss. In order to determine if a unit operated at a loss it is necessary to take into account the unit’s real-time output and both the day-ahead and balancing energy revenues and ancillary services net revenues.

2016 Quarterly State of the Market Report for PJM: January through March
184 Section 4 Energy Uplift © 2016 Monitoring Analytics, LLC
In order to properly compensate units, the MMU recommended enhancing the day-ahead operating reserve credits calculation to ensure that units receive an energy uplift payment based on their real-time output and not their day-ahead scheduled output whenever their real time operation results in a lower loss or no loss at all. The MMU also recommended including net DASR revenues as part of the offsets used in determining day-ahead operating reserve credits.22 These recommendations are superseded by the MMU’s recommendation to eliminate day-ahead operating reserve payments.23 The elimination of day-ahead operating reserve payments also ensures that units are always made whole based on their actual operation and actual revenues.
The MMU calculated the impact of this recommendation in 2015 and the first three months of 2016. In 2015 and the first three months of 2016, energy uplift costs associated with units scheduled in the Day-Ahead Energy Market would have had been reduced by $29.3 million or 16.4 percent ($2.4 million paid to units providing reactive support, $0.9 million paid to units providing black start support and $26.0 million paid to units as day-ahead and balancing operating reserves).
The elimination of the day-ahead operating reserve category would change the allocation of such charges under the current energy uplift rules. If the day-ahead operating reserve category were eliminated but the MMU’s uplift allocation recommendations were not implemented, units that clear the Day-Ahead Energy Market would be made whole through balancing operating reserve credits, which under the current rules are allocated to deviations or real-time load plus real-time exports. Therefore, this recommendation should be implemented concurrently with the MMU’s allocation recommendations.
Net Regulation Revenues OffsetOn October 1, 2008, PJM filed revisions to the Operating Agreement and Tariff with FERC related to the PJM Regulation Market. The filing included four elements: implement the TPS test in the PJM Regulation Market; increase the
22 See 2013 State of the Market Report for PJM, Volume II Section 4, “Energy Uplift,” at “Day-Operating Reserve Credits,” and at “Net DASR Revenues Offset” for an explanation of these recommendations.
23 PJM agrees with this recommendation. See “Explanation of PJM Proposals,” from the Energy Market Uplift Senior Task Force (April 30, 2014). <http://www.pjm.com/~/media/committees-groups/task-forces/emustf/20140417/20140417-explanation-of-pjm-proposals.ashx>.
regulation offer adder from $7.50 per MW to $12.00 per MW; eliminate the use of net regulation revenues as an offset in the balancing operating reserve calculation; and calculate the lost opportunity cost on the lower of a unit’s price-based or cost-based offer. The four elements were based on a settlement rather than a rational evaluation of an efficient market design.
The elimination of the use of net regulation revenues as an offset in the balancing operating reserve calculation had a direct impact on the level of energy uplift paid to participants that regulate while operating noneconomic. The result of not using the net regulation revenues as an offset in the balancing operating reserve credit calculation is that PJM does not accurately calculate whether a unit is running at a loss. PJM procures energy, regulation, synchronized and non-synchronized reserves in a jointly optimized manner. PJM determines the mix of resources that could provide all of those services in a least-cost manner. Excluding the net regulation revenues from the balancing operating reserve credit calculation is inconsistent with the process used by PJM to procure these services and inconsistent with the basic PJM uplift logic. Whether a unit is running for PJM at a loss defined by marginal costs cannot be determined if some of the revenues are arbitrarily excluded.
Another issue related to this exclusion is the treatment of pool-scheduled units that elect to self-schedule a portion of their capacity for regulation. A unit can be pool-scheduled for energy, which means PJM may commit or dispatch the unit based on economics, but it can also self-schedule some of its capacity for regulation. When this happens the capacity self-scheduled for regulation is treated as a price-taker, but in the energy market any increase in MW to provide regulation are treated as additional costs, which can result in increased balancing operating reserve credits whenever the real-time LMP is lower than the unit’s offer. For example, if a unit raises its economic minimum in order to provide regulation and the additional costs resulting from operating at a higher economic minimum are not covered by the real-time LMP, the unit will be made whole for the additional costs through balancing operating reserve credits.
Section 4 Energy Uplift
2016 Quarterly State of the Market Report for PJM: January through March 185© 2016 Monitoring Analytics, LLC
The MMU recommends reincorporating the use of net regulation revenues as an offset in the calculation of balancing operating reserve credits. In 2015 and the first three months of 2016, using net regulation revenues as an offset in the balancing operating reserve calculation would have resulted in a net decrease of balancing operating reserve charges of $7.5 million, of which $5.8 million or 77.1 percent was due to generators that elected to self-schedule for regulation while noneconomic and receiving balancing operating reserve credits.24
Self Scheduled StartParticipants may offer their units as pool-scheduled (economic) or self-scheduled (must run).25 Units offered as pool-scheduled clear the Day-Ahead Energy Market based on their offers and operate in real time following PJM dispatch instructions. Units offered as self-scheduled clear the Day-Ahead Energy Market regardless of their offers and may operate in real time following PJM dispatch instructions. Units offered as self-scheduled follow PJM dispatch instructions when they are offered with a minimum must run output from which the units may be dispatched up but not down. Self-scheduled units are not eligible to receive day-ahead or balancing operating reserve credits. The current rules determine if a unit is pool-scheduled or self-scheduled for operating reserve credits purposes separately for each hour using the hourly commitment status flag. If the flag is set as economic the unit is assumed to be pool-scheduled, if the flag is set as must run the unit is assumed to be self-scheduled. When a unit submits different flags within a day, the day-ahead operating reserve credit calculation treats each group of hours separately. The day-ahead operating reserve credit calculation only uses the hours flagged as economic and excludes any hours flagged as must run.
Units offered as self-scheduled for some hours of the day and pool-scheduled for the remaining hours are made whole for startup cost when they should not be. For example, if a unit is offered as self-scheduled for hours 10 through 24 and as pool-scheduled for the balance of the day and PJM selects the unit to start for hour nine, the unit will be made whole for its startup cost if the 24 These estimates take into account the elimination of the day-ahead operating reserve category.25 See “PJM eMkt Users Guide,” Section Managing Unit Data (version July 9, 2015) p. 42. <http://www.pjm.com/~/media/etools/emkt/ts-
userguide.ashx>.
hourly revenues do not cover the costs. The only hour used in the day-ahead or balancing operating reserve credit calculation is hour nine because the unit is not eligible for operating reserve credits for hours 10 through 24. The result is that any net revenue from hours 10 through 18 will not be used to offset the unit’s startup cost despite the fact that the unit would have started and incurred those costs regardless of PJM dispatch instructions.
The MMU recommends that self-scheduled units not be paid energy uplift for their startup cost when the units are scheduled by PJM to start before the self-scheduled hours.
Lost Opportunity Cost CalculationThe current energy LOC calculations are inaccurate and create unreasonable compensation. The MMU recommended four modifications, of which three were adopted on September 1, 2015.26 27 The one outstanding modification not adopted by PJM is the calculation of LOC using segments of hours. Current rules calculate LOC on an hourly basis; each hour is treated as a standalone calculation. This means that units receive an LOC payment during hours in which it is economic for them to run and receive the benefit of not being called on during hours in which it is not economic for them to run. PJM dispatchers might make the right decision to not call a unit in real time because the operation of the unit during all the hours in which the unit cleared the Day-Ahead Energy Market would not be economic, but the unit could still receive an LOC payment.
This is inconsistent with the basic PJM energy uplift logic. If a unit does not run in real time, it loses net revenues if the real-time LMP is greater than the unit’s offer but it gains net revenues if the real-time LMP is lower than the unit’s offer. The correct lost opportunity costs for units that clear the Day-Ahead Energy Market and are not committed in real time cannot be determined if profitable hours are arbitrarily excluded. In the case of separate hourly calculations, units are overcompensated compared to the net revenues they would have received had they run.26 See 2015 State of the Market Report for PJM, Volume II Section 4, “Energy Uplift,” at “Lost Opportunity Cost Calculation” for an
explanation of the adopted recommendations.27 152 FERC ¶ 61,165 (2015).

2016 Quarterly State of the Market Report for PJM: January through March
186 Section 4 Energy Uplift © 2016 Monitoring Analytics, LLC
The MMU recommends calculating LOC based on 24 hour daily periods or multi-hour segments of hours for combustion turbines and diesels scheduled in the Day-Ahead Energy Market but not committed in real time. This recommendation has not been adopted. The MMU calculated the impact of this recommendation in the first three months of 2016. In the first three months of 2016, lost opportunity cost payments would have had been reduced by $1.2 million or 22.0 percent.
In addition to the initial four recommendations, the MMU recommends three additional steps to address issues with the current LOC calculations:
• Achievable Output: CTs and diesels are compensated for LOC when scheduled in the Day-Ahead Energy Market and not committed in real time. This LOC calculation uses the day-ahead scheduled output as the achievable output for which units are entitled to receive LOC compensation. Units are paid LOC based on the difference between the real-time energy price (RT LMP) and the unit’s offer times the day-ahead scheduled output.
The actual LOC is a function of the real-time desired and achievable output rather than the day-ahead scheduled output. If a unit is capable of profitably producing more or fewer MWh in real time than the day-ahead scheduled MWh, it is the actual foregone MWh in real time that define actual LOC. Also, if a unit is not capable of producing at the day-ahead scheduled output level in real time it should not be compensated based on an output that cannot be achieved.
The MMU recommends that units scheduled in the Day-Ahead Energy Market and not committed in real time should be compensated for LOC based on their real-time desired and achievable output, not their scheduled day-ahead output.
• Intra-Hour Calculations: CTs and diesels scheduled in the Day-Ahead Energy Market and not committed in real time are compensated for LOC based on their real-time hourly integrated output. In order to compensate a unit for LOC, PJM must determine if the unit was scheduled in the Day-Ahead Energy Market and if the unit was not committed in real time. Units clear the Day-Ahead Energy Market for full hours. That means that if a unit cleared the Day-Ahead Energy Market in an hour it is expected
to produce energy in real time for the entire hour. The determination by PJM of whether a unit is committed or not committed in real time is based on the unit’s hourly integrated output. If the hourly integrated output is greater than zero that means the unit was committed during that hour. But in real time a unit may be committed for part of an hour. The calculation of LOC does not reflect the exact time at which the unit was turned on.
The MMU recommends that units scheduled in the Day-Ahead Energy Market and not committed in real time be compensated for LOC incurred within an hour.
• LOC Unit Type Eligibility: The current rules compensate only CTs and diesels for LOC when scheduled in the Day-Ahead Energy Market and not committed in real time. The reason for this difference is that other unit types have a commitment obligation when scheduled in the Day-Ahead Energy Market. For example, steam turbines and combined cycle units commitment instructions are their day-ahead schedule. Units of these types that clear the Day-Ahead Energy Market are automatically committed to be on or remain on in real time. These units are eligible for LOC compensation only if PJM explicitly cancels their day-ahead commitment for reliability purposes. CT and diesel commitment instructions occur in real time even if these units were committed in the Day-Ahead Energy Market. CTs and diesels are committed in real time, after PJM dispatch has a more complete knowledge of real-time conditions. The goal is to permit the dispatch of flexible units in real time based on real-time conditions as they evolve. The reason for this special treatment of CTs and diesels is that historically, such units were usually more flexible to commit than other unit types. But that is no longer correct and should not be assumed to be correct.
The MMU recommends that only flexible fast start units (startup plus notification times of 30 minutes or less) and short minimum run times (one hour or less) be eligible by default for the LOC compensation to units scheduled in the Day-Ahead Energy Market and not committed in real time.

Section 4 Energy Uplift
2016 Quarterly State of the Market Report for PJM: January through March 187© 2016 Monitoring Analytics, LLC
Recommendations for Allocation of Charges
Up to Congestion TransactionsUp to congestion transactions do not pay energy uplift charges. An up to congestion transaction affects unit commitment and dispatch in the same way that increment offers and decrement bids affect unit commitment and dispatch in the Day-Ahead Energy Market. All such virtual transactions affect the results of the Day-Ahead Energy Market and contribute to energy uplift costs. Up to congestion transactions are currently receiving preferential treatment, relative to increment offers and decrement bids and other transactions because they are not charged energy uplift.
The MMU recommends that up to congestion transactions be required to pay energy uplift charges.
The MMU calculated the impact on energy uplift rates if up to congestion transactions had paid energy uplift charges based on deviations in the same way that increment offers and decrement bids do along with other recommendations that impact the total costs of energy uplift and its allocation.
Up to congestion transactions would have paid an average rate between $0.291 and $0.296 per MWh in 2015 and between $0.050 and $0.085 per MWh in the first three months of 2016 if the MMU’s recommendations regarding energy uplift had been in place.28 29
Internal Bilateral TransactionsMarket participants are allocated a portion of the costs of balancing operating reserves based on their deviations. Deviations are calculated in three categories, demand, supply and generation. Generators deviate when their real-time output is different than the desired output or their day-ahead scheduled
28 The range of operating reserve rates paid by up to congestion transactions depends on the location of the transactions’ source and sink.29 This analysis assumes that not all costs associated with units providing support to the Con Edison – PJM Transmission Service Agreements
would be reallocated under the MMU’s proposal. The 2013 State of the Market Report for PJM analysis assumed that all such costs would be reallocated. This analysis also assumes that only 50 percent of all cleared up to congestion transactions would have cleared had this recommendation been in place prior to September 8, 2014 and all cleared up to congestion transactions would have cleared after September 8, 2014. The 2013 State of the Market Report for PJM analysis showed that more than 66.7 percent of up to congestion transactions would have remained under the MMU proposal.
output.30 Load, interchange transactions, internal bilateral transactions, demand resources, increment offers and decrement bids also incur deviations.
Generators are allowed to offset their deviations with other generators at the same bus if the generators have the same electrical impact on the transmission system For example, a generator with a negative deviation (generation below the desired level) can offset such deviation if a generator at the same bus has a positive deviation (generation above the desired level) if this occurs in the same hour.
Load, interchange transactions, internal bilateral transactions, demand resources, increment offers and decrement bids are also allowed to offset their deviations. These transactions are grouped by demand and supply, and then aggregated by location. A negative deviation from one transaction can offset a positive deviation from another transaction in the same category, as long as both transactions are at the same location at the same hour.31 Demand transactions such as load, exports, internal bilateral sales and decrement bids may offset. The same applies to supply transactions such as imports, internal bilateral purchases and increment offers. Unlike all other transaction types, internal bilateral sales and purchases do not impact dispatch or market prices. Internal bilateral transactions (IBTs) are used by participants to transfer the financial responsibility or right of the energy withdrawn or injected into the system in the Day-Ahead and Real-Time Energy Markets.
IBTs should not pay for balancing operating reserves and should not be used to offset other transactions that deviate. IBTs shift the responsibility for an injection or withdrawal in PJM from one participant to another but IBTs are not part of the day-ahead unit commitment process, do not set energy prices and do not impact the energy flows in either the Day-Ahead or the Real-Time Energy Market, and thus IBTs should not be considered in the allocation of balancing operating reserve charges. The use of IBTs has been extended to offset deviations from other transactions that do impact the energy market. The elimination of the use of IBTs in the deviation calculation would eliminate
30 See PJM. OATT 3.2.3 (o) for a complete description of how generators deviate.31 Locations can be control zones, hubs, aggregates and interfaces. See “Determinants and Deviation Categories” in this section for a
description of balancing operating reserve locations.

2016 Quarterly State of the Market Report for PJM: January through March
188 Section 4 Energy Uplift © 2016 Monitoring Analytics, LLC
the balancing operating reserve charges to participants that use IBTs only in real time. Such elimination would increase the balancing operating reserve charges to participants that use IBTs to offset deviations from day-ahead transactions.
The MMU recommends eliminating the use of internal bilateral transactions (IBTs) in the calculation of deviations used to allocate balancing operating reserve charges.
Day-Ahead Reliability Energy Uplift AllocationPJM may schedule units as must run in the Day-Ahead Energy Market when needed in real time to address reliability issues in four categories: voltage issues (high and low); black start requirements (from automatic load rejection units); local contingencies not modeled in the Day-Ahead Energy Market; and long lead time units not able to be scheduled in the Day-Ahead Energy Market.32 The energy uplift paid to units scheduled for voltage is allocated to real-time load. The energy uplift associated with units scheduled for black start is allocated to real-time load and interchange reservations. The energy uplift paid to units scheduled because of local contingencies not modeled in the Day-Ahead Energy Market and scheduled because of their long lead times is allocated to day-ahead demand, day-ahead exports and decrement bids.
The MMU recommends allocating the energy uplift payments to units scheduled as must run in the Day-Ahead Energy Market for reasons other than voltage/reactive or black start services as a reliability charge to real-time load, real-time exports and real-time wheels.
Con Edison – PJM Transmission Service Agreements SupportIt appears that certain units located near the boundary between New Jersey and New York City are frequently operated to support the transmission service agreements between Con Ed and PJM, formerly known as the Con Ed – PSEG
32 See PJM. “Item 12 - October 2012 MIC DAM Cost Allocation,” PJM presentation to the Market Implementation Committee (October 12, 2012).
Wheeling Contracts.33 These units are often run out of merit and receive substantial day-ahead and balancing operating reserve credits.
The MMU recommends that this issue be addressed by PJM in order to determine if the cost of running these units is being allocated properly.
Reactive Services Credits and Balancing Operating Reserve Credits Energy uplift credits to resources providing reactive services are separate from balancing operating reserve credits.34 Under the current rules regarding energy uplift credits for reactive services, units are not assured recovery of the entire offer including no load and startup costs as they are under the operating reserve credits rules. Units providing reactive services at the request of PJM are made whole through reactive service credits. But when the reactive services credits do not cover a unit’s entire offer, the unit is made whole for the balance through balancing operating reserves. The result is a misallocation of the costs of providing reactive services. Reactive services credits are paid by real-time load in the control zone or zones where the service is provided while balancing operating reserve charges are paid by deviations from day-ahead or real-time load plus exports in the RTO, Eastern or Western Region depending on the allocation process rather than by zone.
In the first three months of2016, units providing reactive services were paid $0.1 million in balancing operating reserve credits in order to cover their total energy offer. In 2015, this misallocation was $1.0 million.
The MMU recommends that reactive services credits be calculated consistent with the balancing operating reserve credit calculation. The MMU also recommends including real-time exports and real-time wheels in the allocation of the cost of providing reactive support to the 500 kV system or above, in addition to real-time load.35
33 See the 2015 State of the Market Report for PJM, Volume II, Section 9, “Interchange Transactions” at ” Consolidated Edison Company of New York, Inc. (Con Edison) Wheeling Contracts” for a description of the contracts.
34 PJM. OATT Attachment K - Appendix § 3.2.3B (f).35 See the Day-Ahead Reliability and Reactive Cost Allocation Final Report (December 13, 2013) for a complete description of the issues
discussed in that group. <http://www.pjm.com/~/media/committees-groups/task-forces/emustf/20131220/20131220-item-02b-darrca-final-report.ashx>.
Section 4 Energy Uplift
2016 Quarterly State of the Market Report for PJM: January through March 189© 2016 Monitoring Analytics, LLC
Allocation ProposalThe day-ahead operating reserve category elimination and other MMU recommendations require enhancements to the current method of energy uplift allocation.
The current method allocates day-ahead operating reserve charges to day-ahead load, day-ahead exports and decrement bids. The elimination of the day-ahead operating reserve category would shift these costs to the balancing operating reserve category which would be paid by deviations or by real-time load plus real-time exports depending on the balancing operating reserve allocation rules.
The MMU recommends creating a new category for energy uplift payments to units scheduled in the Day-Ahead Energy Market (for reasons other than reactive or black start services), which would be allocated to all day-ahead transactions and resources. All these transaction types have an impact on the outcome of the day-ahead scheduling process, so allocating these costs to all day-ahead transactions ensures that all transactions that affect the way the Day-Ahead Energy Market clears are responsible for any energy uplift credits paid to the units scheduled in the Day-Ahead Energy Market. Energy uplift payments to units scheduled as must run in the Day-Ahead Energy Market (for reasons related to expected conditions in the real-time market not including reactive or black start services) should be allocated to real-time load, real-time exports and real-time wheels.
The MMU recommends allocating energy uplift payments to units not scheduled in the Day-Ahead Energy Market and committed in real time, but before the operating day, to the current deviation categories with the addition of up to congestion, wheels and units that clear the Day-Ahead Scheduling Reserve Market but do not perform.
The MMU recommends the exclusion of offsets based on internal bilateral transactions. These costs should be allocated to the current deviation categories whenever the units receiving energy uplift payments are committed before the operating day.
The MMU recommends allocating energy uplift payments to units committed during the operating day to a new deviation category which would include physical transactions or resources (day-ahead minus real-time load, day-ahead minus real-time interchange transactions, generators and DR not following dispatch). This allocation would ensure that commitment changes that occur during the operating day and that result in energy uplift payments are paid by transactions or resources affecting the commitment of units during the operating day. For example, real-time load or interchange transactions that do not bid in the Day-Ahead Energy Market, generators and DR resources that do not follow dispatch would be allocated these costs. Any reliability commitment should be allocated to real-time load, real-time exports and real-time wheels independently of the timing of the commitment.
The MMU recommends changing the allocation of lost opportunity cost and canceled resources. LOC paid to units scheduled in the Day-Ahead Energy Market and not committed in real time should be allocated to deviations based on the proposed definition of deviations. LOC paid to units reduced for reliability in real time and payments to canceled resources should be allocated to real-time load, real-time exports and real-time wheels.
Table 4-34 shows the current allocation by energy uplift reason. For example, energy uplift payments to units scheduled in the Day-Ahead Energy Market are called day-ahead operating reserves, these costs are paid by day-ahead load, day-ahead exports and decrement bids. Any additional payment resulting from the real time operation of these units are called balancing operating reserves, these costs are paid by either deviations or real-time load and real-time exports depending on the amount of intervals the units are economic.

2016 Quarterly State of the Market Report for PJM: January through March
190 Section 4 Energy Uplift © 2016 Monitoring Analytics, LLC
Table 4‑34 Current energy uplift allocationReason Energy Uplift Category Allocation Logic AllocationUnits scheduled in the Day-Ahead Energy Market Day-Ahead Operating Reserve NA Day-Ahead Load, Day-Ahead Exports and Decrement Bids
Units scheduled in the Day-Ahead Energy MarketBalancing Operating Reserve
LMP < Offer for at least four intervals Real-Time Load and Real-Time ExportsLMP > Offer for at least four intervals Deviations
Unit not scheduled in the Day-Ahead Energy Market and committed in real time
Balancing Operating Reserve
Committed before the operating day for reliability Real-Time Load and Real-Time ExportsCommitted before the operating day to meet forecasted load and reserves Deviations
Committed during the operating day and LMP < Offer for at least four intervals Real-Time Load and Real-Time ExportsCommitted during the operating day and LMP > Offer for at least four intervals Deviations
Units scheduled in the Day-Ahead Energy Market not committed in real time
LOC Credit NA Deviations
Units reduced for reliability in real time LOC Credit NA DeviationsUnits canceled before coming online Cancellation Credit NA Deviations
Table 4-35 shows the MMU allocation proposal by energy uplift reason. The proposal eliminates the day-ahead operating reserve category and creates a new category for any energy uplift payments to units scheduled in the Day-Ahead Energy Market and committed in real time. This new category would be allocated to day-ahead transactions and resources. The proposal also eliminates the need to determine the number of intervals that units are economic to determine if the energy uplift charge should be allocated to deviations or to real-time load and real-time exports. In the proposal, any commitment instruction before the operating day would be allocated based on the proposed definition of deviations; any commitment instruction during the operating day would be allocated to physical deviations.
Table 4‑35 MMU energy uplift allocation proposalReason Energy Uplift Category Allocation Logic AllocationUnits scheduled in the Day-Ahead Energy Market and committed in real time
Day-Ahead Segment Make Whole CreditScheduled by the day ahead model (not must run) Day-Ahead Transactions and Day-Ahead Resources
Scheduled as must run in the day ahead model Real-Time Load, Real-Time Exports and Withdrawal Side of Real-Time Wheels
Units not scheduled in the Day-Ahead Energy Market and committed in real time
Real Time Segment Make Whole CreditCommitted before the operating day DeviationsCommitted during the operating day Physical Deviations
Any commitment for reliability Real-Time Load, Real-Time Exports and Withdrawal Side of Real-Time WheelsUnits scheduled in the Day-Ahead Energy Market not committed in real time
Day-Ahead LOC NA Deviations
Units reduced for reliability in real time Real-Time LOC NA Real-Time Load, Real-Time Exports and Withdrawal Side of Real-Time WheelsUnits canceled before coming online Cancellation Credit NA Real-Time Load, Real-Time Exports and Withdrawal Side of Real-Time Wheels
Quantifiable Recommendations ImpactTable 4-36 shows energy uplift charges based on the current allocation and energy uplift charges based on the MMU allocation proposal including the MMU recommendations regarding energy uplift credit calculations. Total charges (excluding black start and reactive services charges) would have been reduced by $56.0 million or 16.7 percent in 2015 and the first three months of 2016 if three recommendations regarding energy uplift credit calculations proposed by the MMU had been implemented. The elimination of the day-ahead operating reserve credit would have resulted in a decrease of $26.0 million, the proposed changes to lost opportunity cost calculations would have resulted in a decrease of $22.6 million and the use of net regulation revenues offset would have

Section 4 Energy Uplift
2016 Quarterly State of the Market Report for PJM: January through March 191© 2016 Monitoring Analytics, LLC
allocation of energy uplift charges to up to congestion transactions and the MMU energy uplift allocation proposal.
Table 4-37 shows the energy uplift cost of a 1 MW transaction if these recommendations had been implemented in 2015 and the first three months of 2016. Table 4-37 assumes two scenarios under the MMU proposal. The first scenario assumes all the up to congestion transactions volume cleared. The second scenario assumes zero volume of up to congestion transactions in 2015 and the first three months of 2016, in this scenario, the cost reflects the expected cost for the first 1 MW cleared up to congestion transaction. Table 4-37 shows for example that a decrement bid in the Eastern Region (if not offset by other transactions) would have paid an average rate of $0.148 and $0.043 per MWh in the 2015 and the first three months of 2016, under the first scenario, $1.030 and $0.440 per MWh less than the actual average rate paid. Up to congestion transactions sourced in the Eastern Region and sinking in the Western Region would have paid an average rate of $0.294 and $0.068 per MWh in 2015 and in the first three months of 2016 under the first scenario. Table 4-37 shows the current and proposed averages energy uplift rates for all transactions.
resulted in a decrease of $7.5 million.36 Table 4-36 shows that deviations charges would have been reduced by $94.5 million or 55.9 percent. The reason for this change is that, besides the reduction in the overall charges, under the MMU proposal, a subset of charges is reallocated to a new physical deviation category (based on the timing of the commitment of the resource being paid energy uplift) and another subset of charges is allocated to real-time load, real-time exports and real-time wheels (based on reliability actions).
Table 4‑36 Current and proposed energy uplift charges by allocation (Millions): 2015 and January through March 201637
Allocation 2015Jan ‑ Mar
2016 TotalCurrentDay-Ahead Demand, Day-Ahead Exports and Decrement Bids $98.5 $21.3 $119.9 Real-Time Load and Real-Time Exports $41.1 $5.0 $46.2 Deviations $156.5 $12.4 $169.0 Total $296.2 $38.8 $335.0 ProposalDay-Ahead Transactions and Day-Ahead Resources $27.5 $2.5 $30.1 Real-Time Load and Real-Time Exports $99.1 $17.0 $116.0 Deviations $68.5 $6.0 $74.5 Physical Deviations $51.0 $7.4 $58.4 Total $246.1 $32.9 $279.0 ImpactImpact ($) ($50.0) ($5.9) ($56.0)Impact (%) (16.9%) (15.3%) (16.7%)
The MMU calculated the rates that participants would have paid in 2015 and the first three months of 2016 if all the MMU’s recommendations on energy uplift had been in place. These recommendations have been included in the analysis: day-ahead operating reserve elimination; net regulation revenues offset; implementation of the proposed changes to lost opportunity cost calculations; reallocation of operating reserve credits paid to units scheduled as must run in the Day-Ahead Energy Market (for reasons other than reactive or black start services); reallocation of operating reserve credits paid to units supporting the Con Edison – PJM Transmission Service Agreements; elimination of internal bilateral transactions from the deviations calculation; 36 The total impact of the elimination of the day-ahead operating reserve credit and the impact of net regulation revenues offset is greater
because they also impact black start and reactive services charges.37 These energy uplift charges do not include black start and reactive services charges.

2016 Quarterly State of the Market Report for PJM: January through March
192 Section 4 Energy Uplift © 2016 Monitoring Analytics, LLC
Table 4‑37 Current and proposed average energy uplift rate by transaction: 2015 and January through March 201638
2015 Jan ‑ Mar 2016
TransactionCurrent Rates
($/MWh)Proposed Rates ‑ 100%
UTC ($/MWh)Proposed Rates ‑ 0% UTC
($/MWh)Current Rates
($/MWh)Proposed Rates ‑ 100%
UTC ($/MWh)Proposed Rates ‑ 0% UTC
($/MWh)
East
INC 1.063 0.148 0.378 0.378 0.043 0.154 DEC 1.178 0.148 0.378 0.483 0.043 0.154 DA Load 0.115 0.013 0.015 0.105 0.004 0.006 RT Load 0.050 0.117 0.117 0.031 0.088 0.088 Deviation 1.063 0.498 0.726 0.378 0.290 0.400
West
INC 1.027 0.146 0.379 0.250 0.025 0.101 DEC 1.143 0.146 0.379 0.355 0.025 0.101 DA Load 0.115 0.013 0.015 0.105 0.004 0.006 RT Load 0.042 0.117 0.117 0.017 0.088 0.088 Deviation 1.027 0.430 0.661 0.250 0.150 0.225
UTCEast to East NA 0.296 0.756 NA 0.085 0.308 West to West NA 0.291 0.757 NA 0.050 0.203 East to/from West NA 0.294 0.757 NA 0.068 0.255
January through March Energy Uplift Charges AnalysisEnergy uplift charges decreased by $147.3 million (79.0 percent), from $186.4 million in the first three months of 2015 to $39.1 million in the first three months of 2016. This change resulted from a decrease of $33.9 million in day-ahead operating reserve charges, a decrease of $102.7 million in balancing operating reserve charges, a decrease of $6.0 million in reactive services charges and a decrease of $4.7 in black start services charges.
Figure 4-8 shows the net impact of each category on the change in total energy uplift charges from the first three months of 2015 level to the first three months of 2016 level. The outside bars show the total energy uplift charges in the first three months of 2015 (left side) and total energy uplift charges in the first three months of 2016 (right side). The other bars show the change in each energy uplift category. For example, the second bar from the left shows the change in day-ahead operating reserve charges in the first three months of 2015 compared to the first three months of 2016 (a decrease of $33.9 million).38 The deviation transaction means load, interchange transactions, generators and DR deviations.
Figure 4‑8 Energy uplift charges change from January through March 2015 to January through March 2016 by category
$186.4 $33.9
$102.7
$6.0 $0.0 $4.7 $39.1
$0
$20
$40
$60
$80
$100
$120
$140
$160
$180
$200
Jan - Mar 2015 Day-Ahead Balancing ReactiveServices
SynchronousCondensing
Black StartServices
Jan - Mar 2016
Ener
gy U
plift C
harg
es (m
illion
s)
Jan - Mar 2015 Charges YoY Decrease YoY Increase Jan - Mar 2016 Charges