2014 uplift report: quantifying ecological uplift
TRANSCRIPT
Uplift Report® 2014
2 — The Freshwater Trust Uplift Report 2014
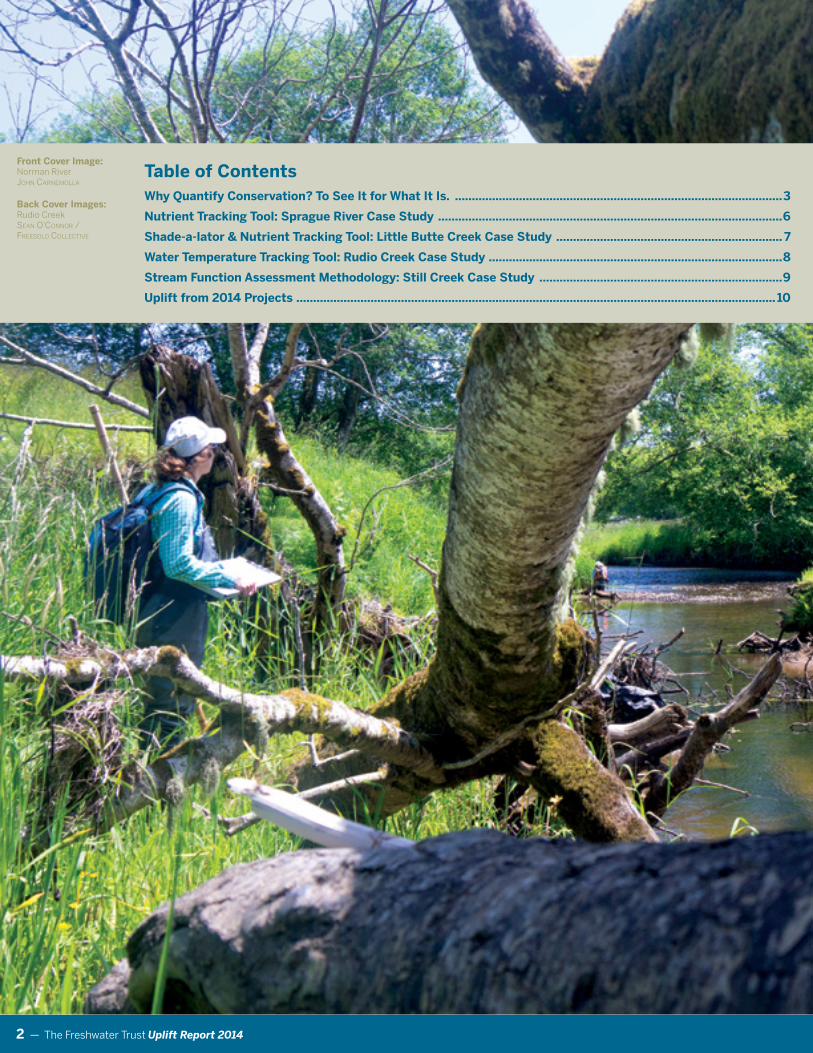
Table of Contents Why Quantify Conservation? To See It for What It Is. .................................................................................................3
Nutrient Tracking Tool: Sprague River Case Study ......................................................................................................6
Shade-a-lator & Nutrient Tracking Tool: Little Butte Creek Case Study ................................................................... 7
Water Temperature Tracking Tool: Rudio Creek Case Study .......................................................................................8
Stream Function Assessment Methodology: Still Creek Case Study ........................................................................9
Uplift from 2014 Projects .............................................................................................................................................. 10
Front Cover Image: Norman RiverJohn Carnemolla
Back Cover Images: Rudio CreekSean o’Connor / FreeSolo ColleCtive
The Freshwater Trust Uplift Report 2014 — 3
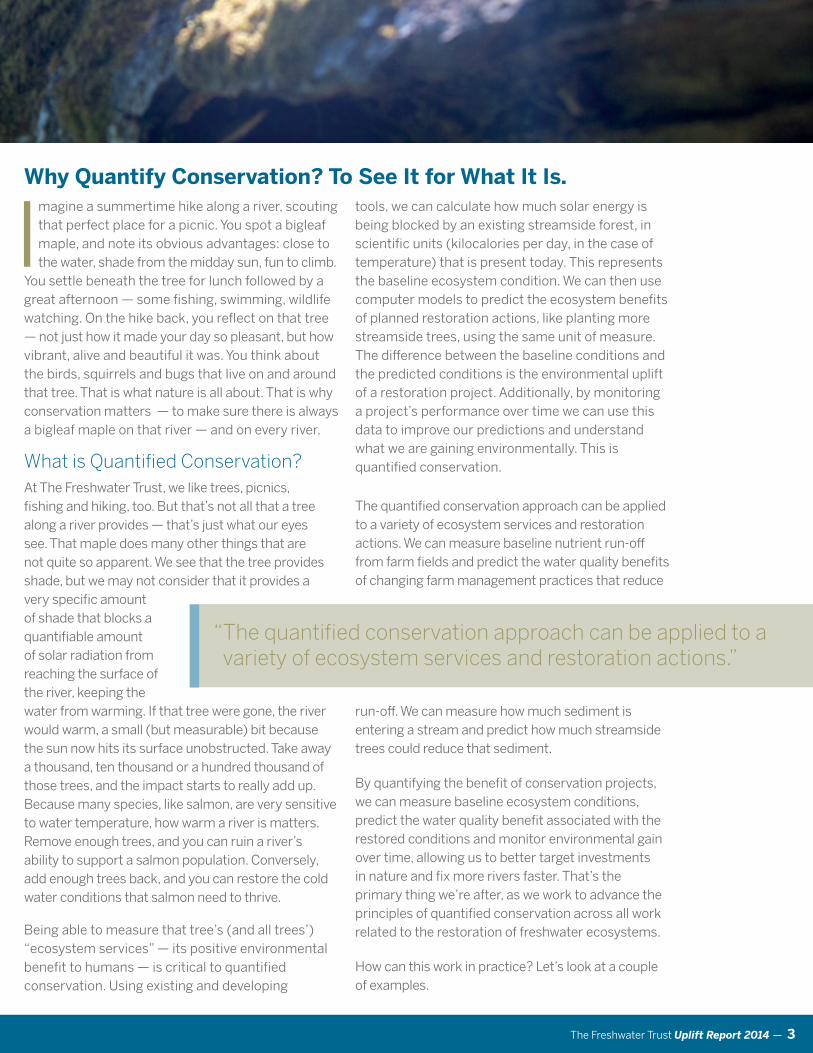
Imagine a summertime hike along a river, scouting that perfect place for a picnic. You spot a bigleaf maple, and note its obvious advantages: close to the water, shade from the midday sun, fun to climb.
You settle beneath the tree for lunch followed by a great afternoon — some fishing, swimming, wildlife watching. On the hike back, you reflect on that tree — not just how it made your day so pleasant, but how vibrant, alive and beautiful it was. You think about the birds, squirrels and bugs that live on and around that tree. That is what nature is all about. That is why conservation matters — to make sure there is always a bigleaf maple on that river — and on every river.
What is Quantified Conservation?At The Freshwater Trust, we like trees, picnics, fishing and hiking, too. But that’s not all that a tree along a river provides — that’s just what our eyes see. That maple does many other things that are not quite so apparent. We see that the tree provides shade, but we may not consider that it provides a very specific amount of shade that blocks a quantifiable amount of solar radiation from reaching the surface of the river, keeping the water from warming. If that tree were gone, the river would warm, a small (but measurable) bit because the sun now hits its surface unobstructed. Take away a thousand, ten thousand or a hundred thousand of those trees, and the impact starts to really add up. Because many species, like salmon, are very sensitive to water temperature, how warm a river is matters. Remove enough trees, and you can ruin a river’s ability to support a salmon population. Conversely, add enough trees back, and you can restore the cold water conditions that salmon need to thrive.
Being able to measure that tree’s (and all trees’) “ecosystem services” — its positive environmental benefit to humans — is critical to quantified conservation. Using existing and developing
tools, we can calculate how much solar energy is being blocked by an existing streamside forest, in scientific units (kilocalories per day, in the case of temperature) that is present today. This represents the baseline ecosystem condition. We can then use computer models to predict the ecosystem benefits of planned restoration actions, like planting more streamside trees, using the same unit of measure. The difference between the baseline conditions and the predicted conditions is the environmental uplift of a restoration project. Additionally, by monitoring a project’s performance over time we can use this data to improve our predictions and understand what we are gaining environmentally. This is quantified conservation.
The quantified conservation approach can be applied to a variety of ecosystem services and restoration actions. We can measure baseline nutrient run-off from farm fields and predict the water quality benefits of changing farm management practices that reduce
run-off. We can measure how much sediment is entering a stream and predict how much streamside trees could reduce that sediment.
By quantifying the benefit of conservation projects, we can measure baseline ecosystem conditions, predict the water quality benefit associated with the restored conditions and monitor environmental gain over time, allowing us to better target investments in nature and fix more rivers faster. That’s the primary thing we’re after, as we work to advance the principles of quantified conservation across all work related to the restoration of freshwater ecosystems.
How can this work in practice? Let’s look at a couple of examples.
Why Quantify Conservation? To See It for What It Is.
“The quantified conservation approach can be applied to a variety of ecosystem services and restoration actions.”
4 — The Freshwater Trust Uplift Report 2014
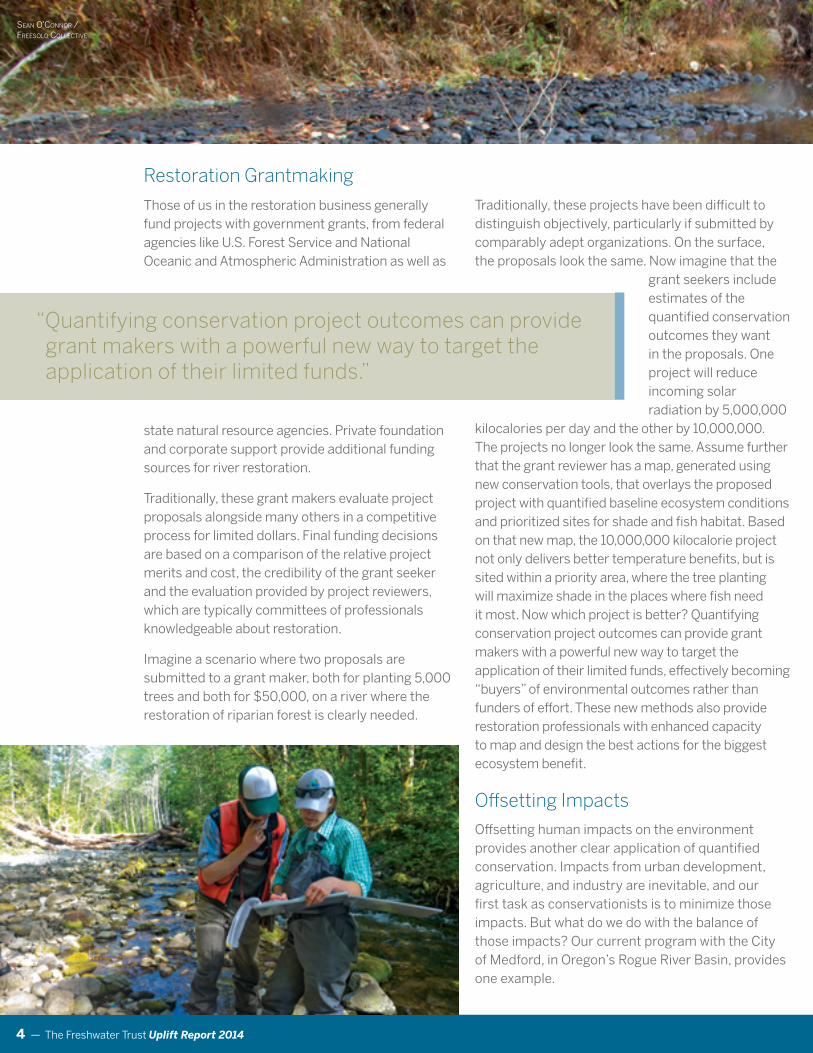
Restoration Grantmaking
Those of us in the restoration business generally fund projects with government grants, from federal agencies like U.S. Forest Service and National Oceanic and Atmospheric Administration as well as
state natural resource agencies. Private foundation and corporate support provide additional funding sources for river restoration.
Traditionally, these grant makers evaluate project proposals alongside many others in a competitive process for limited dollars. Final funding decisions are based on a comparison of the relative project merits and cost, the credibility of the grant seeker and the evaluation provided by project reviewers, which are typically committees of professionals knowledgeable about restoration.
Imagine a scenario where two proposals are submitted to a grant maker, both for planting 5,000 trees and both for $50,000, on a river where the restoration of riparian forest is clearly needed.
Traditionally, these projects have been difficult to distinguish objectively, particularly if submitted by comparably adept organizations. On the surface, the proposals look the same. Now imagine that the
grant seekers include estimates of the quantified conservation outcomes they want in the proposals. One project will reduce incoming solar radiation by 5,000,000
kilocalories per day and the other by 10,000,000. The projects no longer look the same. Assume further that the grant reviewer has a map, generated using new conservation tools, that overlays the proposed project with quantified baseline ecosystem conditions and prioritized sites for shade and fish habitat. Based on that new map, the 10,000,000 kilocalorie project not only delivers better temperature benefits, but is sited within a priority area, where the tree planting will maximize shade in the places where fish need it most. Now which project is better? Quantifying conservation project outcomes can provide grant makers with a powerful new way to target the application of their limited funds, effectively becoming “buyers” of environmental outcomes rather than funders of effort. These new methods also provide restoration professionals with enhanced capacity to map and design the best actions for the biggest ecosystem benefit.
Offsetting Impacts
Offsetting human impacts on the environment provides another clear application of quantified conservation. Impacts from urban development, agriculture, and industry are inevitable, and our first task as conservationists is to minimize those impacts. But what do we do with the balance of those impacts? Our current program with the City of Medford, in Oregon’s Rogue River Basin, provides one example.
“Quantifying conservation project outcomes can provide grant makers with a powerful new way to target the application of their limited funds.”
Sean o’Connor / FreeSolo ColleCtive
The Freshwater Trust Uplift Report 2014 — 5
ACKNOWLEDGEMENTS
The Freshwater Trust would like to thank the following partners who developed the tools and calculators to measure the ecological uplift in this report.
ESA Vigil-Agrimis, Inc.
National Fish & Wildlife Foundation
Oregon Department of Environmental Quality
Oregon State University
Skidmore Restoration Consulting, LLC
Texas Institute for Applied Environmental Research
United States Department of Agriculture
United States Environmental Protection Agency
Watercourse Engineering, Inc.
The Freshwater Trust is a non-profit organization with a mission to preserve and restore freshwater ecosystems.
With more than 30 years of on-the-ground experience, we continue to look for innovative ways to fix imperiled rivers and streams. With the latest tools and methods, we can attain efficiencies that facilitate real environmental gains with less cost, in less time.
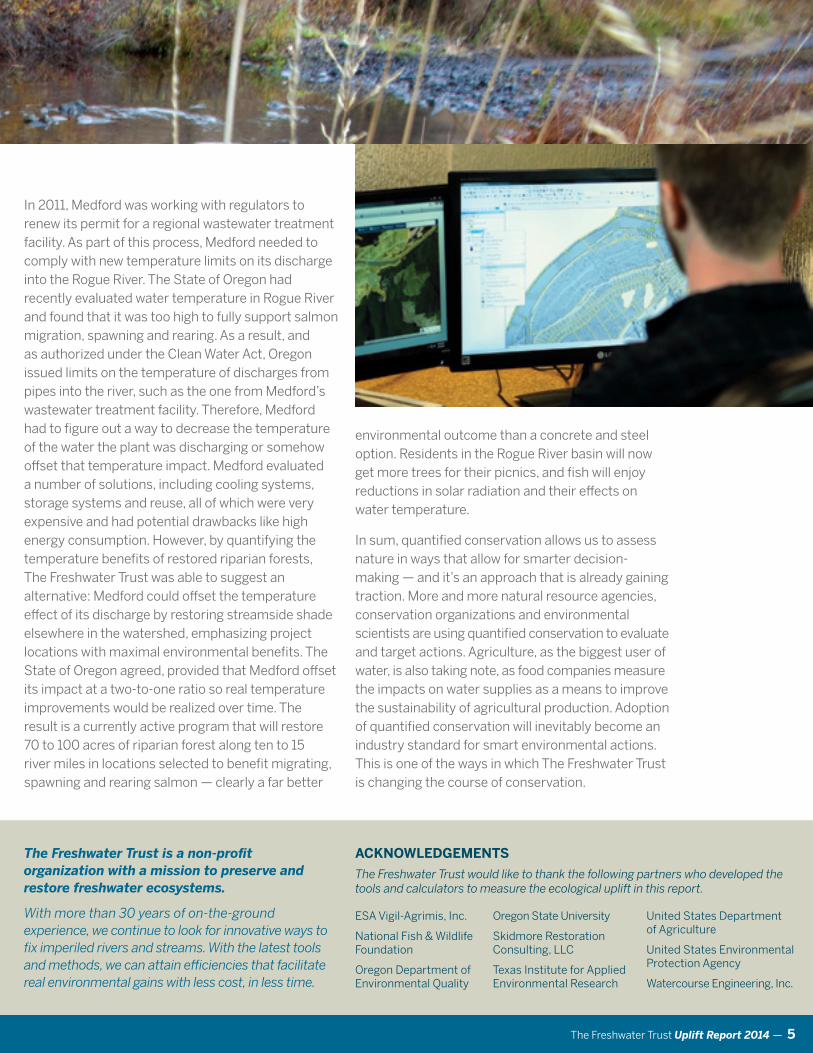
In 2011, Medford was working with regulators to renew its permit for a regional wastewater treatment facility. As part of this process, Medford needed to comply with new temperature limits on its discharge into the Rogue River. The State of Oregon had recently evaluated water temperature in Rogue River and found that it was too high to fully support salmon migration, spawning and rearing. As a result, and as authorized under the Clean Water Act, Oregon issued limits on the temperature of discharges from pipes into the river, such as the one from Medford’s wastewater treatment facility. Therefore, Medford had to figure out a way to decrease the temperature of the water the plant was discharging or somehow offset that temperature impact. Medford evaluated a number of solutions, including cooling systems, storage systems and reuse, all of which were very expensive and had potential drawbacks like high energy consumption. However, by quantifying the temperature benefits of restored riparian forests, The Freshwater Trust was able to suggest an alternative: Medford could offset the temperature effect of its discharge by restoring streamside shade elsewhere in the watershed, emphasizing project locations with maximal environmental benefits. The State of Oregon agreed, provided that Medford offset its impact at a two-to-one ratio so real temperature improvements would be realized over time. The result is a currently active program that will restore 70 to 100 acres of riparian forest along ten to 15 river miles in locations selected to benefit migrating, spawning and rearing salmon — clearly a far better
environmental outcome than a concrete and steel option. Residents in the Rogue River basin will now get more trees for their picnics, and fish will enjoy reductions in solar radiation and their effects on water temperature.
In sum, quantified conservation allows us to assess nature in ways that allow for smarter decision-making — and it’s an approach that is already gaining traction. More and more natural resource agencies, conservation organizations and environmental scientists are using quantified conservation to evaluate and target actions. Agriculture, as the biggest user of water, is also taking note, as food companies measure the impacts on water supplies as a means to improve the sustainability of agricultural production. Adoption of quantified conservation will inevitably become an industry standard for smart environmental actions. This is one of the ways in which The Freshwater Trust is changing the course of conservation.
6 — The Freshwater Trust Uplift Report 2014
BEFORE Restoration
AFTER Restoration
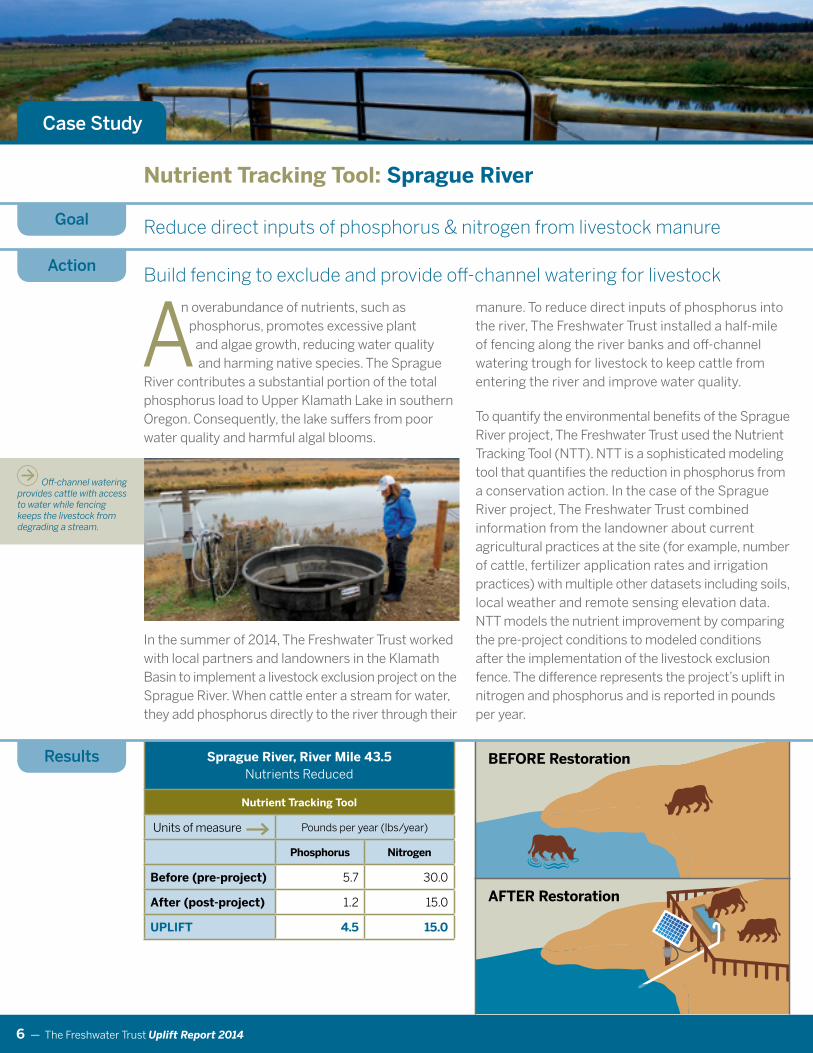
n overabundance of nutrients, such as phosphorus, promotes excessive plant
and algae growth, reducing water quality and harming native species. The Sprague
River contributes a substantial portion of the total phosphorus load to Upper Klamath Lake in southern Oregon. Consequently, the lake suffers from poor water quality and harmful algal blooms.
In the summer of 2014, The Freshwater Trust worked with local partners and landowners in the Klamath Basin to implement a livestock exclusion project on the Sprague River. When cattle enter a stream for water, they add phosphorus directly to the river through their
Sprague River, River Mile 43.5 Nutrients Reduced
Nutrient Tracking Tool
Units of measure Pounds per year (lbs/year)
Phosphorus Nitrogen
Before (pre-project) 5.7 30.0
After (post-project) 1.2 15.0
UPLIFT 4.5 15.0
Case Study
Action
Goal
Results
manure. To reduce direct inputs of phosphorus into the river, The Freshwater Trust installed a half-mile of fencing along the river banks and off-channel watering trough for livestock to keep cattle from entering the river and improve water quality.
To quantify the environmental benefits of the Sprague River project, The Freshwater Trust used the Nutrient Tracking Tool (NTT). NTT is a sophisticated modeling tool that quantifies the reduction in phosphorus from a conservation action. In the case of the Sprague River project, The Freshwater Trust combined information from the landowner about current agricultural practices at the site (for example, number of cattle, fertilizer application rates and irrigation practices) with multiple other datasets including soils, local weather and remote sensing elevation data. NTT models the nutrient improvement by comparing the pre-project conditions to modeled conditions after the implementation of the livestock exclusion fence. The difference represents the project’s uplift in nitrogen and phosphorus and is reported in pounds per year.
Off-channel watering provides cattle with access to water while fencing keeps the livestock from degrading a stream.
Nutrient Tracking Tool: Sprague River
Reduce direct inputs of phosphorus & nitrogen from livestock manure
Build fencing to exclude and provide off-channel watering for livestock
The Freshwater Trust Uplift Report 2014 — 7
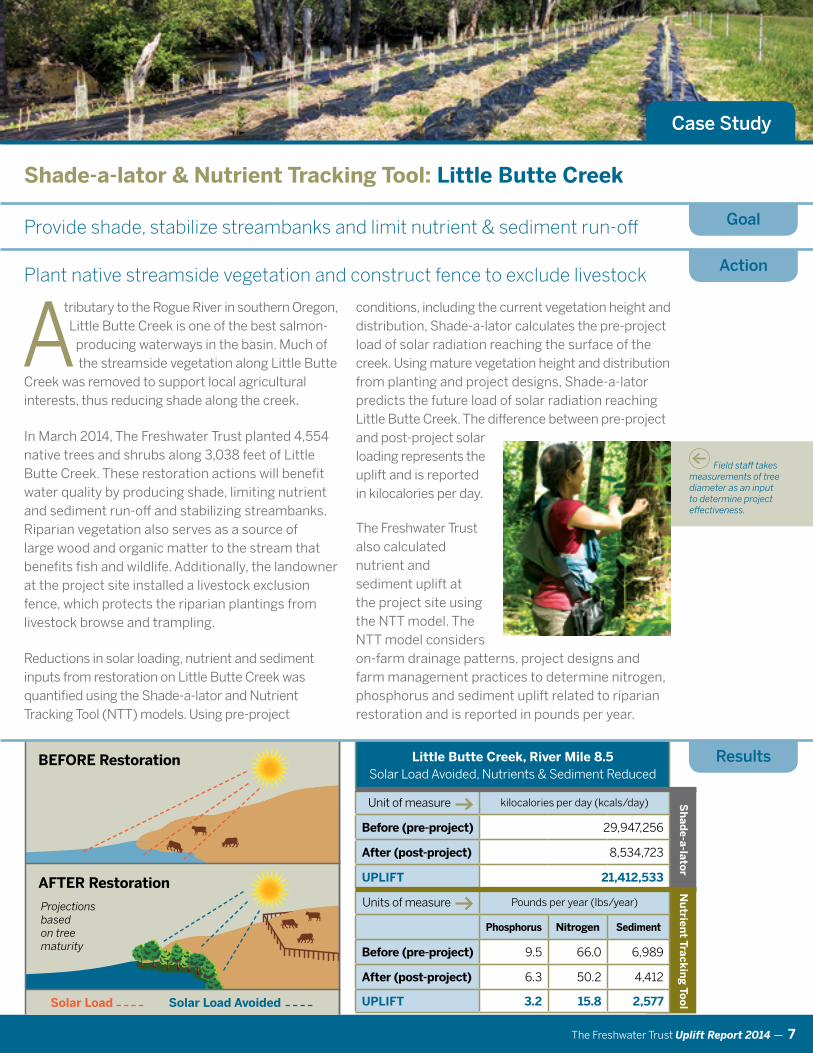
conditions, including the current vegetation height and distribution, Shade-a-lator calculates the pre-project load of solar radiation reaching the surface of the creek. Using mature vegetation height and distribution from planting and project designs, Shade-a-lator predicts the future load of solar radiation reaching Little Butte Creek. The difference between pre-project and post-project solar loading represents the uplift and is reported in kilocalories per day.
The Freshwater Trust also calculated nutrient and sediment uplift at the project site using the NTT model. The NTT model considers on-farm drainage patterns, project designs and farm management practices to determine nitrogen, phosphorus and sediment uplift related to riparian restoration and is reported in pounds per year.
Field staff takes measurements of tree diameter as an input to determine project effectiveness.
Case Study
Action
Goal
tributary to the Rogue River in southern Oregon, Little Butte Creek is one of the best salmon-
producing waterways in the basin. Much of the streamside vegetation along Little Butte
Creek was removed to support local agricultural interests, thus reducing shade along the creek.
In March 2014, The Freshwater Trust planted 4,554 native trees and shrubs along 3,038 feet of Little Butte Creek. These restoration actions will benefit water quality by producing shade, limiting nutrient and sediment run-off and stabilizing streambanks. Riparian vegetation also serves as a source of large wood and organic matter to the stream that benefits fish and wildlife. Additionally, the landowner at the project site installed a livestock exclusion fence, which protects the riparian plantings from livestock browse and trampling.
Reductions in solar loading, nutrient and sediment inputs from restoration on Little Butte Creek was quantified using the Shade-a-lator and Nutrient Tracking Tool (NTT) models. Using pre-project
Shade-a-lator & Nutrient Tracking Tool: Little Butte Creek
Provide shade, stabilize streambanks and limit nutrient & sediment run-off
Plant native streamside vegetation and construct fence to exclude livestock
Sh
ade-a-lato
rN
utrien
t Trackin
g To
ol
Little Butte Creek, River Mile 8.5Solar Load Avoided, Nutrients & Sediment Reduced
Unit of measure kilocalories per day (kcals/day)
Before (pre-project) 29,947,256
After (post-project) 8,534,723
UPLIFT 21,412,533
Units of measure Pounds per year (lbs/year)
Phosphorus Nitrogen Sediment
Before (pre-project) 9.5 66.0 6,989
After (post-project) 6.3 50.2 4,412
UPLIFT 3.2 15.8 2,577
BEFORE Restoration
AFTER Restoration
Projections based on tree maturity
Solar Load Solar Load Avoided
Results
8 — The Freshwater Trust Uplift Report 2014
BEFORE Restoration
AFTER Restoration
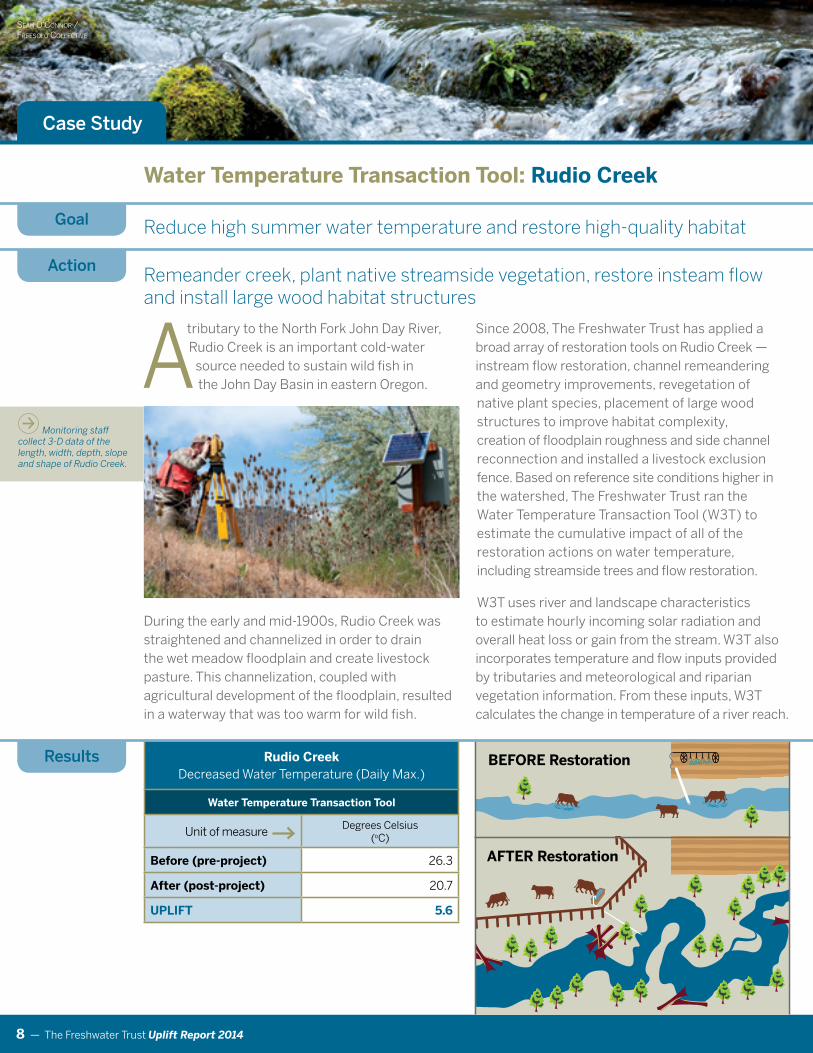
Rudio CreekDecreased Water Temperature (Daily Max.)
Water Temperature Transaction Tool
Unit of measure Degrees Celsius (oC)
Before (pre-project) 26.3
After (post-project) 20.7
UPLIFT 5.6
Case Study
tributary to the North Fork John Day River, Rudio Creek is an important cold-water
source needed to sustain wild fish in the John Day Basin in eastern Oregon.
During the early and mid-1900s, Rudio Creek was straightened and channelized in order to drain the wet meadow floodplain and create livestock pasture. This channelization, coupled with agricultural development of the floodplain, resulted in a waterway that was too warm for wild fish.
Monitoring staff collect 3-D data of the length, width, depth, slope and shape of Rudio Creek.
Water Temperature Transaction Tool: Rudio Creek
Since 2008, The Freshwater Trust has applied a broad array of restoration tools on Rudio Creek — instream flow restoration, channel remeandering and geometry improvements, revegetation of native plant species, placement of large wood structures to improve habitat complexity, creation of floodplain roughness and side channel reconnection and installed a livestock exclusion fence. Based on reference site conditions higher in the watershed, The Freshwater Trust ran the Water Temperature Transaction Tool (W3T) to estimate the cumulative impact of all of the restoration actions on water temperature, including streamside trees and flow restoration.
W3T uses river and landscape characteristics to estimate hourly incoming solar radiation and overall heat loss or gain from the stream. W3T also incorporates temperature and flow inputs provided by tributaries and meteorological and riparian vegetation information. From these inputs, W3T calculates the change in temperature of a river reach.
Reduce high summer water temperature and restore high-quality habitat
Remeander creek, plant native streamside vegetation, restore insteam flow and install large wood habitat structures
Action
Goal
Results
Sean o’Connor / FreeSolo ColleCtive
The Freshwater Trust Uplift Report 2014 — 9
BEFORE Restoration
AFTER Restoration
Reduce high summer water temperature and restore high-quality habitat
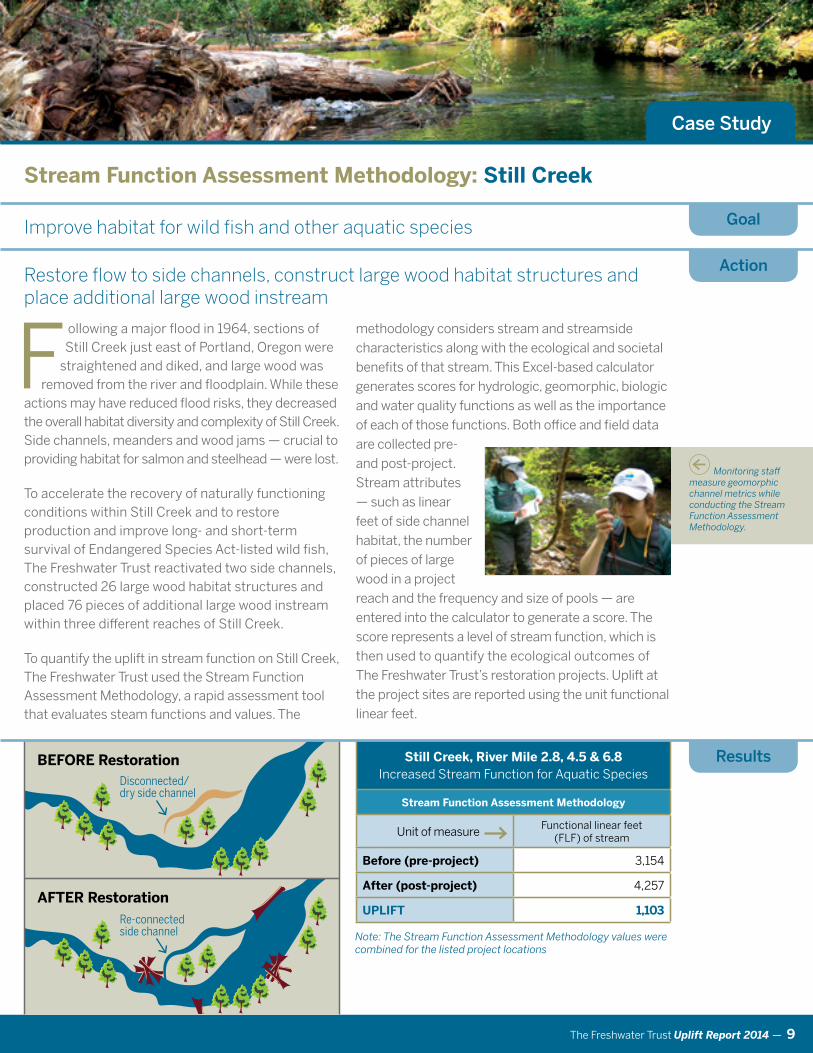
Still Creek, River Mile 2.8, 4.5 & 6.8Increased Stream Function for Aquatic Species
Stream Function Assessment Methodology
Unit of measure Functional linear feet (FLF) of stream
Before (pre-project) 3,154
After (post-project) 4,257
UPLIFT 1,103
methodology considers stream and streamside characteristics along with the ecological and societal benefits of that stream. This Excel-based calculator generates scores for hydrologic, geomorphic, biologic and water quality functions as well as the importance of each of those functions. Both office and field data are collected pre- and post-project. Stream attributes — such as linear feet of side channel habitat, the number of pieces of large wood in a project reach and the frequency and size of pools — are entered into the calculator to generate a score. The score represents a level of stream function, which is then used to quantify the ecological outcomes of The Freshwater Trust’s restoration projects. Uplift at the project sites are reported using the unit functional linear feet.
Stream Function Assessment Methodology: Still Creek
Improve habitat for wild fish and other aquatic species
Restore flow to side channels, construct large wood habitat structures and place additional large wood instream
ollowing a major flood in 1964, sections of Still Creek just east of Portland, Oregon were
straightened and diked, and large wood was removed from the river and floodplain. While these
actions may have reduced flood risks, they decreased the overall habitat diversity and complexity of Still Creek. Side channels, meanders and wood jams — crucial to providing habitat for salmon and steelhead — were lost.
To accelerate the recovery of naturally functioning conditions within Still Creek and to restore production and improve long- and short-term survival of Endangered Species Act-listed wild fish, The Freshwater Trust reactivated two side channels, constructed 26 large wood habitat structures and placed 76 pieces of additional large wood instream within three different reaches of Still Creek.
To quantify the uplift in stream function on Still Creek, The Freshwater Trust used the Stream Function Assessment Methodology, a rapid assessment tool that evaluates steam functions and values. The
Case Study
Action
Goal
Results
Disconnected/ dry side channel
Re-connected side channel
Monitoring staff measure geomorphic channel metrics while conducting the Stream Function Assessment Methodology.
Note: The Stream Function Assessment Methodology values were combined for the listed project locations
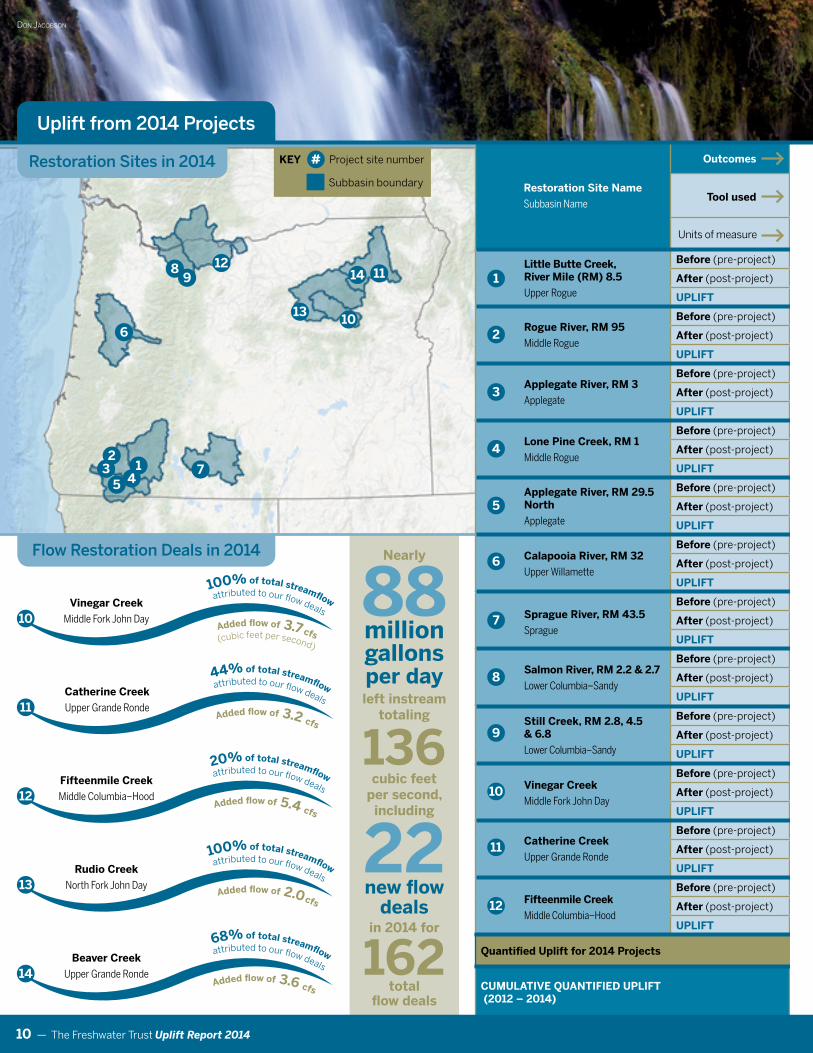
=Nearly
88
milliongallons per day left instream
totaling
136 cubic feet
per second, including
22 new flow
deals in 2014 for
162 total
flow deals
32
4
1114
5
6
7
89
12
1013
1
# Project site number
Subbasin boundary
KEY
Flow Restoration Deals in 2014
Restoration Sites in 2014
Restoration Site Name
Subbasin Name
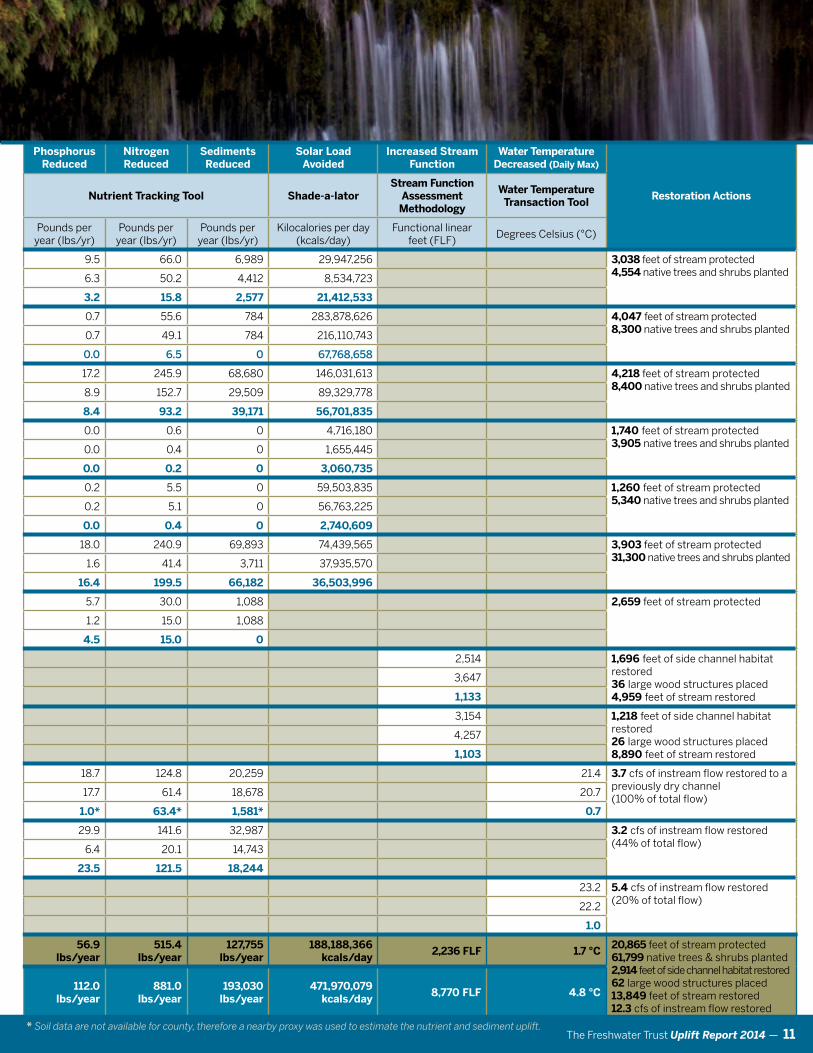
Outcomes Phosphorus
ReducedNitrogen Reduced
Sediments Reduced
Solar Load Avoided
Increased Stream Function
Water Temperature Decreased (Daily Max)
Restoration ActionsTool used Nutrient Tracking Tool Shade-a-latorStream Function
Assessment Methodology
Water Temperature Transaction Tool
Units of measure Pounds per
year (lbs/yr)Pounds per
year (lbs/yr)Pounds per
year (lbs/yr)Kilocalories per day
(kcals/day)Functional linear
feet (FLF)Degrees Celsius (°C)
Before (pre-project) 9.5 66.0 6,989 29,947,256 3,038 feet of stream protected4,554 native trees and shrubs planted
After (post-project) 6.3 50.2 4,412 8,534,723
UPLIFT 3.2 15.8 2,577 21,412,533
Before (pre-project) 0.7 55.6 784 283,878,626 4,047 feet of stream protected 8,300 native trees and shrubs planted
After (post-project) 0.7 49.1 784 216,110,743
UPLIFT 0.0 6.5 0 67,768,658
Before (pre-project) 17.2 245.9 68,680 146,031,613 4,218 feet of stream protected8,400 native trees and shrubs planted
After (post-project) 8.9 152.7 29,509 89,329,778
UPLIFT 8.4 93.2 39,171 56,701,835
Before (pre-project) 0.0 0.6 0 4,716,180 1,740 feet of stream protected3,905 native trees and shrubs planted
After (post-project) 0.0 0.4 0 1,655,445
UPLIFT 0.0 0.2 0 3,060,735
Before (pre-project) 0.2 5.5 0 59,503,835 1,260 feet of stream protected5,340 native trees and shrubs planted
After (post-project) 0.2 5.1 0 56,763,225
UPLIFT 0.0 0.4 0 2,740,609
Before (pre-project) 18.0 240.9 69,893 74,439,565 3,903 feet of stream protected31,300 native trees and shrubs planted
After (post-project) 1.6 41.4 3,711 37,935,570
UPLIFT 16.4 199.5 66,182 36,503,996
Before (pre-project) 5.7 30.0 1,088 2,659 feet of stream protected
After (post-project) 1.2 15.0 1,088
UPLIFT 4.5 15.0 0
Before (pre-project) 2,514 1,696 feet of side channel habitat restored36 large wood structures placed4,959 feet of stream restored
After (post-project) 3,647
UPLIFT 1,133
Before (pre-project) 3,154 1,218 feet of side channel habitat restored26 large wood structures placed8,890 feet of stream restored
After (post-project) 4,257
UPLIFT 1,103
Before (pre-project) 18.7 124.8 20,259 21.4 3.7 cfs of instream flow restored to a previously dry channel (100% of total flow)
After (post-project) 17.7 61.4 18,678 20.7
UPLIFT 1.0* 63.4* 1,581* 0.7
Before (pre-project) 29.9 141.6 32,987 3.2 cfs of instream flow restored (44% of total flow)
After (post-project) 6.4 20.1 14,743
UPLIFT 23.5 121.5 18,244
Before (pre-project) 23.2 5.4 cfs of instream flow restored (20% of total flow)
After (post-project) 22.2
UPLIFT 1.0
Quantified Uplift for 2014 Projects56.9
lbs/year515.4
lbs/year127,755
lbs/year188,188,366
kcals/day 2,236 FLF 1.7 °C
20,865 feet of stream protected61,799 native trees & shrubs planted2,914 feet of side channel habitat restored62 large wood structures placed13,849 feet of stream restored12.3 cfs of instream flow restored
CUMULATIVE QUANTIFIED UPLIFT (2012 – 2014)
112.0 lbs/year
881.0 lbs/year
193,030 lbs/year
471,970,079 kcals/day
8,770 FLF 4.8 °C
Little Butte Creek, River Mile (RM) 8.5
Upper Rogue
Rogue River, RM 95
Middle Rogue
Applegate River, RM 3
Applegate
Lone Pine Creek, RM 1
Middle Rogue
Applegate River, RM 29.5 North
Applegate
Calapooia River, RM 32
Upper Willamette
Sprague River, RM 43.5
Sprague
Salmon River, RM 2.2 & 2.7
Lower Columbia–Sandy
Still Creek, RM 2.8, 4.5 & 6.8
Lower Columbia–Sandy
Vinegar Creek
Middle Fork John Day
Catherine Creek
Upper Grande Ronde
Fifteenmile Creek
Middle Columbia–Hood
1
2
3
4
5
6
7
8
9
10
11
12
10 — The Freshwater Trust Uplift Report 2014
Don JaCobSon
100% of total streamfl ow
10Vinegar Creek
Middle Fork John Day
attributed to our fl ow deals
Added fl ow of 3.7 cfs(cubic feet per second)
20% of total streamfl ow
12Fifteenmile Creek
Middle Columbia–Hood
attributed to our fl ow deals
Added fl ow of 5.4 cfs
68% of total streamfl ow
14Beaver Creek
Upper Grande Ronde
attributed to our fl ow deals
Added fl ow of 3.6 cfs
44% of total streamfl owCatherine Creek
Upper Grande Ronde
attributed to our fl ow deals
Added fl ow of 3.2 cfs
11
100% of total streamfl owRudio Creek
North Fork John Day
attributed to our fl ow deals
Added fl ow of 2.0 cfs
13
Uplift from 2014 Projects
Restoration Site Name
Subbasin Name
Outcomes Phosphorus
ReducedNitrogen Reduced
Sediments Reduced
Solar Load Avoided
Increased Stream Function
Water Temperature Decreased (Daily Max)
Restoration ActionsTool used Nutrient Tracking Tool Shade-a-latorStream Function
Assessment Methodology
Water Temperature Transaction Tool
Units of measure Pounds per
year (lbs/yr)Pounds per
year (lbs/yr)Pounds per
year (lbs/yr)Kilocalories per day
(kcals/day)Functional linear
feet (FLF)Degrees Celsius (°C)
Before (pre-project) 9.5 66.0 6,989 29,947,256 3,038 feet of stream protected4,554 native trees and shrubs planted
After (post-project) 6.3 50.2 4,412 8,534,723
UPLIFT 3.2 15.8 2,577 21,412,533
Before (pre-project) 0.7 55.6 784 283,878,626 4,047 feet of stream protected 8,300 native trees and shrubs planted
After (post-project) 0.7 49.1 784 216,110,743
UPLIFT 0.0 6.5 0 67,768,658
Before (pre-project) 17.2 245.9 68,680 146,031,613 4,218 feet of stream protected8,400 native trees and shrubs planted
After (post-project) 8.9 152.7 29,509 89,329,778
UPLIFT 8.4 93.2 39,171 56,701,835
Before (pre-project) 0.0 0.6 0 4,716,180 1,740 feet of stream protected3,905 native trees and shrubs planted
After (post-project) 0.0 0.4 0 1,655,445
UPLIFT 0.0 0.2 0 3,060,735
Before (pre-project) 0.2 5.5 0 59,503,835 1,260 feet of stream protected5,340 native trees and shrubs planted
After (post-project) 0.2 5.1 0 56,763,225
UPLIFT 0.0 0.4 0 2,740,609
Before (pre-project) 18.0 240.9 69,893 74,439,565 3,903 feet of stream protected31,300 native trees and shrubs planted
After (post-project) 1.6 41.4 3,711 37,935,570
UPLIFT 16.4 199.5 66,182 36,503,996
Before (pre-project) 5.7 30.0 1,088 2,659 feet of stream protected
After (post-project) 1.2 15.0 1,088
UPLIFT 4.5 15.0 0
Before (pre-project) 2,514 1,696 feet of side channel habitat restored36 large wood structures placed4,959 feet of stream restored
After (post-project) 3,647
UPLIFT 1,133
Before (pre-project) 3,154 1,218 feet of side channel habitat restored26 large wood structures placed8,890 feet of stream restored
After (post-project) 4,257
UPLIFT 1,103
Before (pre-project) 18.7 124.8 20,259 21.4 3.7 cfs of instream flow restored to a previously dry channel (100% of total flow)
After (post-project) 17.7 61.4 18,678 20.7
UPLIFT 1.0* 63.4* 1,581* 0.7
Before (pre-project) 29.9 141.6 32,987 3.2 cfs of instream flow restored (44% of total flow)
After (post-project) 6.4 20.1 14,743
UPLIFT 23.5 121.5 18,244
Before (pre-project) 23.2 5.4 cfs of instream flow restored (20% of total flow)
After (post-project) 22.2
UPLIFT 1.0
Quantified Uplift for 2014 Projects56.9
lbs/year515.4
lbs/year127,755
lbs/year188,188,366
kcals/day 2,236 FLF 1.7 °C
20,865 feet of stream protected61,799 native trees & shrubs planted2,914 feet of side channel habitat restored62 large wood structures placed13,849 feet of stream restored12.3 cfs of instream flow restored
CUMULATIVE QUANTIFIED UPLIFT (2012 – 2014)
112.0 lbs/year
881.0 lbs/year
193,030 lbs/year
471,970,079 kcals/day
8,770 FLF 4.8 °C
The Freshwater Trust Uplift Report 2014 — 11 * Soil data are not available for county, therefore a nearby proxy was used to estimate the nutrient and sediment uplift.
NON-PROFIT ORGANIZATIONU.S. POSTAGE
PAIDPORTLAND, OR
PERMIT No. 431365 SW Yamhill Street, Suite 200Portland, OR 97204
ADDRESS SERVICE REQUESTED