energy star score for indoor ice rinks in … · august 2017 energy star score for indoor ice rinks...
TRANSCRIPT

August 2017 ENERGY STAR Score for Indoor Ice Rinks in Canada Page 1
ENERGY STAR Score for Indoor Ice Rinks in Canada
Technical Reference
OVERVIEW
The ENERGY STAR score for indoor ice rinks in Canada applies to public or private buildings that include one or more ice sheets used for recreational or professional skating, hockey or ringette. The objective of the ENERGY STAR score is to provide a fair assessment of the energy performance of a property, relative to its peers, taking into account the climate, weather, and business activities at the property. A statistical analysis of the peer building population is performed to identify the aspects of building activity that are significant drivers of energy use and then to normalize for those factors. The result of this analysis is an equation that predicts the energy use of a property, based on its experienced business activities. The energy use prediction for a building is compared to its actual energy use to yield a 1 to 100 percentile ranking of performance, relative to the national population.
Property types. The ENERGY STAR score for indoor ice rinks applies to public or private buildings thatinclude one or more ice sheets used for recreational or professional skating, hockey or ringette. TheENERGY STAR score applies to entire indoor ice rinks, whether they are single buildings or campuses ofbuildings.
Reference data. The analysis for indoor ice rinks in Canada is based on data from the Survey of EnergyConsumption of Arenas (SECA), which was commissioned by Natural Resources Canada (NRCan) andcarried out by Statistics Canada, and represents the energy consumption year 2014.
Adjustments for weather and business activity. The analysis includes adjustments for:
Number of full time equivalent workers
Number of months that the main indoor ice rink is in use
Total indoor ice rink size (m2)
Average number of indoor ice resurfacings per rink per week
Number of ice rink spectator seats in the facility
Number of curling sheets in the facility
Weather and climate (using heating and cooling degree days, retrieved based on postal code)
Release date. This is the first release of the ENERGY STAR score for indoor ice rinks in Canada.
This document presents details on the development of the 1 – 100 ENERGY STAR score for indoor ice rinks. More information on the overall approach to develop ENERGY STAR scores is covered in our Technical Reference for the ENERGY STAR Score, available at http://www.energystar.gov/ENERGYSTARScore. The subsequent sections of this document offer specific details on the development of the ENERGY STAR score for indoor ice rinks.
OVERVIEW .......................................................................................................................................1 REFERENCE DATA & FILTERS .......................................................................................................2 VARIABLES ANALYZED ...................................................................................................................4 REGRESSION EQUATION RESULTS ..............................................................................................7 ENERGY STAR SCORE LOOKUP TABLE .......................................................................................8 EXAMPLE CALCULATION .............................................................................................................. 11

August 2017 ENERGY STAR Score for Indoor Ice Rinks in Canada Page 2
Technical Reference
REFERENCE DATA & FILTERS
The ENERGY STAR score for ice rinks in Canada applies to public or private buildings that include one or more ice sheets used for recreational or professional skating, hockey or ringette. Buildings that are exclusively used for curling are not currently eligible to earn an ENERGY STAR score but can be benchmarked using this property type. The score does not apply to larger facilities primarily serving professional or collegiate functions and with significant spectator seating (≥5,000 seats). These facilities should most likely be benchmarked using the Entertainment/Public Assembly – Stadium – Indoor Arena property type, at https://portfoliomanager.energystar.gov/pm/glossary#IndoorArena. The reference data used to establish the peer building population is based on data from the Survey on Energy Consumption of Arenas (SECA), which was commissioned by Natural Resources Canada and carried out by Statistics Canada in late 2015 and early 2016. The energy data for the survey was from the calendar year 2014. The raw collected data file for this survey is not publically available. Summary results for the entire sector, produced by Statistics Canada, are available online.
To analyze the building energy and operating characteristics in this survey data, four types of filters were applied to define the peer group for comparison and to overcome any technical limitations in the data: Building Type Filters, Program Filters, Data Limitation Filters, and Analytical Filters. A complete description of each of these categories is provided in our Technical Reference for the ENERGY STAR Score, at www.energystar.gov/ENERGYSTARScore. Figure 1 presents a summary of each filter applied in the development of the ENERGY STAR score for indoor ice rinks and the rationale behind the filter. After all filters were applied, the remaining data set has 1,195 observations. Due to the confidentiality of the survey data, NRCan is not able to identify the number of cases after each filter.
Figure 1 – Summary of Filters for the ENERGY STAR Score for Indoor Ice Rinks
Condition for Including an Observation in the Analysis
Rationale
Must have at least one indoor ice rink Building Type Filter – In order to be considered part of the indoor ice rink peer group, as defined in the survey, the facility must have at least one indoor ice rink, used for hockey and/or skating.
Must not have more than 25% of the area defined as Fitness Centre, Gymnasium and/or Indoor Swimming Pool
Building Type Filter – In order to be considered part of the indoor ice rink peer group, the facility must not have more than 25% of its gross floor area used as a fitness centre, gymnasium (including racquet sport courts) and/or indoor swimming pool. In Portfolio Manager, these areas would fall under the property use type: Fitness Center / Health Club / Gym.
Must have electric energy data Program Filter – Basic requirement to be considered an indoor ice rink is that it requires electrical energy. Electricity can be grid-purchased or produced on site.
Must have at least 1 full-time or part-time worker Program Filter – Basic requirement for a full-time indoor ice rink. There must be at least one worker.
The main Ice Rink must operate at least 5 months per year
Program Filter – Basic requirement to be considered a full-time indoor ice rink
Must not use any “other” fuels for which the energy value is reported
Data Limitation Filter – The survey asked whether fuels other than purchased electricity, on-site generated electricity from renewable sources, natural gas, heating fuel oil, diesel or propane were consumed in the facility. While the unit of energy was defined, the type of energy was not; therefore the energy content of these fuels could not be directly compared. In these occurrences, these observations were removed from the analysis.
Must be built in 2013 or earlier Data Limitation Filter – The survey reported the energy for calendar year 2014. Therefore, if the facility was built in 2014, a full year of energy data would not be available.

August 2017 ENERGY STAR Score for Indoor Ice Rinks in Canada Page 3
Technical Reference
Condition for Including an Observation in the Analysis
Rationale
Must not have reported energy to other buildings
Data Limitation Filter – The survey asked whether the energy reported at the
facility included energy supplied to outdoor pools, sports fields, exterior
bubble domes, tennis courts, or annex buildings. The energy consumption
for these usages could not be quantified. In the cases that reported energy
was supplied to one of the described uses, the cases were removed from
the analysis.
Must have reported all energy used in the facility
Data Limitation Filter – The survey asked if all the energy used at the facility
was reported. In the case that part or all of the energy consumed at the
facility was not reported or missing, these cases were removed from the
analysis.
Must have a worker density less than or equal to
0.75 full-time equivalent workers per 100 square
metres
Analytical Filter – Values determined to be outliers based on analysis of the
data. Outliers are typically clearly outside normal operating parameters for a
facility of this type.
Must have a rink area–to–building area ratio
smaller than or equal to 90%
Analytical Filter – In order to be considered part of the indoor ice rink peer
group, the ice surface cannot constitute more than 90% of the building area.
Must have a spectator seating density less than
or equal to 200 spectator seats per 100 m²
Analytical Filter – Values determined to be outliers based on analysis of the
data. Outliers are typically clearly outside normal operating parameters for a
facility of this type.
Must have an average weekly number of
resurfacings per rink less than or equal to 110
Analytical Filter – Values determined to be outliers based on analysis of the
data. Outliers are typically clearly outside normal operating parameters for a
facility of this type.
Must have a spectator seating capacity less than
or equal to 5,000 seats
Analytical Filter – Values determined to be outliers based on analysis of the
data. Outliers are typically clearly outside normal operating parameters for a
facility of this type.
Of the filters applied to the reference data, some result in constraints on calculating a score in Portfolio Manager, and others do not. Building Type and Program Filters are used to limit the reference data to include only properties that are eligible to receive a score in Portfolio Manager, and are therefore related to eligibility requirements. In contrast, Data Limitation Filters account for limitations in the data available during the analysis, but do not apply in Portfolio Manager. Analytical Filters are used to eliminate outlier data points or different subsets of data, and may or may not affect eligibility. In some cases, a subset of the data has a different behaviour from the rest of the properties, in which case an Analytical Filter is used to determine eligibility in Portfolio Manager. In other cases, Analytical Filters exclude a small number of outliers with extreme values that skew the analysis, but do not affect eligibility requirements. A full description of the criteria you must meet to get a score in Portfolio Manager is available at www.energystar.gov/EligibilityCriteria.
Related to the filters and eligibility criteria described above, another consideration is how Portfolio Manager treats properties that are situated on a campus. The main unit for benchmarking in Portfolio Manager is the property, which may be used to describe either a part of a building, a single building or a campus of buildings. The applicability of the ENERGY STAR score depends on the type of property. The ENERGY STAR score applies to an entire indoor ice rink facility, whether it is a single building or a campus of buildings. Indoor ice rink facilities may have multiple buildings that are all integral to the primary activity. One building may contain an ice rink, another, a second ice rink and a third, a locker room. In this case, the campus can get an ENERGY STAR score as long as the energy for all the buildings is metered and reported. For cases where all the activities are contained within one building, that indoor ice rink can get a building ENERGY STAR Score.

August 2017 ENERGY STAR Score for Indoor Ice Rinks in Canada Page 4
Technical Reference
VARIABLES ANALYZED
To normalize for differences in business activity, we perform a statistical analysis to understand what aspects of building activity are significant with respect to energy use. The filtered reference data set, described in the previous section, is analyzed using a weighted ordinary least squares regression, which evaluates energy use relative to business activity (e.g. number of workers, operating months per year, and climate). This linear regression yields an equation that is used to compute energy use intensity (also called the dependent variable) based on a series of characteristics that describe the business activities (also called independent variables). This section details the variables used in the statistical analysis for indoor ice rinks in Canada.
Dependent Variable
The dependent variable is what we try to predict with the regression equation. For the indoor ice rink analysis, the dependent variable is energy consumption expressed in source energy use intensity (source EUI). This is equal to the total source energy use of the property divided by the gross floor area. The regression analyzes the key drivers of source EUI – those factors that explain the variation in source energy use per square metre in indoor ice rinks. The unit for source EUI in the Canadian model is the gigajoule per square metre (GJ/m2) per year.
Independent Variables
The SECA data contains numerous building property attributes that NRCan identified as potentially important for indoor ice rinks. Based on a review of the available variables in the SECA data, in accordance with the criteria for inclusion,1 NRCan initially analyzed the following variables in the regression analysis:
Gross building area (m²)
Heating degree days (HDD)
Cooling degree days (CDD)
Average outdoor temperature (°C)
Number of full-time and part-time workers
Weekly hours of operation
Months of operation per year
Number of computers, computer servers and cash registers
Presence of a gymnasium
Main use of the rink(s)
Area of ice rink(s)
Presence of indoor and outdoor rink(s)
Presence of ice refrigeration equipment
Number of spectator seats
Number of ice resurfacings per week
Number of curling sheets
Presence of a gymnasium and/or fitness centre
Floor area of a gymnasium and/or fitness centre
Presence of concession stands, restaurants and bars
Number of concession stands, restaurants and bars
1 For a complete explanation of these criteria, refer to our Technical Reference for the ENERGY STAR Score, at www.energystar.gov/ENERGYSTARScore.

August 2017 ENERGY STAR Score for Indoor Ice Rinks in Canada Page 5
Technical Reference
Presence of a pool
Area of a pool
Number of interior parking spaces
Number of heated interior parking spaces
Number of exterior parking spaces
NRCan and EPA perform extensive review on all of these operational characteristics. In addition to reviewing each characteristic individually, characteristics are reviewed in combination with each other (e.g. number of spectator seats per number of rinks). As part of the analysis, some variables are reformatted to reflect the physical relationships of building components. For example, the number of workers can be evaluated in a density format. The number of workers per square metre (as opposed to the gross number of workers) could be expected to be related to the energy use per square metre. Also, based on analytical results and residual plots, variables are examined using different transformations (such as the natural logarithm, abbreviated as Ln). The analysis consists of multiple regression formulations. These analyses are structured to find the combination of statistically significant operating
characteristics that explain the greatest amount of variance in the dependent variable: source EUI.
The final regression equation includes the following variables:
Average number of weekly ice resurfacings per rink
Number of spectator seats per 100 square metres
Natural logarithm of the number of months that the main rink is in use
Number of full-time equivalent workers per 100 square metres
Percentage of total building area that is covered by ice rinks
Number of curling sheets
Number of heating degree days (HDD)
Number of cooling degree days (CDD)
These variables are used together to compute the predicted source EUI for indoor ice rinks. The predicted source EUI is the mean EUI for a hypothetical population of buildings that share the same values for each of these characteristics. That is, the mean energy for buildings that operate like your building.
Worker Analysis
NRCan and EPA analyzed the part-time workers, the full-time workers, the full-time equivalent (FTE) workers and their densities (per 100 m2). An increase in any worker variable resulted in an increase in EUI. The number of FTE workers per 100 m² is defined as the number of full-time workers plus one quarter of the number of part-time workers, (i.e. part-time workers were assumed to be working a quarter of a full-time worker’s shift), per 100 m². The number of FTE workers per 100 m² was chosen as a variable since FTE density was consistently the most statistically significant worker variable.
Further analysis indicated that facilities with high FTE worker density did not behave like other facilities and reduced the stability of the statistical models. It was necessary to filter out observations with high FTE worker density (> 0.75 FTE workers per 100 m2). For the purposes of ENERGY STAR score calculation, a worker density value of 0.75 workers per 100 m2 will be assigned to facilities with FTE worker densities above this threshold.

August 2017 ENERGY STAR Score for Indoor Ice Rinks in Canada Page 6
Technical Reference
Property Floor Area and Indoor Ice Area Analysis
Several variables related to the size of the building were evaluated, including the gross floor area and the indoor ice rink area. The variable that was consistently statistically significant was the percentage of indoor ice rink area, or the ratio between the indoor ice rink area and the building area. Analysis indicated that facilities with large indoor ice rink percentages did not behave the same way as the majority of the observations. As a result, buildings with indoor ice rink percentages greater than 90% were excluded from the regression analysis and cannot receive an ENERGY STAR score. It is important to note that the total building size is still used to calculate density variables such as the number of FTE workers per 100 m² and EUI.
Spectator Seating Capacity and High-Capacity Venue Analysis
The spectator seating capacity density (number of seats per 100 m²) was consistently statistically significant during the development of the indoor ice rinks model. However, spectator seating density had to be at least 20 seats per 100 m2 before it affected EUI. Therefore, a minimum spectator seating density was applied, and a spectator seating density value of 20 seats per 100 m2 will be assigned to facilities with spectator seating densities below this threshold.
High-capacity venues, defined as facilities with spectator seating capacity greater than 5,000, have different operational characteristics than recreational rinks. While a spectator seating capacity variable could potentially normalize high seating capacity ice rinks, there was concern that this variable on its own would not adequately capture other important operational variables for these building types. Additional analysis specific to this building type is required, as these other potential variables were not captured in the SECA survey. Therefore, any indoor ice rink with a spectator seating capacity greater than 5,000 seats will not receive an ENERGY STAR score.
Swimming Pools, Gymnasiums and Fitness Centres Analysis
Several variables related to the use of gymnasium, fitness centres and swimming pools were evaluated during the analysis, including the months of use of these spaces and their respective areas. During the analysis, it was found that facilities that have swimming pools tend to consume more energy compared to facilities without swimming pools, due to certain operational difference such as hours of operation (e.g. most swimming pools are open 12 months, while most ice rinks are open only 8 months). Due to the number of operational differences, swimming pools, gymnasiums and fitness centres were not considered supporting spaces for indoor ice rinks. To properly benchmark facilities, users should benchmark their gymnasium, fitness centre and swimming pool areas, including associated spaces, under the Fitness Center/Health Club/Gym building type.
To be eligible for the ENERGY STAR score for indoor ice rink, less than 25% of facility space must be dedicated to swimming pools, gymnasiums or fitness centres.
Testing
Finally, NRCan further analyzed the regression equation using actual data that has been entered in Portfolio Manager and the results of the Canadian Recreation Facilities Council National Arena Census May 2005 – December 2005. This provided another set of buildings to examine, in addition to the SECA data, to see the ENERGY STAR scores and distributions, and to assess the impacts and adjustments. This analysis on a separate dataset provided a second level of verification to ensure that there was a good distribution of scores.
It is important to reiterate that the final regression equation is based on nationally representative reference data from SECA 2014, not on data previously entered into Portfolio Manager or collected as part of the 2005 census.

August 2017 ENERGY STAR Score for Indoor Ice Rinks in Canada Page 7
Technical Reference
REGRESSION EQUATION RESULTS
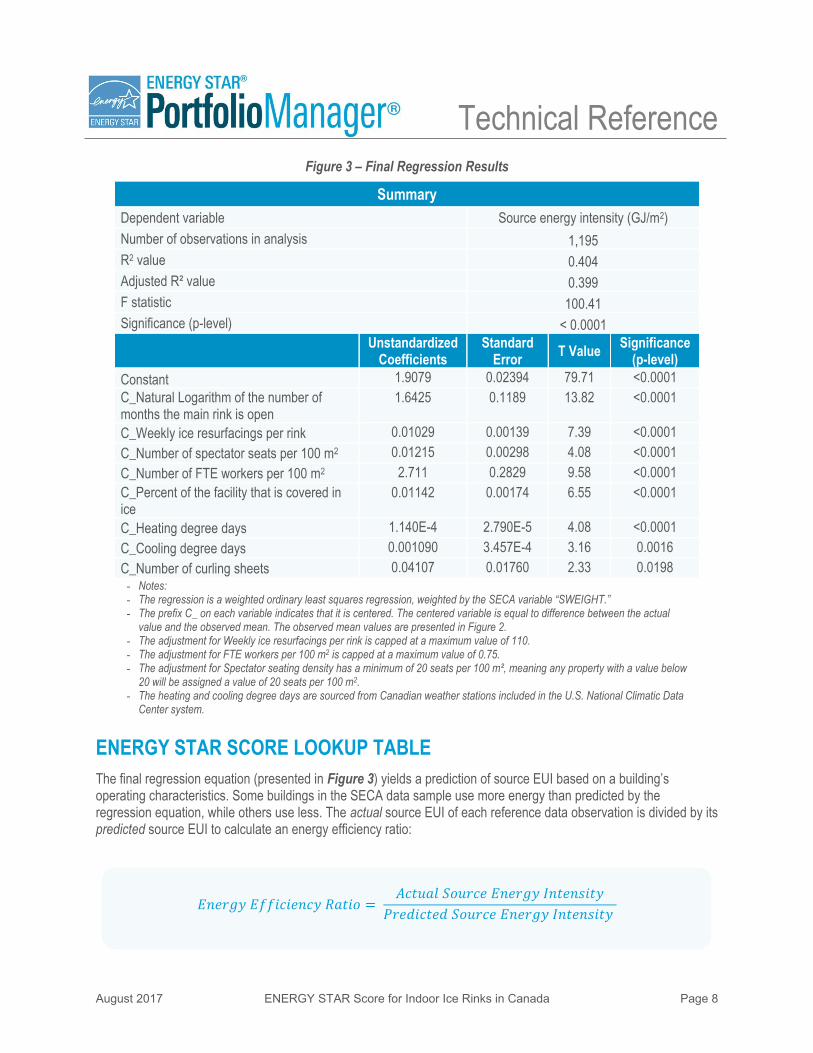
The final regression is a weighted ordinary least squares regression across the filtered data set of 1,195 observations. The dependent variable is source EUI. Each independent variable is centered relative to the weighted mean value, presented in Figure 2. The final equation is presented in Figure 3. All variables in the regression equation are significant at the 95% confidence level or better, as shown by their respective significance levels.
The regression equation has a coefficient of determination (R2) value of 0.404, indicating that this equation explains 40.4% of the variance in source EUI for indoor ice rink facilities. Because the final equation is structured with energy per unit area as the dependent variable, the explanatory power of the area is not included in the R2 value, and thus this value appears artificially low. Re-computing the R2 value in units of source energy2 demonstrates that the equation actually explains 77.5% of the variation in total source energy of indoor ice rinks.
Detailed information on the ordinary least squares regression approach is available in our Technical Reference for the ENERGY STAR Score, at www.energystar.gov/ENERGYSTARscore.
Figure 2 – Descriptive Statistics for Variables in Final Regression Equation
Variable Minimum Median Maximum Centering term
Source energy per square metre (GJ/m2) 0.09 1.69 8.41 1.91
Natural Logarithm of the number of months the main rink is open
1.61 1.95 2.48 2.02
Weekly ice resurfacings per rink 4 54.00 110 53.19
Number of spectator seats per 100 m2 20.00 20.00 99.03 23.20
Number of FTE workers per 100 m2 0.01 0.11 0.70 0.14
Percent of the facility that is covered by ice rinks
3.93 45.95 89.95 44.98
Heating degree days 2543 4935 11441 5107
Cooling degree days 0 115 419 131.12
Number of curling sheets 0 0 10.00 0.56
2 The R2 value in Source Energy is calculated as: 1 – (Residual Variation of Y) / (Total Variation of Y). The residual variation is sum of (Actual Source Energyi – Predicted Source Energyi)2 across all observations. The total variation of Y is the sum of (Actual Source Energyi – Mean Source Energy)2 across all observations.
August 2017 ENERGY STAR Score for Indoor Ice Rinks in Canada Page 8
Technical Reference
Figure 3 – Final Regression Results
Summary
Dependent variable Source energy intensity (GJ/m2)
Number of observations in analysis 1,195
R2 value 0.404
Adjusted R² value 0.399
F statistic 100.41
Significance (p-level) < 0.0001
Unstandardized Coefficients
Standard Error
T Value Significance
(p-level)
Constant 1.9079 0.02394 79.71 <0.0001
C_Natural Logarithm of the number of months the main rink is open
1.6425 0.1189 13.82 <0.0001
C_Weekly ice resurfacings per rink 0.01029 0.00139 7.39 <0.0001
C_Number of spectator seats per 100 m2 0.01215 0.00298 4.08 <0.0001
C_Number of FTE workers per 100 m2 2.711 0.2829 9.58 <0.0001
C_Percent of the facility that is covered in ice
0.01142 0.00174 6.55 <0.0001
C_Heating degree days 1.140E-4 2.790E-5 4.08 <0.0001
C_Cooling degree days 0.001090 3.457E-4 3.16 0.0016
C_Number of curling sheets 0.04107 0.01760 2.33 0.0198
- Notes: - The regression is a weighted ordinary least squares regression, weighted by the SECA variable “SWEIGHT.” - The prefix C_ on each variable indicates that it is centered. The centered variable is equal to difference between the actual
value and the observed mean. The observed mean values are presented in Figure 2. - The adjustment for Weekly ice resurfacings per rink is capped at a maximum value of 110. - The adjustment for FTE workers per 100 m2 is capped at a maximum value of 0.75. - The adjustment for Spectator seating density has a minimum of 20 seats per 100 m², meaning any property with a value below
20 will be assigned a value of 20 seats per 100 m2. - The heating and cooling degree days are sourced from Canadian weather stations included in the U.S. National Climatic Data
Center system.
ENERGY STAR SCORE LOOKUP TABLE
The final regression equation (presented in Figure 3) yields a prediction of source EUI based on a building’s operating characteristics. Some buildings in the SECA data sample use more energy than predicted by the regression equation, while others use less. The actual source EUI of each reference data observation is divided by its predicted source EUI to calculate an energy efficiency ratio:
𝐸𝑛𝑒𝑟𝑔𝑦 𝐸𝑓𝑓𝑖𝑐𝑖𝑒𝑛𝑐𝑦 𝑅𝑎𝑡𝑖𝑜 = 𝐴𝑐𝑡𝑢𝑎𝑙 𝑆𝑜𝑢𝑟𝑐𝑒 𝐸𝑈𝐼
𝑃𝑟𝑒𝑑𝑖𝑐𝑡𝑒𝑑 𝑆𝑜𝑢𝑟𝑐𝑒 𝐸𝑈𝐼 𝐸𝑛𝑒𝑟𝑔𝑦 𝐸𝑓𝑓𝑖𝑐𝑖𝑒𝑛𝑐𝑦 𝑅𝑎𝑡𝑖𝑜 =
𝐴𝑐𝑡𝑢𝑎𝑙 𝑆𝑜𝑢𝑟𝑐𝑒 𝐸𝑛𝑒𝑟𝑔𝑦 𝐼𝑛𝑡𝑒𝑛𝑠𝑖𝑡𝑦
𝑃𝑟𝑒𝑑𝑖𝑐𝑡𝑒𝑑 𝑆𝑜𝑢𝑟𝑐𝑒 𝐸𝑛𝑒𝑟𝑔𝑦 𝐼𝑛𝑡𝑒𝑛𝑠𝑖𝑡𝑦

August 2017 ENERGY STAR Score for Indoor Ice Rinks in Canada Page 9
Technical Reference
An efficiency ratio lower than one (1) indicates that a building uses less energy than predicted, and consequently is more efficient. A higher efficiency ratio indicates the opposite.
The efficiency ratios are sorted from smallest to largest, and the cumulative percent of the population at each ratio is computed using the individual observation weights from the reference data set. Figure 4 presents a plot of this cumulative distribution. A smooth curve (shown in orange) is fitted to the data using a two-parameter gamma distribution. The fit is performed in order to minimize the sum of squared differences between each building’s actual percent rank in the population and each building’s percent rank with the gamma solution. The final fit for the gamma curve yielded a shape parameter (alpha) of 6.844 and a scale parameter (beta) of 0.1453. For this fit, the sum of the squared error is 0.9406.
Figure 4 – Distribution for Indoor Ice Rinks
The final gamma shape and scale parameters are used to calculate the efficiency ratio at each percentile (1 to 100) along the curve. For example, the ratio on the gamma curve at 1% corresponds to a score of 99; only 1% of the population has a ratio this small or smaller. The ratio on the gamma curve at the value of 25% corresponds to the ratio for a score of 75; only 25% of the population has a ratio this small or smaller. The complete score lookup table is presented in Figure 5.
0.0%
10.0%
20.0%
30.0%
40.0%
50.0%
60.0%
70.0%
80.0%
90.0%
100.0%
0.0 1.0 2.0 3.0 4.0 5.0 6.0 7.0
Cu
mu
lati
ve
Pe
rce
nt
Efficiency Ratio (Source EUI / Predicted EUI)
Gamma Fit
Reference Data

August 2017 ENERGY STAR Score for Indoor Ice Rinks in Canada Page 10
Technical Reference
Figure 5 – ENERGY STAR Score Lookup Table for Indoor Ice Rinks
ENERGY STAR Score
Cumulative Percent
Energy Efficiency Ratio
> = < 100 0% 0.0000 0.3259 99 1% 0.3259 0.3762 98 2% 0.3762 0.4109 97 3% 0.4109 0.4385 96 4% 0.4385 0.4619 95 5% 0.4619 0.4825 94 6% 0.4825 0.5011 93 7% 0.5011 0.5181 92 8% 0.5181 0.5340 91 9% 0.5340 0.5489 90 10% 0.5489 0.5630 89 11% 0.5630 0.5764 88 12% 0.5764 0.5893 87 13% 0.5893 0.6017 86 14% 0.6017 0.6137 85 15% 0.6137 0.6253 84 16% 0.6253 0.6366 83 17% 0.6366 0.6476 82 18% 0.6476 0.6584 81 19% 0.6584 0.6689 80 20% 0.6689 0.6792 79 21% 0.6792 0.6893 78 22% 0.6893 0.6993 77 23% 0.6993 0.7091 76 24% 0.7091 0.7189 75 25% 0.7189 0.7284 74 26% 0.7284 0.7379 73 27% 0.7379 0.7473 72 28% 0.7473 0.7566 71 29% 0.7566 0.7659 70 30% 0.7659 0.7750 69 31% 0.7750 0.7842 68 32% 0.7842 0.7932 67 33% 0.7932 0.8023 66 34% 0.8023 0.8113 65 35% 0.8113 0.8202 64 36% 0.8202 0.8292 63 37% 0.8292 0.8381 62 38% 0.8381 0.8471 61 39% 0.8471 0.8560 60 40% 0.8560 0.8649 59 41% 0.8649 0.8739 58 42% 0.8739 0.8828 57 43% 0.8828 0.8918 56 44% 0.8918 0.9008 55 45% 0.9008 0.9099 54 46% 0.9099 0.9189 53 47% 0.9189 0.9281 52 48% 0.9281 0.9372 51 49% 0.9372 0.9465
ENERGY STAR Score
Cumulative Percent
Energy Efficiency Ratio
>= < 50 50% 0.9465 0.9558 49 51% 0.9558 0.9651 48 52% 0.9651 0.9745 47 53% 0.9745 0.9840 46 54% 0.9840 0.9936 45 55% 0.9936 1.0033 44 56% 1.0033 1.0131 43 57% 1.0131 1.0230 42 58% 1.0230 1.0330 41 59% 1.0330 1.0431 40 60% 1.0431 1.0534 39 61% 1.0534 1.0638 38 62% 1.0638 1.0744 37 63% 1.0744 1.0851 36 64% 1.0851 1.0960 35 65% 1.0960 1.1071 34 66% 1.1071 1.1184 33 67% 1.1184 1.1299 32 68% 1.1299 1.1416 31 69% 1.1416 1.1536 30 70% 1.1536 1.1658 29 71% 1.1658 1.1784 28 72% 1.1784 1.1912 27 73% 1.1912 1.2044 26 74% 1.2044 1.2179 25 75% 1.2179 1.2319 24 76% 1.2319 1.2462 23 77% 1.2462 1.2611 22 78% 1.2611 1.2764 21 79% 1.2764 1.2923 20 80% 1.2923 1.3088 19 81% 1.3088 1.3261 18 82% 1.3261 1.3440 17 83% 1.3440 1.3629 16 84% 1.3629 1.3827 15 85% 1.3827 1.4036 14 86% 1.4036 1.4257 13 87% 1.4257 1.4494 12 88% 1.4494 1.4747 11 89% 1.4747 1.5021 10 90% 1.5021 1.5319 9 91% 1.5319 1.5646 8 92% 1.5646 1.6012 7 93% 1.6012 1.6427 6 94% 1.6427 1.6909 5 95% 1.6909 1.7486 4 96% 1.7486 1.8212 3 97% 1.8212 1.9207 2 98% 1.9207 2.0844 1 99% 2.0844 > 2.0844

August 2017 ENERGY STAR Score for Indoor Ice Rinks in Canada Page 11
Technical Reference
EXAMPLE CALCULATION
As detailed in our Technical Reference for the ENERGY STAR Score, at www.energystar.gov/ENERGYSTARScore, there are five steps to compute a score. The following is a specific example for the score for indoor ice rinks.
1 User enters building data into Portfolio Manager
12 months of energy use information for all energy types (annual values, entered in monthly meter entries)
Physical building information (size, location, etc.) and use details describing building activity (hours, etc.)
Energy Data Value
Electricity 120,000 kWh
Natural gas 31,225 m3
Property Use Details Value
Gross floor area (m2) 3,017
HDD (provided by Portfolio Manager, based on postal code) 6,097
CDD (provided by Portfolio Manager, based on postal code) 89
Area of the indoor ice rinks (m2) 1,320
Number of indoor ice rinks 1
Number of ice resurfacings per week (total) 20
Number of months that the main indoor ice rink is open 5
Number of full-time equivalent workers 1
Number of curling sheets 4
Spectator seating capacity 300
2 Portfolio Manager computes the actual source EUI
Total energy consumption for each fuel is converted from billing units into site energy and source energy.
Source energy values are added across all fuel types.
Source energy is divided by gross floor area to determine actual source EUI.
Computing Actual Source EUI
Fuel Billing Units
Site GJ Multiplier
Site GJ Source
Multiplier Source GJ
Electricity 120,000 kWh 0.0036 432 2.05 886
Natural gas 31,225 m3 0.03843 1200 1.02 1,224
Total Source Energy (GJ) 2110
Source EUI (GJ/m2) 0.699

Technical Reference
ENERGY STAR® is a U.S. Environmental Protection Agency program helping businesses and individuals fight climate change through superior energy efficiency.
3 Portfolio Manager computes the predicted source EUI
Using the property use details from Step 1, Portfolio Manager computes each building variable value in theregression equation (determining the density as necessary).
The centering values are subtracted to compute the centered variable for each operating parameter.
The centered variables are multiplied by the coefficients from the regression equation to obtain a predictedsource EUI.
Computing Predicted Source EUI
Variable Actual
Building Value
Reference Centering
Value
Building Centered Variable
Coefficient Coefficient x Centered
Variable
Constant - - - 1.908 1.908
Natural Logarithm of the number of months the main rink is open
1.609 2.02 -0.4106 1.643 -0.674
Weekly ice resurfacings per rink 20 53.19 -0.3319 0.01029 -0.342
Number of spectator seats per 100 m2
20 23.20 -3.20 0.01215 -0.039
Number of FTE workers per 100 m2
0.03 0.14 -0.11 2.7113 -0.290
Percent of the facility that is covered in ice
43.75 44.98 -1.23 0.01142 -0.014
Number of curling sheets 4 0.56 3.44 0.0001140 0.141
Heating degree days 6097 5107 989.972 0.001090 0.113
Cooling degree days 89 131.12 -42.12 0.04107 -0.046
Predicted Source EUI (GJ/m2) 0.757
4 Portfolio Manager computes the energy efficiency ratio
The ratio equals the actual source EUI (Step 2) divided by predicted source EUI (Step 3).
Ratio = 0.699 / 0.757= 0.9231
5 Portfolio Manager uses the efficiency ratio to assign a score via a lookup table
The ratio from Step 4 is used to identify the score from the lookup table.
A ratio of 0.9231 is less than 0.9281 (requirement for a score of 53) but greater than 0.9189 (requirement fora score of 54).
The ENERGY STAR score is 53.