energy smart industrial: wells rural electric/newmont ...€¦ · energy smart industrial: wells...
TRANSCRIPT

B O N N E V I L L E P O W E R A D M I N I S T R A T I O N
Energy Smart Industrial: Wells Rural Electric/Newmont
Industrial Case Study
byTommi Reynolds, Industrial Efficiency Manager, Wells Rural Electric
Jeff Hare, ESIP, Energy Smart Industrial
May 10, 2011

B O N N E V I L L E P O W E R A D M I N I S T R A T I O N
2
Overview
Wells Rural Electric Company
Newmont Mining Corporation
Conservation Mindset
Identified Projects
Future Challenges
Lessons Learned

B O N N E V I L L E P O W E R A D M I N I S T R A T I O N
3
Wells Rural Electric Company
Serves Northeastern Nevada• 10,000 square miles of service territory• 1,398 miles of power lines• Incorporated in 1958• Started serving three mining loads in 1985• 5,905 total customers• 661,218,000 kWh/yr mining load• 793,145,000 kWh/yr total utility load• Three customers utilize 83% of the utility load

B O N N E V I L L E P O W E R A D M I N I S T R A T I O N
Wells Rural Electric Company
4
WREC
B O N N E V I L L E P O W E R A D M I N I S T R A T I O N
5
WREC • Spend CRC budget • Focus on Residential, Small Commercial and
Irrigation• Used as public relations tool• Approach: WREC engineers and accountants
worked with Newmont
“Old” Conservation Mindset

B O N N E V I L L E P O W E R A D M I N I S T R A T I O N
6
Newmont Mining Corporation
1964 – Gold discovered in Nevada
1985 – Gold Quarry site opened for production
Gold Quarry production 1.8 million ounces
in 2010
Currently over 2,000 employees
Estimated 590,000,000 kWh/yr (67 aMW) at Gold Quarry site
B O N N E V I L L E P O W E R A D M I N I S T R A T I O N
“Old” Conservation Mindset
Newmont• Focus on production during boom times• No investment in long term savings during bust
times• Past conservation assessment (PACE) was a
waste of time• WREC’s rates were affordable
7
B O N N E V I L L E P O W E R A D M I N I S T R A T I O N
Reasons for Changes
What has changed?• Higher power prices• Tiered rates coming• Climate change and carbon tax• TS power plant requirements• BPA’ s Energy Smart Industrial Program!
8
B O N N E V I L L E P O W E R A D M I N I S T R A T I O N
“Current” Conservation Mindset
WREC• Savings can be cost-effective alternative to
market rates and new resources• Focus on conservation cost and availability in
all rate classes, including industrial• Complete team effort
9

B O N N E V I L L E P O W E R A D M I N I S T R A T I O N
“Current” Conservation Mindset
Newmont• Can affect bottom line power costs• Can affect overall productivity• Can offset TS Power Plant requirements• Can offset future growth• Creates a positive public image
10
B O N N E V I L L E P O W E R A D M I N I S T R A T I O N
Big Picture View
New People, New Approach
Create a vision of the value energy efficiency creates for all parties
Get a blend of corporate, regional and local folks involved in the process
Inform top local Newmont management of ESI program and get buy-in for energy efficiency
11
B O N N E V I L L E P O W E R A D M I N I S T R A T I O N
ESI Time Frame
Nov 2009, WREC opts into ESI Program
Jan 2010, initial contact between Jeff Hare and Tommi Reynolds
May 2010, face-to-face meeting between Jeff Hare and Tommi Reynolds
June 2010 – First ESI, WREC, Newmont meeting
Aug 2010 – Meeting with top Gold Quarry management
12

B O N N E V I L L E P O W E R A D M I N I S T R A T I O N
ESI Time Frame
Oct 2010 – Site scoping visit completed
Nov 2010 – Lighting audit conducted
Feb 2011 – Review scoping report and lighting audit with Gold Quarry team
Mar 2011 – Mill 5 compressed air analysis completed, Track and Tune
April 2011 – Mill 6 process fan analysis completed, custom project
13

B O N N E V I L L E P O W E R A D M I N I S T R A T I O N
Potential Projects
Lighting Upgrade
Mill 5 Compressed Air System
Mill 6 Process Fans
Other Possible Projects
Currently identified almost 5 aMW in possible savings at Gold Quarry site
14
B O N N E V I L L E P O W E R A D M I N I S T R A T I O N
Facility Wide Lighting
Lighting audit performed by two contractors
Covered Mill 5, Mill 6 and Admin Buildings
Baseline: ~6.1 M kWh/yr, ~4,500 fixtures
Est. energy savings: ~2,600,000 kWh/yr
Est. project cost: $876,702
Est. simple payback: 3.3 years after utility incentive of 70%
15

B O N N E V I L L E P O W E R A D M I N I S T R A T I O N
Newmont Gold Quarry – Mill 6
16

B O N N E V I L L E P O W E R A D M I N I S T R A T I O N
Mill 5 Compressed Air
Six separate compressed air systems
Baseline: Total 3,385 hp, 11.1 M kWh/yr
Looking for low cost/no cost changes (T&T)
Energy engineer identified 4.4 M kWh/yr savings
Estimated annual savings of $132,000
Estimated project cost $150,000 plus tracking system
17
B O N N E V I L L E P O W E R A D M I N I S T R A T I O N
Mill 6 Process Fans
Identified six large process fans totaling 4,150 hp that use inlet damper control
Three fans average less than 20% open on the damper, two average 40% open
Baseline: 13.8 M kWh/yr
Est. savings: XXX kWh/yr
18

B O N N E V I L L E P O W E R A D M I N I S T R A T I O N
Fan Systems
19
B O N N E V I L L E P O W E R A D M I N I S T R A T I O N
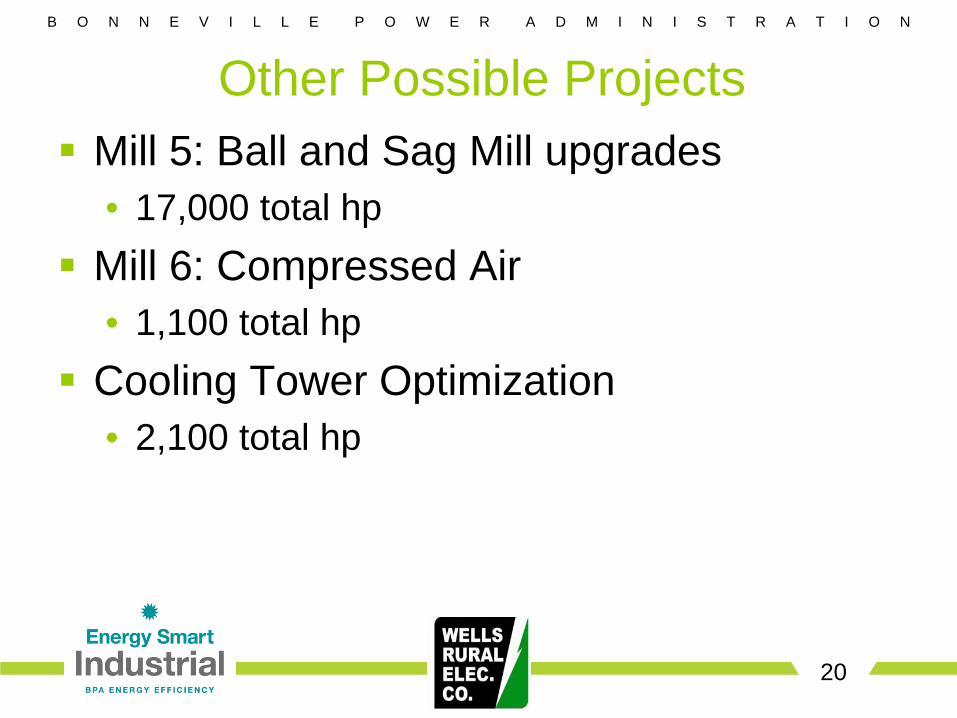
Other Possible Projects
Mill 5: Ball and Sag Mill upgrades• 17,000 total hp
Mill 6: Compressed Air• 1,100 total hp
Cooling Tower Optimization• 2,100 total hp
20

B O N N E V I L L E P O W E R A D M I N I S T R A T I O N
Cooling Tower
21

B O N N E V I L L E P O W E R A D M I N I S T R A T I O N
22
Challenges Going Forward
Financial• Large project funding• Stability of BPA/Utility programs
Mining is currently in a boom cycle
Personnel turnover – risk losing key players• Newmont, BPA, ESI, Utility
Create on-going value for energy efficiency for Newmont, long term vision

B O N N E V I L L E P O W E R A D M I N I S T R A T I O N
23
Lessons Learned
ESI program framework opened doors at WREC and Newmont
Correct day-to-day personnel on all fronts
Upper management/corporate support, buy-in and direction
Relationships and trust with on-site personnel
Engineering experience
Program funding

B O N N E V I L L E P O W E R A D M I N I S T R A T I O N
24
Lessons Learned
“Rome wasn’t built in a day”• 10 months between first meeting and first
system study
Must find VALUE for all parties, push that value to all levels

B O N N E V I L L E P O W E R A D M I N I S T R A T I O N
St. Helens WWTP Retrofit
byTim Lammers, Energy Services Supervisor, Columbia River PUD
Layne McWilliams, Water/Wastewater Sector Specialist
May 10, 2011
B O N N E V I L L E P O W E R A D M I N I S T R A T I O N
27
Project Participants
City of St. Helens – owner and operator of the WWTP
Boise, Inc. – majority of the load and revenue to the plant
SolarBee, Inc. – equipment supplier
Columbia River PUD – energy provider
Energy Smart Industrial / BPA – conservation program technical assistance and facilitation• Cascade Energy as Technical Service Provider (TSP)• ESI Partner• BPA industrial engineers, efficiency staff, and contracting officers

B O N N E V I L L E P O W E R A D M I N I S T R A T I O N
28
Project Summary
Baseline Facility• Primary and Secondary Lagoon System
– Primary has seven surface aerators– Secondary has internal baffles to create three zones– 24 surface aerators over first two zones plus a settling zone
• Phase 1 project focused on Secondary Lagoon– Normally running five to six aerators in Zone 1 and one aerator in
Zone 2– Baseline energy associated with Secondary Lagoon = 3.9 million kWh
B O N N E V I L L E P O W E R A D M I N I S T R A T I O N
29
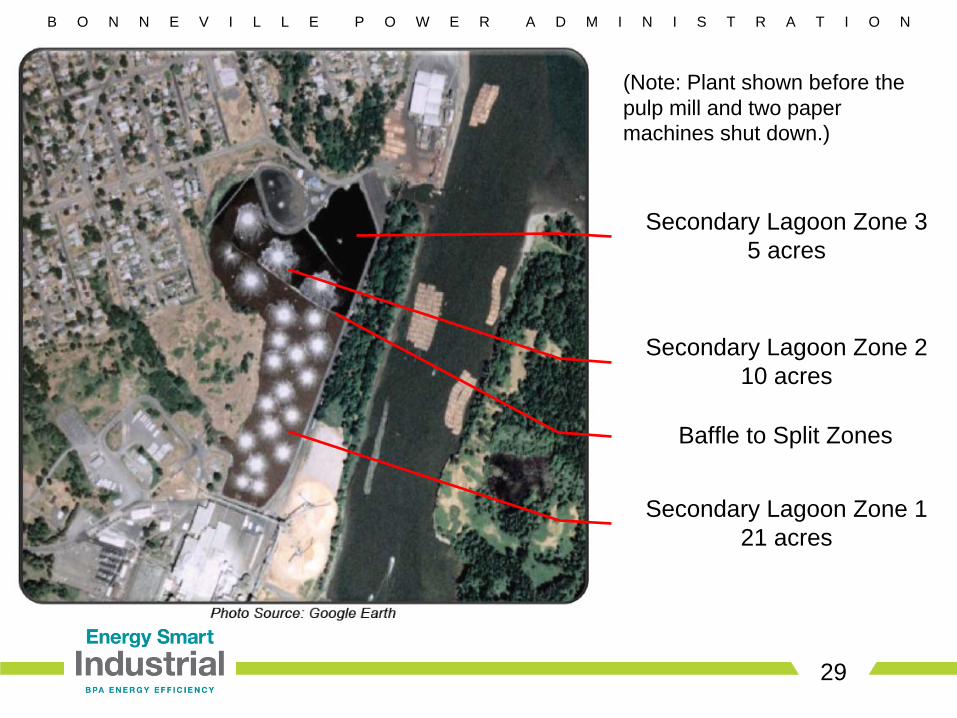
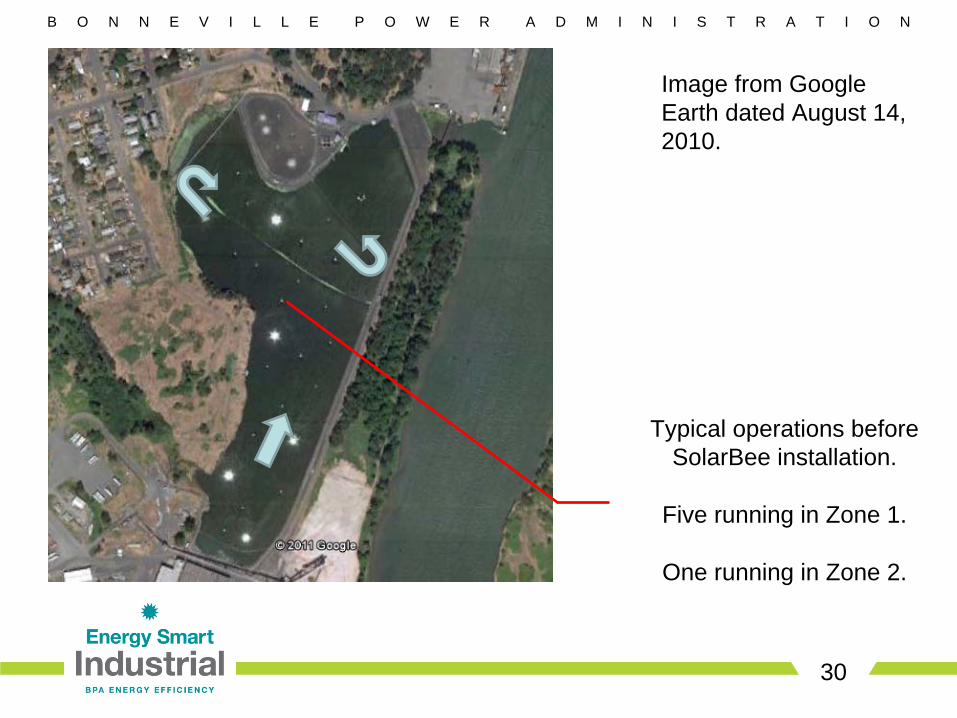
Secondary Lagoon Zone 121 acres
Secondary Lagoon Zone 210 acres
Secondary Lagoon Zone 35 acres
Baffle to Split Zones
(Note: Plant shown before the pulp mill and two paper machines shut down.)
B O N N E V I L L E P O W E R A D M I N I S T R A T I O N
30
Image from Google Earth dated August 14, 2010.
Typical operations before SolarBee installation.
Five running in Zone 1.
One running in Zone 2.

B O N N E V I L L E P O W E R A D M I N I S T R A T I O N
31
Project Summary
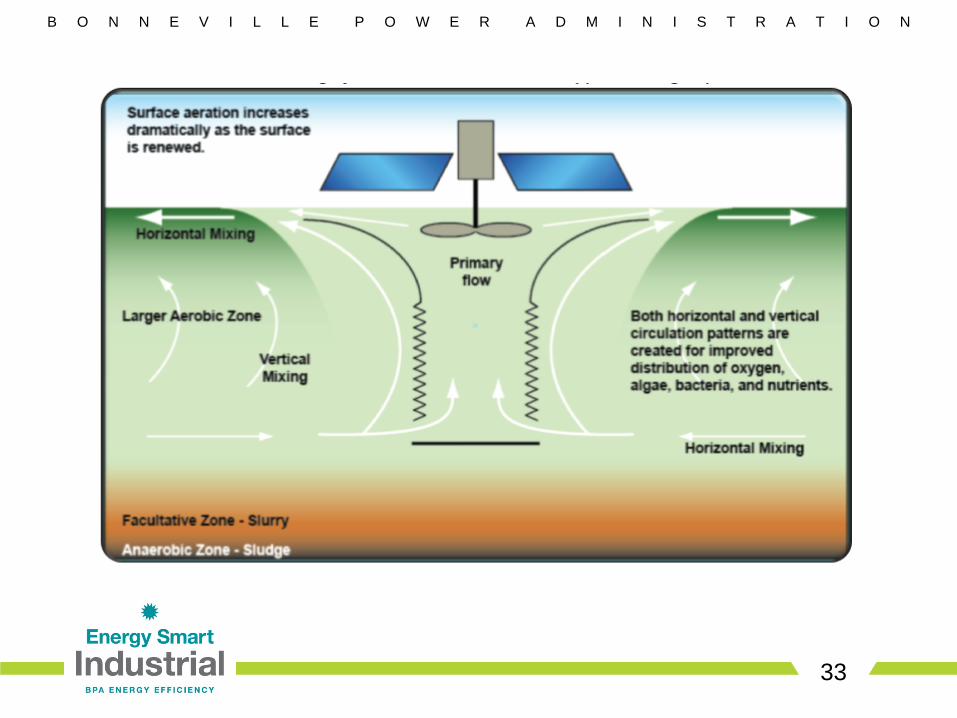
Replace excess “aeration” with more effective “circulation”• Seven SolarBee circulators installed
– Five circulators installed in Zone 1– Two circulators installed in Zone 2
• SolarBee estimated 30 to 60 hp of aeration could be eliminated for each circulator installed
– Aeration horsepower reduction occurs via reduced runtime and reduced number of aerators on line
– The “solar” part of the installation is ignored. The circulators are equipped with shore power because they need to run 24/7 regardless of weather. The DC brushless motor draws less than 1/10th hp.

B O N N E V I L L E P O W E R A D M I N I S T R A T I O N
32
Installed Circulator
B O N N E V I L L E P O W E R A D M I N I S T R A T I O N
33

B O N N E V I L L E P O W E R A D M I N I S T R A T I O N
34
Project Results
0.75 hp of circulators have displaced an average of 253 hp of aeration – or approximately 1.8 million kWh• 36.1 hp per circulator vs. 41.4 hp per circulator estimated
– This is 87% of the originally estimated savings
• No degradation in effluent quality
• No discernible increase in odor

B O N N E V I L L E P O W E R A D M I N I S T R A T I O N
35
Aerator Run Matrix: Pre-Project
Pre-project average of 567 hp (nameplate) on-line.
B O N N E V I L L E P O W E R A D M I N I S T R A T I O N
36
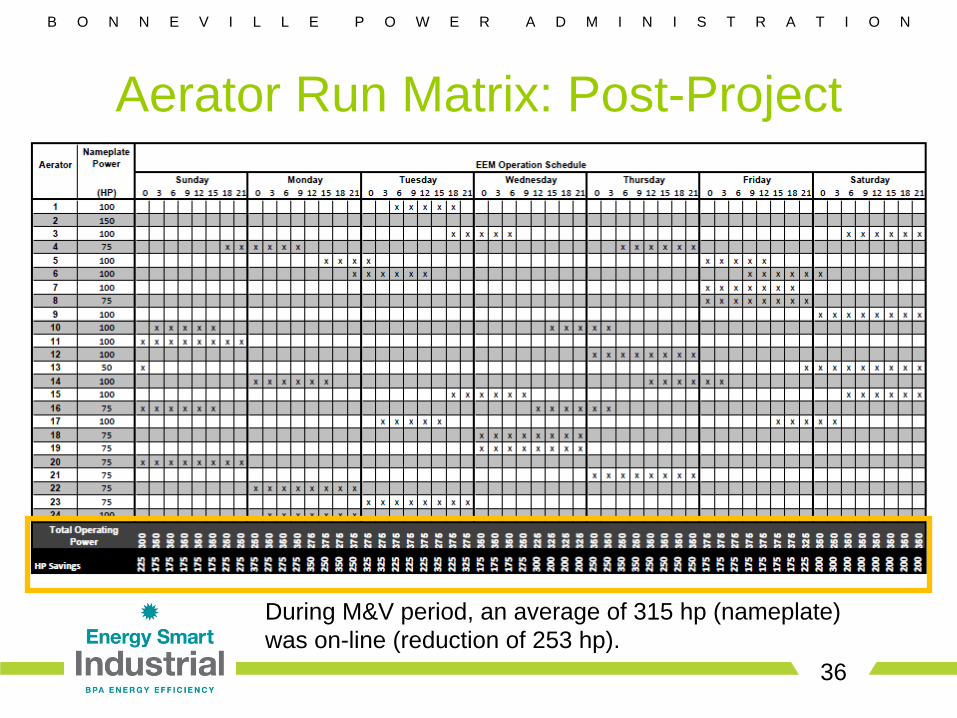
Aerator Run Matrix: Post-Project
During M&V period, an average of 315 hp (nameplate) was on-line (reduction of 253 hp).

B O N N E V I L L E P O W E R A D M I N I S T R A T I O N
37
The Utility’s Perspective
The customer brought the SolarBee product to our attention.
We had some skepticism about whether or not the SolarBee product would meet the requirements of the treatment plant.
This was one of our first Energy Smart Industrial projects and we are very happy to have the kWh savings.
B O N N E V I L L E P O W E R A D M I N I S T R A T I O N
38
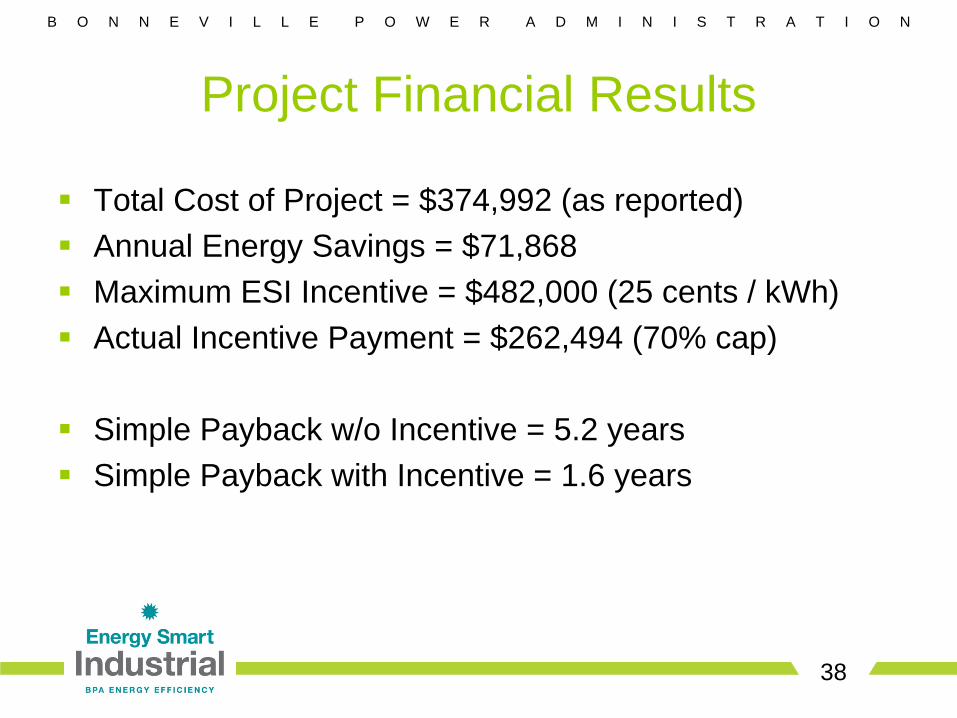
Project Financial Results
Total Cost of Project = $374,992 (as reported)
Annual Energy Savings = $71,868
Maximum ESI Incentive = $482,000 (25 cents / kWh)
Actual Incentive Payment = $262,494 (70% cap)
Simple Payback w/o Incentive = 5.2 years
Simple Payback with Incentive = 1.6 years
B O N N E V I L L E P O W E R A D M I N I S T R A T I O N
39
Lessons Learned
Technical:• Understand the technology early and up-front (e.g. don’t get
hung up on the issue of fuel switching).• Would wait longer for M&V to allow operator to standardize run
times and allow system to stabilize. In 5 months following M&V, the plant has taken an additional 85 hp off-line.
Administrative:• Talk to top management and Board early to ensure everyone is
on the same page for this unique project.

B O N N E V I L L E P O W E R A D M I N I S T R A T I O N
40
Next Steps
Phase 2 in progress • Will add two circulators to Primary Lagoon and displace an
estimated 40 hp of aeration.
Primary Lagoon serves City of St. Helens’ flow before it is mixed with Boise flow in Secondary
Lagoon.

For over 40 years, Cascade Steel Rolling Mills has been providing the Western U.S. and Canada with high quality steel products
produced from recycled scrap metal at our state-of-the-art electric arc furnace steel mill.
Our products include reinforcing bar (rebar), coiled reinforcing
bar, wire rod, merchant bar and other specialty products. We pride ourselves in the quality of our products, our competitive pricing and our exceptional customer service.
Founded in 1968, Cascade Steel Rolling Mills is a steel manufacturing facility that takes recycled metal and turns it into high-quality finished steel products. Located in McMinnville, OR, our electric arc furnace (EAF) mini-
mill produces a wide range of hot rolled products
such as reinforcing bar (rebar), coiled reinforcing bar, wire rod, merchant bar and other specialty products.
Cascade Steel Rolling Mills, Inc.Cascade Steel Rolling Mills, Inc.

Our steel manufacturing process begins at our 80+ acre facility in the melt shop with the melting of scrap metal in our electric arc furnace. The molten steel is then sent to the refining furnace, where adjustments are made to produce a specific grade of steel. Our melt shop's enhanced steel chemistry refining capabilities allow us to produce special alloy grades of steel not currently produced by other mills on the West Coast. Finally, molten steel is cast into long bars called billets in our five-strand continuous billet caster. In fiscal 2009, we produced 401,000 short tons of steel billets.
Steel Mill and Manufacturing Process

Our facilities include two computerized rolling mills that allow for synchronized operation of the rolling mills and related equipment. The billets produced in the melt shop are reheated in two natural gas furnaces into a plastic-like state and then hot-rolled through one of the two rolling mills to form them into the desired shapes to produce the desired end products. In fiscal 2009, we produced 381,000 tons of steel products.
Steel Mill and Manufacturing Process

Cascade Steel was acquired in 1984 by Schnitzer
Steel Industries, Inc., a global leader in the metals recycling industry that has been in business for over a century. As a Schnitzer
subsidiary and part of our parent company's vertical integration, we purchase all of the processed scrap metal we use through Schnitzer's
Metals Recycling Business. Being part of a Fortune 1000 company has enabled us to grow stronger and introduce cost efficiencies and state-of-the art environmental controls into our operations.
Corporate Strength
To maintain our competitive edge, we are frequently investing in
improvements to our facilities. Recent additions and enhancements have increased our operating efficiency, increased the types and volume of products that we can produce and improved the quality of finished products.
It is this commitment to increased efficiency and to the needs of our local community that has led us to pursue the programs offered by the Bonneville Power Administration under the EEnergy SSmart IIndustrial program and specifically the position of the EEnergy PProject MManager.
The Role of the EEnergy PProject MManager
Needs to have “Boots on the Ground”
at the faciity.
Needs to have a passion for efficiency.
Needs to understand the culture.
Needs to have access to the decision makers.
Needs to have a strong relationship with the local utility.
The Energy Project Manager becomes the conduit through whom energy saving ideas flow.
The Energy Project Managers are generally not decision makers but information collectors.
Through the Energy Project Manager Program, Cascade Steel rolling Mills has saved and targeted over 10,440,520 kWh/yr10,440,520 kWh/yr.