energy integration study of a multi-e ect evaporator - core
TRANSCRIPT

Energy integration study of a multi-effect evaporator
Zoe Perin-Levasseur*, Vanessa Palese, Francois Marechal
Ecole Polytechnique Federale de Lausanne, LENI-IGM-STI, Bat. ME A2, Station 9, 1015Lausanne, Switzerland Tel.: +41 21 693 35 13, Fax: +41 21 693 35 02
Email: [email protected]
Abstract
In the pulp and paper industry, multi-effect evaporators are used to evaporate waterfrom black liquor solutions to allow its recycle as chemicals and fuel for the process. Thethermodynamic principle of the multi-effect evaporator consists in a serie of reboilersoperating at different pressures; the water evaporated at one stage is condensed andused as the heat source for another stage. Due to its strong integration with theprocess, it is worth to analyse the integration of the multi-effect evaporator with therest of the process.
To do so a thermo-economic analysis model of the evaporation system has beendevelopped. The example is based on the evaporation system of a calcium bisulfitepulp manufacturing mill located in Switzerland. This system involves 3 multi-effectevaporators fed at different concentrations of black liquor. A systematic analysis ofthe system Grand composite curve has been developed to identify pertinent processmodifications. From this analysis, several modifications like decreasing the ∆Tmin ofa stream, increasing or decreasing pressures of evaporation effects have been evaluated.For each of these measures, we have analysed the thermo-economic aspects, adaptingthe pinch analysis rules to account for the thermo-econmic benefit of integration. Bythese measures, the minimum energy requirement of the multi-effect evaporation sys-tem can be reduced by up to 20%. Resulting from the integration of the utility system,the related utility cost can be diminished of up to 23% from the base case model.
The integration of heat pumping system and the utilities has then been analysedin order to reduce the exergy degradation in the energy conversion system. A thermo-economic analysis including operating and investment cost estimation, evaluation of theNet Present Value and Payback Time of different process configurations correspondingto different energy savings scenarios has been performed. The integration of a heatpump system shows a reduction of the Net Present Value and an acceptable PaybackTime compared to the base case model. A sensitivity analysis on electricity and nat-ural gas prices has then been performed in order to better understand the economiccondition of the integration.
Keywords: multi-effect evaporators, energy integration, heat pumps, thermoeconomic anal-ysis, pulp and paper, pinch analysis
1

Nomenclature
Abbreviations
HEX Heat exchanger -
IC Investment cost ke
MILP Mixed Integer Linear Programming -
NminMER Minimum number of HEX units -
NPV Net Present Value ke
OC Operating cost ke
PBT Payback Time y
Thermoeconomic analysis
AHEXn+1 Remaining HEX area m2
CHEXn+1 Cost of the remaining HEX area ke
∆T lnV Temperature difference K
Ce Electricity cost ke/MWh
Cf Fuel cost ke/t
Cv Steam cost ke/t
E Electricity power kW
mf Fuel flowrate t/h
mv Steam flowrate t/h
Qi Heat load of effect i kW
Qt Total heat load of all evaporator effects kW
Qv Heat load of vertical exchange kW
Ai HEX area of effect i m2
Atotal Total HEX area m2
CHEXtotalCost of total HEX area ke
Cinv Annualised value of the investment cost ke
Ci Cost of HEX area of effect i ke
2

Cop Annual operating cost of the process ke
Ctotal Annual total cost of the process ke
i Annualised interest rate %
l Expected lifetime of the equipment y
nV Number of vertical sections in the composite curve -
time Yearly operating time h/y
UV Heat transfer coefficient W/m2K
Model
∆TBP Boiling point rise ◦C
Sicc Solid content % wt
Tboil Boiling temperature of the substance ◦C
TBP (P ) Boiling temperature of pure water (at the pressure P) ◦C
1 Introduction
The reduction of the energy costs is one of the main concerns of the pulp and paper indus-try. In chemical pulping processes, such as Kraft or sulfite wood pulping, the main energysource comes from the residual liquor charged in lignin and exiting the chips cooking section.Multi-effect evaporators are used to evaporate water from black liquor solutions to allow itsrecycle as chemicals and fuel for the process. The thermodynamic principle of the multi-effect evaporator consists in a serie of reboilers operating at different pressures; the waterevaporated at one stage is condensed and used as the heat source for another stage [9]. Theobjective of the evaporation process in a pulp mill is to increase the pulp solid content from10-18% after pulp washing up to 60-70% in order to obtain a liquor with the highest possiblesolids concentration and minimal corresponding viscosity. The concentrated liquor is thentreated to produce lignosulfonate products and/or to recycle the chemicals and produce pro-cess heat in the recovery boiler. Large amount of water (between 5 and 7 kg water per kgdry solids [3]) must be evaporated in order to maximize the net calorific value in the boiler.Due to its strong integration with the process, it is worth to analyse the integration of themulti-effect evaporator with the rest of the process.
The recovery boiler typically produces 60 to 80% of the steam demand of the mill [1] inwhich liquor evaporation accounts for almost 12% [3]. The objective of this study has beento identify the opportunity of reducing the energy consumed in the evaporator section of a
3

sulfite wood pulping mill located in Switzerland. The project includes an energy integrationstudy, a thermo-economic analysis and a sensitivity analysis on uncertain parameters suchas electricity and natural gas prices.
2 Case study
The method is applied to a bisulfite pulp mill located in Switzerland that produces 127 000t/y of cellulose as a main product. This cellulose is used for pulp making and as chemicalintermediate and plastic moulding. The mill operates also as a biorefinery concept since itproduces by-products such as yeast, ethanol and lignin and fuel for the main boiler of themill. The multi-effect evaporator studied concentrates liquor from 11.8% to 50.1%. Thediluted liquor leaving the digester section is collected in a tank (diluted liquor tank) beforereaching the evaporator. In the mill, there are three trains of multiple-effect evaporatorscalled EA1, EA2, and EA3 (Figure 1). The diluted liquor is sent toward the trains EA1 andEA3. At the exit of these trains the liquor has a solid content respectively equal to 15.2%and 50.7%. The concentrated liquor exiting the EA1 is mixed with part of the liquor dilutedand sent in the EA2 at a solid content of 14.1% to reach, after the evaporators bodies, asolid content of 50%. The concentrated liquor exiting EA2 is mixed with the output ofEA3 obtaining a concentrated liquor with a solid content of 50.1% that is stored in a tank(concentrated liquor tank). An amount of the evaporated water is present as output fromeach train. It is collected and sent to the biological treatment plant (cleaning condensate).The total mass flow rate of liquor treated in the evaporators is equal to 9 t/adt of pulp. Themass flow rate of concentrated liquor before combustion in the recovery boiler is equal to 2.2t/adt of pulp. The balance between these two numbers corresponds to the evaporated watermass flow of 6.8 t/ adt of pulp (76%). The efficiency of the system is calculated consideringthe flow of steam per unit of evaporated water, it corresponds to 0.33 t of steam/t per tonof water.
The pressure of the liquor in storage tanks is supposed equal to 1 bar. In Table 1, themass flow and solid content of liquor at the entrance and the exit of evaporator trains aresummarized while in Table 2, the steam mass flow injected in each train and the evaporatedwater exiting each train is shown. Each train is constituted by a multiple-effect evaporatorwith several stages/effects of evaporation and operated at different pressures as shown inTable 3. In each train, the liquor enters first the evaporator at a lower pressure and, as it isconcentrated, it passes through the stages at higher pressure. As the pressure increases, thetemperature increases too and the volume of liquor decreases. The evaporator is character-ized by a counter-courrent configuration. Trains EA2 and EA3 use steam as source of heatfor the first stages while EA1 uses ethanol coming from a distillation column of the process.Ethanol enters stage ST10EA1 and ST11EA1 at 107◦C and 1.38 bar, steam at 146◦C and2.6 bar enters the ST1EA3 and steam at 147◦C and 2.8 bar enters the K1EA2 and K2EA2.
4

(EA3)
(EA1)
(EA2)
DILUTEDLIQUOR
TANKCONCEN-TRATEDLIQUOR
TANK
...
EVAPORATOR STAGE 1
EVAPORATOR STAGE 3
50.1%
Liquor concentration (%)
Liquor pathSteam/Evaporated water path
SteamEvap. water
EVAPORATOR STAGE 2
K1E
A2
K2E
A2
ST7E
A2
STxE
A2
F (t/adt)X (%)
Liquor flowrate (ton/air-dried ton pulp produced)
Liquorfrom cooking
9 t/adt11.8 % 2.2 t/adt
50.1 %
6 t/adt11.8 %
4.7 t/adt15.2 %
6.8 t/adt14.1 %
1.1 t/adt11.8 %
1.9 t/adt50.0 %
0.3 t/adt50.7 %
To boiler or to be sold
2.1 t/adt11.8 %
Ethanolvapour
Steam
Evap. water
Ethanolcondensate
Figure 1: Simplified evaporator diagram
Table 1: Characteristics of liquorTrain Input Output
Mass flow Solid content Mass flow Solid content(t/h) (%) (t/h) (%)
EA1 84.0 11.8 5.2 15.2EA2 94.9 14.1 26.8 50.0EA3 15.0 11.8 3.49 50.7
Table 2: Characteristics of steam and water evaporated in trains (*equivalent to ethanolvapor used)
Train Steam injected Water evaporated(t/h) (t/h)
EA1 11.3* 18.8EA2 17.7 67.5EA3 3.4 11.4Total 32.4 97.7
3 Model
The model of the evaporator has been built using the equation-solver data-reconciliationsoftware VALI 4.3.0.2 (Belsim s.a, 2005). Liquid and vapor equilibria have been taken into
5

Table 3: Stages and operation parameters of the evaporator systemTrain Stage Pressure Concentration Temperature Evap. water
(bar) (%) (◦C) (t/h)EA1 ST10EA1 0.62 16.2 88.2 3.6
ST11EA1 0.62 15.5 88.1 2.5ST12EA1 0.43 13.9 78.9 4.9ST13EA1 0.31 13.1 71.1 3.7ST14EA1 0.21 12.4 62.3 4.1
EA2 K1EA2 1.78 48.1 124.2 8.3K2EA2 1.78 37.5 121.4 8.1ST6EA2 0.98 30.7 102.6 14.7ST7EA2 0.53 22.9 85.2 14.3ST8EA2 0.29 18.4 70.1 10.9ST9EA2 0.14 16.1 54.1 11.1
EA3 ST1EA3 1.02 49.8 108.1 3.1ST3EA3 0.49 26.4 83.7 2.8ST4EA3 0.27 18.7 68.6 2.9ST5EA3 0.14 14.3 53.9 2.6
account and the boiling rise point of the liquor (∆TBP ) has been calculated taking intoaccount the siccity percentage of the liquor (Sicc) at the exit of each stage of evaporationas shown in the equations 1 and 2 below [11]. Heat losses and pressure drops in piping andequipment have been assumed to be negligible. Pump efficiencies have been assumed at 80%.
∆TBP =8 ∗ Sicc
100 − Sicc(1)
Tboil = TBP (P ) + ∆TBP ( Sicc) (2)
Starting with the present configuration, the heat transfert requirement model that definesthe hot and cold streams to be considered in the pinch analysis, is defined by assemblinggeneric evaporation effect as depicted on Figure 2. The liquor is pumped at the pressureP and enters the actual effect through stream (LIQ INN). Liquor is evaporated using athermal stream (QN) supplied by steam or by evaporated water from the effect (N). Theevaporated water (EV AP WATERN) exits the effect at a fixed pressure and passes throughan heat exchanger (HEX) to extract the heat (QN+1) used for the evaporation of the liquor ofeffect (N + 1). The concentrated liquor (LIQ OUTN) goes to the next effect. The operatingcondition and the corresponding heat load are obtained when the pressure of the effect isfixed. The initial value of the pressures are the one observed in the actual train.
The objective of an energy integration study is to define the process requirements and identifythe energy recovery potentials [5] [6] [8]. In order to identify the heat recovery potentials,the evaporators model has been adapted using a generic evaporation stage heat integration
6

Liquor pathEvaporated water pathThermal stream
QN+1QN
EVAP WATER N EVAP WATER N+1
LIQ IN N+1LIQ IN NLIQ OUT N
EFFECT N EFFECT N+1
Production of warm water
LIQ OUT N+1
CONDENSATE
LIQ IN N+2
Cold water
Warm water
HEX HEX
HEX
Q
PREHEATING
EVAP WATER N+2
Figure 2: Illustration of the actual model of evaporators
model (Figure 3): the evaporated water leaving each effect is cooled down until ambienttemperature (T ambient) and the related heat amount that can be recovered from thisstream is obtained. The heat necessary for the liquor evaporation is supplied by thermalstreams (Q) at constant temperature. This modelling strategy is creating more streamsthan really observed since some of them will indeed be mixed before heat exchange. Themixing problem will be solved during the heat exchanger network design phase when theheat recovery target is defined and the operating conditions are fixed. The major advantageof this representation is to decouple the heat exchangers between the evaporation train andtherefore take advantage of the heat recovery potentials even between stages.
Liquor pathEvaporated water pathThermal stream
QN+1QN
EVAP WATER N EVAP WATER N+1
LIQ IN N+1LIQ IN NLIQ OUT N
EFFECT N EFFECT N+1
Production of warm water
LIQ OUT N+1
CONDENSATE
LIQ IN N+2
Cold water
Warm water
Liquor pathEvaporated water pathThermal stream
QN+1QN
EVAP WATER N EVAP WATER N+1
LIQ IN N+1LIQ IN NLIQ OUT N
EFFECT N EFFECT N+1
LIQ OUT N+1
LIQ IN N+2
T AMBIENTT AMBIENT EVAP WATER N+2 T AMBIENT
HEX HEXHEX
Q
PREHEATING
Q’N Q’N+1 Q’N+2
Figure 3: Illustration of the simplified model of evaporators
7

4 Energy integration
4.1 Defining actual process requirement
Pinch Analysis aims at identifying the heat recovery between hot and cold streams in asystem [4]. It is based on the assumption of a minimum approach temperature difference incounter-current heat exchanger. The pinch analysis starts with an inventory of the hot andcold streams of the process. The streams are then integrated to build hot and cold compos-ite curves. Realising counter-current heat exchanger allows one to compute the maximumpossible heat recovery between hot and cold streams in the process and by energy balanceobtain the minimum energy requirement. The Grand composite curve represents the over-all balance and shows in a temperature-enthalpy diagram, the temperature level on whichthe energy has to be supplied (cold stream) or removed from the process (hot stream). Bydefining the hot and cold streams, the composite curves can be drawn and are illustrated inFigure 4.
280
300
320
340
360
380
400
0 10000 20000 30000 40000 50000 60000 70000 80000 90000
T(K)
Q(kW)
Cold composite curveHot composite curve
Hot utility
Cold utility
Heat recovery
Figure 4: Hot and cold composite curves of the evaporator section
On Figure 4, three important zones can be distinguished: the hot utility requirement (14405 kW), the heat recovery zone representing the possible heat recovery by exchangingbetween hot and cold streams of the process and the cold utility requirement (17 843 kW)corresponding to the remaining heat of the hot streams that has to be evacuated by a coldutility.
The Grand composite curve (Figure 5) allows one to analyse the heat-temperature profileof the heat requirement. This curve will also be used to identify the possible changes inthe operating pressure that will lead to higher heat recovery opportunities transfering coldstreams from above to below the pinch or hot streams from below to above process pinch
8

point. When such condition cannot be reached by process operating conditions changes,the analysis will show the optimal placement of mechanical vapor recompression or thermalrecompression.
280
300
320
340
360
380
400
0 2000 4000 6000 8000 10000 12000 14000 16000 18000
T(K)
Q(kW)
Hot utility
Cold utility
Figure 5: Grand composite curve of the evaporator section
4.2 Scenarios to reduce the utility requirement
The location of the pinch point is the key value for suggesting pertinent modifications ofthe process [6]. Such modifications can be suggested by analysing the composite curves.Three major modifications have been identified (Table 4) and shown in Figure 6. We firstmodify the operating pressure. In order to avoid modifying the pressure, another optionis to modify the ∆Tmin assumption of a specific stream. Changing the value of a single∆Tmin correspond to decide the investment of a well identified heat exchanger. Thereforethe investment-energy trade-off will be analysed for this specific heat exchanger and thefeasibility of the ∆Tmin assumption will be validated by an economical evaluation.
Table 4: Scenarios (modifications) to reduce utility requirementScenario Envisaged modification Value
0 Reference case -1 Increase pressure of effects ST10EA1 and ST11EA1 0.62 to 0.75 bar2 Decrease ∆Tmin/2 of evaporating stream of ST7EA2 2 to 1 K3 Increase pressure of effect ST13EA1 0.31 to 0.38 bar
Decrease pressure of effect ST4EA3 0.27 to 0.20 bar
9

280
300
320
340
360
380
400
0 2000 4000 6000 8000 10000 12000 14000 16000 18000
T(K)
Q(kW)
a) From reference case to scenario 1
Hot utility from 14 405 to 14 164 kWIncrease pressure of effects ST10EA1 and ST11EA1
280
300
320
340
360
380
400
0 2000 4000 6000 8000 10000 12000 14000 16000 18000
T(K)
Q(kW)
b) From scenario 1 to scenario 2
Hot utility from 14 164 to 12 360 kWDecrease deltaTmin/2 of evaporating stream of ST7EA2
280
300
320
340
360
380
400
0 2000 4000 6000 8000 10000 12000 14000 16000
T(K)
Q(kW)
c) From scenario 2 to scenario 3
Increase pressure of effect ST13EA1
Hot utility from 12 360 to 10 996 kWDecrease pressure of effect ST4EA3
280
300
320
340
360
380
400
0 2000 4000 6000 8000 10000 12000 14000 16000
T(K)
Q(kW)
d) Scenario 3 - used for heat pumps integration
Hot utility of 10 996 kW
Figure 6: Scenarios to reduce the energy requirement
For each scenario, the utility requirements and the heat exchanger area are calculated andthe corresponding costs are estimated in Table 5. The energy integration study has beendone with EASY and OSMOSE (LENI, 2008). EASY stands for Energy Analysis andSYnthesis, it has been developed to solve process integration problems for problems whereflowrate of streams have to be optimised. It is therefore mainly developed for optimisingthe integration of the utilities and the combined heat and power production. OSMOSEis a Matlab platform designed for the study of energy conversion systems. The platformallows to link several tools, like flowsheeting, process integration optimisation and thermo-economic evaluation softwares. Among other features, OSMOSE offers a complete suiteof computation and results analysis tools (optimization, sensitivity analysis, pareto curveanalysis, etc.).
When compared to the reference case, these changes allow one to reduce the heat requirementfrom 1.5%, 12.6% and 21.1% respectively; while the heat exchanger area increases by 4.7%,36.4% and 59.4% respectively. The utility costs are consequently lower from a scenarioto another while the investment cost for heat exchanger increases. The greatest change isobserved between scenario 1 and 2. Passing from scenario 0 (reference case) to scenario1 implies a small decrease in utilities cost. The utilities cost decreases significantly whenpassing from scenario 1 to 2 while the cost of the heat exchanger area increases also a lot.Finally passing from scenario 2 to 3 implies a large diminution of utilities cost but a smalleraugmentation of the heat exchanger area cost. All results are resumed in Table 6.
10

Table 5: Scenarios for reducing the energy requirement for the multi-effect evaporation trainsScenario 0 Scenario 1 Scenario 2 Scenario 3
Pinch point (corr.temp) (K) 359 354 344 378Hot utility requirement (kW) 14 405 14 164 12 360 10 996Cold utility requirement (kW) 17 843 17 616 15 813 14 447Hot utility cost (ke/y) 1245 1224 1068 950Cold utility cost (ke/y) 154 152 137 125Cost total utilities (ke/y) 1399 1376 1205 1075Total HEX area (m2) 3875 4058 5286 6176NminMER 16 16 16 16HEX area (m2) 242 254 330 386Cost total HEX area (ke) 603 633 749 763Cost total HEX area/y (ke/y) 70.43 73.95 87.55 88.99
Table 6: Comparison of energy saving scenarios for the multi-effects evaporation train
Scenario 0 Scenario 1 Scenario 2 Scenario 3Comparison with the reference caseUtility demand (%) - -1.5 -12.6 -21.1Cost total utilities (%) - -1.6 -13.9 -23.2Total HEX area (%) - +4.7 +36.4 +59.4Cost total HEX area year (%) - +5.0 +24.3 +26.4Comparison between each scenarioUtility demand (%) - -1.5 -11.3 -9.7Cost total utilities (%) - -1.6 -12.5 -10.8Total HEX area (%) - +4.7 +30.3 +16.8Cost total HEX area year (%) - +5.0 +18.4 +1.6
In Table 6, the heat exchanger investment is estimated applying on adapted formulation ofthe targeting method [2]. It is based on the assumption of the vertical heat exchanges in thecomposite curves (Figure 4). The calculation of the minimum number of units (NminMER)accounts for the possible mixing of condensate before heat exchange. Simple calculationshave been done to obtain the total heat exchanger area and consequently its cost. Themethod is resumed in equations 3, 4 and 5. The cost of the remaining heat exchanger usedto preheat the liquor is obtained with equation 6
Ai =Atotal
Qt
· Qi (3)
11
Atotal =
nV∑k=1
QV
UV · ∆T lnV
(4)
CHEXtotal=
15∑i=1
Ci =15∑i=1
C(Ai) (5)
CHEXn+1 = C(Qt −
∑15i=1 Qi
Qt
· AHEXn+1) (6)
5 Energy saving options
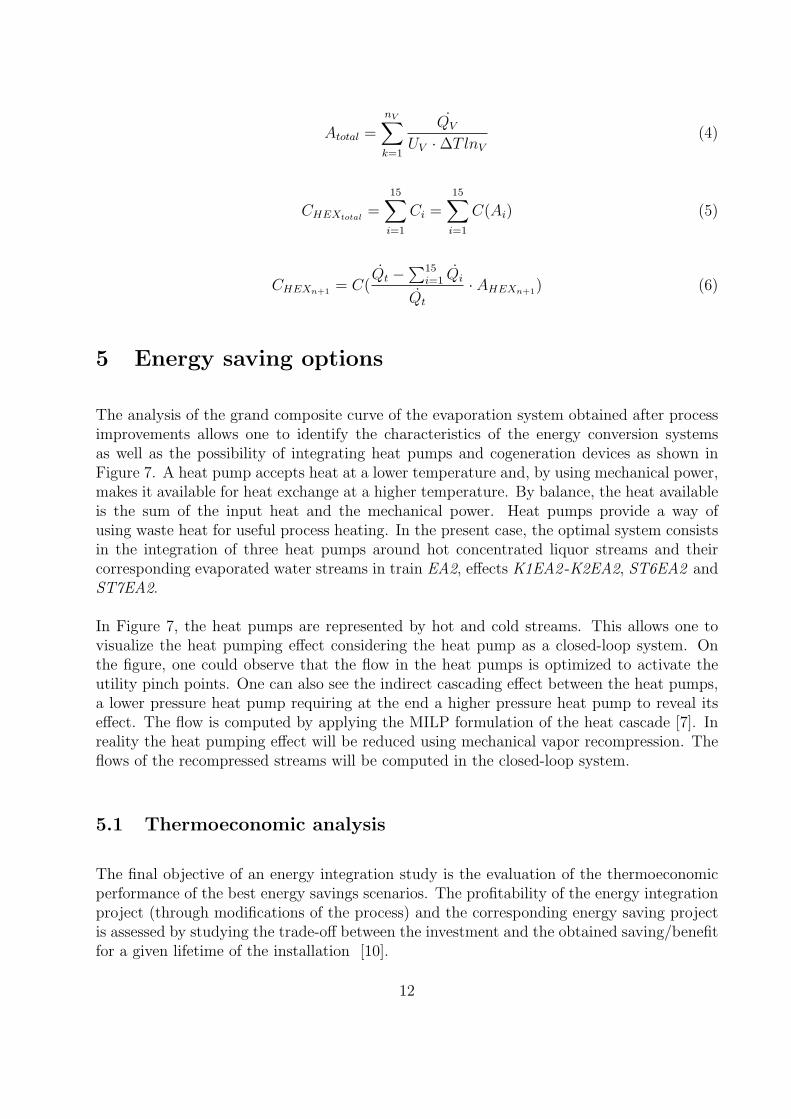
The analysis of the grand composite curve of the evaporation system obtained after processimprovements allows one to identify the characteristics of the energy conversion systemsas well as the possibility of integrating heat pumps and cogeneration devices as shown inFigure 7. A heat pump accepts heat at a lower temperature and, by using mechanical power,makes it available for heat exchange at a higher temperature. By balance, the heat availableis the sum of the input heat and the mechanical power. Heat pumps provide a way ofusing waste heat for useful process heating. In the present case, the optimal system consistsin the integration of three heat pumps around hot concentrated liquor streams and theircorresponding evaporated water streams in train EA2, effects K1EA2 -K2EA2, ST6EA2 andST7EA2.
In Figure 7, the heat pumps are represented by hot and cold streams. This allows one tovisualize the heat pumping effect considering the heat pump as a closed-loop system. Onthe figure, one could observe that the flow in the heat pumps is optimized to activate theutility pinch points. One can also see the indirect cascading effect between the heat pumps,a lower pressure heat pump requiring at the end a higher pressure heat pump to reveal itseffect. The flow is computed by applying the MILP formulation of the heat cascade [7]. Inreality the heat pumping effect will be reduced using mechanical vapor recompression. Theflows of the recompressed streams will be computed in the closed-loop system.
5.1 Thermoeconomic analysis
The final objective of an energy integration study is the evaluation of the thermoeconomicperformance of the best energy savings scenarios. The profitability of the energy integrationproject (through modifications of the process) and the corresponding energy saving projectis assessed by studying the trade-off between the investment and the obtained saving/benefitfor a given lifetime of the installation [10].
12

280
300
320
340
360
380
400
420
440
-6000 -4000 -2000 0 2000 4000 6000 8000 10000
T(K)
Q(kW)
T )
OthersHP
Mech. power
Figure 7: Possibilities of heat pump integration on the Grand composite curve of the evap-oration system
In order to compare and evaluate the relevance of the proposed solutions and to study thesensitivity of key parameters, the total cost comprising the investment and the operatingcosts is calculated with the equations 7, 8, 9.
Ctotal = Cinv + Cop (7)
Cinv = ICi (1 + i)l
(1 + i)l − 1= IC
i
1 − (1 + i)−l(8)
Cop = (mvCv + mfCf + ECe/1000) ∗ time (9)
For this study, the lifetime of the equipment is supposed equal to 15 years and the operatingtime is 8000 h/y. Saving percentage is evaluated compared to the reference case. The NetPresent Value and the Payback Time have been considered as decision parameters for theidentification of valuable scenarios.
Table 7 list for each scenario of Table 5 the operating (OC), investment (IC) and total (TC)costs and saving obtained for each scenario compared to the original one. The operatingcost reduction (∆OC) and the investment cost reduction (∆IC), respectively the differenceof operating cost and investment cost between each scenario and the reference case, arecomputed as well as the difference of the annualized investment cost (∆IC/y)
13

Table 7: Operating, investment and total cost and savings for the proposed scenariosSteam OC ∆OC IC ∆IC ∆IC/y TC Savings(kg/s) (ke/y) (ke/y) (ke) (ke) (ke/y) (ke/y) (ke/y) (%)
Scenario 0 6.497 2807 0 4427 0 0 2807 0 0Scenario 1 6.390 2761 -46 4530 103 112 2773 34 1.2Scenario 2 5.575 2408 -398 4896 469 55 2463 344 12.2Scenario 3 4.960 2143 -664 5019 592 69 2212 595 21.2
Table 8 shows Payback Time (∆OC/∆IC) of the options. The Net Present Value corre-sponds to the excess or shortfall of cash flows, in present value terms, once financing chargesare met.
Table 8: Net Present Value and Pay Back Time for scenarioNPV PBT(ke/y) (year)
Scenario 1 272 3Scenario 2 2724 2Scenario 3 4717 1
The heat pump integration is analysed for scenario 3. The operating cost is evaluated infunction of the electricity and natural gas costs. The investment cost comprise the purchaseof compressors and heat exchanger for each heat pump.
In Table 9, the operating (OC), investment (IC) and total (TC) costs and saving obtainedof scenario 3 and scenario 3 with integrated heat pumps compared to the original one areshown.
Table 9: Operating, investment and total cost and savings for the proposed scenariosOC ∆OC IC ∆IC ∆IC/y TC Savings
(ke/y) (ke/y) (ke) (ke) (ke/y) (ke/y) (ke/y) (%)Scenario 0 2807 0 4452 0 0 2807 0 0Scenario 3 2143 -664 5019 592 69 2212 595 12.2Scenario 3 + HP 1647 -1160 7007 2555 376 2023 784 27.2
At the chosen natural gas and electricity prices (0.280e/kg and 0.043e/kWh), the scenario3 with integrated heat pumps is advantageous and shows a Payback Time of 4 years.
14

5.2 Sensitivity analysis
Since the natural gas and electricity price could vary on the market, as well at the interestrate, a sensitivity analysis has been done on these parameters.
The relative price of fuel and electricity is quite important. A combined analysis of theelectricity price and the natural gas price can be useful to evaluate the profitability of theheat pump integration in the process. The break-even value of the electricity price that makethe heat pump profitable is given on Figure 8 for a natural gas price varying from 0.013 to0.021e/kWh.
0.012
0.014
0.016
0.018
0.020
0.022
0.03 0.05 0.07 0.09 0.11Electricity price (Euro/kWh)
Nat
ural
gas
pric
e (E
uro/
kWh)
Figure 8: Gas and electricity costs ratio for well integrated heat pumps
The interest rate together with the lifetime and the operating time has also an importantimpact on the profitability. The original analysis was done with an interest rate equal to8%. The interest rate has been calculated for each proposed scenario to obtain a net presentvalue equal to zero. Results are shown in Table 10. It corresponds to the interest rate thata bank should proposed to be competitive with the investment.
Table 10: Interest rate, NPV=0i
(%)Scenario 1 44.1Scenario 2 83.6Scenario 3 110.3
For the scenario 3 with well integrated heat pumps, the minimum interest rate that competes
15
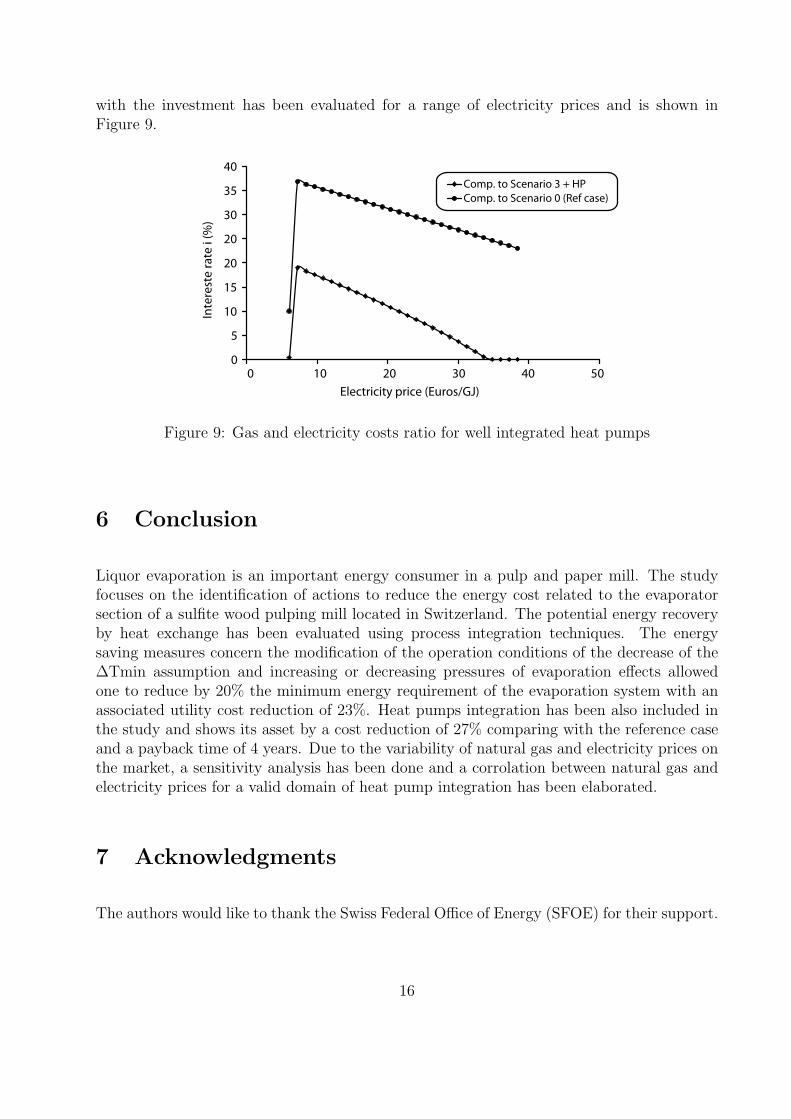
with the investment has been evaluated for a range of electricity prices and is shown inFigure 9.
0
5
10
15
20
20
30
35
40
0 10 20 30 40 50Electricity price (Euros/GJ)
Inte
rest
e ra
te i
(%)
Comp. to Scenario 3 + HPComp. to Scenario 0 (Ref case)
Figure 9: Gas and electricity costs ratio for well integrated heat pumps
6 Conclusion
Liquor evaporation is an important energy consumer in a pulp and paper mill. The studyfocuses on the identification of actions to reduce the energy cost related to the evaporatorsection of a sulfite wood pulping mill located in Switzerland. The potential energy recoveryby heat exchange has been evaluated using process integration techniques. The energysaving measures concern the modification of the operation conditions of the decrease of the∆Tmin assumption and increasing or decreasing pressures of evaporation effects allowedone to reduce by 20% the minimum energy requirement of the evaporation system with anassociated utility cost reduction of 23%. Heat pumps integration has been also included inthe study and shows its asset by a cost reduction of 27% comparing with the reference caseand a payback time of 4 years. Due to the variability of natural gas and electricity prices onthe market, a sensitivity analysis has been done and a corrolation between natural gas andelectricity prices for a valid domain of heat pump integration has been elaborated.
7 Acknowledgments
The authors would like to thank the Swiss Federal Office of Energy (SFOE) for their support.
16

References
[1] NLK Consultants Agra Simons. Energy cost reduction in the pulp and paper industry.Pulp and Paper Research Institute of Canada, pages 91–94, 1999.
[2] S. Ahmad, J. Linnhoff, and R. Smith. Cost optimum heat exchanger networks, 2 targetsand design for detailed capital cost models. Computers and Chemical Engineering,14(7):751–767, 1990.
[3] J. Jacob. Report for AICHE - Pulp and Paper Industry - Energy Bandwith Study.Institute of Paper Science and Technology, pages 59–66, 2006.
[4] Ian.C. Kemp. Pinch analysis and process integration: a user guide on process integrationfor the efficient use of energy. Second Edition, Elsevier, Butterworth-Heinemann, UK,2007.
[5] F. Marechal and B. Kalitventzeff. Targeting the minimum cost of energy requirements:A new graphical technique for evaluating the integration of utility systems. Computersand Chemical Engineering, 20(SUPPL.1), 1996.
[6] F. Marechal and B. Kalitventzeff. Energy integration of industrial sites: Tools, method-ology and application. Applied Thermal Engineering, 18(11):921–933, 1998.
[7] F. Marechal and B. Kalitventzeff. Targeting the integration of multi-period utilitysystems for site scale process integration. Applied Thermal Engineering, 23(14):1763–1784, 2003.
[8] F. Marechal and B. Kalitventzeff. Computer aided process and product engineeringCAPE, chapter on utilities integration (energy, water). Wiley - VCH, 2006.
[9] G.A. Smook. Handbook for pulp and paper technologists. Tappi Press, Second Edition,1992.
[10] R. Turton, R.C. Bailie, W.B. Whiting, and J.A. Shaeiwitz. Analysis, Synthesis, andDesign of Chemical Processes. Prentice Hall, New-York, 2002.
[11] F. Verstraeten. Rapport d’activite d’avril a septembre 1993 au Laboratoire d’Analyseet de Synthese des Systemes Chimiques de l’Universite de Liege. Technical report, 1993.
17