energy & environmental science - usda forest service · energy & environmental science cite...
TRANSCRIPT

Energy amp Environmental Science Cite this Energy Environ Sci 2011 4 973
wwwrscorgees PAPER
Multi-scale visualization and characterization of lignocellulosic plant cell wall deconstruction during thermochemical pretreatmentdaggerDagger ShishirPS Chundawatab Bryon S Donohoec Leonardo da Costa Sousaa Thomas Elderd
Umesh P Agarwale Fachuang LubfJohn Ralphbf Michael E Himmelc Venkatesh Balanab and Bruce E Daleab
Received 18th October 2010 Accepted 30th November 2010 DOI 101039c0ee00574f
Deconstruction of lignocellulosicplant cell walls to fermentable sugars by thermochemical andor biological means is impeded by several poorly understood ultrastructural and chemical barriers A promising thermochemical pretreatment called ammonia fiber expansion (AFEX) overcomesthe native recalcitrance of cell walls through subtle morphological and physicochemical changes that enhance cellulase accessibilitywithout extracting lignin and hemicellulosesinto separate liquid streams Multi-scale visualization and characterization of Zea mays (i e corn stover) cell walls were carried out by laser scanning confocal fluorescence microscopy (LSCM) Raman spectroscopy atomic force microscopy (AFM) electron microscopy (SEM TEM) nuclear magnetic resonance (NMR) and electron spectroscopy for chemical analysis (ESCA) to elucidate the mechanism of AFEX pretreatment AFEX first dissolves then extracts and as the ammonia evaporates redeposits cell wall decomposition products (eg amides arabinoxylan oligomers lignin-based phenolics) on outer cell wall surfaces As a result nanoporous tunnel-like networks as visualized by 3D-electron tomography are formed within the cell walls We propose that this highly porous structure greatly enhances enzyme accessibility to embedded cellulosic microfibrils The shape size (10 to 1000 nm) and spatial distribution ofthe pores depended on their location within the cell wall and the pretreatment conditions used Exposed pore surface area per unit AFEX pretreated cell wall volume estimated via TEM-tomogram image analysis ranged between 0005 and 005 nm2 per nm3 AFEX results in ultrastructural and physicochemical modifications within the cell wall that enhance enzymatic hydrolysis yield by 4-5 fold over that of untreated cell walls
Background The world is currently transitioning from a fossil fuel driven energy system to one that is supplied by a portfolio of more renewable and sustainable options1-3 The annual solar energy captured by non-food plant biomass (ldquolignocellulosic biomassrdquo) such as grasses woody materials and agricultural residues (eg corn stover) is nearly ten times that of the total energy used by humans4 Thus lignocellulosic biomass will undoubtedly play an important and increasing role in our future energy portfolio as recognized by the recent surge in government-supported bioenergy-related research worldwide5
Inexpensive feedstocks and efficient conversion technologies are two key requirements to the successful commercialization of cellulosic biorefineries Thermochemical pretreatment and enzymatic saccharification technologies are currently expensive and inefficientdue to the recalcitranceof plant cell walls towards chemicals and enzymes6-8 Plant cell wall recalcitrance is a multi-scale phenomenon spanning several orders of magnitude encompassing both macroscopic and microscopic barriers (Fig 1)8 Both macroscopic-scale factors such as tissue compo-sitional heterogeneity and mass transfer limitations and micro-scopic-scale factors such as lignin-carbohydrate cross-linking
aBiomass Conversion Research Labomtory (BCRL) Chemical eUSDA-Forest Service Forest Products Laboratory Madison WIEngineering and Materials Science Michigan State University 3900 53726 USA E-mail uagarwalfsfedusCollins Road Suite 1045 Laming MI 48910 USA E-mail fDepartment of Biochemistry University of Wisconsin-MadisonWIchundawamsuedu sousaleomsuedu balanmsuedu bdaleegr 53726 USA E-mailfachuangluwiscedujralphwiscedumsuedu dagger Author contributions SPSC VB and BED designed research SPSCbDOE Great Lakes Bioenergy Research Center (GLBRC) BSD LDCS TE UA FL performed research SPSC BSD LDCS cBiosciences Center National Renewable Energy Laboratory (NREL) TE UA FL JR MEH VB BED analyzed data and SPSC wrote the Golden CO 80401 USA E-mail bryondonohoenrelgov paper All authors reviewed and edited the papermikehimmelnrelgov Dagger Electronicsupplementaryinformation(ESI)available Supplementary dUSDA-Forest Service Southern Research Station Pineville LA 71360 figures tables and tomogram movies with respective legends See DOI USAE-mail telderfsfedus 101039c0ee00574f
This journal is copy The Royal Society of Chemistry 2011 EnergyEnviron Sci20114 973-984 | 973
Fig1 Plant cell wall recalcitrance to enzymatic hydrolysis is a multi-length scale problem spanning several orders of magnitude Asterisked () images courtesy of DOENREL
and cellulose crystallinity contribute synergistically to the recalcitrance of lignocellulosic biomass
Lignocellulosic plant cell walls are composed of crystalline cellulose nanofibrils embedded in an amorphous matrix of cross-linked lignin and hemicelluloses that impedes enzyme and microbial accessibility6 The primary goal of most chemical pretreatments is to overcome this lignin-hemicellulose barrier impeding enzymatic action and in some cases to reduce cellu-lose crystallinity Thermochemical pretreatments such as ammonia fiber expansion (AFEX) and dilute acid treatment are two of the most promising methods to overcome the recalci-trance of native cell walls to enzymatic deconstruction9-12 Most pretreatments depolymerize andor partly solublize hemi-celluloselignin extracting them into separate liquid streams while leaving behind a solid cellulose-rich substratethat is more amenable to enzymatic hydro1ysis12 However the AFEX process appears to be somewhat unique in that it greatly enhances cell wall digestibility without removing any of the lignin or hemicelluloses into separate liquid streams1113 AFEX also produces a substrate that is readily fermentable and does not require detoxification or external supplementation prior to fermentation14
Though significant strides have been made recently in eluci-dating the chemical modifications within the cell wall following AFEX1115 the ultrastructural effects and overall mechanism of AFEX pretreatment remain unknown Examining the nanoscale architecture of pretreated cell walls in tandem with chemical biochemicaland genetic characterization should provide insight into fundamental mechanisms that contribute to the native recalcitrance of cell walls16 This is especially true for the more recalcitrant lignified secondary cell walls which are poorly characterized compared to primary cell wall61718 There is currently no systematic multimodal and integrated approach to developing models that explain the biochemical and ultrastruc-tural organizationof plant cell walls Nor do we understand how this architecture is modified by thermochemical pretreatments from a holistic sense Here we examine AFEX pretreated cell walls using several multi-scale (ie micro- to nanometre scale) imaging and characterization techniques to develop multi-dimensional architectural models of ultrastructural modifica-tions that result from pretreatment Thesemodels provide insight into the fundamental mechanisms that influence the rate of biomass hydrolysis by enzymes This work has immediate rele-vance to the biofuels arena especially with the ongoing
974 | Emergu Environ Sci 2011 4 973-984 This journal is copy The Royal Society of Chemistry 2011
establishment of cellulosic biorefineries employing ammonia-based pretreatments19
Results Liquid-solid loading influences extent of pretreated cell wall disruption
Unlike AFEX most pretreatments extract lignin (20 to 85 of thetheoreticalmaximum) andorhemicelluloses (30to80)into separate liquid streams by applying 10 to 50 fold higher water loadings (ie 3 to 20 g water per g dry biomass) There is a perceived need to extract these components in order to achieve an easily digestible substrate131520-25 The impact of liquid-solid loading on corn stover cell wall morphology during AFEX was explored for two conditions with15minresidence time at 130degC (A) L-AFEX (Low liquid loading) using 1 1 ammonia to biomass loading (ww) 06 1 water to biomass loading (ww) and (B) H-AFEX (High liquid loading) at 2 1 ammonia to biomass loading (ww) 2 1 water to biomass loading (ww) Sincevascular bundle cells are known to be especiallyrecalcitrant and contribute nearly 70 to 80 of the stem internode mass26
their cell walls were characterized in detail Cell wall perimeter (L) wall-enclosed lumen area (A ) and isoperimetric quotients
were determined to define the circularity (note Q = 1 for a circle) of cell walls to estimate the severity of degradation as a function of cell type and pretreatment condition tested Scanning electron micrographs (SEM) of L-AFEX pretreated material revealed no perceptible modification of internode cell walls including epdermal cells vascular bundles parenchyma cells or lignified sclerenchyma cells (Fig 2 and S1-IDagger) However H-AFEX treatment resulted in complete disrup-tion of parenchyma cells collapse and aggregation of vascular bundles (lsquoArsquo lsquoLrsquo and lsquoQrsquo dropped by 74 48 and 6 respec-tively Fig Sl-IIDagger) and deposition of cell wall extractives on the outer cell walls andinnerlumen spaces The H-AFEXextractives deposited outside the cell walls were strongly stained by Safranin 0 dye as indicated by confocal fluorescence imaging analysis (Fig S1-IIIDagger) suggesting that these deposits are enriched in
lignin-derived phenolics Glucan conversion after 24 h hydrolysis (15 FPU cellulase per g glucan loading) was marginallylower for H-AFEX (59 plusmn 9) compared to L-AFEX (68 plusmn 8)
Nano-sized extractives deposited on outer cell wallsurfaces after AFEX
Atomic force microscopy (AFM amplitude and phase) images were captured for secondary wall thickened vascular bundle cell surfaces (Fig 2 and S2Dagger) Representative SEM and AFM images were taken from a collection ofover 50 images each for untreated and L-AFEX treated corn stover cell walls at various magnifi-cations Afibrousnetwork ofcellulosicmacrofibrilswas typically seen for untreated walls along with occasional cytoplasmic remnants crevices and cracks that formed part ofthe natural cell wall surface landscapeThe cellulose macrofibril width for never-dried untreated walls was 42 plusmn 34 nm (n = 10) which dropped to 23 plusmn 31 nm (n = 10) upon air-drying Drying and extensive sample preparations (ie extraction of residual hemi-celluloses by alkali and other solvents) are known to modify the morphology of microfibrils27-29 The AFM tip adheres more strongly to hydrophilic areas that hence appear lighter in color (ie greater change in phase) L-AFEX pretreated cell wall surfaces were found to be non-uniformly covered by irregularly shaped hydrophilic deposits (20-1000nm in width) unlike the hydrophobic lignin droplets seen on fiber surfaces after acidic pretreatments3031 Surface roughness factor (RMS or root mean square nm) was 2-fold greater for AFEX treated wall surfaces compared to untreated controls (Fig S2-IIIDagger) Untreated corn stover surfaces were predominantly hydrophobic (indicated by darker phase images) This was not the case for AFEX treated cell walls where a distinct phase contrast was visible AFEX treated outer cell wall phase images had several lighter patches that corresponded to regions abundant in hydrophilic species
Changes in pretreated cell wall architecture reveal the mechanism of AFEX
Inner cell wall ultrastructure was probed for untreated and AFEX treated corn stover by transmission electron microscopy
Fig 2 SEM and AFM amplitude images for untreated (A and B) and L-AFEX (C and D) treated corn stover ESCA-based surface atomic composition (E) of untreated and L-AFEX treated corn stover Color legend (dark-light shades) for AFM images depicts the amplitude current scale (0-25 volts) nd stands for lsquonot detectedrsquo
This journal is copy The Royal Society of Chemistry 201 1 Energy Environ Sci 20114 973-984|975
(TEM) (Fig 3 and S3-IDagger Movies S4-S8Dagger) The compound middle lamella (CML) and secondary cell walls (Sl-S3) are clearly visible in the untreated control Regions of the cell wall that stained [with KMnO4 and UO2 (CH3C00)2] blackdark grey are enriched in lignin932 whereas lighter grey regions are enriched in hemicelluloses and cellulose33 To study the effects of pretreatmenton cell wall structure the following AFEX reaction conditions were tested (A) LA-AFEX (Low Ammonia loading) at 05 1 ammonia to biomass loading (ww) 06 1 water to biomass loading (ww) 15 minute residence time at 130 degC (B) L-AFEX (as before) (C) HAT-AFEX (High Ammonia loading and long residence Time) at 3 1 ammonia to biomass loading (ww) 06 1 water to biomass loading (ww) 45 min residence time at 130 degC (D) Lt-AFEX (Low temperature) at 1 1 ammonia to biomass loading (ww) 06 1 water to biomass loading (ww) 15 min residence time at 70 degC and (E) LW-AFEX (Low Water loading) at 1 1 ammonia to biomass loading (ww) 005 1 water to biomass loading (ww) 15 min residence time at 130 degC Approximately 3-5different samples of each AFEX condition were sectioned and imaged by TEM A total of 397 standard TEM images of ultrathin sections and 32 tomographic reconstructions from semi-thick sections (equiva-lent of 4580 standard images) were collected and visually inspected The best representative examples for each AFEX condition were analyzed and quantified (with a minimum of 10 images analyzed to obtain quantitative data for each ultra-structural difference) some of which are presented here
Large pores (10 to 500 nm in width) were formed within the CML after LA-AFEX due to the rapid decompression and volatilization of hot ammonia (ie no holes seen within Lt-AFEX CML) However upon further increasing ammonia loading or reaction temperature (closer to the glass transition temperature of lignin -150 degC) the CML collapsed with its contents extruded into cell corners pits and outer wall surfaces
along with significant delaminationkinking of secondary cell walls Randomly distributed irregularly shaped extractive particles (20 to 200 nm in thickness) were found on the outer cell walls of L-AFEX validating the previous AFM findings Immunolabeling revealed that these surface extractives were enriched in arabinoxylans (Fig S3-IIDagger) Large ellipsoidal pores (semi-major and semi-minor axes lengths of 162 plusmn 47 nm and 73 amp 21 nm respectively) were formed within the lumen-facing secondary walls for HAT-AFEX (Fig S3-I-E and FDagger) The eccentricity (088 plusmn 005) of the pores suggests that the lamellar orientation of the cellulosic microfibrils in the secondary cell walls forces anisotropic decompression of ammonia34 Also liquid to gaseous phase decompression of ammonia results in deposition of extractables (derived from hemicelluloses and lignin) on the outer periphery of the pores for HAT-AFEX We conclude that the explosive expansion of ammonia from the cell wall into the lumen space causes the cellulose microfibrils (41 plusmn 05 nm in diameter Movie S6Dagger) to be ldquoblownrdquo outwards from the secondary cell walls Theelementary microfibrils are seen coated with a thin layer of lignin andor hemicellulose rich residue (indicated by darker peripheral staining) supporting previous hypotheses regarding the organization of cellulose-hemicellulose within cell walls27 In the absence of water the secondary wall is severely disrupted by anhydrous ammonia (Fig S3-I-J and Movie S7amp causing it to detach and resulting in the formation of dark stained globular structures (128 plusmn 22 nm in diameter) Coalescence of inter-lamellar lignin packed between adjacent cellulosic fibrils (fibrils are typically separated by 15 to70 nm34) formsthese globular structureswhich are surroundedby a matrix ofhemicelluloses and cellulose Similarly sized lignified globular structures with a core-corona (lignin hydrophobic core and polysaccharide hydrophilic corona) suprastructure organization have been reported for wood derived lignin-carbohydrate complexes3536 as well as for dilute-acid pretreated switchgrass37
Fig 3 TEM images depecting ultrastructure of cell walls before (A) and after AFEX for various pertreatment severities namely LA-AFEX (B) L-AFEX (C) HAT-AFEX (D) Lt-AFEX (E) and LW-AFEX (F) Cell corners (CC) cell lumen (CL) Compond middle lamella (CML) and secondary wall layers (S) are labeled
976 | Energy Environ Sci 2011 4 973-984 This journal is copy The Royal Society of Chemistry 2011
Nakashima and co-workers have shown deposition of 100-160 nm diameter lignin enriched spherical globules between cellulose microfibrils during lignification of secondary wall thickened tracheary elements in Zinnia elegans17 which draws close comparisons to the globular structures released from the S3 secondary cell walls during LW-AFEX
3D-Tomograms (Movies S4-S8Dagger) were assembled from tilt-series TEM images and analyzed using the image segmentation and isosurface tools within the IMOD software package3839
Porous spaces (ie unstained regions) within pretreated cell walls were modeled by enclosing them with iso-surface mesh contours (Fig 4) in order to compute accessible iso-surface area (mn2) per unit volume (m3) of the cell wall (Table S9Dagger) Nearly 50-90 of the total porosity for LA-AFEX was within the CML and S1 secondary walls However with increased ammonia loading the outer secondary walls contribute significantly to the porosity with less than 15 contribution from the CML region There were no discernible pores seen within untreated cell walls Pores within untreated cell walls were not amenable to be measured using IMOD volume segmentation techniques as these pores are at the resolution limit to be distinguished from back-ground noise The advantage of TEM tomography is discerning the 3D nanoscale structural data within intact biological samples however one limitation is the 3D spatial resolution of ~5 nm and a reconstruction limitation known as the missing wedge that results in lower resolution in the Z axis than in X-Y (Z axis resolution is 5-6 nm while X-Y resolution is 1-2nm)3840
This therefore limits discerning of pores within untreated cell walls via conventional tomography that are known to be typi-cally much smaller than 5 nm 41 However the advantage of this technique is to discern the relative distribution of pores within pretreated cell walls as a function of pretreatment severity The total porosity for L-AFEX based on its tomogram analysis by IMOD was approximately 23 m2 g-1 cell wall which is within the range (20-100 m2 g-1) reported for pretreated cell walls4243
BET (Brunauer-Emmett-Teller) nitrogen physisorption analysis underestimated the surface area by 10 to 15 fold in L-AFEX confirming previous reports that BET is an inadequate techniquefor such material43It is likely that pores within plant cell walls collapse during sample preparation or BET analysis thatreducesoverallnitrogen accessible porosity There have been reports in the inconsistency of the nitrogen adsorption regime in micropores in the presence of mesopores that make it theoretically difficult to accurately characterize pore structures44
This is especially a problem if the mouth of the pore is much smaller than the bulk ofthe pore volume (ie an inkbottle shape with a small mouth opening) This could result in nitrogen condensation at the pore mouth without much penetration into the pore which would result in an underestimation of the total porosity TEM tomography has shown that this type of narrow mouth ink bottle pore architecture is quite common within pretreated cell walls (Fig 4) and could explain the discrepancy seen in the results from BET analysis compared to TEM based porosity However TEM based pore analysis is limited by the staining ability of the chemicals used to visually differentiate pores from the cell wall background which could create some bias in the results as well
Relocalized surface deposited lsquoextractivesrsquo are rich in lignin hemicelluloses and cell wall decomposition products
Elemental chemical composition for outer wall surfaces was obtained by electron spectroscopy for chemical analysis (ESCA) (Fig 2) There was a significant reduction in the surface oxygen (0) to carbon (C) content after AFEX (30 drop in OC atomic ratio) along with a corresponding increase in C1C2 carbon ratio (Fig SIO-IDagger) This suggests that AFEX treated cell wall surfaces were enriched in reduced-oxygen components (eg lignin) along with a concomitant decrease in oxygen-rich compounds (eg cellulose) Calcium and nitrogen content of wall surfaces
Fig 4 Modeling pornus regions within HAT-AFEX (A i-iii) and LW-AFEX (B iv-vi) pretreated cell walls using 3D-TEM tomogram Isosurface mesh enclosing pore spaces Within a HAT-AFEX cell wall (i) sub volume of S3 layer (ii) and S2 delamination zone (i) Isosurface mesh enclosing pore spaces within a LW-AFEX cell wall(iv) sub-volume of the S2 layer (v) and S1 layer (vi)
This journal is copy The Royal Society of Chemistry 2011 EnergyEnviron Sci 20114 973-984| 977
increased significantly after AFEX Calcium is bound to pectic polysaccharides found in the middle lamella and primary cell walls45 The compound middle lamella is known to have high solubility in alkaline solutions46 and can be delignified with comparative ease47 This explains the increased abundance of calcium on outer wall surfaces after L-AFEX There was no significant difference in the elemental composition upon varying the angle of emission between 15deg and 75deg suggesting that the average thickness of the extractives surface layer was greater than 10 nm Extracting the cell walls with water reduced the drop in OC ratio to 10 (compared to untreated stover) indicating that a significant portion of the surface deposits are hydrophilic in nature (Fig S10-IDagger) The water extract was abundant in phenolics further suggesting that these compounds are partly responsible for the reduction in the OC ratio The water soluble extractives from AFEX treated cell walls are also abundant in low and high molecular weight hemicellulose oligomers lignin aromatics and decomposition products formed during pretreat-ment (eg acetamide phenolic amides carboxylic acids)11
After L-AFEX pretreatment approximately 50 of the lignin in corn stover is rendered soluble in a 9 1 acetone water solution a solvent suitable for lignin solubilization After lyophilizing and water washing (to remove soluble sugars and other components) the residue was found to be composed mostly of lignin which represented over half of the lignin found in the original material Preliminary characterization by NMR showed this to be a somewhat syringyl-enriched syringyl-guaiacyllignin in which the lignin polymer had not been significantly degraded (Fig S10-IIDagger) The extract also contained p-coumaroyl and feruloyl amides formed during ammonolytic cleavage of p-coumarate and ferulate esters in the cell wall NMR revealed that most of the p-coumarate esters were cleaved during AFEX and only ~10 to 15 of the p-coumarate remained as intact esters in the extractable lignin The postulated removal of lignin during AFEX is further supported by the FT-Raman analysis of untreated and L-AFEX treated stover (Fig S11Dagger) The residual lignin peaks (at 1600 and 1635 cm-1) are about 3 times higher in the control sample indicating that AFEX treatment caused ultrastruc-tural modifications that led to more lignin removal during the acid chlorite sample treatment step (see methods section for details on sample preparation prior to Raman spectroscopy) Additionally Raman analysis based on the 1170 cm-1 cinnamoyl ester band indicated that the residual lignin had significantly lower (71 lower) ferulate and p-coumarate groups
Enzymatic accessibility to crystalline cellulose increases after AFEX
Enzymatic hydrolysis (for 24 h) was carried out on untreated and L-AFEX corn stover using various combinations of purified and crude Trichoderma reesei cellulases (Fig 5) Cellobiose was the major hydrolysis product for L-AFEX upon addition of exo-cellulases (Cel7A or CBH I and Cel6A or CBH II) as compared to untreated corn stover which resulted in glucose as the major product Treatment with the endocellulase (Cel7B or EG I) resulted in glucose as a major product for untreated cell walls Control experiments with isolated microcrystalline cellulose (Avicel) revealed that the ratio of cellobiose to glucose released by Cel7A and Cel7B was 115 plusmn 48 and 34 plusmn 06 respectively These results indicate that AFEX enhances the accessibility of
Fig 5 Glucan hydrolysis yield (24 h) of untreated (UTCS left bar in grey) and L-AFEX treated corn stover (right bar in orange) by purified Trichoderma reesei cellulases Empty and filled bars depict glucose and cellobiose yields respectively Inset depicts glucan and xylan hydrolysis yields (15 FPU Spezyme CP per g glucan loading) for corn stover treated with various AFEX severities
crystalline cellulose microfibrils to exo-cellulases Enzymatic digestibility (for 24 h) using a crude cellulases broth (Spezyme CPNovo 188) to saccharify corn stover pretreated under five different AFEX severities (eg L-AFEX) revealed that glucan and xylan conversions were closely correlated (Fig 5) Increasing cellulose accessibility during AFEX as evidenced by TEM analysis enhances both glucan and xylan digestibility
Discussion Several literature reports have suggested that the physical removal of lignin and hemicelluloses from plant cell walls into separate liquid phases is necessary to enhance cellulose accessi-bility to hydrolytic enzymes Recent findings including this current work indicate to the contrary that subtle changes in the inner cell wall localization of the lignin and hemicellulose components during mild pretreatments (like AFEX) can also enhance cellulose accessibility931 Also not removing cell wall extractables and other nutrients (eg sugars minerals proteins amides) can significantly improve hydrolyzate fermentability obviating the need for exogenous nutrient supplementa-tion111448 Lignin and hemicellulose extraction from within cell walls to outer cell wall surfaces during AFEX (at low liquid-solid loadings) is expected to be diffusion-limited49 Surprisingly there was no improvement of the overall cellulose hydrolysis yield for corn stover that was AFEX pretreated at higher water loadings possibly due to inhibition of enzymes by the greater density of surface exposed lignin for H-AFEX versus L-AFEX50 Similar hydrolysis results have been reported for ammonia recycle percolation (ARP) an aqueous ammonia pretreatment tech-nique using much higher water loadings than AFEX20 Increased ammonia and water usage during pretreatment would necessitate significant capital investment in solvent recovery1951-53 Thus it is crucial to gain a fundamental understanding of the ultrastruc-tural and physicochemical changes occurring within the cell wall during low liquid-to-solid loading ammonia-based pretreatments and to better understand how these changes enhance enzymatic digestibility and microbial fermentability
Until recently physicochemical and ultrastructural effects of ammonia-based pretreatments on plant cell walls were poorly understood compared to their acidic counterparts11 OrsquoConnor
978 | Energy Environ Sci 2011 4 973-984 This journal is copy The Royal Society of Chemistry 2011
showed that ammonia-based pulping of aspen wood results in kinking and curling of treated cell walls with fiber separation noted along the middle lamella and outer secondary cell walls Weimer and colleagues also noticed surface deposition of a nebulously shaped layer after supercritical ammonia treatment of hardwoods55 These findings are consistent with the current model for the mechanism of AFEX (Fig 6) Ammonia pene-trates the cell walls from the outer walls facing the lumen and middle lamella Here in the presence of water a series of ammonolytic and hydrolytic reactions cleave various ester link-ages (hemicellulose acetates p-coumarates ferulates and difer-ulates acylating hemicelluloses and lignin p-coumarates) resulting in the formation of corresponding amides and acids11
Cleavage of lignin-hemicellulose ester linkages including the important cross-links mediated by ferulates facilitates the solu-bilization and removal of hemicellulose oligomers and other extractables to outer cell wall surfaces cell corners and pits exposing the embedded cellulose microfibrils These extractives are rich in arabinoxylanoligomersamides minerals and cell wall degradation products released formed during AFEX11 At the end of pretreatment the rapid pressure release results in convective transport of ammonia-water and cell wall extract-ables towards the cell lumen and cell corners (through the middle lamella) The expansive decompression of ammonia at the wall periphery results in the formation of large pores in the middle lamella and outer secondary cell walls The sizes of the pores seen within the treated cellwallsare typically larger than 10 nm which would greatly facilitate the accessibility of cellulases (note Cel7A from Trichoderma reesei has a radius of gyration ~5 nm and a maximum length -12 nm) This fact does much to explain the increased activity of cellulases on crystalline cellulose within pretreated cell walls (Fig 5) The TEM tomograms highlight not only the increased porosity but also the extensive interconnec-tedness of the pore network created by AFEX pretreatment Indeed not all pore networks are directly connected to cell wall surfaces but this is not necessarily needed inorder to enhance enzyme accessibility Previous work has shown that enzymes readily access cell wall surfaces cell comers middle lamella cell pits and delamination surfaces created during dilute-acid pretreatment56 Also the interconnectedness indicates that once a pore surface is reached the enzymes should immediately gain access to an extensive new surface However studying the change in cell wall pore morphology in situ during the course of enzy-matic hydrolysis is a challenge that would further elucidate the role of wall porosity on enzyme diffusion (eg influence of pore tortuosity) non-specific protein binding (eg to lignin lining the outer periphery of pores) and overall hydrolysis kinetics Fungi and microbes typically attack plant cell walls from their cell lumena or middle lamella regions due to easier physical accessi-bility or possibly abundance of nutrients (eg sugars proteins) Hydrolytic enzymes and pretreatment chemicals probably gain access to cell walls from these regions first as we notice that the extent of cell wall deconstructionduring AFEX is relatively more severe for CML and S3 regions Similar effects have been noted for cellulase accessibility to acid treated corn stover cell walls956
Interestingly kraft pulping of spruce wood fibers has also been shown to cause increased pore and matrix lamella width in fiber walls closest to the middle lamella that graduallydecrease in size towards the cell lumen57 The relative contribution of mass
transfer (eg S3 versus S2 sub-layer accessibility to chemicals and extraction ofligninhemicellulose from these layers) and cell wall composition (eg LCC linkage frequency in S3 versus CML andor lignin composition influencing lignin-hemicellulose removal) influencing the physicochemical impacts of thermo-chemical pretreatments is currently unclear and should be explored in the future to fundamentally understand the rate-limiting steps to lignocellulose deconstruction8
It is clear that the amount of extractablesremoved is related to the amount of ammonia-waterused during pretreatment In the absence of water the outer secondary cell walls collapse completely due to coalescence of lignin resulting in significant kinking of the cell walls Interestingly extensive degradation of the outer walls did not increase the glucan digestibilitycompared to L-AFEX This observation reinforces the point that extensive decomposition of the cell wall during AFEX pretreatment (and possibly other thermochemical pretreatments) does not always result in improved digestibility On the contrary the lignin glob-ules coalescing during LW-AFEX similarly to lignin globules reported from acid treated corn stover30 and synthetic dehydro-genation lignin polymer based nano-aggregates35 are likely responsible for inhibiting hydrolytic enzymes Increasing the cell wall porosity without extensively extracting lignin and hemi-celluloses should prevent collapse and aggregation of cellulose microfibrils that ultimately reduces pretreatment effectiveness937
Lignins cannot be solvent-extracted from corn stover to any significant extent except when it is finely milled (ie ball-milled) However after AFEX a significant portion (~50 ww) of the lignin can be readily extracted by acetone water mixtures Preliminary NMR examination shows the core lignin polymer to be intact after AFEX and similar in chemical structure to native lignin p-Coumarate esters were ammonolyzed during AFEX and ferulate-polysaccharide esters in the cell wall were also cleaved Thus as shown in (Fig S10-IIDagger) only about 10 of the p-coumarate esters remain after AFEX with most being con-verted to p-coumaroyl amides Although ferulate esters are not seen in the lignin isolated from corn stover (because they are associated with polysaccharides and do not extract into this fraction) their presence is readily noted in the solvent-soluble fraction after AFEX11 Clearly significant cleavage of esters producing amides is a major cell-walldisrupting reaction occurring during AFEX pretreatment of grasses Cleavage of diferulate linkages (which cross-link polysaccharides) and lignin-ferulate and lignin-diferulate linkages (which cross-link polysaccharides to lignin) and other ester linkages during AFEX is expected to facilitate removal of lignins and increase enzyme accessibility to the polysaccharides Genetically engi-neering ester linkages into the backbone of the lignin poly-mer5859 augmenting the ether- and carbon-carbon-linked structures should further facilitate the efficiency of delocalizing lignin and hemicelluloses during AFEX
There was no significanttransformation of the native cellulose crystal structure to other crystalline states (eg cellulose IIII) during conventional L-AFEX (Fig S11Dagger) as evidenced by no significant change in the ratio of 350 and 380 cm-1 Raman band intensities This is expected since water likely prevents the tran-sition of cellulose I to IIII by competing with ammoniarsquos ability to intercalate and disrupt the elementary microfibril hydrogen-bonded network60 Pretreatment of isolated cellulose under
This journal is copy The Royal Society of Chemistry 2011 EnergyEnviron Sci 20114 973-984 | 979
Fig 6 Schematic models for lignocellulosic cell walls depicting overall microscale (a) and nanoscale (b) ultrastructural modifications as a result of ammonia based pretreatments Pretreatment results in cleavage of lignin-carbohydrate complex linkages between non-core lignin phenolics and hemi-cellulose side-chains that allows removalredeposition of cell wall decomposition products unto outer wall surfaces and hence results in increased wall porosity (white spaces) Differerrnt components of the cell wall depicted are cellulose (green lines) hemocellulose (blue strings) lignin (yellow matrix) cell corners (CC) cell lumen (CL) outher wall surfaces (OW) compound middle lamella (CML) secondary wall layers (S1 S2 S3) Scale bar is 250 nm
L-AFEX conditions resulted in no significant change in its crystallinityorenzymaticdigestibility61 Howeverinhteabsence of water during AFEX there was some partial conversion to cellulose IIII (Fig S11Dagger) These results suggest that conventional L-AFEX improves the digestibility of plant cell walls by enhancing crystalline cellulose accessibility to cellulases hy removalofligninandhemicellulosesfromtheircloseassociation with the cellulose without any significant alteration of the cellulose crystal structure Future work will focus on altering the crystalline state of cellulose (ie to produce cellulose IIII during AFEX) in addition to the physicochemical changes curently seen during conventional AFEX to exploit the improved digestibility reported for cellulose IIII6162
Conclusion
Plantshaveevolvedcomplexbiochemicalstrategiesbuttressedby a rigid recalcitrant cell wall to the counter attack by fungi and microbes Despite the extensive biochemical and genetic studies that have been carried out to unveil the structure and function of cell walls there have been very few multi-scale imaging and
modeling studies to complement that effort In this paper we report the first multi-modal approach to image and charaterize monocot (ie Zea mays) cell walls before and after thermo-chemical pretreatment (ie AFEX) Most thermochemical pretreatments strip out lignin and hemicellulose along with nutrients (which might prove valuable for downstream fermen-tation) using high liquid to solid solvent loadings during pretreatment to improve enzymatic digestibility On the contrary conventional AFEX pretreatment employing much lower solvent loadings improves polysaccharide digestibility via cleaving lignin-carbohydrate ester linkages partially solubilizing cell wall extractables and relocating these extractables to cell wall surfaces thereby creating porous interconnected tunnel-like networks that are much more accessible to enzymes AFEX pretreatment was found to significantly modify the middle lamella and outer secondary cell walls regions suggesting that mass transfer considerations for cell wall extractables removal are a major barrier to its effective deconstruction during pretreatment However there still remains much to be learned about these phenomena These studies reinforce the fact that extensive decomposition of cell walls during pretreatment is not
980 | Energy Environ Sci 2011 4 973-984 This journal is copy The Royal Society of Chemistry 2011
a necessary criterion to improve biomass conversion to fermentable sugars Future advances in the cell wall genetic engineering to overcome the native recalcitrance to deconstruc-tion suited for low thermochemical severity pretreatments such as AFEX are expected to further reduce the cost of plant-derived fuels and chemicals
Materials and methods Biomass source
Fresh whole corn plants were harvested from MSU farms and used for certain microscopy experiments (eg AFM SEM and LSCM) MSU corn stems were hand sectioned using a razor blade into thin slices (slice thickness ranging from 100 microm to 1 mm) and air-dried (to the desired moisture level) in a clean hood prior to AFEX treatment Pre-milled corn stover (Pioneer hybrid seed variety 33A14 harvested in 2002 from the Kramer farm in WrayColorado for CAFI projects) passed through a 10 mm screen was provided by the National Renewable Energy Labo-ratory (NREL) NREL corn stover was used for TEM ESCA and enzymatic hydrolysis experiments The pretreated biomass was stored in the fridge at 4 degC prior to being characterized
AFEX pretreatment
AFEX pretreatment on MSU corn stem cross-sections was carried out in a 22 mL bench-top reactor (316 SS PARR Instrument Co IL) The vessel was loaded with the feedstock at the appropriate moisture content (0 60 or 200 dwb) The reactor was clamped shut and the required amount of ammonia (1 1 or 3 1 ammonia to biomass loading ww) was injected using a pre-weighed ammonia delivery vesse1 The reactor was heated using a custom made aluminium block on a hot plate and maintained at the desired temperature (within plusmn 10 degC) for the necessary residence time At the end of the residence time the pressure was explosively released The biomass was removed from the reactor and left in the hood overnight to remove the residual ammonia AFEX pretreatment on NREL corn stover was carried out in a 2 L Parr reactor as described previously Crystalline cellulose III control was prepared using cotton liter derived cellulose (Sigma St Louis MO) based on previously published protocol60
Scanning electron microscopy (SEM)
SEM was carried out on a JEOL (Japan Electron Optics Labora-tones) 6400V SEM with a LaB6 emitter Biomass samples were gold sputter coated without critical point drying (CPD) to avoid possible extraction of AFEX surface deposits during CPD and imaged at accelerating voltages between 10 and 20 kV to prevent electron beam induced damage to the specimens Cell wall lumen perimeter and enclosed area were calculated using Zeiss LSM Image Browser (Version 30 Carl Zeiss International Jena Germany)
Laser scanning confocal fluorescence microscopy (LSCM)
Untreated and AFEX pretreated MSU corn stems sections (slice thickness ranging from 100 microm to 1 mm) were stained with 1 Safranin 0 (Sigma St Louis MO) in distilled water for 15 min
and observed using a Zeiss Pascal LSCM Excitation from a 543 nm laser and emission passing through a long pass (LP) 560 nm filter was used for observing fluorescence Sections of the tissue were also observed for auto-fluorescence without staining Stacks of confocal optical sections were taken throughout the z-depth of the observed plant stem section Several individual cross-sections were observed and extended focus images of the stacks were compiled using the maximum intensity algorithm software (LSM 5 Pascal Version 3 Carl Zeiss International Jena Germany)
Atomic force microscopy (AFM)
AFM imaging was conducted using a Dimension Nanoscope 3100 Scanning Probe Microscope (Digital Instruments) with a Nanoscope IIIa controller Both amplitude and phase images were collected simultaneously in tapping mode (in air) with an MPP-11100 etched silicon probe with a nominal frequency of 300 kHz and a nominal spring constant of 40 N m-1 Untreated cell walls were not air-dried prior to imaging (moisture content gt50 ww) while pretreated cell walls were air-dried to remove the residual ammonia prior to imaging RMS roughness factors were estimated after image flattening and plane fitting of the height images using the software that came with the instrument The width of the cell wall microfibrils and AFEX deposits were calculated using Zeiss LSM Image Browser (Version 30 Carl Zeiss International Jena Germany)
Transmission electron microscopy (TEM) and 3D-TEMshytomography
Corn stover samples were processed using the microwave Elec-tron Microscopy (EM) processing methodology Biomass was fixed twice for 6 min (2 min on 2 min off 2 min on) in 25 glutaraldehyde solution buffered in 01 M sodium cacodylate buffer (EMS Hatfield PS) under vacuum Dehydration was carried out in a graded ethanol series for 1 min each (15 30 60 90 twice for 100 ethanol) Samples were infiltrated with LR White (or Epon) resin in the microwave under vacuum and incubated overnight at room temperature with increasing concentrations of the resin (15 30 60 90 thrice for 100 resin diluted in ethanol) Samples were then transferred to gelatin capsules and the resin was polymerized by heating to 60 degC overnight LR White embedded samples were sectioned to ~100 to 250 nm with a Diatome diamond knife on a Leica EM UTC ultramicrotome (Leica Wetzlar Germany) The sectioned samples were collected on Formvar coated copper or nickel slot grids (SPI Supplies West Chester PA) Grids were post-stained for 6 min with 2 aqueous uranyl acetate The grids were also stained with 1 KMnO4 for 10 min to selectively stain for lignin Images were taken with a Gatan UltraScan 1000 camera (Gatan Pleasanton CA) on a FEI Tecnai G220 Twin 200 kV LaB6 TEM (FEI Hilsboro OR) Tomograms were created by capturing dual-axis plusmn 60-65deg tilt series using Serial EM (httpbio3d coloradoedu) Tomograms were constructed using an Rshyweighted back projection algorithm within the IMOD software package (httpbio3dcoloradoedu) Single-axis tomograms were then combined to yield dual-axis tomograms using
This journal is copy The Royal Society of Chemistry 201 1 EnergyEnviron Scii 20114 973-984 | 981
a warping algorithm within IMOD40 Tomograms were dis-played and analyzed using the IMOD software package38
Porous spaces (ie unstained regions) within the pretreated cell walls were modeled by enclosingthem using iso-surface mesh contours based on an optimum threshold value (ranges 130-170) One representative tomogram per AFEX condition was analyzed by IMOD to determine the porosity (tomogramsare provided as ESIDagger) within different regions within the cell wall as highlighted in Table S9Dagger The tomograms were analyzed without binning the voxels intensities however to generate the iso-surfacesthe image bin and smooth values were set between 3-4 and 10-15 respec-tively The boxes enclosing the iso-surfaces typically ranged in xshyy dimensions between 100 and 500 nm while the z-scale thickness was typically 80-150 nm Each pixel is 1 nm wide in the x-y plane while it was assumed to be 1 nm in the z-direction (within the depth of the sample tomogram assuming no beam-induced specimen thinning) Surface areas of iso-surfaces enclosing porous regions within a defined volume of the cell wall were obtained using the IMOD model Total porosity within the cell wall was estimated by computing the fractional surface area to volume contributed by each region within the cell wall tomo-gram The relative fractional thicknesses of the various regions within the cell wall (ie CMLS51S2S3S1S2S3delamination zones) were calculated based on the size ofthe congruous porous regions Assuming the density of the cell wall to be uniform (ie 1 gram ofcell wall occupies 1 cm3 volume) the surface area ofthe porous regions per gram of biomass was computed
Immuno-electron microscopy (IEM)
Anti-arabinoxylan LM-11 antibody was obtained from PlantProbes (Leeds UK) TheepitopeforLM-11 hasfourxylose residues that are able to accommodate un-substituted and substituted xylan backbones63 For anti-xylan immuno-EM sample grids were placed on 15 microL drops of 15 BSA (bovine serum albumin) in l times PBS-0l Tween (PBST) for 30 min blotted then directly placed on 15 microL drops of respective primary antibodies diluted 1 10 in 1 BSA-PBSTfor 90 min Following 3 times 1 min rinses the grids were then placed on 15 microL drops of anti-rat (IgG) secondary antibody conjugated to a 15 nm gold particle (British BioCell Ted Pella) diluted 1 100 in PBST Samples were then rinsed 3 times 1 min with PBST and again in H2O The grids were post-stained with uranyl acetate and KMnO4 for better contrast
Nitrogen physisorption analysis
The Brunauer-Emmett-Teller (BET) surface area and pore size distribution were measured by nitrogen adsorption at 77 K using a Micromeritics ASAP 2700 instrument At least 2-3 g of sample was used for each run and were degassed at 60 degC overnight prior to analysis
Electron spectroscopy for chemical analysis (ESCA)
Surface chemical characterization was carried out using a Phys-ical Electronics PHI5400 ESCA electron spectrometer equipped with a non-monochromatic Mg Kα (15 V 300 W) X-ray source as described previously50 All spectra were typically collected at an optimal take-off-angle (TOA) of45deg for a 250 times 250 square
micron area Some measurements were conducted at 15deg and 75deg to determinethe thickness of surface extractivesPeak intensities were determined by peak area integration Curve fitting to the carbon (1s orbital) oxygen (1s orbital) calcium (2p orbital) and nitrogen (1s orbital) peaks was carried out with a Lorentzian-Gaussian curve-fitting program The carbon (Cls) signal was deconvoluted(within plusmn03eV)intoCl(2847eV)C2(2864eV) C3 (2881 eV) and C4 (2898 eV) signals Samples were milled to lt200 microm before AFEX Some samples were extracted with hot water as described previously11 prior to analysis
Raman Spectroscopy
Raman spectra were obtained using a near-IR FT-Raman spectrometer (RFS-100 Bruker Instruments Inc Billerica MA) The spectrometer was equipped with a 1000 mW 1064 nm continuous wave diode Nd YAG laser along with a liquid nitrogen cooled germanium detector Samples were pressed into the aluminium wells and spectra were acquired using a 600 mW laser 1024 scans were accumulated for each spectrum Raman spectra were normalized based on the 1096 cm-1 band of cellu-lose to allow comparison between samples In order to obtain Raman spectra with minimumfluorescence interference samples were delignified using acid chlorite and then bleached with sodium borohydride prior to analysis The treatment method was asfollows To approximately 01 gsubstrate about 10mL of water was added About 01 g ofsodium chlorite was dissolved in to the water continuously stirring the suspension followed by adding a drop of acetic acid The sample was then placed into a 60-70degC water bath for 90 min with continuous stirring The sample was centrifuged washed three times with water twice with 95 ethanol and once withacetone To approximately 01 g of the acid chlorite treated samples about 10 mL of a 1 (ww) solution of sodium borohydride was added The reaction was allowed to proceed for two hours at room temperature with periodic stirring Uponcompletion thesamples werecentrifuged and the liquid decanted off The treated samples were washed three times with water twice with 95 ethanol and once with acetone The extent of cellulose III formation if any was determined based on the relative peak intensity of 380 and 350 cm-1 as reported previously64
Nuclear magnetic resonance (NMR) spectroscopy
Preliminary characterization of extractable lignins by NMR and comparison with isolated corn stover lignin was carried out as follows Isolated corn stover lignin was prepared by dioxane-water extraction of the ball-milled extractive-free corn stover as described previously65 The AFEX lsquodelocalized surface ligninrsquo was isolated from extraction of unground AFEX-treated corn stover with 9 lacetone water (at room temperature) followed by lyophilization The dried powder was water-washed (over a 5 microm nylon filter) to remove saccharides and other water-soluble compounds Two-dimensional 13C-1H-correlation (HSQC) spectra in 9 1 acetone-d6 D2O were obtained on a Bruker Biospin (Billerica MA) Avance 500 MHz spectrometer fitted with a cryogenically cooled 5 mm TCI gradient probe with inverse geometry (proton coils closest to the sample) as described elsewhere66
982 | EnergyEnviron Sci 20114973-984 This journal is copy The Royal Society of Chemistry 2011
Modified Prussian blue phenolics analysis
Total phenolic content of the water soluble cell wall extractives was measured using the modified Prussian blue method A detailed protocol is provided elsewhere5067
Cellulase purification enzymatic hydrolysis and compositional analysis
Protocols for cellobiohydrolase (Cel7A Cel6A) and endogluca-nase (Cel7B) purification from Trichoderma reesei enzyme broth microplate based high-throughput enzymatic hydrolysis and hydrolyzate sugar analysis are provided elsewhere6869
Acknowledgements This work was funded by the Michigan State Research Foun-dation and the DOE Great Lakes Bioenergy Research center (wwwgreatlakesbioenergyorg) supported by the US Depart-ment of Energy Office of Science Office of Biological and Enviromental Research through the Cooperative Agreement DE-FC02-07ER64494 between The Board of Regents of the University of Wisconsin System and the US Department of Energy BSD and MEH were supported by the DOE Office of Biomass Program We would like to thank Ewa Danielewicz Melinda Frame Shirley Owens and Per Askeland for their help and guidance in using various instruments We gratefully acknowledge Rebecca Garlock Nirmal Uppugundla Dahai Gao and other members of the BCRL who provided useful insights criticisms and technical support We also thank Rick Reiner (USDA FS FPL Madison) for assistance in obtaining the Raman spectra
References
This journal is copy The Royal Society of Chemistry 2011 EnergyEnviron Sci 20114973-984 | 983
984 | Energy Environ Sci 2011 4 973-984 This journal is copy The Royal Society of Chemistry 2011
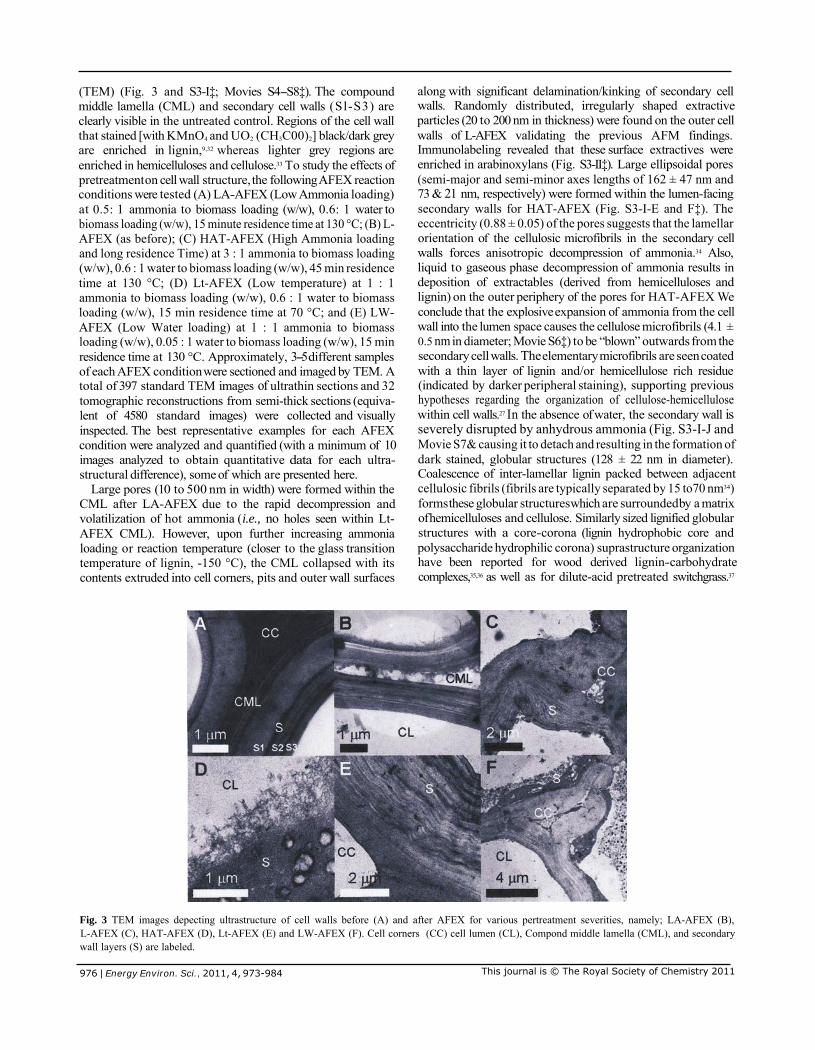

984 | Energy Environ Sci 2011 4 973-984 This journal is copy The Royal Society of Chemistry 2011