energy efficiency trends and policies in spain · energy efficiency trends and policies in ... time...
TRANSCRIPT
Energy Efficiency Trends and Policies in SPAIN 1
Energy Efficiency Trends and Policies in SPAIN
National Report for the ODYSSEE-MURE Project
Planning and Studies Department
Madrid, 30th September 2015

Energy Efficiency Trends and Policies in SPAIN 2

Energy Efficiency Trends and Policies in SPAIN 3
Contacts:
Pilar de Arriba Segurado IDAE C/Madera, 8 28004 – Madrid - Spain Tel.: +34.914.564.900/ Fax: +34.915.230.414 E-Mail: [email protected] www.idae.es Jesús Pedro García Montes IDAE C/Madera, 8 28004 – Madrid - Spain Tel.: +34.914.564.900 / Fax: +34.915.230.414 E-Mail: [email protected] www.idae.es Carlos García Barquero IDAE C/Madera, 8 28004 – Madrid - Spain Tel.: +34.914.564.900 / Fax: +34.915.230.414 E-Mail: [email protected] www.idae.es
The sole responsibility for the content of this publication lies with the authors. It does not necessarily reflect the opinion of the European Communities. The European Commission is not responsible for any use that may be made of the information contained therein.

Energy Efficiency Trends and Policies in SPAIN 4

Energy Efficiency Trends and Policies in SPAIN 5
TABLE OF CONTENT
LIST OF FIGURES ............................................................................................................................................... 6
LIST OF TABLES ................................................................................................................................................. 8
0. EXECUTIVE SUMMARY ................................................................................................................................ 9
1. ECONOMIC AND ENERGY EFFICIENCY CONTEXT ........................................................................................ 12
1.1. ECONOMIC CONTEXT ........................................................................................................................ 12
1.2. TOTAL ENERGY CONSUMPTION AND INTENSITIES ............................................................................ 14
1.2.1.ENERGY CONSUMPTION TRENDS: BY FUEL AND BY SECTOR .................................................... 14
1.2.2.OVERALL TRENDS IN ENERGY INTENSITY .................................................................................. 17
1.3. ENERGY EFFICIENCY POLICY BACKGROUND ...................................................................................... 22
2. ENERGY EFFICIENCY IN BUILDINGS............................................................................................................ 27
2.1. ENERGY EFFICIENCY TRENDS ............................................................................................................. 27
2.1.1.THE HOUSEHOLD SECTOR ........................................................................................................ 28
2.1.2.THE SERVICES SECTOR .............................................................................................................. 34
2.2. ENERGY EFFICIENCY POLICIES ........................................................................................................... 38
2.2.1 THE HOUSEHOLD SECTOR ......................................................................................................... 41
2.2.2 THE SERVICES SECTOR .............................................................................................................. 41
3. ENERGY EFFIENCY IN TRANSPORT ............................................................................................................. 46
3.1. ENERGY EFFICIENCY TRENDS ............................................................................................................. 46
3.2. ENERGY EFFICIENCY POLICIES ........................................................................................................... 53
4. ENERGY EFFICIENCY IN INDUSTRY ............................................................................................................. 61
4.1. ENERGY EFFICIENCY TRENDS ............................................................................................................. 61
4.2. ENERGY EFFICIENCY POLICIES ........................................................................................................... 67

Energy Efficiency Trends and Policies in SPAIN 6
LIST OF FIGURES
Figure 1.1: Evolution of GDP in Spain and EMU .................................................................................................... 12
Figure 1.2: Macro-Economic Developments in Spain ........................................................................................... 13
Figure 1.3: Evolution of Primary Energy Consumption by sources in Spain, 2000-2013 ...................................... 14
Figure 1.4: Trends of Domestic Energy Production and Degree of Self Supply, 2000-2013 ................................. 15
Figure 1.5: Trends of Final Energy Consumption by Sources, 2000-2013 ............................................................. 15
Figure 1.6: Trends of Final Energy Demand by Sectors, 2000-2013...................................................................... 16
Figure 1.7: GDP Structure Trends by Sectors ........................................................................................................ 16
Figure 1.8: Trends of Primary Energy Intensity in Spain and EU, 2000-2013 ........................................................ 17
Figure 1.9: Impact of Energy Supply Structure on the Transformation System/Primary Intensity ....................... 18
Figure 1.10: Trends of Primary Energy Intensity at Purchasing Power Parities .................................................... 18
Figure 1.11: Trends of Primary and Final Intensities in Spain ............................................................................... 19
Figure 1.12: Trends of Final Energy Intensity in Spain and EU, 2000-2013 ........................................................... 19
Figure 1.13: Trends of Final Energy Intensity at purchasing power parities ......................................................... 20
Figure 1.14: Trends of Final Energy Intensity at Constant Structure, 2000-2013 ................................................. 20
Figure 1.15: Trends of Final Energy Intensity in Spain: Global and by Sectors, 2000-2013 .................................. 21
Figure 1.16: Energy Efficiency Progress by Sectors in Spain ................................................................................. 21
Figure 1.17: Time Distribution of the Accumulated Final Saving Energy Objective .............................................. 24
Figure 1.18: Distribution of the Final Energy Saving Objective (571 ktoe/year) by Sectors. ................................ 24
Figure 2.1: Share of Buildings in Final Energy Consumption in Spain, 2000-2013 ................................................ 27
Figure 2.2: Trends in floor area of new buildings in Spain, 2000-2013 ................................................................. 28
Figure 2.3: Structure of Energy Consumption of Households by Energy Sources in Spain, 2000-2013 ................ 28
Figure 2.4: Trends of Income and Energy Consumption per Dwelling in Spain, 2000-2013 ................................. 29
Figure 2.5: Main Indicators of the Household Sector in Spain, 2000-2013........................................................... 30
Figure 2.6: Trends in Electricity Consumption per Dwelling in Spain and EU, 2000-2013 .................................... 30
Figure 2.7: Trends of Energy Intensity in the Household Sector in Spain and EU, 2000-2013 .............................. 31
Figure 2.8: Breakdown of the Energy Consumption by Uses in the Household sector in Spain and EU ............... 32
Figure 2.9: Energy Efficiency Progress in Households in Spain ............................................................................. 32

Energy Efficiency Trends and Policies in SPAIN 7
Figure 2.10: Decomposition of Household’s Energy Consumption Variation ....................................................... 33
Figure 2.11: Main Indicators in the Services Sector in Spain, 2000-2013 ............................................................. 34
Figure 2.12: Trends of Energy Intensity of the Services Sector in Spain and EU, 2000-2013................................ 35
Figure 2.13: Relevance and Structure of the Electricity Consumption in the Services Sector .............................. 35
Figure 2.14: Trends of Energy Intensity in the Services Sector by sub sectors in Spain, 2000-2013 .................... 36
Figure 2.15: Trends of Electricity Intensity of the Services Sector in Spain and EU, 2000-2013 ........................... 36
Figure 2.16: Comparative Trends of Energy Intensities and Unit Consumptions ................................................. 37
Figure 2.17: Itemization of Services’ Energy Consumption Variation ................................................................... 38
Figure 2.18: Development of Energy Efficiency Measures by type over time in the Residential Sector .............. 43
Figure 2.19: Development of Energy Efficiency Measures by type over time in the Services Sector ................... 43
Figure 2.20: Semi-quantitative Impact Evaluation in Buildings ............................................................................ 44
Figure 3.1: Trends of Traffic of Goods and Passengers in Spain, 2000-2013 ........................................................ 46
Figure 3.2: Trends of Energy Consumption by Transport Modes in Spain, 2000-2013 ......................................... 47
Figure 3.3: Variation of Energy Consumption by Transport Modes in Spain and the EU ..................................... 47
Figure 3.4: Trends in the Share of the Energy Consumption by Transport Modes in Spain, 2000-2013 .............. 48
Figure 3.5: Main Indicators in the Transport Sector in Spain, 2000-2013 ............................................................ 48
Figure 3.6: Energy Consumption in Goods and Passenger Transport in Spain, 2013 ........................................... 49
Figure 3.7: Energy Consumption in Road Transport by Types of Vehicle in Spain, 2013 ...................................... 49
Figure 3.8: Car Ownership in Spain and the EU .................................................................................................... 50
Figure 3.9: Trends of Unit Consumption and Average Annual Distance Travelled ............................................... 50
Figure 3.10: Trends in the Specific Consumption of New Cars in Spain ................................................................ 51
Figure 3.11: Trends of Energy Intensity in Transport Sector in Spain and EU, 2000-2013 ................................... 51
Figure 3.12: Energy Efficiency Progress in Transport in Spain .............................................................................. 52
Figure 3.13: Decomposition of Transport’s Energy Consumption Variation......................................................... 53
Figure 3.14: Energy and Environmental Benefits of PIVE Plans ............................................................................ 55
Figure 3.15: Development of Energy Efficiency Measures by type over time in the Transport Sector ................ 58
Figure 3.16: Semi-quantitative Impact Evaluation in Transport ........................................................................... 59
Figure 3.17: Share of New Car Sales by CO2 Emission Intervals versus Number of New Vehicles ........................ 60

Energy Efficiency Trends and Policies in SPAIN 8
Figure 3.18: Impact of the PIVE Plans on the Demand for Efficient Vehicles ....................................................... 60
Figure 4.1: Energy-Economic Characterization of the Industry Sector by branches in 2013 ................................ 61
Figure 4.2: Trends of Energy Intensity in Manufacturing Industry in Spain and EU, 2000-2013 .......................... 62
Figure 4.3: Changes in the Added Value Structure in Manufacturing Industry .................................................... 62
Figure 4.4: Trends of Energy Intensity in Industry Sector in Spain and EU, 2000-2013 ........................................ 63
Figure 4.5: Trends of Energy Intensity and Consumption in Intensive Industry Branches, 2000-2013 ................ 63
Figure 4.6: Main Indicators of Industry Sector in Spain, 2000-2013 ..................................................................... 64
Figure 4.7: Trends of the Unit Consumption (toe/t) of Intensive Industry Branches ........................................... 64
Figure 4.8: Effect of the Electrification in Industry in Spain .................................................................................. 65
Figure 4.9: Energy Efficiency Progress in Manufacturing Industry by Branches in Spain ..................................... 66
Figure 4.10: Decomposition of Industry’s Energy Consumption Variation ........................................................... 67
Figure 4.11: Development of Energy Efficiency Measures by type over time in the Industry Sector ................... 69
Figure 4.12: Semi-quantitative Impact Evaluation in Industry .............................................................................. 70
LIST OF TABLES
Table 1.1: Indicative Primary Energy Consumption Objective (ktoe) By Energy Sources ..................................... 23
Table 1.2: Indicative Final Energy Consumption Objective (ktoe) By Energy Sources .......................................... 23
Table 1.3: Final and Primary Energy Savings ......................................................................................................... 26
Table 2.1 : Ongoing Energy Efficiency Measures in Building Sector ..................................................................... 45
Table 3.1 : On going Energy Efficiency Measures in Transport Sector .................................................................. 59

Energy Efficiency Trends and Policies in SPAIN 9
0. EXECUTIVE SUMMARY
This report introduces Spanish national case for the Intelligent Energy Europe project “Monitoring of energy efficiency in the EU (ODYSSEE MURE 2012)”. It is divided into four chapters, introducing the most recent efficiency trends, both at general and sectoral level, as well as a general overview of the policies and efficiency measures applied in the last years. Chapter 1 accounts for a general context addressing the economic and energy situation in Spain, as well as the policies in force concerning energy planning, and more specifically, in terms of energy efficiency. Chapters 2, 3 and 4 focus on the building, transport and industry sector, respectively. The building sector analyses the situation within the residential and the tertiary sectors. Each chapter is divided into two parts: the first one accounts for an analysis of the energy efficiency trends in each sector, and the second illustrates the most relevant energy efficiency actions, particularly, the most recent ones. Energy supply in Spain has evolved in the last years towards a more diversified, balanced structure with the growing contribution of renewable energies and natural gas. This came along with an upward trend in energy demand during the first half of the former decade, and with the ensuing turning point from 2007 on. Since then, the situation has been on the wane, which has mainly contributed to a fall in the demand of oil and coal products. This trend became more dramatic from 2008 onwards under the effects of the economic crisis, which has been constraining since then the trends noticed in demand, both in terms of primary and final energy. Nevertheless, from the second half of 2013 on, a fledgling recovery scenario has been consolidating for Spanish economy. In this context, primary and final energy demand in 2013 recorded a decrease of 6.8% and 2.6%, respectively. The sharper fall of demand in primary energy responded to a greater contribution of renewable energies in the electric generation system, and particularly, in hydro energy with an increase of 79% in its production. The primary and final energy intensity followed the demand trend, showing a change in trend from 2004 till the beginning of the crisis in 2008 with a somewhat disruption in its evolution. In 2013 and in the stated context, primary and final energy intensity recorded improvements of 5.7% and 3.5% respectively as a result of the difference in the evolution of energy demands and of the Gross Domestic Product (GDP) (-1.2%) with regard to the former year. Various factors explain the improvement noticed in both indicators, such as the effects associated with electricity generation technologies based on renewable energies and natural gas; to structural and activity changes, enhanced by the current economic scenario, as well as to the impact of energy efficiency policies. The whole has had a repercussion on a moderate evolution of energy intensities. At final use sector level, some stabilization can be noticed in the consumption’s sector structure, with the transport sector ahead of it with nearly 40% of the total consumption, followed by the industrial sector with 25.7% of demand. The industrial sector keeps accounting for a progressive recoil which is at loggerheads with the growing role that the residential, services and agriculture sectors have been reaching - grouped under the category of “Various Uses” – and which at present accounts for 33.9% of demand. As for the energy intensities of the various sectors, the influence of the transport sector in global intensity stands out given its weight in the demand structure. To a lesser extent, the industrial sector is less affected, with a more volatile behaviour from the beginning of the crisis; and the residential sector. Virtually all the sectors with the exception of industry have shown an improvement trend

Energy Efficiency Trends and Policies in SPAIN 10
regarding their intensities. The residential sector in 2013 improved its intensity by 4.2%. The effects of a somewhat contention of demand, linked to households and motivated by the current economic scenario, overlapped those linked to the technological improvements in electric appliance equipment and household thermal installations. The favourable impact of legislative advances in the field of building also adds up to the above. The tertiary sector in 2013 underwent an improvement of its energy intensity of 3.8%. The evolution of intensity largely responds to the demand’s structure, highly represented in electric consumption. This explains the different behaviour of electric intensity, which has been rating over the EU-28 average in the last years in contrast with global intensity. In the last three years, both global and electric intensity revealed a downward trend possibly associated with the increase of electricity prices which has taken place since 2008. In the transport sector, energy intensity has maintained a downward trend since year 2004, reinforced by the current economic situation. This is one of the issues that have led to lower mobility associated with passenger and freight traffic. This situation prevailed in 2013 with a recorded decrease of 3.0% in the associated intensity. The industrial sector as a whole has recorded a deterioration of the intensity in recent years, coinciding with the beginning of the crisis. The manufacturing industry, for its part, has shown a downward trend since 2004, which seems to continue after the beginning of the crisis, even if with slight fluctuations. In 2013 the intensities of the global and the manufacturing industry increased by 5.2% and 3.2% respectively. In general terms, the change of the economic scenario has been affecting many a branch of industry, leading to certain uncoupling between the evolutions of the economic activity and of energy demand, which penalised the corresponding intensities. Among other factors, this responds to the fact that the used equipment runs under its nominal capacity affecting its performance. On the other hand, the more dramatic worsening of global industry is slightly linked to the recent evolution of the building sector, very much affected by the change in the economic situation.
According to the global energy efficiency index (ODEX)1, more appropriate for the analysis of energy efficiency, Spain accounts for a continued progress in energy efficiency in the period analysed from 2000 to 2013, and which counts on the contribution of all the sectors, namely the contribution of transport and industry sectors, with annual average improvement of 1%.
Spain has been doing its best for years to improve energy efficiency, taking into account the EU guidelines in force in the field of energy efficiency. This becomes evident in numerous actions, a large part of which are available on the MURE Database (www.mure2.com).
On a general level, one of the milestones is the recent approval of the National Action Plan on Energy Efficiency 2014-2020, in accordance with the requirements set out by Directive 2012/27/EU of the
1The ODEX index has been developed under the ODYSSEE project so as to have better understanding of energy efficiency progress, regardless of factors unrelated to efficiency. The results of the analysis based on this index can be contrasted with those obtained on the basis of energy intensities since the latter consider the influence of factors other than efficiency; this explains possible differences at sector-level analysis.

Energy Efficiency Trends and Policies in SPAIN 11
European Parliament and the Council, and the third (NEEAP3), in accordance with the provisions of article 14 of Directive 2006/32/EC, of 5 April 2006, on energy end-use efficiency and energy services. This plan is a continuation of previous plans approved within the framework of the Energy Saving and Efficiency Strategy for Spain 2004-2012 (E4) and the subsequent Action Plan 2011-2020 (NEEAP2). The Action Plan 2014-2020 considers a series of instruments and measures to meet the energy objectives assumed by Spain in relation to Articles 3 and 7 of the said Directive. As for the implementation of the second of these objectives, Law 18/2014, of 15 October, approving urgent measures for growth, competitiveness and efficiency, creates a national system of energy efficiency obligations as well as a national fund meant to finance energy efficiency mechanisms for economic, financial, technical assistance, training, information and other measures that help increase energy efficiency in the different sectors of final energy consumption. At sectoral level, the relevant ones are the transport and building sectors for being the recipients of the larger number of measures, consistent with the EU guidelines in force on energy efficiency. Regarding the transport sector, the most relevant measures aim at renewing the car fleet, particularly PIVE Plans and PIMA Air Plans, and at boosting electric mobility through initiatives such as the MOVELE Programme. Regarding the building sector, apart from the legislative progress compliant with Directive 2010/31/EU on the energy efficiency of buildings, there are a large number of actions aimed at the energy rehabilitation of buildings, focussing on public buildings given their exemplary role. Further details of the measures currently applied in the different sectors are available in Chapters 2, 3 and 4.

Energy Efficiency Trends and Policies in SPAIN 12
1. ECONOMIC AND ENERGY EFFICIENCY CONTEXT
1.1. ECONOMIC CONTEXT
The change in the economic situation, whose effects started becoming evident in Spain from the third term 2008 onwards, involves a large number of challenges for the consolidation of the recovery and the setting up of a new growth path on the basis of stability. A new scenario with a fledgling recovery of Spanish economy consolidated from the second half 2013, and therefore, it overcame the recession that had started two years earlier in the third term. The GDP has shown positive, if somewhat moderate, quarter-on-quarter growth rates, joined to a modest net job creation. A growth in consumption, investment in capital goods and an increase in employment have boosted a new recovery phase in economy. Nonetheless and despite the improvement slant all along the fiscal year, the GDP decreased by 1.2% in 2013, partly as a result of the bandwagon effect stemming from a dramatic decrease of activity in late 2012. From an expenditure point of view, national demand in 2013 went back to 2.7%, even if the contraction pace slowed down all along the year. For its part, net foreign demand contributed to the GDP growth for the sixth year. The foreign sector’s positive contribution is a reflection of the exports strength, which increased by 4.9% in 2013, whereas goods & services imports accounted for a slight advance (0.4%) after a two-year slump in a context of improvement in final demand. The increase in goods exports was largely due to the beginning of an investment cycle, which demanded the purchase of capital goods, many of which are not manufactured in Spain. For its part, export growth was motivated both by capital goods and tourist service exports in an exceptionally good year, which reached historic peaks both at income levels for this item and foreign tourist visits (60.7 million). The increase in exports, along with a decrease in the energy deficit favoured by the lower price of crude oil, contributed to the improvement of the trade deficit. Behind the positive evolution of the foreign demand lies the recovery of the world trade, as well as new gains in competitiveness. Both the Euro zone and the Economic Monetary Union (EMU) have taken part in the economic recovery, having registered positive GDP term-on-term growth rates from the second term 2013, Figure 1.1.
Figure 1.1: Evolution of GDP in Spain and EMU
Note: GDP in current prices
Source: OECD/INE
In a nutshell, the benchmarking of Spanish economy and of the main economies of the Spanish milieu accounts for some parallelism. Recently, this greater convergence has been constrained by the
-6%
-4%
-2%
0%
2%
4%
6%
8%
10%
2007-Q1 2007-Q4 2008-Q3 2009-Q2 2010-Q1 2010-Q4 2011-Q3 2012-Q2 2013-Q1 2013-Q4
Inte
r-a
nn
ua
l gro
wth
Euro zone Spain

Energy Efficiency Trends and Policies in SPAIN 13
drive of international trade recorded in the second semester of 2013, as well as by the fiscal consolidation and structural reform processes registered in a large number of the surrounding countries. Among the private components of domestic expenditure, investment in capital goods shows an earlier recovery from the very beginning of the year; household consumption also joined this trend from the second term onwards. Household consumption accounts for recovery signs in the second half of 2013, after two years’ slum, especially dramatic at the end of 2012 given the impact of a set of measures for fiscal consolidation that affected household incomes. This consumption recovery has taken place in a slowing-down of the disposable income and of a more favourable evolution of the wealth financial household component. As for the public components of expenditure, subject to an adjustment process stated in 2012, its negative contribution to the activity decreased within a context of relaxation of fiscal requirements in mid-year. From the point of view of offer, the decreases in the added value of the various production branches in the annual average were lower in 2013 than in the previous year, and the best performance all along the fiscal year became evident in small upturns in industry and in market services from the third term on. The sector’s evolution was not homogeneous, so much so that the improvement concentrated, above all, on the more dependent branches of foreign demand.
Figure 1.2: Macro-Economic Developments in Spain
Source: INE/IDAE
The good performance of the automotive sector, whose production was favoured by foreign demand and the positive impact of the various governmental plans to boost car purchase, stands out among the manufacturing industry branches. Moreover, the thrust of the latter branch has brought about the advance of specific automotive industries, such as rubber or plastic products. In like manner stands out the positive performance of sectors as the textile and others of high-technological content. Among the market services, the most outstanding performance recorded was the one of the branches linked to tourism and transport. On the other hand, trade stepped back somehow dramatically, as a result of the weak domestic demand. Finally, construction became again the sector with the greatest regression, in accordance with the dramatic contraction of demand, both public and private. This latter sector had been the driving force of Spanish economy for over a decade, and consequently, its decline worsened the effect of the crisis on the national economy.
60%
70%
80%
90%
100%
110%
120%
130%
140%
150%
160%
2000 2001 2002 2003 2004 2005 2006 2007 2008 2009 2010 2011 2012 2013
Bas
e 2
00
0=1
00
GDP (€05) VA_Services (€05) VA_Construction (€05)
VA_Agriculture (€05) VA_Manufacturing Industry (€05) Private Consumption (€05)

Energy Efficiency Trends and Policies in SPAIN 14
1.2. TOTAL ENERGY CONSUMPTION AND INTENSITIES
1.2.1. ENERGY CONSUMPTION TRENDS: BY FUEL AND BY SECTOR
The primary energy consumption in Spain has evolved in recent years towards a more diversified, balanced structure, with greater contribution of renewable energy and natural gas sources, Figure 1.3. This has come along an upward trend in energy demand, which shows a turning point for year 2007. From then on, a decreasing path took place, which essentially involved a slump in the demand of oil and coal products. This trend became worse from year 2008 under the effects of the economic crisis, whose greater impact took place in 2009 with a regression in the demand of primary energy of 8.6%. Later on, a period of greater stability opened up, with a downward trend for 2009-2012, and a reduction in consumption in 2013 of 6.8% as compared to the previous year, standing at 120,447 ktoe.
Figure 1.3: Evolution of Primary Energy Consumption by sources in Spain, 2000-2013
Note: Non- renewable wastes included in petrol; *small Hydro in Hydraulic
Source: MINETUR/IDAE
This last reduction resulted from the decrease in the demand of all conventional energy sources, specifically of coal (-26.4%), nuclear power (-7.7%), natural gas (-8.7%) and oil (-5.0%) - the latter two ones being accountable for 66.4% of demand. Renewable energies, with an increase of 8.0%, partially compensated a fall in the demand of conventional sources. In 2013 within renewable energies is to be highlighted an increase of 79% in hydro contribution, resulting from the greater availability of water resources in contrast with previous years’ trends. Solar and wind energy also stand out, with respective increases of 11.2% and 9%. The evolution of biomass, biogas and biofuels was not that favourable, recording regression in their corresponding demands – particularly remarkable in the case of biofuels with a slump of 57.3% in demand. Globally, the evolution of renewable energies in 2013 involved an improvement on meeting the primary energy demand, reaching 14.4% versus 12.4% of the previous year. The autochthonous production potential from the various energy sources, along with an evolution in the structure of energy supply towards greater diversification, Figure 1.4, points to a capacity of self-supply. National energy dependence has reached at present 71.4%, nearly 20 percentage points over the European average. Despite this, the evolution of renewable energies since year 2005 is a remarkable fact, featured by their progressive introduction in the energy system, which has led to an autochthonous production, similar or even higher than the nuclear one. This translated into a somehow better energy self-supply, which amounted to 28.6% in 2013.
0
15.000
30.000
45.000
60.000
75.000
90.000
105.000
120.000
135.000
150.000
2000 2001 2002 2003 2004 2005 2006 2007 2008 2009 2010 2011 2012 2013
Kto
e
Electrical Balance Other RES Hydraulics* Nuclear Natural Gas Coal Oil

Energy Efficiency Trends and Policies in SPAIN 15
Figure 1.4: Trends of Domestic Energy Production and Degree of Self Supply, 2000-2013
2013
Note: Non-renewable waste included in petrol
Source: MINETUR/IDAE
The analysis of the evolution of final energy demand by sources, Figure 1.5, shows a profile similar to the primary energy one, accounting for the same peculiarities in their global evolution. In 2013 and under the effects of the crisis, final energy consumption – non-energy uses excluded – recorded a fall of 2.6%, finally standing at 80,836 ktoe. This evolution represents a deceleration in the rate of decrease with respect to the previous year, when demand fell by 4%.
Figure 1.5: Trends of Final Energy Consumption by Sources, 2000-2013
2013 Note: Non-energy uses excluded
Source: MINETUR/IDAE
The 2013 situation basically responds to the lower demand associated with oil products (-2.2%) and electricity (-3.4%), who jointly represent 73% of the global final energy demand. The transport and industry sectors are behind this evolution, given the weight of these two energy sources in the said sectors and their sensitivity on facing the current crisis. Renewable energies, for their part, have seen their demand reduced by 16% in terms of final energy. This fact is essentially due to the evolution undergone by biofuels (-57.3%) and, to a lesser extent, to the fall in the demand of biogas (-15.1%), associated with a lower use of co-generation plants running on biogas. As whole, renewable energies in 2013 have involved meeting a 6.5% global energy demand, a lower contribution than the previous year’s, put at 13.7%. Biomass, with an increase of 5.3% in demand, remains the most representative renewable resource of final use, which reached 77.1% of the renewable energy contribution to final energy demand.
20%
21%
22%
23%
24%
25%
26%
27%
28%
29%
0
5.000
10.000
15.000
20.000
25.000
30.000
35.000
2000 2001 2002 2003 2004 2005 2006 2007 2008 2009 2010 2011 2012 2013
De
gre
e o
f Se
lf S
up
ply
(%)
Kto
e
Oil Natural Gas Coal RES Nuclear Degree of self supply
Coal5,1%
Oil1,5%
Natural Gas0,1%
Nuclear42,9%
RES50,3%
Geotermia
0
15.000
30.000
45.000
60.000
75.000
90.000
105.000
2000 2001 2002 2003 2004 2005 2006 2007 2008 2009 2010 2011 2012 2013 2014
Kto
e
Electricity RES Natural Gas Coal Oil Products
Coal1,9%
Oil Products48,8%
Natural Gas17,9%
Electricity24,7%
RES6,7%

Energy Efficiency Trends and Policies in SPAIN 16
Considering the final energy demand by sectors, some stabilization in the consumption sectoral structure is noticed, placing the transport sector at the head with nearly 40% of total consumption, Figure 1.6. The former is followed by the industrial sector, with 25.7% of the demand, with a downward trend in its relative weight on demand, compensated by the whole of the sectors grouped under the category of “Miscellaneous Uses”2. This category is gaining ground, and has now overcome the industry one from the year 2006, meeting at present as much as 33.9% of demand.
Figure 1.6: Trends of Final Energy Demand by Sectors, 2000-2013
2013 Note: Non-energy uses excluded
Source: MINETUR/IDAE
This relative loss of weight of the industry sector in the global energy demand goes along with a cutback in its contribution to the GPD within the context of a progressive switch to the services sector in Spanish economy.
Finally, at a comparative level, among the EU-28 countries, Spain holds the fifth position in terms of primary and final energy consumption, occupying a more distant position concerning per capita consumption – precisely, 19th position.
Figure 1.7: GDP Structure Trends by Sectors
2000
2008
2013
Source: INE/IDAE
2 The “Miscellaneous Uses” sector includes the residential, services, agriculture and other sectors.
0
15.000
30.000
45.000
60.000
75.000
90.000
105.000
2000 2001 2002 2003 2004 2005 2006 2007 2008 2009 2010 2011 2012 2013
kto
e
Transport Industria Households Services Agriculture&Fisheries Other
Industria 25,7%
Transport 39,4%
Households
18,6%
Services 11,8%
Agriculture
&Fisheries 3,5%
Otros 1,0%
Agriculture 3,6%
Energy Branches
2,2%
Manuf. Industry
15,7%
Construc. 10,6%
Services 58,3%
Taxes 9,6%
Agriculture 2,7%
Energy Branches
2,5%
Manuf. Industry
13,6%
Construc. 9,8%
Services 61,8%
Taxes 9,7%
Agriculture 3,1%
Energy Branches
2,9%
Manuf. Industry
12,1%
Construc. 5,7%
Services 67,4%
Taxes 8,8%

Energy Efficiency Trends and Policies in SPAIN 17
1.2.2. OVERALL TRENDS IN ENERGY INTENSITY
The evolution of the primary energy intensity indicator in Spain shows a profile compliant with the primary energy demand, and displays a trend change from 2004 until the beginning of the crisis in 2008; from then on, its evolution accounts for some kind of imbalance. As it happened with other neighbouring countries, the crisis had an impact on economy, leading to a disruption in the energy intensity evolution – largely due to the effects bound to structural and activity changes – which, in general terms, intensified the downward trend in energy demand and its associated intensity. Prior to the current crisis, there was a sustained improvement in primary energy intensity, bringing closer the trends of the national and European indicators, even with a higher record of the national indicator than its average EU counterpart. This convergence in the trends of both indicators still remains. During the period 2004-2012, there was an annual average improvement of 1.96% in Spain, slightly higher than the corresponding EU average (1.90%), Figure 1.8.
Figure 1.8: Trends of Primary Energy Intensity in Spain and EU, 2000-2013
Source: EnR/IDAE
There are miscellaneous factors behind the improvement noticed in the domestic indicator, among which, the favourable effect stemming from electric generation technologies based on renewable energies and natural gas (co-generation and combined cycles). Thus, the improvement in the transformation performance of these technologies and energy sources, along with the positive effect of a decentralised generation linked to co-generation and renewable energies had an impact on the improvement in the energy efficiency of the transformation system, Figure 1.9. This effect is joined by the one derived from structural changes in the Spanish economy, somehow prior to and independent from the crisis, as well as by the impact of the energy efficiency policies. All of it has a bearing on the moderate evolution of the primary energy intensity. In this context, in 2013 there was an improvement of 5.7% in primary energy intensity as a result of the differential evolution in primary energy demand (-6.8%) and of the Gross Domestic Product (GDP) (-1.2%) as compared to the previous year. This improvement is in line with the upturn noticed in hydro production in 2013, representing an improvement in the transformation system performance as compared to the previous year when lower water resources made it necessary to start running coal-based power plants. This effect is enhanced by the lower demand brought about by a decrease in the activity and production of final use sectors, largely as a result of the economic crisis.
0,075
0,090
0,105
0,120
0,135
0,150
0,165
0,180
2000 2001 2002 2003 2004 2005 2006 2007 2008 2009 2010 2011 2012 2013
koe
/€05
EU-28 France Alemania Italy Spain UK Ireland Portugal

Energy Efficiency Trends and Policies in SPAIN 18
Figure 1.9: Impact of Energy Supply Structure on the Transformation System/Primary Intensity
Source: MINETUR/IDAE
An additional analysis has been made on the basis of the intensity adjusted for purchasing power parity, Figure 1.10. This kind of adjustment enables a more realistic benchmarking of intensities at international level, given that it introduces a correction on the differences between countries in terms of prices and purchase power. This enables a vertical shift of the rated currents, improving the relative position of countries with a lower GDP. In the case of Spain, the adjusted intensity maintains the former profile, even if it improves its position as it has increased its distance with the EU average in its favour.
Figure 1.10: Trends of Primary Energy Intensity at Purchasing Power Parities
in Spain and EU, 2000-2013
UE28 = Reference; Source: ODYSSEE/IDAE
The decreasing evolution of final energy demand at a faster slump pace than the economy’s productivity led to a fall of 3.5% in final energy intensity. The most dramatic primary intensity fall as compared to the final one is due to the greater contribution of renewable energies in the electric generation system, and particularly, of hydro power with an increase in production of 79%.
70%
73%
76%
79%
82%
85%
88%
91%
94%
97%
100%
103%
106%
109%
112%
115%
118%
121%
124%
127%
130%
-75%
-55%
-35%
-15%
5%
25%
45%
65%
85%
105%
125%
145%
165%
185%
205%
225%
245%
265%
2000 2001 2002 2003 2004 2005 2006 2007 2008 2009 2010 2011 2012 2013
Co
ntr
ibu
tio
n t
o P
rim
ary
Ene
rgy
De
man
d(%
)2
00
0=1
00
RES Natural Gas Oil Coal Nuclear Transformation System Eff. Primary Intensity
Pri
mar
y En
erg
y In
ten
sity
/Tr
ansf
orm
atio
n S
yste
m E
ffic
ien
cy (%
)2
00
0=1
00
0,075
0,090
0,105
0,120
0,135
0,150
0,165
0,180
0,195
2000 2001 2002 2003 2004 2005 2006 2007 2008 2009 2010 2011 2012 2013
koe/
€05p
EU-28 France Germany Italy Spain UK Ireland Portugal

Energy Efficiency Trends and Policies in SPAIN 19
Figure 1.11: Trends of Primary and Final Intensities in Spain
Source: IDAE
The drop noticed in final intensity is in line with the structural and activity effects of the crisis on the economic activity, and therefore, on the relevant demand of final energy. A benchmarking of this indicator regarding Spain’s surrounding countries, Figure 1.12, shows a convergence from year 2004 as it happens with the primary energy indicator. The evolution since then and until year 2009 accounts for a parallelism between the national and the EU indicators at an annual improvement pace higher than in the case of the national indicator. In recent years and under the impact of the crisis on both indicators, an improvement of the national annual average in Spain of 2.4% can be noticed for the period 2004-2012, above the 1.8% rate recorded for the whole of the EU in the said period.
Figure 1.12: Trends of Final Energy Intensity in Spain and EU, 2000-2013
Note: Non-energy uses excluded Source: ODYSSEE/IDAE
The analysis of the final intensity indicator adjusted for purchasing power parity, Figure 1.13, provides similar conclusions and improves the domestic position with respect to the European average in an analogous way, as shown on Figure 1.10, corresponding to the same adjustment on primary energy intensity.
60%
65%
70%
75%
80%
85%
90%
95%
100%
105%
110%
2000 2001 2002 2003 2004 2005 2006 2007 2008 2009 2010 2011 2012 2013
20
00
=10
0
Primary Intensity (Kep/€2005) Final Intensity (Koe/€2005)
0,060
0,075
0,090
0,105
0,120
0,135
2000 2001 2002 2003 2004 2005 2006 2007 2008 2009 2010 2011 2012 2013
koe/
€05
EU-28 France Germany Italy Spain UK Ireland Portugal

Energy Efficiency Trends and Policies in SPAIN 20
Figure 1.13: Trends of Final Energy Intensity at purchasing power parities
in Spain and EU, 2000-2013
Note: Non-energy uses excluded
Source: ODYSSEE/IDAE
The aforementioned structural effect is made evident from the evolution benchmarking of the real final energy intensity and the corresponding one to the constant structure of year 2005, Figure 1.14. As it can be noticed, the structural effect was predominant from year 2008 while in the previous period other factors were more predominant, such as the ones linked to technological improvements and efficiency policies.
Figure 1.14: Trends of Final Energy Intensity at Constant Structure, 2000-2013
Notes: Intensities with climate correction; Non-energy uses excluded Source: IDAE/ODYSSEE
The comparison of the evolution in relative terms of final energy intensities at sectoral and global level, Figure 1.15, accounts for a differentiation of the trends followed by the final use sectors in the various analysis periods. The global intensity shows the transport sector influence, given the weight of this sector in the demand structure. To a lesser extent are affected the industry sector, with a more volatile performance from the beginning of the crisis, and the residential sector, which encompasses Spanish households, and whose energy demand shows a somewhat contention.
0,060
0,075
0,090
0,105
0,120
2000 2001 2002 2003 2004 2005 2006 2007 2008 2009 2010 2011 2012 2013
koe
/€0
5p
EU-28 France Germany Italy Spain UK Ireland Portugal
0,080
0,083
0,086
0,089
0,092
0,095
0,098
0,101
0,104
0,107
2000 2001 2002 2003 2004 2005 2006 2007 2008 2009 2010 2011 2012 2013
ko
e/€
05
Final Intensity at Constant Structure Final Intensity
Structural Effect
-0,67%
-1,09%
-0,58%
-2,25%
-1,85%
-3,18%-3,40%
-3,10%
-2,80%
-2,50%
-2,20%
-1,90%
-1,60%
-1,30%
-1,00%
-0,70%
-0,40%
-0,10%
2004-2013 2008-2013 2004-2008
An
nu
al A
vera
ge V
aria
tio
n (%
/yea
r)
Structural Effect Real Variation

Energy Efficiency Trends and Policies in SPAIN 21
Figure 1.15: Trends of Final Energy Intensity in Spain: Global and by Sectors, 2000-2013
Note: Non-energy uses excluded
Source: MINETUR/IDAE
Assessment of Energy Efficiency through ODEX
Energy intensity is usually used to value the energy efficiency trends at global and sectoral level. Nonetheless, the evolution of the final energy intensity can be due to different factors away from energy efficiency as, for example, the structural changes of economy, changes in lifestyle, etc.; these factors should be strictly separated so as to have a better understanding of the energy efficiency progress. To this end, an alternative indicator has been developed, the ODEX index, which happens to be more appropriated. This index allows a better analysis of efficiency for each sector, combining the trends of indicators for each sub-group or each final use. In compliance with this index, Figure 1.16, Spain accounts for a continuous energy efficiency progress in the analysed period 2000-2013, where all the sectors take part. In this framework stand out the transport and industry sectors, with annual average improvements of 1%. This is coherent with the contents in Figure 1.15.
Figure 1.16: Energy Efficiency Progress by Sectors in Spain
Note: The progress of the ODEX index in the household sector is underestimated because of the lack of detailed information on the energy consumption of the stock of electrical household appliances
Source: IDAE/ ODYSSEE
70%
80%
90%
100%
110%
120%
2000 2001 2002 2003 2004 2005 2006 2007 2008 2009 2010 2011 2012 2013
Bas
e 2
00
0=1
00
Final Intensity Industry Transport Services Households
0%
10%
20%
30%
40%
50%
60%
70%
80%
90%
100%
110%
FinalIntensity
Industry Transport Services Households
Bas
e 2
00
4=1
00
2004 2009 2013
80
85
90
95
100
105
2000 2001 2002 2003 2004 2005 2006 2007 2008 2009 2010 2011 2012 2013
Bas
e 2
00
0=1
00
Global ODEX Industry Transport Households

Energy Efficiency Trends and Policies in SPAIN 22
1.3. ENERGY EFFICIENCY POLICY BACKGROUND
Currently in Spain stand out two remarkable planning tools that define the priorities in energy policy matters for the 2020 horizon: the Action Plan on Energy Saving and Efficiency 2014-2020 and the Renewable Energies Plan 2011-2020. They are meant to carry out a transition towards a more sustainable energy model where autochthonous renewable energies take up greater relevance at the time of meeting a more moderate energy demand, thanks to the implementation of energy saving and efficiency policies.
In the area of renewable energies, the Renewable Energies Plan (PER) 2011-2020, approved in Cabinet Meeting Agreement of 11 November 2011, establishes the objectives complying with Directive 2009/28/EC of the European Parliament and the Council, of 23 April 2009, on the promotion of the use of energy from renewable sources. The PER 2011-2020 includes a package with over 80 measures to meet the EU requirements, reaching the national objectives by 2020 established in the Plan, and which will represent, according to the methodology of the above Directive, a renewable energy consumption rate of 20.8% on the gross final energy consumption, as well as a final consumption rate of the former of 11.3% over the transport energy consumption.
Concerning the energy efficiency area, the Action Plan on Energy Saving and Efficiency 2014-2020 means to respond to the obligation set forth by Directive 2012/27/EU of the European Parliament and of the Council, of 25 October 2012 on energy efficiency (EED), according to which all State Members of the European Union are demanded to submit national Action Plans on energy efficiency - the first of which should be by 30 April 2014 at the latest, and then, every three years.
This Action Plan makes up the first Action Plan within the framework of Directive 2012/27/EU and the third one (NEEAP3), in compliance with the provisions of article 14 of Directive 2006/32/EC on energy end-use efficiency and energy services. This Plan gives continuity to the former plans approved within the framework of the Energy Saving and Efficiency Strategy for Spain 2004-2012 (E4), as well as further Action Plan 2011-2020 (NEEAP2).
The approval of the DEE has entailed the adoption on the part of all the State Members of two energy saving and efficiency objectives: the first one, indicative and set up by each State Member, in compliance with article 3 of the said Directive, and the second, binding and calculated in compliance with its article 7.
With regards to the indicative objective and taking into account the evolution of the macroeconomic scenario, Spain has submitted to the European Commission a new energy consumption objective in 2020, equivalent to 110.9 Mtoe in terms of primary energy: this entails a reduction in consumption of primary energy of 42.8 Mtoe in the trend scenario. This consumption objective is coherent with the one set up by the EU for the 2020 horizon — 1, 474 Mtoe of primary energy.
Once included non-energy consumptions, the primary energy consumption objective for 2020 is put at 125.280 Mtoe. Table 1.1 accounts for the estimated primary energy balance until 2020. The envisaged situation highlights an increase in the contribution of renewable energies and natural gas to meet the demand, at the expense oil-derivative product consumption, essentially as a result of the foreseen cutback on petrol and fuel oil for transport.

Energy Efficiency Trends and Policies in SPAIN 23
Table 1.1: Indicative Primary Energy Consumption Objective (ktoe) By Energy Sources
2020
Coal 13,652
Oil 46,026
Natural Gas 30,276
Nuclear 15,549
Renewable Energies 20,406
Non Renewable Wastes 319
Electricity Balance (Imp.-Exp.) -946 TOTAL 125,280
TOTAL Non-energy uses excluded 119,893
Source: MINETUR
As for final energy, Table 1.2, consumption estimates point to an increase in the relevance electric power and renewable energies consumption, and to a decrease in the relevance of oil products. The total final energy for energy uses in 2020 is estimated at 80.1 Mtoe.
Table 1.2: Indicative Final Energy Consumption Objective (ktoe) By Energy Sources
2020
Coal 1,753
Oil Products 33,771
Natural Gas 15,710
Electricity 2,.928
Renewable Energies 6,977
TOTAL 80,139
Note: Non-energy uses excluded
Source: EnR/IDAE
The consumption estimates of both primary and final energy consumption by 2020 may be revised to be adapted to other macroeconomic scenarios that may be officially adopted by Spain on the occasion of the next annual report, and have to be submitted before the end of April 2015 in compliance with article 3 of Directive 2012/27/EU. As regards the second objective, article 7 of the EED compels every Member State to reach a binding saving objective of accumulated final energy for the period 2014-2020. According to this, Spain has set up a saving objective of 15,979 ktoe between 2014 and 2020, the equivalent to an annual saving objective of 571 ktoe – assuming a linear distribution all along the engagement period. The achievement of the said saving objective requires high investments of both a public and private kind in actions, basically, to renew equipment and processes in the industrial sector, heating installations and heating & cooling and lighting installations in the building sector (either residential or tertiary use) or renew the building envelope, as well as in measures to make a more efficient use of means of transport. As for the implementation of this objective, Law 18/2014, of 15 October, approving urgent measures for growth, competitiveness and efficiency, creates a national system of energy efficiency obligations as well as a national fund meant to finance energy efficiency mechanisms for economic, financial, technical assistance, training, information and other measures that help increase energy efficiency in the different sectors of final energy consumption. Moreover, the implementation of other alternative measures allowed by the Directive is envisaged:

Energy Efficiency Trends and Policies in SPAIN 24
measures of a fiscal, regulatory, training kind, as well as communication campaigns, etc.
Figure 1.17: Time Distribution of the Accumulated Final Saving Energy Objective
Source: IDAE
As regards the sectoral distribution of the final energy annual saving objective (571 ktoe/year), Figure 1.18, the industry sector stands out with 54.6% of the saving objective. The most relevant measure is the adoption of the best available technologies for equipment and processes, and to a lesser extent, the introduction of energy management systems.
Figure 1.18: Distribution of the Final Energy Saving Objective (571 ktoe/year) by Sectors.
Source: IDAE
25.3% of the saving objective will be reached thanks to measures in the transport sector, namely, measures for modal change, sustainable urban mobility actions, and workplace travel plans, followed by those promoting a more efficient use of the means of transport. Given their special features, the energy efficiency improvement measures for vehicles will be carried out through specific
571 571 571 571 571 571 571
3995
571 571 571 571 571 571
3424
571 571 571 571 571
2853
571 571 571 571
2283
571 571 571
1712
571 571
1141
571
571
0
2.000
4.000
6.000
8.000
10.000
12.000
14.000
16.000
18.000
2014 2015 2016 2017 2018 2019 2020 2014-2020
kto
e
3.9953.424
2.8532.283
1.7121.141
571
Total Accumulated Saving 2014-2020 : 15,979 ktoe
Industry54,6%
Transport25,3%
Buildings&Equipment15,3% Public Services
2,2%
Agriculture1,7%
Communication1,1%

Energy Efficiency Trends and Policies in SPAIN 25
programmes. The Building and Equipment sector account for 15.3% of the saving objective. These savings may come from the energy rehabilitation of the existing building thermal envelope; from the energy efficiency improvement of the heating thermal installations, heating & cooling and sanitary hot water, lighting, lifts and other transport systems, as well as electric installation, and from the rehabilitation of existing buildings with high energy qualification. Other measures to improve the efficiency of commercial refrigeration installations and data process centre installations are included. Last, the installation of intelligent systems and the renewal of the electric appliance stock are considered. This distribution only states the savings in the building and equipment sector, promoted by the system of energy efficiency obligations. 2.2% of the objective will be reached thanks to the measures in the Public Services sector. The most relevant measures are those linked to the renewal of street lighting and to a lesser extent, those linked to energy efficiency improvement in water treatment, supply, sewage-water treatment and desalination installations. 1.7% of the objective will be reached with measures in the Agriculture & Fishing sector, above all due to the energy efficiency improvement in farming holdings and in the use of farming machinery. Additionally stands out the “Spanish Strategy for Energy Rehabilitation in the Building Sector”, within the framework of this Action Plan in the field of building, drafted by the Ministry of Development in compliance with article 4 of the EED. It is a long-term strategy that will be updated every three years, and whose aim is to mobilise investments for renewing residential and business buildings so as to achieve better energy performance in the building stock. This Strategy delves into the reforms already started in the years 2012 and 2013, which materialized in the approval and enforcement of Law 8/2013 of 26 June, on urban rehabilitation, regeneration and renewal; and of Royal Decree 233/2013 of 5 April, approving the State Plan to promote house renting, building rehabilitation and urban regeneration and renewal for the period 2013-2016. This Strategy describes its main objectives, defines the various strategic scenarios and relates the measures that will be necessary to have them implemented, among which: those of a regulatory kind; of administrative kind; financial; information and communication ones; and last, the measures for enterprises to develop business strategies in the sector aimed at rehabilitation and energy efficiency. On the other hand, also in the building sector and in compliance with article 4 of the DEE, an energy renewal objective is introduced for 3% of the building surface of the State General Administration (AGE). To this end was made an inventory of buildings belonging to the State General Administration, the equivalent to 1,763 buildings with a surface over 11.2 million square metres, as well as the development of a Computer Platform of Energy and Heritage Management (PIGEP). In the new macroeconomic scenario, the improvement of the final intensity of the 2020 horizon is estimated as an average in the year-on-year 1.60% since 2013, calculated on the indicator including the non-energy uses. In terms of primary energy, the intensity indicator will be presumably reduced to a year-on-year 1.14% between 2013 and 2020. The improvement envisaged in the final and

Energy Efficiency Trends and Policies in SPAIN 26
primary intensity indicators guarantees savings3 equivalent to 22.5% in 2020, in terms of final energy, and to 18.6% that same year, in terms of primary energy.
Table 1.3: Final and Primary Energy Savings
2020
Final Energy Consumption Total Energy Uses (ktoe) 80,139
Final Energy Intensity (ktoe/M€ 2005) 0.078
Final Energy Savings Base 2007 (ktoe) 23,306
(%) 22.5%
Primary Energy Consumption Total Energy Uses (ktoe) 119,893
Primary Energy Intensity (ktoe/M€ 2005) 0.116
Primary Energy Savings Base 2007 (ktoe) 27,315
(%) 18.6%
Source: IDAE
All the above is completed with the Planning in the Electricity and Gas Sectors 2008-2016, whose main aim is to guarantee the security and quality of energy supply in the mid and long term. Currently a new planning process for the electricity transport networks is open thanks to Order IET/2598/2012, of 29 de November, which opens up a procedure to carry out development proposals for the transport network for electric energy. The new planning will finally span the period 2015-2020.
3 Savings are calculated as a product of the difference between the value of the indicator in the corresponding year and the value of the indicator in the year 2007; and the said difference is to be multiplied by the Gross Domestic Product of the year for which savings are to be determined, stated in constant Euros of year 2005.

Energy Efficiency Trends and Policies in SPAIN 27
2. ENERGY EFFICIENCY IN BUILDINGS
2.1. ENERGY EFFICIENCY TRENDS
The building sector in Spain is attaining more and more weight in the global energy demand, Figure 2.1, as opposed to the backward movement noticed in the industry sector. In the last years, energy consumption in buildings has maintained a downward pattern, as it happens in neighbouring countries. In 2013 energy consumption in buildings accounted for 30.4% of total final energy consumption, and 64.6% of electricity consumption. All the above contrasts with the representativeness of the whole of the EU-28 buildings in total (40.3%) and electricity consumption (59.8%), with a remarkable greater weight of the electricity consumption in Spain.
Figure 2.1: Share of Buildings in Final Energy Consumption in Spain, 2000-2013
Source :IDAE
The average consumption per capita in buildings in Spain is 0.54 toe, approximately 60% of the average consumption of the EU countries. Part of this difference is explained by Spain’s more favourable climate conditions. According to the information available from the Ministry of Development, the estimated total surface of buildings exceeds 5,000 million m2. Approximately 62% of the entire built-up surface corresponds to buildings in the residential sector. In like manner and in accordance with the information from the housing census published by the Spanish National Institute for Statistics (INE), about 60% of the residential buildings are block-building dwellings. There has been a continuous decrease in the new building pace in the last years, particularly sharp in the cases of the residential sector buildings. This has a bearing on the energy demand of the whole of the buildings by also limiting the favourable impact associated with the new building regulation. Considering the useful floor area of both kinds of buildings, a new average consumption per m2 of 142 kWh was attained in 2013, 32% less than the average consumption of buildings in the EU-28.
0
5.000
10.000
15.000
20.000
25.000
30.000
0%
5%
10%
15%
20%
25%
30%
35%
2000 2001 2002 2003 2004 2005 2006 2007 2008 2009 2010 2011 2012 2013
Co
nsu
mp
tio
n (k
toe
)
% O
vera
ll C
on
sum
pti
on
Services Households % Industry Consumption % Buildings Consumption
Energy Efficiency Trends and Policies in SPAIN 28
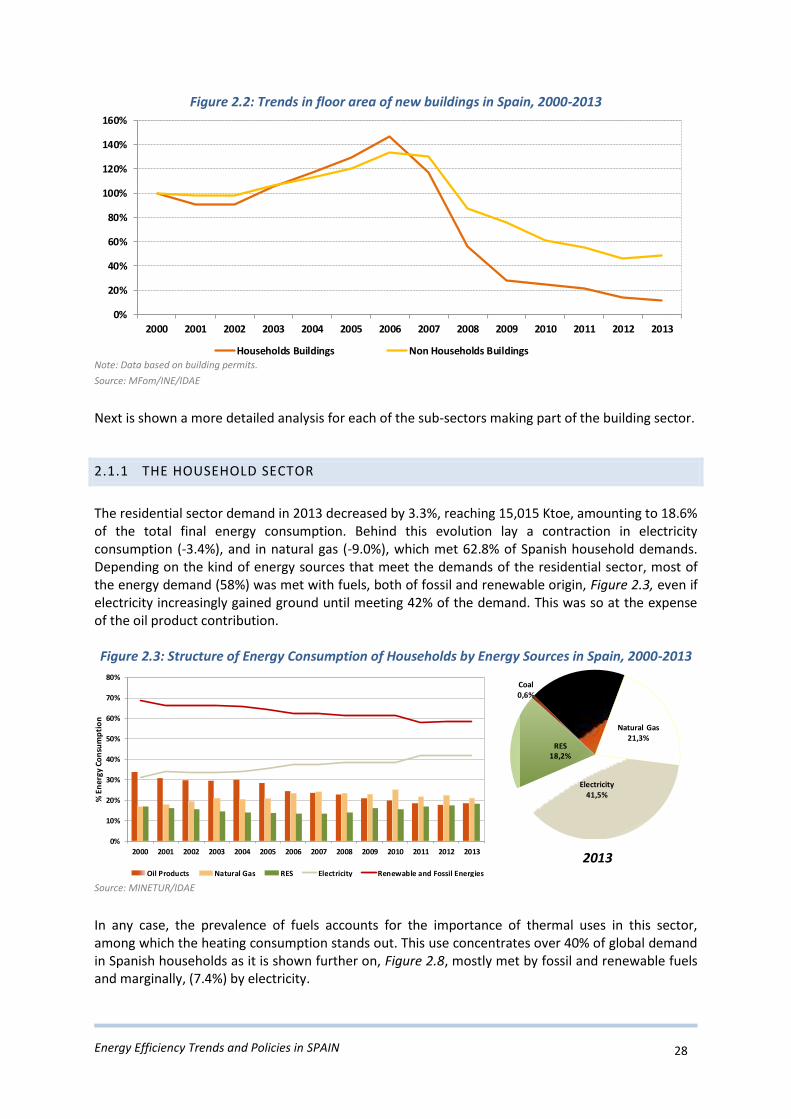
Figure 2.2: Trends in floor area of new buildings in Spain, 2000-2013
Note: Data based on building permits. Source: MFom/INE/IDAE
Next is shown a more detailed analysis for each of the sub-sectors making part of the building sector.
2.1.1 THE HOUSEHOLD SECTOR
The residential sector demand in 2013 decreased by 3.3%, reaching 15,015 Ktoe, amounting to 18.6% of the total final energy consumption. Behind this evolution lay a contraction in electricity consumption (-3.4%), and in natural gas (-9.0%), which met 62.8% of Spanish household demands. Depending on the kind of energy sources that meet the demands of the residential sector, most of the energy demand (58%) was met with fuels, both of fossil and renewable origin, Figure 2.3, even if electricity increasingly gained ground until meeting 42% of the demand. This was so at the expense of the oil product contribution. Figure 2.3: Structure of Energy Consumption of Households by Energy Sources in Spain, 2000-2013
2013
Source: MINETUR/IDAE
In any case, the prevalence of fuels accounts for the importance of thermal uses in this sector, among which the heating consumption stands out. This use concentrates over 40% of global demand in Spanish households as it is shown further on, Figure 2.8, mostly met by fossil and renewable fuels and marginally, (7.4%) by electricity.
0%
20%
40%
60%
80%
100%
120%
140%
160%
2000 2001 2002 2003 2004 2005 2006 2007 2008 2009 2010 2011 2012 2013
Households Buildings Non Households Buildings
0%
10%
20%
30%
40%
50%
60%
70%
80%
2000 2001 2002 2003 2004 2005 2006 2007 2008 2009 2010 2011 2012 2013
% E
ne
rgy
Co
nsu
mp
tio
n
Oil Products Natural Gas RES Electricity Renewable and Fossil Energies
Coal
Oil Products
Natural Gas
Electricity
RES
Carbón
Gas Natural
Coal0,6%
Oil Products18,4%
Natural Gas21,3%
Electricity41,5%
RES18,2%
Energy Efficiency Trends and Policies in SPAIN 29
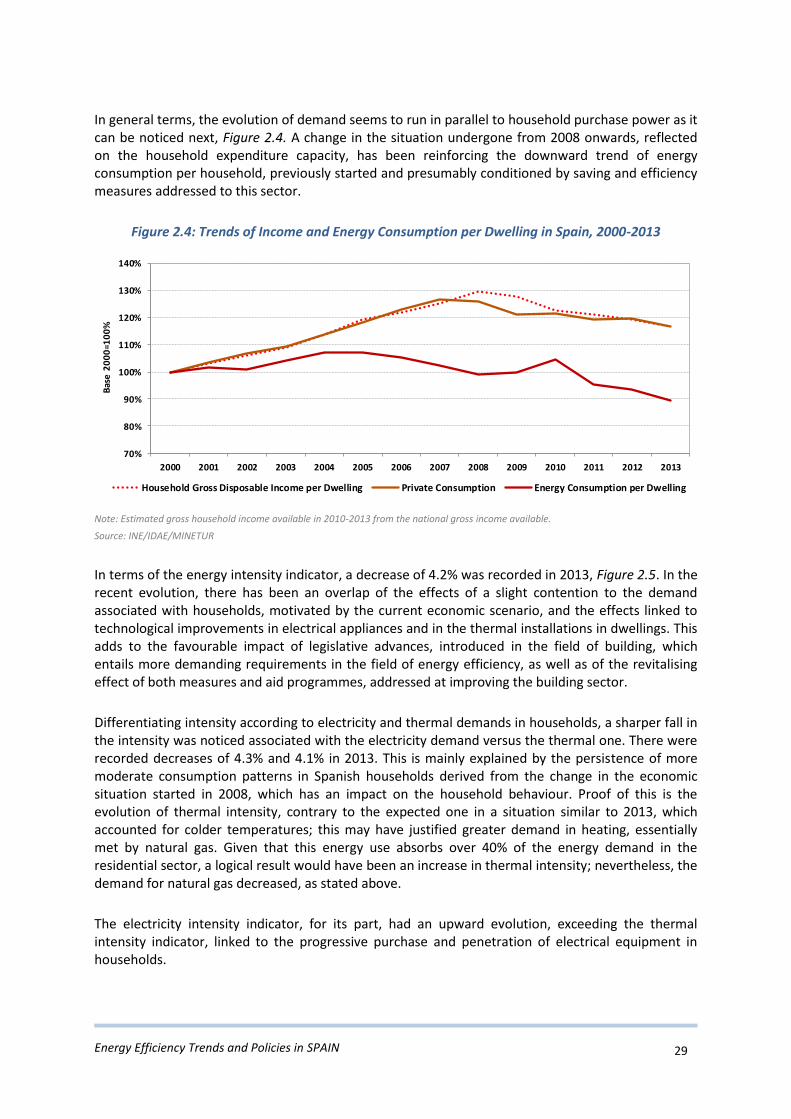
In general terms, the evolution of demand seems to run in parallel to household purchase power as it can be noticed next, Figure 2.4. A change in the situation undergone from 2008 onwards, reflected on the household expenditure capacity, has been reinforcing the downward trend of energy consumption per household, previously started and presumably conditioned by saving and efficiency measures addressed to this sector.
Figure 2.4: Trends of Income and Energy Consumption per Dwelling in Spain, 2000-2013
Note: Estimated gross household income available in 2010-2013 from the national gross income available.
Source: INE/IDAE/MINETUR
In terms of the energy intensity indicator, a decrease of 4.2% was recorded in 2013, Figure 2.5. In the recent evolution, there has been an overlap of the effects of a slight contention to the demand associated with households, motivated by the current economic scenario, and the effects linked to technological improvements in electrical appliances and in the thermal installations in dwellings. This adds to the favourable impact of legislative advances, introduced in the field of building, which entails more demanding requirements in the field of energy efficiency, as well as of the revitalising effect of both measures and aid programmes, addressed at improving the building sector.
Differentiating intensity according to electricity and thermal demands in households, a sharper fall in the intensity was noticed associated with the electricity demand versus the thermal one. There were recorded decreases of 4.3% and 4.1% in 2013. This is mainly explained by the persistence of more moderate consumption patterns in Spanish households derived from the change in the economic situation started in 2008, which has an impact on the household behaviour. Proof of this is the evolution of thermal intensity, contrary to the expected one in a situation similar to 2013, which accounted for colder temperatures; this may have justified greater demand in heating, essentially met by natural gas. Given that this energy use absorbs over 40% of the energy demand in the residential sector, a logical result would have been an increase in thermal intensity; nevertheless, the demand for natural gas decreased, as stated above.
The electricity intensity indicator, for its part, had an upward evolution, exceeding the thermal intensity indicator, linked to the progressive purchase and penetration of electrical equipment in households.
70%
80%
90%
100%
110%
120%
130%
140%
2000 2001 2002 2003 2004 2005 2006 2007 2008 2009 2010 2011 2012 2013
Bas
e 2
00
0=1
00
%
Household Gross Disposable Income per Dwelling Private Consumption Energy Consumption per Dwelling

Energy Efficiency Trends and Policies in SPAIN 30
Figure 2.5: Main Indicators of the Household Sector in Spain, 2000-2013
Source: INE/MINETUR/IDAE
Nevertheless, from the year 2004 onwards a change in the behaviour trend for both indicators is noticed, even recording an almost sustained decrease. In like manner, a difference in the evolution pace for both indicators can be observed, as well as greater lessening in the case of electricity intensity. This seems to be in line with some sort of saturation of the electrical appliance equipment in households, as well as with the efficiency improvements associated with the electrical appliance equipment and lighting. As regards the latter, it is important to stand out the comparison at European level of the average electricity consumption per household, linked to the penetration of electrical appliances in Spanish households. A progressive convergence between Spain and the EU average can be noticed, Figure 2.6; therefore, all along the last two decades, average electricity consumption in Spanish households increased in progressive convergence with the average consumption of the EU until reaching the same consumption level in 2005. Further on, some stabilization with a downward trend was recorded, as it happened with the EU countries. This can be partially explained in both cases by much more conservative behavior patterns brought about by the crisis. This upturn noticed in 2011 in the relation between the average Spanish electricity consumption and the European one seems to respond to the difference in the rate of fall of both, somehow more dramatic in the whole of EU households.
Figure 2.6: Trends in Electricity Consumption per Dwelling in Spain and EU, 2000-2013
Source: IDAE/MINETUR/EnR
70
80
90
100
110
120
130
140
150
2000 2001 2002 2003 2004 2005 2006 2007 2008 2009 2010 2011 2012 2013
Ba
se 2
00
0=
10
0
Total Intensity (toe/dw) Thermal Intensity (toe/dw) Electricity Intensity (kWh/dw) Nº Dwellings Degree-Day
75%
80%
85%
90%
95%
100%
105%
110%
115%
1.500
2.000
2.500
3.000
3.500
4.000
4.500
2000 2001 2002 2003 2004 2005 2006 2007 2008 2009 2010 2011 2012 2013
% S
pai
n/E
U-2
8
EU-28 Spain %Spain/EU-28

Energy Efficiency Trends and Policies in SPAIN 31
As mentioned earlier, the drop in consumption can be partly explained as a saturation of the level of electrical household appliances of Spanish households; this would add up to a renewal of the existing equipment, both of electrical appliances and lighting with more efficient ones. This leads to a reduction in the electricity consumption associated with lighting and the electrical appliances stock as a result of a technological improvement. Proof of it are the recorded trends in the sales of new electrical appliances, with a growing quota for more efficient equipment, more and more present in Spanish households as it can be gathered from the information available in various market surveys.
Finally, the evolution of the energy intensity in the residential sector at EU-28 country level must be highlighted, considering to this end a climate correction with a view to adjusting the variations impact between winters. Benchmarking, Figure 2.7, enables to notice a difference of around 40% between the national indicator and its European counterpart. In like manner, the evolution of this indicator in countries like Italy, Greece and Portugal seems to confirm the climate influence.
Figure 2.7: Trends of Energy Intensity in the Household Sector in Spain and EU, 2000-2013
Note: Intensity with climate correction
Source: EnR/IDAE/INE
The milder climatology of South-Eastern countries accounts for a lower use of heating, whose demand ranges from 43% in Spain to 67% in the whole of the EU-28, Figure 2.8. Consequently, the weight difference in terms of heating largely determines energy intensity in the residential sector. As for the rest of household uses, the following position is held by the electrical household appliances, with approximately one fourth of total consumption and fridges at the forefront of consuming equipment: it accounts for 31% of electrical appliances consumption and 19% of total electricity consumption. The last position is occupied by air-conditioning systems with 1% of total consumption, and even if as this is a seasonal service, its demand concentrates on a short period of time and can involve demand peaks difficult to manage.
0,65
0,80
0,95
1,10
1,25
1,40
1,55
1,70
1,85
2,00
2,15
2000 2001 2002 2003 2004 2005 2006 2007 2008 2009 2010 2011 2012 2013
toe
/dw
UE-28 France Germany Italy Spain UK Greece Ireland Portugal
Energy Efficiency Trends and Policies in SPAIN 32
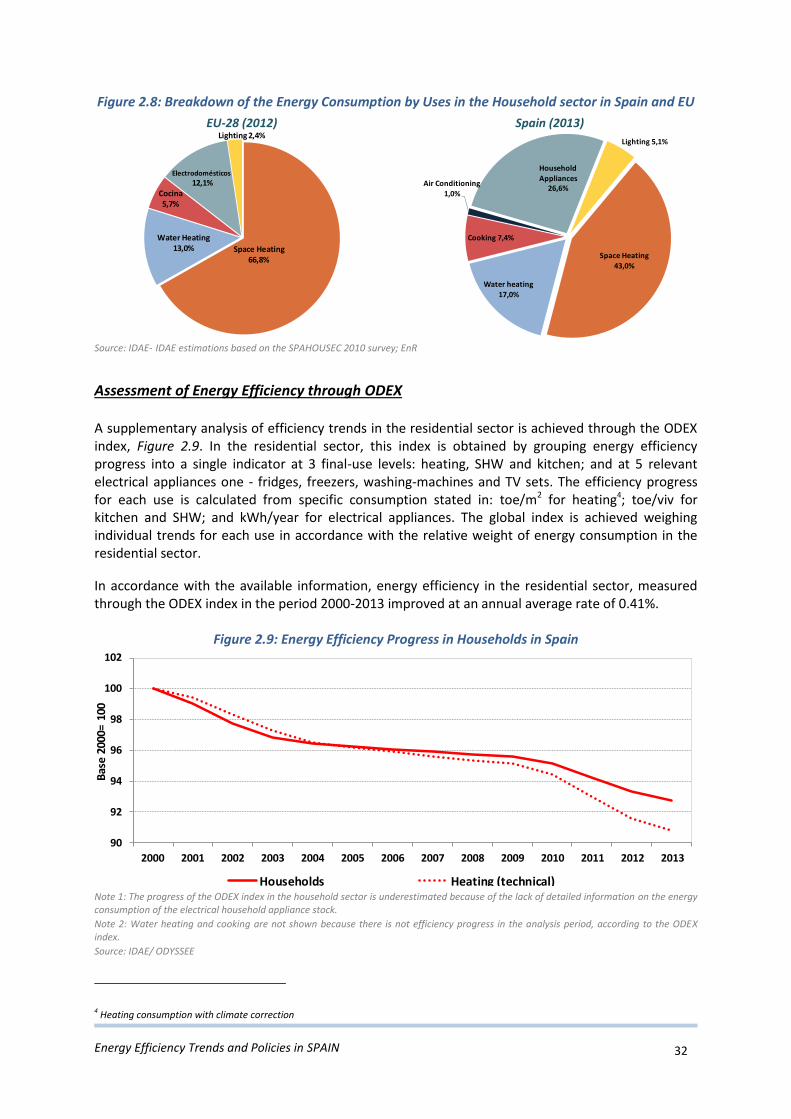
Figure 2.8: Breakdown of the Energy Consumption by Uses in the Household sector in Spain and EU
EU-28 (2012) Spain (2013)
Source: IDAE- IDAE estimations based on the SPAHOUSEC 2010 survey; EnR
Assessment of Energy Efficiency through ODEX
A supplementary analysis of efficiency trends in the residential sector is achieved through the ODEX index, Figure 2.9. In the residential sector, this index is obtained by grouping energy efficiency progress into a single indicator at 3 final-use levels: heating, SHW and kitchen; and at 5 relevant electrical appliances one - fridges, freezers, washing-machines and TV sets. The efficiency progress for each use is calculated from specific consumption stated in: toe/m2 for heating4; toe/viv for kitchen and SHW; and kWh/year for electrical appliances. The global index is achieved weighing individual trends for each use in accordance with the relative weight of energy consumption in the residential sector.
In accordance with the available information, energy efficiency in the residential sector, measured through the ODEX index in the period 2000-2013 improved at an annual average rate of 0.41%.
Figure 2.9: Energy Efficiency Progress in Households in Spain
Note 1: The progress of the ODEX index in the household sector is underestimated because of the lack of detailed information on the energy consumption of the electrical household appliance stock.
Note 2: Water heating and cooking are not shown because there is not efficiency progress in the analysis period, according to the ODEX index.
Source: IDAE/ ODYSSEE
4 Heating consumption with climate correction
Space Heating 66,8%
Water Heating 13,0%
Cocina 5,7%
Electrodomésticos
12,1%
Lighting 2,4%
Space Heating
43,0%
Water heating 17,0%
Cooking 7,4%
Air Conditioning 1,0%
Household Appliances
26,6%
Lighting 5,1%
90
92
94
96
98
100
102
2000 2001 2002 2003 2004 2005 2006 2007 2008 2009 2010 2011 2012 2013
Bas
e 2
000=
100
Households Heating (technical)

Energy Efficiency Trends and Policies in SPAIN 33
This improvement moderated in the period after 2008, coinciding with the beginning of the crisis, and which limited the favourable impact associated with energy efficiency standards in terms of equipment and building. This issue involved a slowing-down in the pace of the existing dwelling rehabilitation and of penetration of the new ones, Figure 2.2, as well as of more efficient equipment, not only in Spain but also in surrounding countries. Therefore, a new contrast becomes evident between the former average improvement prior to the crisis of 0.49%/year, and the further improvement of 0.28%/year. Most of these improvements go for heating, whose relevance in consumption largely determines the global progress of efficiency in the sector. In the former order of magnitude, a progress on energy efficiency is presumed within the electrical appliances stock, given the market trends and the purchase patterns of household equipment. Nevertheless, the lack of information available in this sense limits the assessment of this effect through the ODEX index.
Assessment of the Decomposition of the Energy Consumption Variation
An additional energy analysis in the residential sector is achieved through the decomposition of the decomposition of the energy consumption variation in the various factors or sectors, Figure 2.10. This decomposition is made possible thanks to a specific tool designed within the ODYSSEE-MURE project, which takes into account various variables of energy, technical, social & economic, and behavioural kind. The factors considered are as follows:
A climate difference effect.
An effect associated with the change in the number of occupied dwellings.
A domestic equipment effect (electrical appliances, heating, etc.).
An effect associated with the size of dwellings.
Energy savings, measured from the ODEX index.
Other effects mainly linked to behaviour. In the period 2000-2013, the energy consumption of the residential sector in Spain increased by 3 Mtoe, mainly as a result of the effect derived from the increase in the number of dwellings occupied due to the population growth.
Figure 2.10: Decomposition of Household’s Energy Consumption Variation
Source: IDAE/ ODYSSEE
-3
-2
-1
0
1
2
3
4
5
6
2000-2013 2000-2008 2008-2013
Mto
e
Variation of Consumption Climate More Dwellings Larger Homes Energy Savings Other

Energy Efficiency Trends and Policies in SPAIN 34
To a lesser extent, other additional effects that contributed to the increase in consumption were associated with an increase in comfort. Some of the more relevant effects to be quoted are the growth in the household equipment rate as well as a displacement towards larger surface dwellings. This was partially compensated with the combined effect associated with technological improvements in dwellings and equipment, and in more conservative behavioural patterns which jointly led to a decrease in consumption of 2.6 Mtoe in the stated period. The effect linked to behaviour was enhanced in the period 2008-2013, possibly linked to the evolution of the economic crisis, and contributing to a decrease of 2.6 Mtoe. This fall and the savings induced by technological measures and the rest of the effects entail a reduction in total consumption of 0.6 Mtoe. In this last period, the remarkable issue is the fall in the share of effects linked to comfort and in technological improvements to consumption net balance. This responded to a change in the economic situation which led to an expenditure contention and with it, to a decrease in comfort levels, as well as to lower investment in efficient equipment and to the reform of the existing dwellings, subsequently penalising potential improvements in efficiency. This fact, as stated above, was shared by Spain’s neighbouring countries.
2.1.2 THE SERVICES SECTOR
The services sector consumed 9,564 ktoe in 2013, 4.8% less than the previous year. For its part, the Gross Value Added (GVA) of the whole of the services sector remained virtually even, with a slight decrease of 1.0%. The evolution in the trade (-1.3%) and of offices5 sectors (-0.8%), made a particular contribution to productivity, which amounted to 74.9%. In a nutshell, a fall in consumption at a higher rate than the GVA’s explains the improvement of the energy intensity indicator by 3.8% in 2013, Figure 2.11.
Figure 2.11: Main Indicators in the Services Sector in Spain, 2000-2013
Source: INE/MINETUR/IDAE
5 State & private
80
90
100
110
120
130
140
150
160
2000 2001 2002 2003 2004 2005 2006 2007 2008 2009 2010 2011 2012 2013
Ba
se 2
00
0 =
10
0
Added Value Energy Consumption Final Intensity

Energy Efficiency Trends and Policies in SPAIN 35
A comparative analysis of the evolution of this indicator at EU-28 level enables to observe a placement of the indicator below the European average, Figure 2.12., even if the gap between both shortened in the last years. This responded to the progressive growth of intensity in the sector in Spain; however, a trend change was recorded in the last two years. In general, the evolution of intensity largely responds to the structure of demand, with electricity demand highly represented in the sector’s coverage needs, amounting to 69.7% of the total demand in 2013, that is, some twenty percentage points above the European average, Figure 2.13.
Figure 2.12: Trends of Energy Intensity of the Services Sector in Spain and EU, 2000-2013
Source: EnR/IDAE
Considering the sector’s composition, the offices and trade sectors stand out with over two thirds of electricity demand and the whole of the services sector, as well as a joint contribution of 74.9% to the GVA of the services sector. This contribution has a remarkable influence on the evolution of both the global and electricity intensity in this sector.
Figure 2.13: Relevance and Structure of the Electricity Consumption in the Services Sector
in Spain and EU
Share of Electricity Consumption Breakdown by Sub-sector
2013 Source: EnR/IDAE
The reason for the high electricity consumption in Spain is linked to energy-use topology as well as to the sectoral composition of the services sector. Precisely, the energy needs associated with lighting, heating & cooling, office equipment, information technologies and communication (ICT), etc. in the offices & trade sectors largely account for the electricity demand associated with this sector. By
0,009
0,011
0,013
0,015
0,017
0,019
0,021
0,023
0,025
0,027
2000 2001 2002 2003 2004 2005 2006 2007 2008 2009 2010 2011 2012 2013
koe
/€0
5
EU-28 France Germany Italy Spain UK Belgium Ireland
2012
63,2%68,7%
42,0%47,1%
0%
10%
20%
30%
40%
50%
60%
70%
80%
2000 2012
Spain EU-28
Health5,7%
Education4,2%
Wholesale&
Retail Trade30,9%
Offices
39,1%
Hostelería&
Restauración 7,8%
Other Services
13,9%

Energy Efficiency Trends and Policies in SPAIN 36
contrast, the lower electricity consumption in Central and Northern European countries is partially due to the coverage of their energy demands thanks to cogeneration plants and district heating. Considering the recent evolution of the various branches in the services sector, Figure 2.14, it can be concluded that trade and offices make up the branches that most decisively influence the evolution of the sector’s global intensity, given their heavier relative weight in consumption and GVA. These two branches recorded a decrease in their intensities in 2013 of 7.5% and 0.9% respectively, while the rest of the branches reduced their intensities a little over 12%. Therefore it can be concluded that the intensity of the services sector as a whole (-3.8%) is then more determined by the two branches formerly referred to.
Figure 2.14: Trends of Energy Intensity in the Services Sector by sub sectors in Spain, 2000-2013
Source: MINETUR/IDAE/INE
A different case is the one of electricity intensity. This indicator, Figure 2.15, shows an opposite behaviour to the global indicator’s, with a progressive upward intensity in the analysed period and sharper than the one recorded in the global indicator. This is due to a growing electricity demand even if in the last three years, it has accounted for a trend change possibly associated with the electricity price rise effect which has been taking place since 2008.
Figure 2.15: Trends of Electricity Intensity of the Services Sector in Spain and EU, 2000-2013
Source: EnR/IDAE
In general and in opposition to the global intensity indicator, this latter indicator accounts for a position above the European counterpart indicator, even if gaps have been reducing in the last years.
90%
95%
100%
105%
110%
115%
45%
60%
75%
90%
105%
120%
135%
150%
165%
180%
2000 2001 2002 2003 2004 2005 2006 2007 2008 2009 2010 2011 2012 2013
Tota
l Ser
vice
s
Bas
e 20
00=1
00
Hotels&Restaurants Wholesale&Retail Trade Offices Education Health Total Services
55
70
85
100
115
130
145
160
175
2000 2001 2002 2003 2004 2005 2006 2007 2008 2009 2010 2011 2012 2013
kWh
/k€0
5
EU-28 France Germany Italy Spain UK Ireland Portugal Belgium
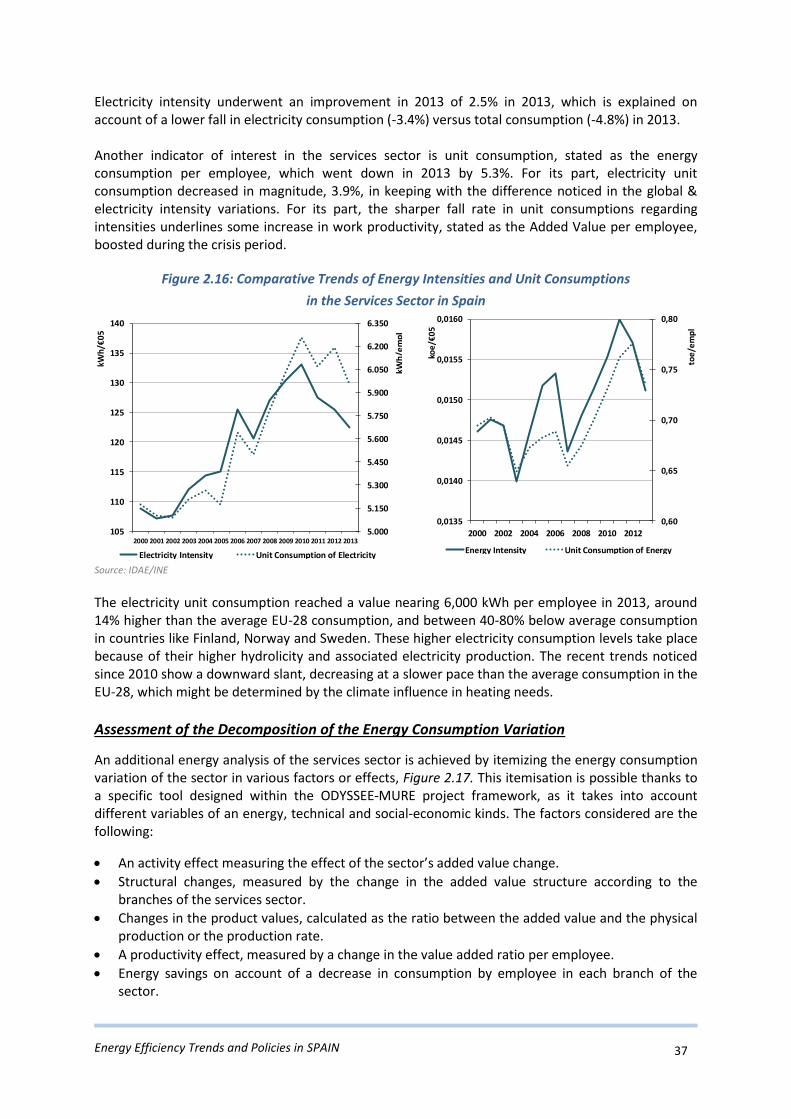
Energy Efficiency Trends and Policies in SPAIN 37
Electricity intensity underwent an improvement in 2013 of 2.5% in 2013, which is explained on account of a lower fall in electricity consumption (-3.4%) versus total consumption (-4.8%) in 2013. Another indicator of interest in the services sector is unit consumption, stated as the energy consumption per employee, which went down in 2013 by 5.3%. For its part, electricity unit consumption decreased in magnitude, 3.9%, in keeping with the difference noticed in the global & electricity intensity variations. For its part, the sharper fall rate in unit consumptions regarding intensities underlines some increase in work productivity, stated as the Added Value per employee, boosted during the crisis period.
Figure 2.16: Comparative Trends of Energy Intensities and Unit Consumptions
in the Services Sector in Spain
Source: IDAE/INE
The electricity unit consumption reached a value nearing 6,000 kWh per employee in 2013, around 14% higher than the average EU-28 consumption, and between 40-80% below average consumption in countries like Finland, Norway and Sweden. These higher electricity consumption levels take place because of their higher hydrolicity and associated electricity production. The recent trends noticed since 2010 show a downward slant, decreasing at a slower pace than the average consumption in the EU-28, which might be determined by the climate influence in heating needs.
Assessment of the Decomposition of the Energy Consumption Variation
An additional energy analysis of the services sector is achieved by itemizing the energy consumption variation of the sector in various factors or effects, Figure 2.17. This itemisation is possible thanks to a specific tool designed within the ODYSSEE-MURE project framework, as it takes into account different variables of an energy, technical and social-economic kinds. The factors considered are the following:
An activity effect measuring the effect of the sector’s added value change.
Structural changes, measured by the change in the added value structure according to the branches of the services sector.
Changes in the product values, calculated as the ratio between the added value and the physical production or the production rate.
A productivity effect, measured by a change in the value added ratio per employee.
Energy savings on account of a decrease in consumption by employee in each branch of the sector.
5.000
5.150
5.300
5.450
5.600
5.750
5.900
6.050
6.200
6.350
105
110
115
120
125
130
135
140
2000 2001 2002 2003 2004 2005 2006 2007 2008 2009 2010 2011 2012 2013
kWh
/em
pl
kWh
/€0
5
Electricity Intensity Unit Consumption of Electricity
0,60
0,65
0,70
0,75
0,80
0,0135
0,0140
0,0145
0,0150
0,0155
0,0160
2000 2002 2004 2006 2008 2010 2012
toe
/em
pl
koe
/€0
5
Energy Intensity Unit Consumption of Energy

Energy Efficiency Trends and Policies in SPAIN 38
Energy consumption in the services sector in Spain in the period 2000-2013 increased by 2.9 Mtoe as a result of the effect associated with the activity, partially compensated by the contributions linked to improvements in technology and productivity. Here is a differentiated analysis by periods. Later on, there were more moderate consumption patterns, especially at the end of the period 2008-2013 because of a lower activity under the impact of the crisis. This issue involved a penalisation in energy saving brought about by greater inefficiency in the energy exploitation of buildings in the services sector. On the other hand, everything was finally compensated somehow by a decrease in consumption associated with an improvement of productivity in the last years, as stated earlier.
Figure 2.17: Itemization of Services’ Energy Consumption Variation
Source: IDAE/ ODYSSEE
2.2. ENERGY EFFICIENCY POLICIES
In the last years, the most remarkable efficiency actions within the building sector have been those undertaken under the Action Plans of Energy Saving and Efficiency Strategy (E4). These measures have been essentially addressed to improve energy efficiency in buildings in general. Moreover, there has been an intense activity at legislative level, which led to the proliferation of a large number of regulatory provisions, linked to the transposition of Directive 2002/91/EC on energy efficiency in buildings, currently repealed by Directive 2010/31/EU of 19 May 2010. There have also been a large number of actions meant to boost the energy service market in the building sector, particularly the public ones, which were accompanied by an adaptation of the necessary legal frame to enhance this business model. At present all the promotion policies on energy efficiency have this kind of energy services contract as a reference, as way to achieve energy savings. More recently implemented actions follow the patterns stated by the EC guidelines to be applied in this sector, particularly Directive 2012/27/EU of 25 October 2012 on energy efficiency, and Directive 2010/31/EU of 19 May 2010, on the energy efficiency in buildings. With regard to the Directive on energy efficiency, work is currently been done to transpose it into Spanish legal framework by adopting a series of measures, of which some of those affecting the field of building are indicated next.
-1,5
-0,5
0,5
1,5
2,5
3,5
4,5
2000-2013 2000-2008 2008-2013
Mto
e
Variation of Consumption Climate Activity Productivity Energy Savings

Energy Efficiency Trends and Policies in SPAIN 39
In furtherance of article 4, the Ministry of Development drafted the Spanish Strategy for the Energy Rehabilitation in the Building Sector within the framework of the Energy Efficiency Action Plans 2014-2020. It is a true Strategy, long-term designed, which shall be updated every three years and whose aim is to mobilise investments to renovate residential and commercial buildings to achieve energy performance in the real estate stock. This Strategy makes up an important starting point to boost energy rehabilitation in the building sector, as well as a roadmap for the various agents involved in the rehabilitation processes. Apart from this, it delves into the reforms previously started and which have involved the approval and enforcement of Law 8/2013 of 26 June, on urban rehabilitation, regeneration and renewal, and of the State Plan to promote house renting, building rehabilitation and urban regeneration and renewal, 2013-2016, approved through Royal Decree 233/2013 of 5 April. With respect to article 5 in this Directive, which underlines the exemplary role of public body buildings, Member States are compelled to draft and publish an inventory of the buildings in central6 Administrations that should include information on the surface and energy performance of each building. On the basis of this inventory 3% of their surface shall be renewed every year. All of it entails the continuation of a path beginning with the Energy Saving and Efficiency Plan in the State General Administration’s Buildings (PAEE-AGE), oriented towards saving and energy efficiency in the State General Administration buildings; the exemplary role of the Public Administration on setting a precedent with the introduction of energy efficiency criteria in the public procurement of equipment, energy management, etc. is one of its most outstanding features. In order to facilitate the said inventory, the IDAE has designed and developed an Energy and Asset Management Computing Platform (PIGEP). Around 1,746 buildings provided with heating and/or cooling systems were inventoried along 2013 & 2014, with a floor area over 500 m2, and with a total audited area nearing 11 million m2. Also the in the public sector, and in furtherance of article 6 was approved Law 15/2014 of 16 September, on the rationalization of the Public Sector, reinforcing the purchase of high-performing buildings by the Public Administrations within the State Public Sector. This obligation shall be of application to agreements resulting in the construction of a building in the cases stated by the Law of Agreements in the Public Sector where the costs of the agreements exceed the established threshold values. As for the purchase of renting of buildings of an administrative kind, the regulation sets out a minimum energy labelling available of class C for energy demand indicators for heating, cooling and non-renewable primary energy consumption. The Directive states in its article 7, section 9 that the State Members may adopt a series of measures to meet the compliance of the binding objective on energy saving as a supplement or alternative to the implementation of a system of obligations. In line with this, Spain shall make use of a series of alternative measures enforceable within the application period of the Directive, between 1 January 2014 and 31 December 2020. Some of these measures are aimed at the building sector, and the most outstanding ones are the Aids Program for Energy Rehabilitation in Buildings in Household and Hotel Sectors (PAREER-CRECE), and the Plan for Promoting Energy Rehabilitation of Hotel Sector (PIMA SOL).
6 Before 31/12/2013 for floor areas over 500 m2, and for 250 m2 from 9/7/2015

Energy Efficiency Trends and Policies in SPAIN 40
The PAREER Programme, implemented by the Ministry of Industry, Energy & Tourism (MINETUR) through the IDAE, and approved in September 2013 with an initial budget of M€ 125 means to stimulate the implementation of reform actions to favour energy saving, the improvement of energy efficiency and the use of renewable energies in the existing buildings, regardless of their use and of the legal nature of their titleholders.
This Programme aims to contribute to the achievement the objectives set out in Directive 2012/27/EU and in the Action Plan 2014-2020. The requirements to obtain these aids are that actions should raise the energy labelling of the building to achieve an “A” or “B” energy class on the CO2 scale or else, increase the energy labelling by two letters from the start. The budget was extended by M€ 75 at the beginning of 2015, to be called from then on PAREER-CRECE Programme, and allocated with a total accumulated budget of M€ 200. The PIMA SOL Plan, approved in August 2013 and promoted by the Ministry of Agriculture, Food & the Environment (MAGRAMA) is meant to finance the energy rehabilitation of hotels. To this end, it has been allocated with M€ 5.21. The rehabilitation projects have to attain a minimum energy improvement to be translated, at least, into two upper letters on their energy labelling or else, reach letter B. Another measure of an economic kind to improve the energy efficiency of buildings is the State Plan to promote house rental, building rehabilitation and urban regeneration and renewal, 2013-2016. Some of the objectives of this plan are the energy rehabilitation of house buildings. It also includes several programmes, the most remarkable of which is the programme to stimulate building rehabilitation, oriented towards the improvement of energy efficiency. A necessary requirement to achieve these aids is that the actions considered should lead to a reduction of the annual heating & cooling energy efficiency of the building of at least 30% in terms of energy rating prior to undertaking those actions. As for the Directive on the energy efficiency of buildings, legislative advances have been taking place to be transposed into a series of regulatory provisions which introduce higher demand levels in the Technical Building Code (TBC), the Regulations on Building Heating Installations (RITE) and the energy certification of buildings. The TBC has been updated with Order FOM/1635/2013 of 10 September, and so have been the demand levels required on energy efficiency stated in the Basic Energy Documents (DB-HE). This is to be obligatorily applied to new construction buildings, the enlargement and rehabilitation of the existing ones, for which a building permit should be requested from March 2014. The update of these DB-HE Documents makes up the first approach towards the objective set up by Directive 2010/31/EU to achieve almost-zero energy consumption buildings. The RITE has been updated with Royal Decree 238/2013, of 5 de April, modifying various articles and technical instructions. It enables to regulate the minimum requirements on the performance of thermal heating, cooling, ventilation and SHW production installations and their periodic inspection, as well as the design and gauging, assembly and maintenance. The greater demands are expressed in terms of greater performance of thermal installations, better insulation of equipment and thermal fluid piping, the use of the renewable energies available and of energy recovery systems, as well as the inclusion of obligatory metering consumption systems in collective installations. The basic procedure for the energy efficiency certification of buildings, approved through Royal Decree 235/2013 of 5 April, sets up the obligation to have at the disposal of either building buyers or

Energy Efficiency Trends and Policies in SPAIN 41
users an energy efficiency certificate that has to include objective information on the building energy efficiency as well as reference values as minimum energy efficiency requirements. It also develops the basic procedure that the calculation methodology of energy efficiency rating has to meet. From the enforcement of this royal decree until de end of 2014 there have been over one million efficiency certificates.
With regards to Directive 2009/28/EC of 23 April 2009 on the promotion of the use of energy from renewable sources, and apart from the provisions envisaged in former regulatory provisions, there are other actions aimed at enhancing the use of renewable energies in buildings, some of which are the Biomcasa, Geotcasa, Solcasa y GIT (Large Thermal Installations) programmes.
These programmes, managed by the IDAE, make up pilot experiences boosting a quality offer to supply hot water, and heating & cooling in buildings from different technologies based on renewable energies through ESCOs.
2.2.1 THE HOUSEHOLD SECTOR
Along with the above measures, aimed at the buildings in the sector in the last years, the Renove Plan for electrical appliances was successfully developed with a view to improving energy efficiency in domestic equipment within the E4 Action Plan. Currently, Plans of this kind remain in different Regional Governments as part of their energy policies. Also in relation with equipment, the provisions of the Directives on Ecodesign and Labelling are applied, once transposed into the Spanish legal system through Royal Decree 187/2011 of 18 February, and through Royal Decree 1390/2011, of 14 October, respectively.
2.2.2 THE SERVICES SECTOR
As well as other common measures in the residential sector like those devised for buildings and equipment, other specific actions are envisaged in this sector, precisely, in the field on public services. This is the case of several measures aimed at purchasing efficient equipment by public bodies, as well as at the improvement of final-use efficiency, essentially as regards public lighting and water treatment. As for equipment at the level of Regional Governments and the Central Administration, there are a series of mechanisms to purchase efficient products having their referent in the Green Public Procurement Plan of the State General Administration, approved through Order PRE/116/2008 of 21 January. On the other hand, this was endorsed with the approval of Law 15/2014, on the rationalization of the Public Sector, which compels the Public Administrations belonging to the State Public Sector to purchase high-performing products (office equipment, tyres, etc.). Such requirement is extended to the awarding of contracts to service providers. In terms of public lighting, there has been a significant progress as a result of technological improvements and of legislative advances like the publication of the Regulations on energy efficiency in street lighting installations, as approved by Royal Decree of 14 November. To this end, the IDAE has taken into account the size of the national street lighting stock in Spanish municipalities, put at 8

Energy Efficiency Trends and Policies in SPAIN 42
million. According to this, a considerable electricity saving potential linked to the renewal of the lighting fixtures is envisaged, ranging between 60% and 80%. This enables that measures of the kind may receive a growing boost on the part of the Public Administration. A new aid programme to renovate municipal street lighting installations has been recently approved within Action Plan 2014-2020. This programme relies on an initial budget of M€ 36, coming from the National Fund of Energy Efficiency. An allowable requisite to be eligible for the aids is that the energy rating of the reformed installation should be A or B.
Patterns and Dynamics of Energy Efficiency Measure
The analysis offered next on the evolution of energy efficiency measures implemented in the building sector is based on the use of “spider graphs”. Graphs of the kind show the evolution of the measures all along the various time periods, categorized according to the following typology:
Coop: Co-operative Measures
Cros: Cross-cutting with sector-specific characteristics
Fina: Financial
Fisc: Fiscal/Tariffs
Info: Information/Education/Training
Le/I: Legislative/Informative
Le/N: Legislative/Normative
The charts represent both axes and categories. The distribution of the measures on each axis is in line with their categorisation which, eventually, may reach a multidimensional approach. Therefore, the number stated in the legend does not have to correspond with the total number of real measures as it considers all the kinds of measures in their various dimensions. Nonetheless, the important thing is to stand out the trends according to types, in line with the evolution shown on the various axes for each of the stated periods. This goes along with a comparison with the typological trends of the efficiency measures adopted in the whole of the EU countries, as well as the implemented ones at central level from the European Commission. In terms of the residential sector, the actions in Spain envisaged for the efficiency of this sector are quite diversified, with a predominance of those of a financial, informative and legislative kind. Legislative activity has been remarkable in the last years, mainly associated with efficiency requirements and the ecological design applicable to buildings, and to a lesser extent, to the efficiency requirements and ecological design applied to domestic equipment, following the EC guidelines in force in both cases. There have been a large number of measures enhanced of a varied typology within the framework of the E4 Action Plans (financial, legislative, information and communication instruments). Comparing the typology of the applied measures to the whole of the EU countries, quite a diversified typology can also be noticed with greater weight on the informative kind of measures. On the other hand, unlike Spain and the EU countries, cooperative measures have been boosted at central level, that is, from the European Commission.

Energy Efficiency Trends and Policies in SPAIN 43
Figure 2.18: Development of Energy Efficiency Measures by type over time in the Residential Sector
“Ongoing” and “Completed” Measures
Source: MURE: http://www.measures-odyssee-mure.eu/radar_in.asp
A similar profile in terms of measures typology can be observed in the services sector and at national level. With regards to the EU countries, efficiency measures in this sector account for a similar diversification, with greater impact on the informative measures. As for the EU central measures and unlike Spain, relevant actions are cooperative measures and the taxation on this sector.
Figure 2.19: Development of Energy Efficiency Measures by type over time in the Services Sector
“Ongoing” and “Completed” Measures
Source: MURE: http://www.measures-odyssee-mure.eu/radar_in.asp
The most recently implemented measures correspond to actions linked to the Action Plan 2014-2020 both in the residential and the services sector, exploited through various mechanisms - mainly financial measures.
Energy Efficiency Measure Evaluations: Semi-Quantitative Impact Estimates The impact assessment of the measures has been made bearing in mind both the expected impact and the impact according to an “ex-ante” assessment, established within the ODYSSEE-MURE project
Spain EU- National Measures EU - Central Measures
Le/NLe/N
Coop Coop Coop
Cros CrosCros
FinaFinaFina
Fisc Fisc FiscInfoInfo
Le/I Le/ILe/I
Le/N
Info
Spain EU- National Measures EU - Central Measures
Le/NLe/N
Coop Coop Coop
Cros CrosCros
FinaFinaFina
Fisc Fisc FiscInfoInfo
Le/I Le/I Le/I
Le/N
Info

Energy Efficiency Trends and Policies in SPAIN 44
framework. In accordance with the latter and depending on the relation between the expected energy saving derived from the application of the measure in a given sector and the envisaged energy consumption in the said sector, three impact categories are obtained in terms of energy
efficiency improvement: low: < 0.1%; medium: 0.1-0.5%; and high: 0.5%. In the cases where there was not a quantitative evaluation of the measures, a qualitative assessment was carried out of the possible impact on the basis of an expert judgement. According to the above, an appraisal of the impact of the national measures on energy efficiency to be applied in every fine use sector has been made. There are a total number of 50 measures on the MURE7 database to be applied in the building sector: 25 common measures for the Services and residential sector; 7 specific ones for the residential sector; and another 18 specific ones for the Services sector. These measures correspond to different periods, even if most of them are focused on the application years of the first Action Plans. 27 of the measures envisaged entail an assessment of the impact in quantitative terms. Medium-high impact measures are predominant. At present, there are 16 operational measures, distributed mainly between the legislative and financial types.
Figure 2.20: Semi-quantitative Impact Evaluation in Buildings
Source: MURE/IDAE
The measures that currently have greater impact are those of a legislative kind, aimed at the energy efficiency of buildings both in the residential and the services sector. Since the late 70s, measures of this kind have laid the bases to improve design standards and the energy efficiency of buildings, and their respective thermal installations in Spain. Thus, since the approval of the Spanish Building Regulation for Thermal Conditions in Buildings (NBE-79), successive improvements have been incorporated, in line with the requirements established by the EU guidelines, particularly the Directive relating to energy efficiency in buildings. In the mid-long term, it can be expected that the practical application of the measures referred to will lead to a high impact in the buildings in this sector.
7 The MURE Database has a large collection of the most relevant measures to be applied in the building sector (residential & services).
0
10
20
30
40
50
60
1979-2014_All >2000_All > 2000_ongoing
Low Medium High

Energy Efficiency Trends and Policies in SPAIN 45
Two of the most relevant high-impact measures are the approval of a Regulation on energy efficiency in street lighting installations to be applied to the services sector; and the Municipal Ordinance Model for thermal uses of solar absorption. This model, combined with other financial support instruments, has resulted in a successful measure, to be progressively applied to a growing number of municipalities. There is a greater diversification of measures within the following medium-impact category. Among the financial kind ones, the most relevant are the PAREER Programme and the Aid Programme to renovate municipal street lighting installations. In terms of legislative measures, there is the Green Public Procurement Plan, to be applied to the services sector. This measure has been recently reinforced with Law 15/2014, on the rationalisation of the Public Sector, regarding the Public Administrations’ purchase of efficient equipment. As for the rest of lower impact measures, the most outstanding are equipment labelling and eco-design, of an informative and educational kind. It is expected that they will reach farther once more experience has been gathered on the market with measures of the kind.
Table 2.1 : Ongoing Energy Efficiency Measures in Building Sector
Title Type Starting Year
Semi-quantitativ
e Impact
Scope
Norms and technical complementary instructions for homologation of solar panels
Co-operative Measures 1980 High Cross-cutting
Norm on building thermal insulation in Catalonia region Legislative/Normative 1987 High Cross-cutting
Proposal of a Municipal Ordinance for thermal uses of solar absorption
Legislative/Normative 2001 High Cross-cutting
EU-related: Recast Ecodesign Directive for Energy-related Products (Directive 2009/125/EC) - Ecodesign
requirements for energy-related products (recast) Legislative/Normative 2007 Medium Cross-cutting
IDAE's Financing Lines for Thermal Renewable Energies in Buildings: BIOMCASA-SOLCASA-GEOTCASA
Financial, Information/Education
2009 Medium Cross-cutting
EU-related: Revised Directive for Labelling of Energy-related Products (Directive 2010/30/EU) - Labelling and
information on energy consumption of Domestic Use Equipment
Legislative/Informative 2011 Low Cross-cutting
EU-related: Energy Performance of Buildings EPBD Recast (Directive 2010/31/EU) - Technical Building Code (CTE)
Legislative/Normative 2013 High Cross-cutting
EU-related: Energy Performance of Buildings EPBD Recast (Directive 2010/31/EU) - Regulation of Thermal
Installations in Buildings (RITE) Legislative/Normative 2013 High Cross-cutting
EU-related: Energy Performance of Buildings EPBD Recast (Directive 2010/31/EU) - CER (Energy Performance
Certificate for Buildings) Legislative/Informative 2013 High Cross-cutting
State Plan 2013-2016 for Rental Housing, Housing Rehabilitation, and Urban Regeneration and Renewal
Financial 2013 Medium Cross-cutting
PAREER-CRECE Program (Aids Program for Energy Rehabilitation in Buildings in Household and Hotel
Sectors). Financial 2014 Medium Cross-cutting
Plan for Replacement of Electricity Meters Information/Education 2008 Medium Household
Green Public Procurement Plan
Co-operative Measures, Information/Education/
Training, Legislative/Informative
2008 Medium Services
Energy Efficiency Regulation in Street Lighting Installations Legislative/Normative 2009 High Services
PIMA SOL (Plan for Promoting Energy Rehabilitation of Hotel Sector)
Financial 2013 Low Services
Aid Programme for the Renewal of Municipal Street Lighting Installations
Financial 2015 Medium Services
Sources:http://www.measures-odyssee-mure.eu/query-energy-efficiency-policy-household.asp;
http://www.measures-odyssee-mure.eu/query-energy-efficiency-policy-Services.asp

Energy Efficiency Trends and Policies in SPAIN 46
3. ENERGY EFFIENCY IN TRANSPORT
3.1. ENERGY EFFICIENCY TRENDS
Transport remained the main consuming sector in Spain with 39.4% of final energy consumption in 2013. Nonetheless, since the beginning of the crisis in 2008, it had recorded a continuous cutback in demand at an annual rate of 4.6%. Its global demand in 2013 decreased by 4.2%, which represents some sort of improvement as regards the previous year when demand had gone down by 7.4%. The causes of that lower consumption basically responded to the contraction noticed in 2013 in the biofuels demand (-57.1%), the equivalent to 87.1% of the drop in the total energy demand in the transport sector – even if these products hardly represented 3% of the sector’s demand. This was due to a reduction in the compulsory objectives on biofuel consumption in 2013, in compliance with the provisions of Law 11/2013 of 26 June. In like manner but to a lesser extent, energy needs associated with other products like oil derivatives (-0.5%), natural gas (-3.1%) and electricity (-3.4%) lowered in 2013. The lower mobility associated with passenger traffic and goods, specifically, Figure 3.1, remains beyond the electric power demand recorded, above all in relation to the oil products largely consumed in goods transport, and also, in passenger transports in private vehicles.
Figure 3.1: Trends of Traffic of Goods and Passengers in Spain, 2000-2013
Source: MFOM/IDAE
Oil products, with 95.6% of the demand met, are the predominant fuels in this sector while the contribution of the rest of the “alternative” products is under the 3% threshold. In the mid-long term, it can be expected that the demand of alternative propellants will undergo a boost by virtue of the existing EC guidelines on the decarbonisation of transport within the framework of the White Book on Transport 2010-2030. In line with this, the European Commission has developed over the two last years the so called “Clean Power for Transport (CPT)”, a strategy made up by a Communication and a Directive to create an infrastructure facilitating the development of alternative propellants on the European market. In line with this, the European Parliament and the Council approved Directive 2014/94/EU of 22 October 2014 on the deployment of alternative fuels infrastructure. In order to comply with this Directive, Spain has to develop “ad-hoc” legislation. This context envisages the launching of a national strategy to boost the alternative propellant vehicle. As for the transport modes, the former translated into a reduction in the 2013 demand for railway transport (-38.3%), sea (-41.3%) and air (-5.2%), which hardly reached jointly 20% of consumption in
120
170
220
270
320
370
420
470
2000 2001 2002 2003 2004 2005 2006 2007 2008 2009 2010 2011 2012 2013
Passengers (Gpkm) Goods (GPkt)

Energy Efficiency Trends and Policies in SPAIN 47
this sector. For its part, road transport remained the dominant transport mode, with 79.3% of the total demand. Considering the evolution in the last years and generally speaking, all of the transport modes were undermined by the change of economic situation started in 2008, and accounted for a decline in consumption since then, which was especially dramatic in railway and sea transport, and to a lesser extent, in road transport. Nevertheless and given its greater weight in consumption, road transport unambiguously affected the evolution of energy consumption in transport as a whole. For its part, air transport contrasted with the previous modes to maintain a more stabilized evolution, even if with a downward trend.
Figure 3.2: Trends of Energy Consumption by Transport Modes in Spain, 2000-2013
Source: MINETUR/IDAE
A comparative analysis at EU level reflected a similar trend in the various transport modes, especially after 2008, even if the impact of the crisis was stronger in Spain. Virtually, all the modes underwent a decrease in consumption at a higher rate than in the rest of the EU, which was particularly evident in the case of water and road transport.
Figure 3.3: Variation of Energy Consumption by Transport Modes in Spain and the EU
Source: EnR/IDAE
From the point of view of the contribution of all the transport modes along the period 2000-2013 and with the exception of air transport, the whole of the remaining modes accounted for a backward step, sharper in 2008. This became especially evident in water transport, whose contribution showed a backward movement all along the entire period to reach 2% at present, which sets up a moderate impact on the transport demand as a whole. Railway transport, also with a scarce contribution,
25%
45%
65%
85%
105%
125%
145%
165%
2000 2001 2002 2003 2004 2005 2006 2007 2008 2009 2010 2011 2012 2013
2000
=100
%
Road transport Rail transport Air transport Water transport
4,1%
-5,5%
-1,7%-0,8%
3,2%
-1,6%
2,4%
-2,4%
-0,6%
-10,3%
-1,0%
-5,9%
2,6%
-5,9%
1,0%
-1,7%
-12%
-10%
-8%
-6%
-4%
-2%
0%
2%
4%
6%
Spain_2000-2008 Spain_2008-2012 EU_2008-2012 EU_2008-2012
%/y
ear
Road Rail Air Water
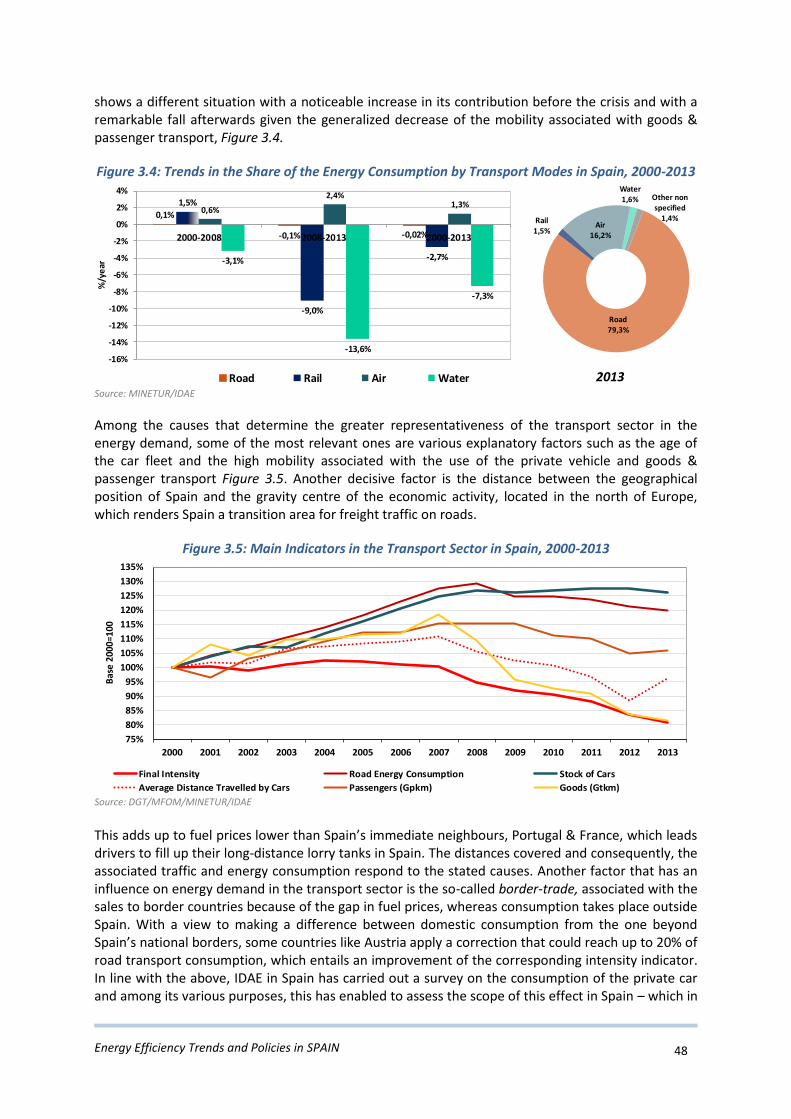
Energy Efficiency Trends and Policies in SPAIN 48
shows a different situation with a noticeable increase in its contribution before the crisis and with a remarkable fall afterwards given the generalized decrease of the mobility associated with goods & passenger transport, Figure 3.4.
Figure 3.4: Trends in the Share of the Energy Consumption by Transport Modes in Spain, 2000-2013
2013
Source: MINETUR/IDAE
Among the causes that determine the greater representativeness of the transport sector in the energy demand, some of the most relevant ones are various explanatory factors such as the age of the car fleet and the high mobility associated with the use of the private vehicle and goods & passenger transport Figure 3.5. Another decisive factor is the distance between the geographical position of Spain and the gravity centre of the economic activity, located in the north of Europe, which renders Spain a transition area for freight traffic on roads.
Figure 3.5: Main Indicators in the Transport Sector in Spain, 2000-2013
Source: DGT/MFOM/MINETUR/IDAE
This adds up to fuel prices lower than Spain’s immediate neighbours, Portugal & France, which leads drivers to fill up their long-distance lorry tanks in Spain. The distances covered and consequently, the associated traffic and energy consumption respond to the stated causes. Another factor that has an influence on energy demand in the transport sector is the so-called border-trade, associated with the sales to border countries because of the gap in fuel prices, whereas consumption takes place outside Spain. With a view to making a difference between domestic consumption from the one beyond Spain’s national borders, some countries like Austria apply a correction that could reach up to 20% of road transport consumption, which entails an improvement of the corresponding intensity indicator. In line with the above, IDAE in Spain has carried out a survey on the consumption of the private car and among its various purposes, this has enabled to assess the scope of this effect in Spain – which in
0,1%
-0,1% -0,02%
1,5%
-9,0%
-2,7%
0,6%
2,4%1,3%
-3,1%
-13,6%
-7,3%
-16%
-14%
-12%
-10%
-8%
-6%
-4%
-2%
0%
2%
4%
2000-2008 2008-2013 2000-2013
%/y
ear
Road Rail Air Water
Road79,3%
Rail1,5%
Air 16,2%
Water1,6% Other non
specified1,4%
75%
80%
85%
90%
95%
100%
105%
110%
115%
120%
125%
130%
135%
2000 2001 2002 2003 2004 2005 2006 2007 2008 2009 2010 2011 2012 2013
Final Intensity Road Energy Consumption Stock of Cars
Average Distance Travelled by Cars Passengers (Gpkm) Goods (Gtkm)
Bas
e 20
00=1
00

Energy Efficiency Trends and Policies in SPAIN 49
the case of petrol could reach to consumption of 6%.
A more detailed analysis of some of the factors with a bearing on the demand and energy intensity of transport enables to notice the influence of the mobility associated with goods and passenger traffic, Figure 3.5; this issue showed an upward trend until approximately 2008, a turning point from which it started declining as a result of the economic activity slowdown. Thus, in the period 2008-2013, passenger & freight traffic underwent an accumulated decrease of 8% and 27% respectively, which was linked to a lower energy demand associated with the said activities. On the other hand, it can be noticed the greater sensitivity of goods transport to the economic crisis. As regards passenger traffic under the air mode, apart from showing the signs of the crisis effects, it was also affected by the competition of the railway mode, stimulated with the implementation of new high-speed lines. In general, all the means of transport contributed to this situation, even if in absolute terms, road transport gained prominence in both cases accounting for 71% of the consumption associated with passenger traffic, and 91.2% with goods traffic in 2013.
Figure 3.6: Energy Consumption in Goods and Passenger Transport in Spain, 2013
Passengers Goods
Source: IDAE/DGT
Considering the importance of road transport, one of the factors that also had a bearing on transport energy intensity was the private vehicle, as it was accountable for nearly 50% of road consumption, the equivalent of 40% of all transport consumption. Therefore, the growing motorisation associated with vehicles of the kind together with the habits in use was one of the causes that constrained the evolution of transport consumption and intensity.
Figure 3.7: Energy Consumption in Road Transport by Types of Vehicle in Spain, 2013
Source: IDAE/DGT
Considering the path of the private vehicle fleet in Spain, Figure 3.8, as it happened in Portugal &
Road 71,8%
Rail 1,5%
Air 26,7%
Road 94,2%
Rail 1,6%
Water 4,2%
Cars
49,5%
Light Vehicles12,8%
Trucks32,3%
Motorcycles
1,1%
Buses
4,4%

Energy Efficiency Trends and Policies in SPAIN 50
Ireland, a remarkable increase took place since 90’s, which has currently reached 356 vehicles in circulation per a population of 1,000. From 2008 can be noticed some stabilisation with a downward trend, which led to increase the distance with the European average from 80% in 2008 to 76% at present. The impact of the crisis in the purchase power of Spanish households had its share of it. The same applies to other neighbouring countries, such as Ireland, Portugal and United Kingdom.
Figure 3.8: Car Ownership in Spain and the EU
Note: The main interest of this graphic is to show the car ownership trends in different countries. The level of car ownership is not strictly comparable between Spain and other countries because Spanish data are based on the stock of circulating vehicles. Source: EnR/IDAE/DGT/INE
The progressive dieselisation of the car fleet – currently 55% of it – has led to a growing contribution of diesel vehicles to a road transport consumption associated with a greater use, with longer annual trips as opposed to the ones using petrol. The evolution in the consumption of vehicles of the kind at a faster pace to the corresponding fleet growth explains, in general terms, the greater unit consumption increase for vehicles of this kind versus petrol vehicle consumption. Apart from mobility, another factor that has had an influence on the differential evolution of unit consumption of diesel vehicles versus petrol ones is their higher cubic capacity and the use of catalytic converters, which entails a higher weight and therefore, higher consumption. All the above could be noticed from the analysis of the period prior to the crisis. Nevertheless and afterwards, mobility and the consumption of both kinds vehicles dropped, which led to a reduction of the unit consumption in both cases, Figure 3.9. This happens to be especially remarkable in the case of petrol, whose average consumption dropped over 4% annually in the period 2008-2013.
Figure 3.9: Trends of Unit Consumption and Average Annual Distance Travelled
by Car Type in Spain, 2000-2013
Petrol Diesel
Source: IDAE/DGT/MFOM
0
100
200
300
400
500
600
700
EU28 Italy Portugal Spain Ireland France Denmark Germany UK
Nu
mb
er o
f ca
rs p
er
inh
abit
ant
1990 2000 2008 2012
-2,7%
-4,2%
-0,2% -0,2%
-2,4%
-4,0%
-4,5%
-4,0%
-3,5%
-3,0%
-2,5%
-2,0%
-1,5%
-1,0%
-0,5%
0,0%
2000-2008 2008-2013
% /
year
Unit Cons (toe/car) Specífic Cons (l/100 km) Travelled Distance (km)
1,4%
-2,1%
-0,13% -0,13%
1,5%
-2,0%
-2,5%
-2,0%
-1,5%
-1,0%
-0,5%
0,0%
0,5%
1,0%
1,5%
2,0%
2000-2008 2008-2013
% /
ye
ar
Privados
Unit Cons (toe/car) Specífic Cons (l/100 km) Travelled Distance (km)

Energy Efficiency Trends and Policies in SPAIN 51
The above does not contradict the technological improvements implemented in the national car fleet as a result of the release into the market of new motor developments and designs, Figure 3.10. This has led to the progressive renewal of the car fleet with more efficient vehicles. In absolute terms, diesel cars account for greater evolution as they stemmed from a more unfavourable situation.
Figure 3.10: Trends in the Specific Consumption of New Cars in Spain
Source: IDAE/DGT/ACEA, JAMA, KAMA
With a view to taking advantage of the more modern, efficient vehicles within the frameworks of the various Action Plans, different measures have been boosted to renew the car fleet through the application of support systems to purchase vehicles; this adds up to an already existing measure of a fiscal kind, such as the vehicle registration tax following efficiency and CO2 emissions by travelled kilometre. At present, several aid programmes such as PIVE & MOVELE Programmes, are available to purchase efficient vehicles and therefore, to the renewal of the car fleet. In short, the stated factors lead to a considerable energy intensity of transport in Spain of around 16% higher than the whole of the EU-28, Figure 3.11. Despite this, there is a downward trend noticed from 2004 onwards with a new slump of 3.0% in 2013, which led to greater proximity between national and European indicators.
Figure 3.11: Trends of Energy Intensity in Transport Sector in Spain and EU, 2000-2013
Source: EnR/IDAE
This evolution is explained, among other factors, by the efficiency improvements linked to the actions implemented within the framework of the Saving and Energy Efficiency Action Plans. These have been strengthened by the structural effects that have contributed to a lower activity in various
4,0
4,5
5,0
5,5
6,0
6,5
7,0
7,5
2000 2001 2002 2003 2004 2005 2006 2007 2008 2009 2010 2011 2012 2013
l/1
00
km
New Diesel New Petrol New Mix Petrol/Diesel
% /
year
-1,2%
-4,2%
-2,4%
-0,2%
-3,5%
-1,5%
-4,5%
-4,0%
-3,5%
-3,0%
-2,5%
-2,0%
-1,5%
-1,0%
-0,5%
0,0%
2000-2008 2008-2013 2000-2013
% /
year
Petrol Diesel
0,020
0,025
0,030
0,035
0,040
0,045
0,050
2000 2001 2002 2003 2004 2005 2006 2007 2008 2009 2010 2011 2012 2013
koe/
€05
EU-28 France Germany Italy Spain UK Ireland Portugal Greece

Energy Efficiency Trends and Policies in SPAIN 52
sectors of economy, and as a result, to a decrease in the mobility associated with goods & passenger transport, Figure 3.1, as it was formerly stated.
Assessment of Energy Efficiency through ODEX
ODEX index provides a supplementary analysis of the efficiency trends in the transport sector. In transport, this index is achieved by grouping the energy efficiency progress for each transport mode into a single indicator. The efficiency progress for each mode is calculated from specific consumption stated in: litres/100 km for private vehicles; toe/veh for buses and motorbikes; koe (kilogram oil equivalent) per tkm for lorries and light vehicles; koe/passenger for air transport; koe per tkbr for railway transport; and koe per tkbr for water transport. The global trend is achieved by weighting the individual trends of each mode according to the relative weight of the various modes in transport energy consumption. In accordance with ODEX index, the transport sector in Spain underwent an annual improvement nearing 1% in the period 2000-2013, Figure 3.12. The greater progress in global efficiency was achieved in air transport and in private vehicles. The global efficiency trends in the transport sector correspond to road transport, where 80% of consumption is absorbed, as stated earlier. For their part, private vehicles, responsible for approximately 50% of road transport consumption, largely determine road transport progress. In the last years technological improvements associated with private vehicles have been taking place. Behind this is the progressive penetration of more efficient vehicles in the Spanish car fleet, resulting in its renewal and its energy efficiency improvement.
Figure 3.12: Energy Efficiency Progress in Transport in Spain
Note1: Water transport is not shown because of lack of enough data.
Note2: Buses and trucks & light vehicles are not shown because, according to the ODEX index, there is not efficiency progress in the analysis period.
Source: IDAE/ ODYSSEE
On the other hand, this improvement is not noticeable in the case of lorries and light vehicles, accountable for a large part of goods transport. This is in tune with the slowing-down of the renewal pace for vehicles of this kind, linked to the effects brought about by the change of economic setting. Therefore, road transport global efficiency is penalised by a lower progress than expected if it was accompanied with technological improvement in the lorries and light vehicles fleet.
60
70
80
90
100
110
2000 2001 2002 2003 2004 2005 2006 2007 2008 2009 2010 2011 2012 2013
Bas
e 2
00
0=1
00
Total Cars Motorcycles Air

Energy Efficiency Trends and Policies in SPAIN 53
Assessment of the Decomposition of the Energy Consumption Variation
An additional energy analysis of the transport sector is the one achieved from the decomposition of the energy consumption variation of the sector for various factors or effects, Figure 3.13. This decomposition is made possible thanks to a specific tool designed within the ODYSSEE-MURE project framework, and which takes into account various variables of energy, technical and social-economic kind. The factors considered are as follows:
An activity effect that measures the variation effect for passenger traffic in the various modes of transport
An effect associated with modal change, assessed in the distribution changes of each transport mode in the total passenger and goods traffic.
Energy saving from a technical point of view, which measures the impact of the energy consumption variation per passenger-kilometre or tone-kilometre for each transport mode.
Other effects linked to behaviour and “negative saving” in goods transport, the latter mainly associated with the low loading capacity brought about by the economic crisis.
Energy consumption in the transport sector in Spain during the period 2000-2013 went down by 1.1 Mtoe. Nonetheless, a more recent analysis focussing on the period 2008-2013 accounts for a decrease in consumption of 10.3 Mtoe. This is mainly due to the activity effect, very much linked to the economic setting, and to the energy saving derived from technological improvements. Both led to a slump in consumption of 9.7 Mtoe. Modal changes contributed to a lesser extent. On the other hand, the negative effect associated with behaviour and the use of vehicles that introduces some penalisation for consumption remained, despite the downward trend starting in 2008.
Figure 3.13: Decomposition of Transport’s Energy Consumption Variation
Source: IDAE/ ODYSSEE
3.2. ENERGY EFFICIENCY POLICIES
All along the last years and within the framework of the various implemented Action Plans, special attention has been paid to the transport sector as part of the envisaged saving objectives concentrate on this sector. Therefore, a large part of the energy efficiency actions aimed at this sector fall within these Plans, among which a package of 15 measures spinning round three large
-12
-10
-8
-6
-4
-2
0
2
4
6
8
10
2000-2013 2000-2008 2008-2013
Mto
e
Variation of Consumption Activity Effect Technical Savings Modal Shift and Other Savings Other

Energy Efficiency Trends and Policies in SPAIN 54
axes was approved: modal change in people and goods mobility towards more efficient modes; efficient use of the means of transport; and the improvement of energy efficiency in the means of transport. These three axes keep setting up the action lines in terms of the efficiency policies in this sector. As regards the actions considered round the first axis, Urban Mobility Plans (UMP) and Company Transport and Activity Centres Plans are the most remarkable ones. These actions were boosted by the Action Plans, specifically Plan 2008-2012. This was endorsed by the Sustainable Economy Law, of 4 March 2011, which introduces a legal framework to develop Sustainable Mobility Plans in compliance with the Spanish Strategy of Sustainable Mobility (EEMS in Spanish acronyms), as approved by the Cabinet Meeting of 30 April 2009. The whole facilitated the implementation of the mobility plans in recent years in almost all the Spanish municipalities of a population over 50,000. This was completed with the inclusion of an assessment mechanism of the energy efficiency criteria to be eligible to receive the State aids to public transport systems. This measure, approved by Law 22/2013 of the State General Budget of 23 December, means to reinforce the application of these mobility plans in municipalities with a population of over 50,000. At present, work continues on improving the modal split to increase the participation of the most efficient modes of transport. To this end and recently, an aid programme for modal split actions and a more efficient use of transport modes has been approved within Action Plan 2014-2020. This programme8 has an initial budget of 8 M€, coming from the National Fund for Energy Efficiency. As regards the actions envisaged round this first axis, this aid programme means to boost the development of sustainable company transport plans. The requisite will be that the action should generate a minimum saving of 10% with regards to the start-up situation.
As for the second action axis, the most remarkable initiatives within the Action Plans have been addressed to the management of transport infrastructures, road transport fleets and efficient driving.
Concerning these measures, great progress has been made in fleet management thanks to the implementation of audits, the introduction of software systems and continuous training in efficient driving techniques. As regards this last point, the Ministry of Industry, Energy and Tourism (MINETUR) through the IDAE has collaborated with the Directorate-General for Traffic (DGT) to implement, from 1 January 2014, efficient driving techniques in the training system to obtain the driving licence for private and industrial vehicles. As for professional drivers, over 85,000 professionals have been trained in efficient driving courses, aimed at industrial vehicle drivers. Following the same work line and within the aid programme above, new actions are envisaged to address a more efficient use of transport modes. Precisely, the measures that have been allocated these aids are: road transport fleet management and the efficient driving courses for industrial vehicles for actions with a minimum of 200 students. In the first instance, the action is required to generate a minimum saving of 5%.
Also within the scope of this action axis, a new innovative measure recently adopted has been the exploitation of the energy coming from train braking. To this end, Royal Decree 1955/2000, regulating the transport, distribution, trade, supply and the authorisation procedures in electric
8 This aid line was created with a view to being extended up to year 2020
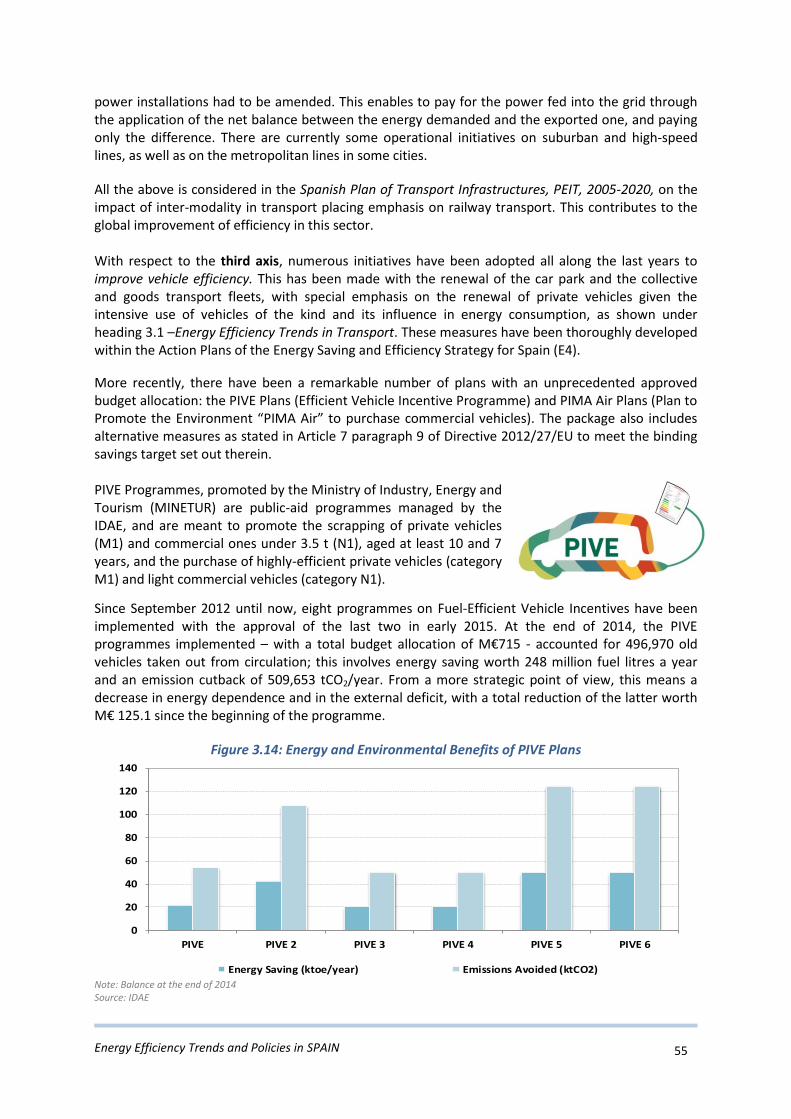
Energy Efficiency Trends and Policies in SPAIN 55
power installations had to be amended. This enables to pay for the power fed into the grid through the application of the net balance between the energy demanded and the exported one, and paying only the difference. There are currently some operational initiatives on suburban and high-speed lines, as well as on the metropolitan lines in some cities.
All the above is considered in the Spanish Plan of Transport Infrastructures, PEIT, 2005-2020, on the impact of inter-modality in transport placing emphasis on railway transport. This contributes to the global improvement of efficiency in this sector. With respect to the third axis, numerous initiatives have been adopted all along the last years to improve vehicle efficiency. This has been made with the renewal of the car park and the collective and goods transport fleets, with special emphasis on the renewal of private vehicles given the intensive use of vehicles of the kind and its influence in energy consumption, as shown under heading 3.1 –Energy Efficiency Trends in Transport. These measures have been thoroughly developed within the Action Plans of the Energy Saving and Efficiency Strategy for Spain (E4).
More recently, there have been a remarkable number of plans with an unprecedented approved budget allocation: the PIVE Plans (Efficient Vehicle Incentive Programme) and PIMA Air Plans (Plan to Promote the Environment “PIMA Air” to purchase commercial vehicles). The package also includes alternative measures as stated in Article 7 paragraph 9 of Directive 2012/27/EU to meet the binding savings target set out therein. PIVE Programmes, promoted by the Ministry of Industry, Energy and Tourism (MINETUR) are public-aid programmes managed by the IDAE, and are meant to promote the scrapping of private vehicles (M1) and commercial ones under 3.5 t (N1), aged at least 10 and 7 years, and the purchase of highly-efficient private vehicles (category M1) and light commercial vehicles (category N1).
Since September 2012 until now, eight programmes on Fuel-Efficient Vehicle Incentives have been implemented with the approval of the last two in early 2015. At the end of 2014, the PIVE programmes implemented – with a total budget allocation of M€715 - accounted for 496,970 old vehicles taken out from circulation; this involves energy saving worth 248 million fuel litres a year and an emission cutback of 509,653 tCO2/year. From a more strategic point of view, this means a decrease in energy dependence and in the external deficit, with a total reduction of the latter worth M€ 125.1 since the beginning of the programme.
Figure 3.14: Energy and Environmental Benefits of PIVE Plans
Note: Balance at the end of 2014 Source: IDAE
0
20
40
60
80
100
120
140
PIVE PIVE 2 PIVE 3 PIVE 4 PIVE 5 PIVE 6
Energy Saving (ktoe/year) Emissions Avoided (ktCO2)

Energy Efficiency Trends and Policies in SPAIN 56
Additionally, PIMA Air programmes have been implemented by the MAGRAMA (Ministry of Agriculture, Food and the Environment) to reduce the emissions of pollutants into the atmosphere with the renewal of the trade vehicle fleets. Since February 2013 until late 2014 four PIMA Air Plans were launched with a total budget allocation of M€ 53.1. This means the renewal of over 50,000 commercial vehicles.
Vehicle energy labelling has been a decisive factor in the management of these programmes. To this end, the IDAE has a database including all the private vehicle makes sold in Spain classified by energy efficiency. These actions have been completed with two other additional plans, implemented by the MAGRAMA all along 2014 —PIMA Earth Plan and PIMA Transport Plan —. The first one, allocated with M€ 5, is aimed at the renewal of the current agricultural tractor fleet with more efficient models of a lower environmental impact, while the second, allocated with M€ 4.7, is meant to take out old goods heavy transport vehicles and buses for scrapping. As regards the promotion of new technologies, an effort has been made in the last years to ease the penetration of the electric vehicle. Therefore, from 2006 to 2013 the purchase of electric vehicles was encouraged with various aid lines as the ones allocated within the E4 Strategy Action Plans, and the ones from the MOVELE aid lines, managed by the MINETUR. The launching in 2009 of the MOVELE Pilot Project, to boost electric mobility is another remarkable measure. Apart from the above, the Integral Strategy to Impulse the EV/PHEV in Spain 2010–2014 was approved in Spain in April 2010, and in this way, Spain has become one of the few countries with a comprehensive strategy to promote the development of vehicles of this kind. An additional advance concerning electric mobility was the approval of Royal Decree 647/2011 of 9 May, regulating the activity of the system loading management to carry out energy reloading services. This has enabled 11 approved load managers to sell electric power aimed at recharging electric vehicles.
These initiatives have contributed to purchase nearly 8,500 electric vehicles, also facilitating the installation of nearly 800 public use recharge points.
These measures have continuity with the approval in 2014 of a new line of incentives to purchase electric vehicles by MINETUR – MOVELE Programme 2014 -. This programme, which fell within the Integral Strategy to Impulse the EV/PHEV in Spain 2010–2014 and which was allocated with M€ 10, aimed at stimulating the purchase of nearly 3 500 electric, hybrid, plug-in or extended range vehicles. This programme is one of the alternative measures envisaged to meet the binding saving objective, set out in article 7 of Directive 2012/27/EU. The approval in 2015 of an additional M€ 7 budget for a new MOVELE 2015 Programme will enable to keep on with the undertaken actions.
Apart from the above, there are currently various actions under way oriented to promote the necessary infrastructure to develop alternative propellants in transport which, as previously seen, still account for a scarce contribution in Spain. In the field of automotive LPG there are around 280 retail filling stations of automotive LPG with an estimated fleet of 11,000 vehicles. As for the use of natural gas in transport, there are as many as 90 filling stations, both public and private, of GNC and LPG. The total vehicle fleet propelled by natural gas amounts to 18,000, mainly buses, garbage trucks and vans. For their part, biofuels have undergone a remarkable boost after the approval of Order ITC/2877/2008, of 9 October 2008, which introduced a mechanism to enhance the use of biofuels and other renewable fuels for transport purposes. This issue has led to an increase in the percentage of petrol and diesel oil, from 1.9% in 2008 to 8.4% in 2012. Since 2013 onwards, a new objective of 4.1% in the consumption of biofuels has been set up with a view to reducing fuel prices.

Energy Efficiency Trends and Policies in SPAIN 57
The recent approval of Directive 2014/94/EU of the European Parliament and of the Council of 22 October 2014, on the establishment of an infrastructure for alternative fuels, involves an extra stimulus to the penetration of fuels of this kind in transport. In line with it, Spain will have to develop “ad-hoc” legislation. In this context is envisaged the launching of a national strategy to boost the vehicle with alternative fuels, especially in road and water transport.
Patterns and Dynamics of Energy Efficiency Measure The analysis offered next on the evolution of energy efficiency measures implemented in the transport sector is based on the use of “spider graphs”. Graphs of the kind show the evolution of the measures all along the various time periods, categorized according to the following typology:
Coop: Co-operative Measures
Cros: Cross-cutting with sector-specific characteristics
Fina: Financial
Fisc: Fiscal
Info: Information/Education/Training
Infr: Infrastructure
Le/I: Legislative/Informative
Le/N: Legislative/Normative
Soci: Social Planning/Organisational
The charts represent both axes and categories. The distribution of the measures on each axis is in line with their categorisation which, eventually, may reach a multidimensional approach. Therefore, the number stated in the legend does not have to correspond with the total number of real measures as it considers all the kinds of measures in their various dimensions. Nonetheless, the important thing is to stand out the trends according to types, in line with the evolution shown on the various axes for each of the stated periods. This goes along with a comparison with the typological trends of the efficiency measures adopted in the whole of the EU countries, as well as the implemented ones at central level from the European Commission.
There have been a large number of measures of a varied typology approved in the last years in Spain, most of which concentrate on the first Action Plans of the Strategy (E4). The measures aimed at the management of the transport infrastructure and the planning ones have been gaining relevance within the framework of these Plans, among which can be counted the ones included in the Urban Mobility Plans and the Company Transport Plans as well as the cooperation measures based on agreements with the key representative agents of the various transport modes. PEIT Plan 2005-2020 also adds up to the actions in the field of planning, organisation and infrastructure management.
More recently, financial measures in support of the renewal of the vehicle fleet, such as PIVE Plans, PIMA Air, and MOVELE have grown relevant.
Other implemented actions at national level and which correspond to EU guidelines are the application of energy efficiency labelling to transport, and the promotion of the use of biofuels. In like manner and under the drive of the European Commission, there has been resort to a fiscal measure since 2007 with an impact on the energy efficiency of this sector thanks to the adaptation of taxes to vehicles on the basis of their emissions.

Energy Efficiency Trends and Policies in SPAIN 58
In the EU countries it can be noticed a trend towards the management measures of the transport infrastructure, financial and fiscal ones, and the latter two with greater presence than in Spain. Among the central measures, the ones of a legislative and fiscal kind are particularly remarkable.
Figure 3.15: Development of Energy Efficiency Measures by type over time in the Transport Sector
“On going” and “Completed” Measures
Source: MURE: http://www.measures-odyssee-mure.eu/radar_in.asp
Energy Efficiency Measure Evaluations: Semi-Quantitative Impact Estimates The impact assessment of the measures has been made bearing in mind both the expected impact and the impact according to an “ex-ante” assessment, established within the ODYSSEE-MURE project framework. In accordance with the latter and depending on the relation between the expected energy saving derived from the application of the measure in a given sector and the envisaged energy consumption in the said sector, three impact categories are obtained in terms of energy
efficiency improvement: low: < 0.1%; medium: 0.1-0.5%; and high: 0.5%.
In the cases where there was not a quantitative evaluation of the measures, a qualitative assessment was carried out of the possible impact on the basis of an expert judgement. According to the above, an appraisal of the impact of the national measures on energy efficiency to be applied in every sector has been made.
There are a total number of 51 measures on the MURE9 database to be applied in the transport sector corresponding to different periods, even if most of them are focused on the application years of the first Action Plans. 37 of the measures envisaged entail an assessment of the impact in quantitative terms. Medium-high impact measures are predominant. There are at present 11 operational measures, most of which of a financial kind. In addition, other measures of a legislative kind are also present.
9 The MURE database counts on a large collection of the most relevant measures to be applied in the transport sector.
Spain EU- National Measures EU - Central Measures
Soci
Le/N Le/N
Coop Coop Coop
Cros CrosCros
FinaFinaFina
Fisc Fisc Fisc
InfoInfoInfo
Le/I Le/I Le/I
Infr
Soci
Infr
Soci
Infr
Le/N

Energy Efficiency Trends and Policies in SPAIN 59
Figure 3.16: Semi-quantitative Impact Evaluation in Transport
Source: MURE/IDAE
Some of the most relevant measures enforced and with greater impact are the aid programmes to purchase efficient vehicles, the registration tax on the basis of CO2 emissions, the obligation of using biofuels for transport, and within the field of planning, the Spanish Plan of Transport Infrastructures, PEIT, 2005-2020.
Table 3.1 : On going Energy Efficiency Measures in Transport Sector
Title Type Starting Year
Semi-quantitative
Impact
Standards for the Technical Inspection of Vehicles Legislative/Normative 1994 High
Energy efficiency labelling in transport sector Legislative/Informative 2003 Low
Strategic Infrastructures and Transport Plan (PEIT 2005-2020)
Infrastructure, Social Planning/Organisational
2004 High
EU-related: Promotion of Biofuels or other Renewable Fuels for Transport (Directive 2003/30/EC) - Mandatory
Use of Biofuels
Legislative/Normative 2008 High
EU-related: Fiscal Measures to Promote Car Fuel Efficiency - Registration Tax Link to CO2 Emissions
Fiscal 2008 High
Integral Strategy to Impulse the EV/PHEV in Spain 2010–2014
Co-operative Measures , Financial 2010 Medium
PIVE Programme- Efficient Vehicle Incentive Programme Financial 2012 High
Efficient Driving Programme in the Driving Licence of new drivers
Information/Education/Training 2013 Low
MOVELE 2014 Programme Financial 2014 Low
Plan to promote Environment (PIMA Aire) Financial 2014 Low
Aid programmes for modal and means of transport shift Information/Education/Training, Infrastructure, Social
Planning/Organisational
2015 Medium
Source: http://www.measures-odyssee-mure.eu/query-energy-efficiency-policy-transport.asp
A proof of the combined impact of the two first measures mentioned earlier is the growing rate of new vehicles with lower emissions, which reinforces the renewal effect of the car fleet with more efficient, cleaner vehicles.
0
10
20
30
40
50
60
1991-2014_All >2000_All > 2000_ongoing
Low Medium High
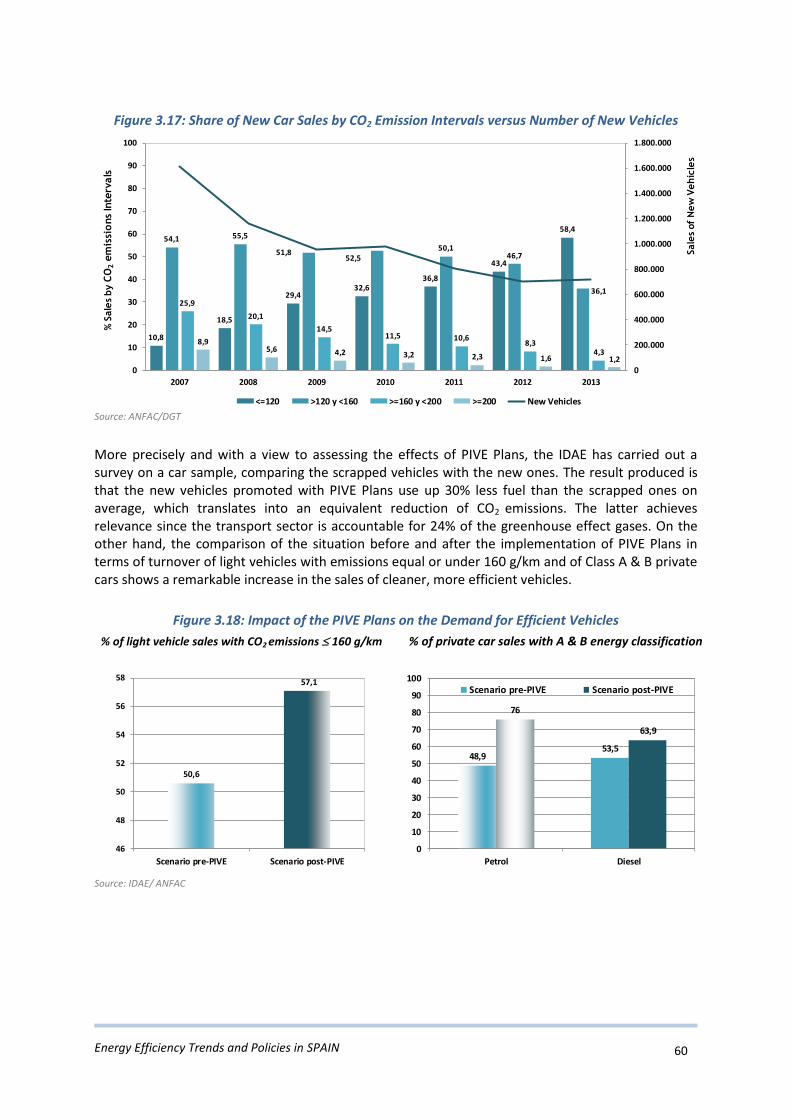
Energy Efficiency Trends and Policies in SPAIN 60
Figure 3.17: Share of New Car Sales by CO2 Emission Intervals versus Number of New Vehicles
Source: ANFAC/DGT
More precisely and with a view to assessing the effects of PIVE Plans, the IDAE has carried out a survey on a car sample, comparing the scrapped vehicles with the new ones. The result produced is that the new vehicles promoted with PIVE Plans use up 30% less fuel than the scrapped ones on average, which translates into an equivalent reduction of CO2 emissions. The latter achieves relevance since the transport sector is accountable for 24% of the greenhouse effect gases. On the other hand, the comparison of the situation before and after the implementation of PIVE Plans in terms of turnover of light vehicles with emissions equal or under 160 g/km and of Class A & B private cars shows a remarkable increase in the sales of cleaner, more efficient vehicles.
Figure 3.18: Impact of the PIVE Plans on the Demand for Efficient Vehicles
% of light vehicle sales with CO2 emissions 160 g/km % of private car sales with A & B energy classification
Source: IDAE/ ANFAC
10,8
18,5
29,432,6
36,8
43,4
58,454,1 55,5
51,852,5
50,146,7
36,1
25,9
20,1
14,511,5 10,6
8,34,3
8,95,6 4,2 3,2 2,3 1,6 1,2
0
200.000
400.000
600.000
800.000
1.000.000
1.200.000
1.400.000
1.600.000
1.800.000
0
10
20
30
40
50
60
70
80
90
100
2007 2008 2009 2010 2011 2012 2013
y evolución Matriculaciones Totales
<=120 >120 y <160 >=160 y <200 >=200 New Vehicles
Sale
sof
New
Vehic
les
% S
ale
s by C
O2
em
issi
ons
Inte
rvals
50,6
57,1
46
48
50
52
54
56
58
Scenario pre-PIVE Scenario post-PIVE
48,953,5
76
63,9
0
10
20
30
40
50
60
70
80
90
100
Petrol Diesel
Scenario pre-PIVE Scenario post-PIVE

Energy Efficiency Trends and Policies in SPAIN 61
4. ENERGY EFFICIENCY IN INDUSTRY
4.1. ENERGY EFFICIENCY TRENDS
There are five branches in the Spanish industry that stand out for their greater intensity from an energy point of view: non-metal minerals, metallurgy, chemistry, food, beverages & tobacco and pulp & paper. They jointly absorb 75.6% of the industry energy demand, even if they only contribute with 28% to the Gross Value Added (GVA) of the global industry. By industrial branches, the higher value corresponds to metallurgy and non-metal minerals, where the weight of their respective energy demands exceeds by over seven times the one associated with their contributions to the GVA Figure 4.1.
Figure 4.1: Energy-Economic Characterization of the Industry Sector by branches in 2013
Energy Consumption Energy Demand/GVA Relation
Note: Non-energy uses excluded
Source: MINETUR/IDAE
In line with the above, the national situation can be contrasted with other neighbouring countries such as Germany or the UK, whose industry, endowed with a different structural composition, accounts for lower intensities and therefore, an improvement of competitiveness. The behaviour of the branches above has a direct repercussion on the evolution of the intensity in the whole of Spanish industry. The manufacturing branches represent 92.0% of the industry energy demand, and 62.2% of its added value, which illustrates its energy intensity, closely linked to the sectoral composition. The Spanish manufacturing industry accounts for a somehow higher intensity than the EU-28 average, Figure 4.2, given that the average structure of the European industry tends to the integration of less intensive branches, as the ones linked to capital goods. From 2004, a downward trend is made evident, which goes on after the beginning of the crisis in 2008, even if with slight fluctuations. Part of the explanation is due to the structural changes undergone in the composition of manufacturing industry, as shown in the analysis derived from the Divisia Method. Despite the latter, the intensity of manufacturing industry increased by 3.2% in 2013. Telling between the previous and following periods at the beginning of the crisis, Figure 4.2, one can notice the contribution of structural changes to the improvement of the intensity of manufacturing industry. This fact was sped up under the effect of the crisis, making evident how structural changes account for almost the entire of intensity fall of the manufacturing industry as a whole in the period 2008-2013. In the opposite sense, the contribution of other non-structural factors such as technological improvements undergoes some kind of backward movement as a result of the changes brought about in the current economic scenario.
Food, Beverages and Tobacco
10,5% Textile1,7%
Paper and Pulp9,9%
Chemicals19,1%
Construction6,0%
Non Metallic Minerals
16,3%
Metal Products and Equipment
6,0%
Primary Metals19,9%
Mining2,0%
OtherIndustries
8,6%
0 1 2 3 4 5 6 7 8
Food, Beverages and Tobacco
Textile
Paper and Pulp
Chemicals
Construction
Non Metallic Minerals
Metal Products and Equipment
Primary Metals
Mining
Other Industries

Energy Efficiency Trends and Policies in SPAIN 62
Figure 4.2: Trends of Energy Intensity in Manufacturing Industry in Spain and EU, 2000-2013
Intensity of Manufacturing Industry Impact of Structural Effect
Source: ODYSSEE/IDAE/INE
As for the structural effect, it can be contrasted with the change in the contribution of the various branches of the Gross Value Added of the manufacturing industry, Figure 4.4, which has involved a reduction in the more intensive branches of non-metal minerals and metallurgy, as well as a slight displacement towards the less intensive branches.
Figure 4.3: Changes in the Added Value Structure in Manufacturing Industry
Note: Primary metals includes steel and non-ferrous metals
Fuente: IDAE/INE
Considering industry as a whole, the situation of Spanish intensity differs, Figure 4.4, with a more favourable benchmarking at European level with a lower intensity than the EU-28 average, even if in the last years a worsening of intensity has been noticed, coinciding with the beginning of the crisis. In relative terms, the lower level of the Spanish intensity is largely explained by the construction sector, little intensive, and whose demand over the whole hardly reaches 6%, with a contribution of 24.0% to the industry GVA. Nonetheless, the existing interrelation between the construction and non-mineral industries influences the activity of this last sector, as it happens with its energy demand and along with it, the intensity of the manufacturing industry.
0,080
0,100
0,120
0,140
0,160
0,180
0,200
0,220
0,240
2000 2001 2002 2003 2004 2005 2006 2007 2008 2009 2010 2011 2012 2013
koe
/€0
5
EU-28 France Germany Italy Spain UK
-1,92%-1,75%
-5,15%
-1,45%
-6,00%
-5,00%
-4,00%
-3,00%
-2,00%
-1,00%
0,00%
2004-2008 2008-2013
An
nu
al A
vera
ge V
aria
tio
n (%
/yea
r)
Structural Effect Real Variation
20%
40%
60%
80%
100%
120%
140%
2004 2005 2006 2007 2008 2009 2010 2011 2012 2013
Ba
se 2
00
4=
10
0%
Paper Chemicals Non Metallic Minerals Primary Metals Equipment Food and Beverages

Energy Efficiency Trends and Policies in SPAIN 63
Figure 4.4: Trends of Energy Intensity in Industry Sector in Spain and EU, 2000-2013
Source: IDAE/ ODYSSEE
The industry energy demand in 2013 underwent a slight increase of 0.2%, even while keeping a stable trend. This fact basically responds to the increase noticed in the gas demand (+7%), which represents 43.5% of all the industry energy demand, especially concentrated in non-metal, chemistry and metallurgy industries. Therefore, the backward step has been compensated in the demand of oil products (-23.1%) and of electricity (-3.4%), which represent 42% of demand as a whole. As a net balance of the 2013 evolution and paying attention to the industry branches, it can be concluded that food, pulp & paper and metallurgy industries had a relevant weight in the final results, both at consumption and energy intensity level in industry, Figure 4.5, as a growth in demands higher than the associated with the industry GVA took place.
Figure 4.5: Trends of Energy Intensity and Consumption in Intensive Industry Branches, 2000-2013
Consumption Intensities
Note: Non-energy uses excluded
Source: INE/MINETUR/IDAE
Taking the industry activity as a whole, the wealth generated during 2013 - stated in terms of Gross Value Added - underwent a reduction of 4.7% and a decrease of 1.7% in the Industrial Production Index (IPI) that year. Consequently, the difference in the GVA evolution rates and energy demand involved an increase of 5.2% in the energy intensity of this sector in 2013.
0,060
0,075
0,090
0,105
0,120
0,135
0,150
2000 2001 2002 2003 2004 2005 2006 2007 2008 2009 2010 2011 2012 2013
koe
/€0
5
EU-28 France Germany Italy Spain UK
40%
60%
80%
100%
120%
140%
2000 2001 2002 2003 2004 2005 2006 2007 2008 2009 2010 2011 2012 2013
Bas
e 2
00
0=1
00
Paper and Pulp Química Minerales No Metálicos
Metalurgia Total Industry Manufacturing Industry
40%
60%
80%
100%
120%
140%
2000 2001 2002 2003 2004 2005 2006 2007 2008 2009 2010 2011 2012 2013
Bas
e 2
00
0=1
00
Paper and Pulp Química Non Metallic Minerals
Metalurgia Total Industry Manufacturing Industry
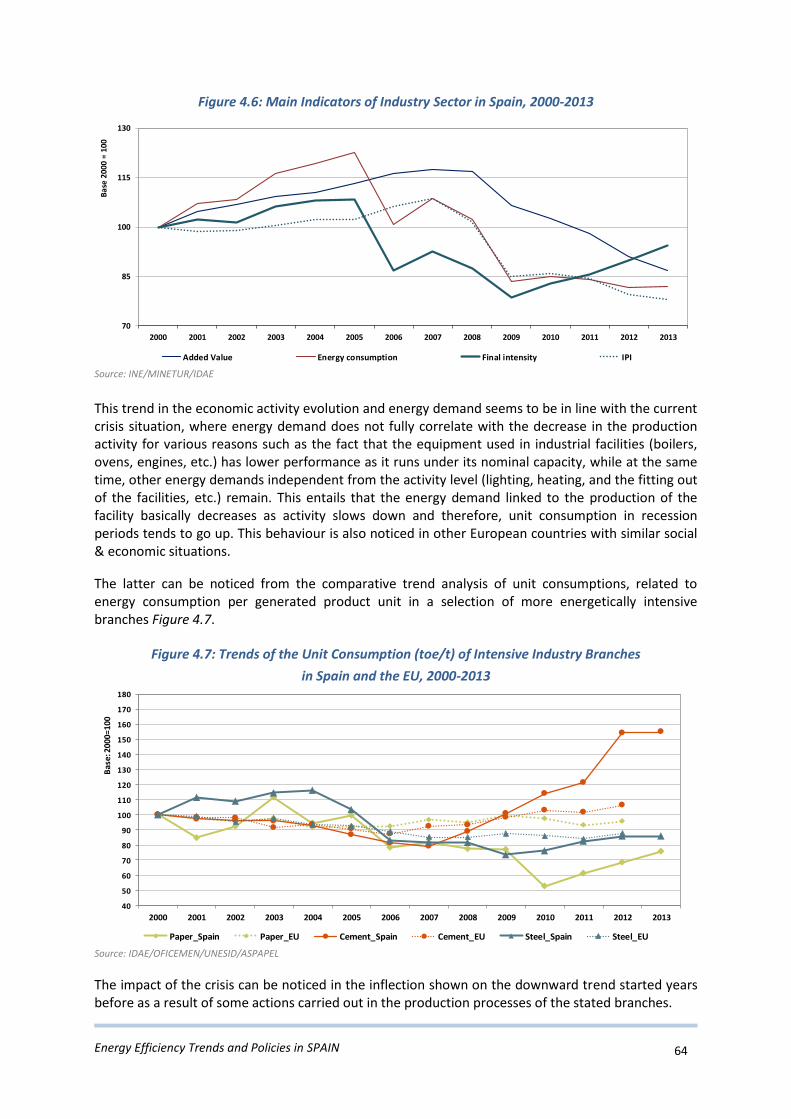
Energy Efficiency Trends and Policies in SPAIN 64
Figure 4.6: Main Indicators of Industry Sector in Spain, 2000-2013
Source: INE/MINETUR/IDAE
This trend in the economic activity evolution and energy demand seems to be in line with the current crisis situation, where energy demand does not fully correlate with the decrease in the production activity for various reasons such as the fact that the equipment used in industrial facilities (boilers, ovens, engines, etc.) has lower performance as it runs under its nominal capacity, while at the same time, other energy demands independent from the activity level (lighting, heating, and the fitting out of the facilities, etc.) remain. This entails that the energy demand linked to the production of the facility basically decreases as activity slows down and therefore, unit consumption in recession periods tends to go up. This behaviour is also noticed in other European countries with similar social & economic situations.
The latter can be noticed from the comparative trend analysis of unit consumptions, related to energy consumption per generated product unit in a selection of more energetically intensive branches Figure 4.7.
Figure 4.7: Trends of the Unit Consumption (toe/t) of Intensive Industry Branches
in Spain and the EU, 2000-2013
Source: IDAE/OFICEMEN/UNESID/ASPAPEL
The impact of the crisis can be noticed in the inflection shown on the downward trend started years before as a result of some actions carried out in the production processes of the stated branches.
-16,2%
70
85
100
115
130
2000 2001 2002 2003 2004 2005 2006 2007 2008 2009 2010 2011 2012 2013
Ba
se 2
000
= 10
0
Added Value Energy consumption Final intensity IPI
40
50
60
70
80
90
100
110
120
130
140
150
160
170
180
2000 2001 2002 2003 2004 2005 2006 2007 2008 2009 2010 2011 2012 2013
Bas
e: 2
000=
100
Paper_Spain Paper_EU Cement_Spain Cement_EU Steel_Spain Steel_EU

Energy Efficiency Trends and Policies in SPAIN 65
Itemizing the industry intensity into its components, Figure 4.8, that is, the intensity associated with the electricity and thermal demand of industry, there has been a growing representativeness of electricity intensity since the beginning of the 90s, given the progressive electrification of industry. Thus, electric consumption has undergone a remarkable growth both in absolute and relative terms. Nonetheless, this phenomenon has been sharper all along the 90’s, reaching an accumulated increase of 32% of the said consumption. The further evolution was moderated, especially since the beginning of the crisis in 2008. In relative terms, the contribution of electricity consumption increased, reaching a peak of 31% in 2006. Nevertheless, after the impact of the crisis and of the price rise in electricity after 2008, this contribution accounted for a backward movement.
Figure 4.8: Effect of the Electrification in Industry in Spain
Trends of Intensities in Industry Trends of Electricity Consumption by Industry Branches
Note: Primary metals includes steel and non-ferrous metals
Fuente: IDAE/MINETUR
Virtually, all the industry branches have taken part in this electrification issue, specially linked to the industries related to food, pulp & paper and metallurgy, where an annual electricity consumption nearing 2% prior to the crisis in the period 2000-2008 can be noticed. All in all, industry energy demands remain mostly met by fossil fuels, which determine the influence of these energies in industry intensity.
Assessment of Energy Efficiency through ODEX
A supplementary analysis of efficiency trends in industry is achieved with ODEX index. In industry, this index is calculated at 12 branch levels: 10 branches from the manufacturing10, building and mining industries. In terms of the manufacturing industry, given its greater relevance in the global industry and telling from the periods prior and after the crisis, the contribution of the various branches of efficiency varies, Figure 4.9. In the period 2000-2008 stood out the cement, steel and transport vehicle industries. Further, steel and transport vehicle industries kept their improvement pace; and these branches were joined by the pulp & paper industry, with greater progress in the stated period. Last, this could be due to the implementation of energy saving measures forced by the crisis, such as the increase in the import of pulp, and the use of recycled paper related to the consumption of new paper to produce paper. According to the Bureau of International Recycling, the world recycling industry association, energy saving could reach up to 65%. This could help explain the ODEX index evolution in paper industry, which is an indicator more sensitive to technological improvements and to process changes.
10 3 intensive branches (steel, cement and pulp & paper), and another 7 branches from manufacturing industry (chemistry, food & beverages, textile, machinery & transport equipment, non-ferrous metallurgy, other minerals, and other industries)
70%
75%
80%
85%
90%
95%
100%
105%
110%
115%
2000 2001 2002 2003 2004 2005 2006 2007 2008 2009 2010 2011 2012 2013
Bas
e 2
00
0=1
00
%
Thermal Intensity Electricity Intensity
Total Intensity % Electricity Consumption
0%
5%
10%
15%
20%
25%
30%
35%
2000 2008 2009 2013
Food and Beverages Paper Primary Metals

Energy Efficiency Trends and Policies in SPAIN 66
In general, the pulp & paper industry - together with the iron & steel and the cement ones - all have been accumulating improvement actions in terms of production along the last decades with a favourable impact on energy efficiency. In the case of the cement industry during the period 2000-2008, an important investment effort took place regarding energy efficiency measures, which accounted for an annual average nearing 3%. More recently, ODEX index did not reflect any improvement in cement industry, essentially because of two factors: on the one hand, the need to pay off former energy investments; and on the other hand, some deterioration of efficiency in production facilities as a result of the crisis, as these worked below their capacity. This issue accounts for some increase in specific consumption, Figure 4.7. Another extra factor is the fact that in the last years, this happened along with an increase in the Clinker production, which entailed a raise in the energy consumption associated with its production. The whole determines the ODEX index evolution in the cement industry, without the noticed progress in the period 2008-2013.
Figure 4.9: Energy Efficiency Progress in Manufacturing Industry by Branches in Spain
Source: IDAE/ ODYSSEE
Assessment of the Decomposition of the Energy Consumption Variation
An additional energy analysis in the industrial sector is the obtained from the itemisation of the energy consumption variation in the sector for various factors or effects. This itemisation is possible thanks to a specific tool designed within the ODYSSEE-MURE project framework, as it takes into account different variables of energy, technical and social-economic kinds. The factors considered are the following:
An activity effect measuring the effect of the added value variation.
Structural changes, measured by the change in the added value structure according to industry branches.
Changes in the value of product, calculated as the ratio between the added value and the physical production or the production index.
Energy savings, measured by the ODEX index.
Other effects, mainly “negative” savings, duly to inefficient operations in industry, essentially associated with the low use of production capacities as a result of the economic crisis.
-0,96%
0,00%
-2,52%
0,00% 0,00%
-2,86%
-1,67%-1,94%
-1,08%-1,49%
-2,08%
-7,12%
-1,31%
0,00% 0,00%
-2,92%
-8,0%
-7,0%
-6,0%
-5,0%
-4,0%
-3,0%
-2,0%
-1,0%
0,0%
Man
ufac
turi
ng
Indu
stry
Chem
ical
s
Ste
el
Pap
er
Food
Cem
ent
No
n f
err
eou
s m
eta
ls
Tran
spo
rt v
ehi
cle
s
%/y
ear
2000-2008 2008-2013

Energy Efficiency Trends and Policies in SPAIN 67
The energy consumption of industry in Spain in the period 2000-2013 fell by 5.11 Mtoe. The factors accounting for such contribution were the effects of a structural and activity kind and those related to product value change, as well as the energy savings associated with technological improvements, which jointly accounted for a decrease in consumption of 9.8 Mtoe in the stated period. Contrary to this, inefficiency in the industrial facility operating capacity as a result of the crisis involved an increase in consumption of 4.8 Mtoe.
Figure 4.10: Decomposition of Industry’s Energy Consumption Variation
Source: IDAE/ ODYSSEE
Telling between the previous and following periods at the beginning of the crisis, the contribution of the various factors change, with a prominence of the structural and activity effects and the ones from a product value change, and whose behaviour vary from one period to another. Therefore, in the period 2008-2008, the effects of the activity and from the product value change mainly contributed to an increase in energy consumption, given the consumption brought about by a greater economic activity in the said period. Nevertheless, these two effects made a contribution in the opposite sense in the period 2008-2013, as a result of the lower energy demand associated with a decrease in activity, while conversely, the global industry structure effect made a negative contribution, which above all responds to a lower participation of the building industry in the total added value brought about by the crisis. The latter took place despite the structural change linked to the manufacturing industry, Figure 4.2, an effect compensated by the recent evolution of the building sector, very much affected by the change in the social & economic situation started in 2008.
4.2. ENERGY EFFICIENCY POLICIES
All along the recent years, most of the energy efficiency measures applied to this sector have been in line with the various Action Plans implemented. Among the proposed measures, the most relevant one considered was the aid programmes aimed both at facilitating the implementation of energy audits and the promotion of investments in efficiency improvement projects. Another measure taken into account in the first Action Plans was the voluntary agreements between entrepreneurial associations and the Public Administration to achieve a series of saving objectives in various industrial sectors; however, this measure did not have the expected impact in Spain and stopped been considered in the last Plans. At present, the energy efficiency measures recently implemented in this sector have been the
-8
-6
-4
-2
0
2
4
6
2000-2013 2000-2008 2008-2013
Mto
e
Consumption Variation Activity Effect Structure Effect Value of Products Technical Savings Negative Savings due to Inefficient Operations

Energy Efficiency Trends and Policies in SPAIN 68
JESSICA-FIDAE11 Investment Fund and the aid programme to SMEs and large enterprises in the industrial sector. The JESSICA-FIDAE Fund is an investment fund in energy diversification and saving, implemented by the IDAE, and allocated with M€ 123, addressed to financing urban projects of energy efficiency and of renewable energy use, and developed by Energy Service Companies (ESCOs) as well as by Public Bodies. It was established as a result of a financing agreement signed between the European Investment Bank (BIE) and the IDAE on 1 July 2011. This action falls within the alternative package of measures as stated in article 7, section 9 of Directive 2012/27/EU to meet the binding saving objective set up in the above mentioned article 7. The industrial sector, together with the transport, building and infrastructure sectors, is one of those considered eligible sectors to finance energy efficiency projects through this fund. The SME and large companies’ aid programme for the industrial sector, integrated within the Action Plan 2014-2020, means to ease the energy efficiency improvement and implementation actions of energy management systems. This Programme, in force since May 2015, is allocated with an initial budget of M€ 49, stemming from the Energy Efficiency National Fund, created by law 18/2014 of 15 October, on the approval of urgent measures to enhance growth, competitiveness and efficiency. The measures and/or actions receiving aids through this programme are to fall within one of the following typologies: improvement of technology in industrial equipment and processes; and implementation of energy management systems. The field of action these measures are aimed at leaves out the energy extractive industry; the group activity of oil refinery and nuclear fuel treatment, and electric power generation, transport and distribution companies.
Patterns and Dynamics of Energy Efficiency Measure The analysis offered next on the evolution of energy efficiency measures implemented in the industry sector is based on the use of “spider graphs”. Diagrams of this kind show the evolution of measures all along the various time periods, and are categorised according to the following typology:
• Coop: Co-operative Measures • Cros: Cross-cutting with sector-specific characteristics • Fina: Financial • Fisc: Fiscal/Tariffs • Info: Information/Education/Training • Le/I: Legislative/Informative • Le/N: Legislative/Normative • Mark: New Market-based Instruments
The graphs represent both axes and categories. The distribution of the measures on each axis is related to the type of the former, which may be of a multi-dimensional kind, depending on the case. Therefore, the number stated on the legend does not need to correspond with the total number of real measures as it considers all the kinds of measures in its various dimensions. In any case, the important thing is to stand out the trends of the measures according to types, in line with the evolution shown on the various axes for each of the stated periods. This goes along with a
11 The Investment Fund on Energy Diversification and Saving (F.I.D.A.E.) is a JESSICA (Joint European Support for Sustainable Investment in City Areas) holding fund.

Energy Efficiency Trends and Policies in SPAIN 69
comparison of the typology trends of the adopted efficiency measures in the whole of the EU countries, as well as the implemented measures at central level from the European Commission. The efficiency measures in the Spanish industrial sector have traditionally focused on financial support. With the implementation of the Action Plans of the Energy Saving and Efficiency Strategy for Spain 2004-2012 (E4), other measures of a co-operative kind were implemented, such as voluntary agreements, and those of an informative kind (energy audits).
Figure 4.11: Development of Energy Efficiency Measures by type over time in the Industry Sector
“Ongoing” and “Completed” Measures
Source: MURE: http://www.measures-odyssee-mure.eu/radar_in.asp
In practice, the voluntary agreements have not worked as expected, and this is the reason why they have been discarded in the Action Plans implemented after the Strategy (E4). The EU countries display a similar pattern to Spain’s, with a predominance of financial support and informative measures along with a decreasing importance of co-operative measures. Unlike Spain, more importance is given to tool markets, which are missing in Spain. Comparing the Spanish measures and the ones in the whole of the EU countries at central level, the measures of an informative, legislative and co-operative kind have been prioritized.
Energy Efficiency Measure Evaluations: Semi-Quantitative Impact Estimates
The evaluation of the measure impact has been done bearing in mind both the expected impact and the impact achieved pursuant to the “Ex-ante” evaluation, as established in the framework of project ODYSSEE-MURE. According to this and depending on the relation between the expected energy saving, derived from the application of the industrial sector measure and the energy consumption envisaged in the said sector, three impact categories have been obtained in terms of energy
efficiency measures: low: < 0.1%; medium: 0.1-0.5%; and high: 0.5%. In the cases with no quantitative assessment of the measures, steps have been taken for a possible qualitative assessment of the impact on the basis of an expert judgment. Pursuant to the former, an impact valuation of the national measures on energy efficiency in the industry sector was made.
Spain EU- National Measures EU - Central Measures
MarkMarkMark
Le/NLe/N
Le/N
Coop CoopCoop
CrosCros Cros
FinaFinaFina
Fisc Fisc Fisc
InfoInfoInfo
Le/I Le/I Le/I

Energy Efficiency Trends and Policies in SPAIN 70
The MURE12 database holds as many as 17 application measures in the industrial sector, of which 10 have an impact assessment associated in quantitative terms. Most account for a medium-high impact. At present, the operational measures on the MURE database are three: the JESSICA-FIDAE Investment Fund; the SME and the industrial sector large company aid programme; and a third-party financing (TPF). This last measure had a considerable relevance in the past among the available financing modalities for energy efficiency projects in the industry sector undertaken by the IDAE. And in more recent times, it has tended to be displaced by a trade financing modality.
Figure 4.12: Semi-quantitative Impact Evaluation in Industry
Source: MURE/IDAE
12 The MURE Database holds a large collection with the most relevant application measures in the industry sector.
0
2
4
6
8
10
12
14
16
18
1985-2014_All >2000_All > 2000_ongoing
Low Medium High