energy demand and materials flows in the economy - deep blue: home
TRANSCRIPT

Energy Vol. 12. No. lO/ll, pp. 953-967, 1987 0360-5442/87 $3.00 +O.OO Printed in Great Britain Pergamon Journals Ltd
ENERGY DEMAND AND MATERIALS FLOWS IN THE ECONOMY
MARC ROSS,’ ERIC D. LARSON’ and ROBERT H. WILLIAMS’
‘Physics Department, University of Michigan, Ann Arbor, MI 48109, U.S.A. ‘Center for Energy and Environmental Studies, Princeton University, Princeton NJ 08544, U.S.A.
Abstract-Many forecasts show industrial energy use growing rapidly in industrial countries. These forecasts do not adequately take into account the diminishing importance of basic materials use in the economies of mature industrial societies, the emerging shift of production based on virgin materials to developing and resource-rich countries, and the increased recycling of materials. Since the processing of materials dominates industrial energy demand, this pattern of development will upset those forecasts. While energy use by industry will grow in such countries as China, Saudi Arabia. Korea, Canada, Brazil, Mexico, South Africa, and Australia, it will continue to decline or stagnate in the U.S., Europe, and Japan.
1. MATERIALS AND INDUSTRIAL ENERGY DEMAND
In recent years there has been a pronounced shift within the industrial sectors of major industrial countries away from the processing of basic materials toward the production of increasingly refined and complex goods. If this recent experience reflects a new trend, it has far-reaching implications for economic planners throughout the world.’
This experience also suggests slow future growth in industrial energy demand, because the industrial sectors that are growing most rapidly are not energy-intensive. In 1978, the basic materials processing industries (petroleum, primary metals, paper, chemicals, cement, etc.) in the U.S. accounted for two-thirds of industrial energy use but less than one-fifth of industrial value-added. They required an order of magnitude more energy to produce a dollar of value-added than was required in the rest of industry (Fig. 1).
This shift has been an important factor in the dramatic slowdown in the demand for energy by the industrial sector since 1973. We have analyzed this trend for the U.S.,’ disaggregating the 3.6% per year average annual decline in the ratio of industrial energy use to GNP, 1973- 1984, into two components: a shift of production from energy-intensive manufacture of materials to lighter industry, and a reduced energy intensity (e.g. energy use per tonne of steel produced). The results of this analysis are presented in Table 1, which shows that the decline was caused almost equally by the shift from materials production (1.6%/yr) and the decline in average energy intensity (2%/yr). The decline in energy intensity is similar for both the materials sector and the rest of industry.
To determine whether this recent experience marks the beginning of a new and different era of industrial growth or whether it is merely a fluctuation relative to a better established long-term trend, it is necessary to understand the factors underlying this recent experience.
This paper analyzes the recent trends and the future outlook for the basic materials processing industries and provides a preliminary assessment of the implications for future industrial energy use in the U.S.
2. MATERIALS CONSUMPTION
The lifecycle of a material in the economy3 a provides a convenient framework for analyzing the recent shift away from basic materials.’ At the beginning of this cycle, when a material is first introduced, consumption rates (in kilograms per capita per year) are low and there are vast markets. In this phase consumption grows rapidly, usually much more rapidly than average economic activity. This rapid growth encourages advances in processing technology that generally increase productivity, leading to lower prices and improved product quality, thus stimulating further demand growth. In the next stage of the cycle, more sophisticated products are made and the ratio of value-added to the
953

954 MARC Ross et al.
s

Energy demand and materials flows in the economy 955
quantity of material increases. Additional innovations make it possible to use the material more efficiently. In this phase the demand for the material measured in kilograms of material per dollar of GNP peaks and begins to decline, even though consumption in kilograms per capita may still be growing. In the final phase of the cycle, markets for the material in bulk become saturated and new markets are largely for specialty products that have little effect on total consumption. In this stage per capita consumption levels off and may even begin to decline.
This classic materials-use cycle is well illustrated by the long-term history of steel use in the U.S. (Fig. 2). The consumption of steel per real dollar of GNP has followed a bell- shaped curve, which peaked about 1920 and has now declined to the level that characterized the 188Os, about one-third of the peak value. The consumption of steel per capita has followed an S-shaped curve; it grew by about a factor of 10 from the 1880s to the 194Os, was then nearly constant and may now be entering a long-term decline.
Developments of the 1970s for major energy-intensive materials follow a similar pattern. Figure 3 shows, for a representative sampling of materials in the U.S., that by the 1970s consumption per dollar of GNP was declining and consumption per capita had stopped growing for most materials. This phenomenon seems to be occurring in Western Europe as well (Fig. 4).
Figure 5 shows essentially the same results for indices representing a large number of materials in the U.S. This figure also shows that the 1974-1975 and the 1980-1982 recessions were occasions for economic restructuring, since the ratio of materials use to GNP recovered only slightly from the recession lows.
The maturing of basic materials use in the U.S. can be attributed to several factors.’ Substitution of new materials is one factor that contributes to the decline of traditional materials. But, as shown in Fig. 3, it appears that consumption has peaked for many new basic materials as well.
t 250- T?
ab .
2 = 200 -
“4 .
. .
:a, . _ .- 150- .
‘e 0 =0
./
-*he .
.
gJJlOO- .* .
\
.
. CL .o E; 50-
:e cm 0’ I I I I I 1 I 1 I I
s .s x 500-
0 400 - .
/
.A
.E ;: . .
e; . ’
0% &j 8 300 - l . =cl .
.z E 2oo_ ‘a? Em
.i/’ .
22 g 2 IOO-
./* /
. .
. 0
0’ ’ ’ I I I I 1 I I I 1990 1990 1900 1910 1920 1930 1940 1950 1990 1970 1990
Fig. 2. A century of steel consumption in the U.S. Five-year averages are shown except for the latest (1983) points. The curves have been hand-fitted to the data. The data are for apparent consumption of steel mill products (net shipments plus net imports). Data for 1954 to the present are from the American Iron and Steel Institute; for earlier years from Ref. 30. Steel embodied in finished products traded (e.g. automobiles) is not included. Including such indirect consumption would raise steel use about 2% in the late 1970~~’ but by a negligible amount prior to the early
1960s.

956 MARC Ross et al.
GNP per capita (in 1983 dollars) 3000 4000 5000 6000 11000 14000
60- -6
-5
- Steel
ao_ - - - cement - - - Paper
- - Ammonia
500- --- - Chlorine
- Aluminium
4oo_s----* Ethylene
A-60
1990 1900 1910 1920 1930 1940 1950 1960 1970 1960
Year
Fig. 3. Trends in apparent materials consumption in the U.S.z~9 Data are 5-yr running averages.
.g
8
&
o 300
E z
g 5
400 1
200 /
100
..-.
..:*/ Ethylene -
01 I I I I I I JO
1950 1955 1960 1965 1970 1975 1960 1965
Fig. 4. Trends in apparent materials consumption in Western Europe. Plotted are 3-yr running averages of data for Germany, France, and the U.K.’ The ammonia data are for Germany and
France only.
A second factor is design changes involving more efficient materials use, in part as a strategy for coping with increased costs, especially energy costs, and in part as a response to competitive pressures from substitutes with more desirable properties. This competition

Energy demand and materials flows in the economy
120 r
951
Production
Materials per dollar of GNP I I
130 -
120 -
110 -
Production
60 v -.P Materials per capita
I I I I I I 1960 1965 1970 1975 1960 1965
Fig. 5. Aggregate indices of apparent materials consumption and production in the U.S. Tonnages of paper, steel, aluminum, petroleum refinery products, cement and a combination of 20 large- volume industrial chemicals, weighted by the energy-of-manufacture intensities from the late 1970s.
were chosen to represent the energy-intensive materials.*
has intensified technological advances such as higher strength-to-weight ratios or increased durability, permitting the same functions to be provided with less material inputs.
The saturation of major markets for materials-intensive products is also a major contributor to the slowdown in demand growth for basic materials. Materials-intensive infrastructure building (railroads, factories, highways) accounted for a large part of the economic activity in the 19th and early 20th centuries in the U.S., but now accounts for relatively little. More recently, affluence has led to saturation for most materials-intensive consumer products, so that the principal function of production for items such as the automobile and major household appliances (stoves, refrigerators, washers, dryers, water heaters, heating systems) is to replace retired units.
Shifting consumer preferences at high levels of affluence complements the saturation of markets for materials-intensive products as a relatively new contributor to the slowing of demand growth for basic materials. Marginal income is being spent, not on more of the same, but rather on a wide range of products characterized by a low ratio of material content to price (items such as home entertainment equipment, personal computers and related software, and recreational, physical fitness and medical services). We are seeing the emergence of an information-centered society, where growth is dominated by high- technology products with low materials intensities.
3. MATERIALS PRODUCTION
Until recently, the trend in materials production in the U.S. followed that for consumption rather closely, i.e. international trade did not have a major effect on materials production. The relationship of materials production to materials consumption in aggregate is indicated in Fig. 5, which shows that throughout the 1960s and into the 1970s consumption grew only slightly faster than production.
More recently, however, production has begun to shift to developing and resource-rich countries, the net result of which is that production in the U.S. (and other industrial
958 MARC Ross et al.
countries) will henceforth grow more slowly than demand, This is apparent from Fig. 5, which indicates that since 1982 the difference between aggregate material consumption and aggregate material production has been growing in the U.S.
Initially this shift to overseas production will involve mainly the most basic upstream products. Products such as steel in rough shapes, pulp and paper products such as linerboard (for the facing of shipping containers), industrial chemicals immediately derived from ethylene, and primary aluminum have become international commodities.
One factor underlying this shift is that improvements in shipping, especially larger ships and modernization of ports and materials-handling facilities, have substantially reduced costs, thereby changing the determinants of plant location for some basic materials.” Thus while the local availability of resources is still a critical factor in locating facilities dependent on hard-to-transport commodities such as methane, ethane, electricity, or wood, there is now much more flexibility in the siting of basic steel mills, because it has become relatively easy to transport coal, iron ore, and scrap.
Also, the role of these products as international commodities has been enhanced by the decreasing concentration of ownership of production facilities. l1 Although some new facilities are subsidiaries of established multinationals, there are many new independent firms, with developing country government ownership common. Many new entities have come into being in steel and aluminum and are being created in petrochemicals.
Many of the countries and regions that could compete with domestic manufacturers for four important materials in the U.S. market are listed in Table 2, along with a qualitative indication of the cost advantage or disadvantage relative to the U.S. and the main reason for it. Of the four industries only the U.S. paper industry has a strong international position. The U.S. faces tough competition for steel, ethylene, and aluminum.
These qualitative results are based primarily on information for new plants and/or plans for construction of additional capacity around the world. The situation has been confused because ambitious plans for steel (China, South Africa), petrochemicals (Alberta, Mid-East, Indonesia, China) and primary aluminum (Australia) have been wholly or partly postponed or cancelled in the last three or four years due to the slump in global demand and the debt problems of some developing countries. In many cases the planned expansion outpaced world demand. But when demand rises once again, most of these plans will probably be revived. Moreover, the threat that highly competitive production facilities can be created elsewhere will prevent major investment in these product areas in the U.S.
A likely course for U.S. producers is to yield certain upstream products to foreign producers gradually, while trying to secure their role in less capital-intensive downstream finishing and fabrication operations and in secondary industries based on recycled materials.
There is the potential for sizable growth, not in tonnage but in value terms, in markets for sophisticated materials such as high-strength steels, corrosion-resistant steels, composites and plastic-aluminum laminates. A plausible scenario would involve the future production of relatively unspecialized international commodities in large facilities at sites with advantages such as low prices for hard-to-transport inputs or low labor costs, but, in many cases, the finishing of these materials close to markets. In this scenario U.S. producers would have the advantage of being close to markets, although this in itself provides no assurance that the foreign competition can be beat in these new product areas.
As materials use patterns approach saturation, recycled materials can play a much larger relative role than is feasible in the earlier period of rapid demand growth. Indeed, manufacture based on recycled material is growing in importance in the U.S. Recycling has long been important for a relatively costly metal like copper, and for fabricator’s scrap, the highest quality recycled material. During the past 15 yr or so recycling of post-consumer steel and aluminum scrap has rapidly increased, as manufacturers have found profitable niches for products made from these materials. Paper recycling is also increasing and post- consumer recycling of plastics is beginning.
The energy savings are, in some cases, substantial. Making secondary aluminum requires only j-10% as much energy as primary aluminum. Steel-mill products made from scrap typically require about 50% as much energy as those made from iron ore. Recycling of

Energy demand and materials flows in the economy
Table 2. Cost position of important exporters and potential exporters to the U.S.
Haterial Cost advantage relative to the US Rationale
Steele Japan East-Asia Rim Canada, South Africa Brazil Europe Mexico, Venezuela
significant major marginal significant uncertain uncertain
high technology low-cost labor
low-cost labor subsidies low-cost labor, gas
Paper Canada Scandinavia Brazil USSR
similar costs C
disadvantags limited resources significant natural resources uncertain natural resources
_
Ethylene Canada Mid-East Mexico, Venezuela East-Asia Rim Indonesia, Australia
significant significant significant uncertain uncertain
natural resources natural resources natural resources
natural resources
-
Aluminum Canada Brazil Australia USSR Other
major hydropower ma) or significant
hydropower coal, gas
uncertain hydropower uncertain hydropower, flared gas
959
a All of these countries have some or many modern mills more productive than the US average, although Europe also has many antiquated mills.
b Relatively skilled labor and good infrastructure provide a major advantage.
C The potential for expansion is more limited than in the US.
d Expansion will be slow and only hardwood pulp is involved.
e Low-quality coal unsuited for export. Some analysts see significant cost advantages in Australia. Others see the opportunity dependent on help,
e.g., capital subsidies.
paper does not necessarily save energy; it depends on the quality of paper recycled and whether the alternative is burning or landfill (i.e. disposal as solid waste). The economics may depend on whether the landfill costs are included in the analysis.
4. A CLOSER LOOK AT FOUR MATERIALS
Since many of the shifts shown in Figs. 3-5 are recent, the statistics alone are insufficient evidence to determine whether these trends represent a fundamental structural shift or merely a temporary pause in a long-term growth trend. However, a closer examination of four of the basic materials-steel, ethylene and derivatives, aluminum, and pulp and paper-indicates that a fundamental structural shift is indeed underway.
A. Steel
Rising substitution for steel by lighter materials, production of steels with increasingly higher durability and strength-to-weight ratios, maturing markets for steel products, and growing preferences for high value-added, low steel-intensity products have all contributed

960 MARC Ross et al.
to the declining role of steel consumption in the U.S. The automotive market, accounting for 1520% by weight of steel shipments over the last decade, illustrates the patterns of change in the use of steel. While the automobile continues to dominate U.S. transportation, the number of cars per adult has leveled off at about 0.8, and new car sales are not expected to rise much beyond 1975-1978 levels through 1990.9 The net function of production today is to replace old cars. In addition, a general downsizing of automobiles and increased use of lighter materials have been the results of fuel economy regulations of the 1970s. The weight of the average U.S.-made car dropped from 1727 kg in 1975 to 1469 kg in 1984, and the iron and steel contribution dropped from 1139 kg to 802 kg in this period. Industry experts project total vehicle weight to decrease further to 1069 kg by 1992, with iron and steel dropping to 625 kg.9 To better compete for the tightening automotive market against makers of aluminum, plastic, fiberglass, and other high-strength, light-weight materials, the steel industry has begun to offer special steels, such as those with higher strength-to- weight ratios and those galvanized or coated for rust prevention. This trend is reflected in the increasing contribution from high-strength and stainless steels in the average car, which has risen from 5 to 13.5% since 1975 and is expected to rise to 23% by 1992.9 Still another factor affecting steel consumption by the automotive industry has been a trend toward longer vehicle ownership. While the average age of passenger cars in the U.S. hovered around 5.5-6.0yr from the late 1950s up to 1975, it rose steadily to 7.4yr by 1983.
There are new markets for steel in the U.S. and other industrial countries, but the new markets are largely for specialty steels for products characterized by a high ratio of value- added to steel content (electronic equipment, medical technology, etc.). For the world as whole, however, the outlook is for continued growth of steel demand, albeit at a rate somewhat slower than aggregate GNP, because per capita demand is low in developing countries (Table 3) and can be expected to continue growing rapidly.
Stagnant domestic demand is largely responsible for the fact that U.S. steel technology is antiquated, as are the associated institutions and perceptions. Since 1950 only two new or “greenfield” integrated mills have been built, the last in the 1960s. Building a greenfield mill doesn’t pay in the U.S., because the increased capital carrying charges exceed the reduced operating costs.
Some major renovations of existing mills are, however, cost-effective. Thus open hearth steel furnaces have been replaced with basic-oxygen shops, continuous casters have replaced much batch casting of ingots, and large blast furnaces have replaced some old, low capacity units. But this kind of modernization has also proceeded slowly in the U.S. These and other modern equipment items are much more thoroughly implemented in Japan than in the U.S. The U.S. industry lags even in areas requiring only modest investments, such as
Table 3. Annual consumption of steel,” aluminum, ethylene,b and paper in selected regions of the world in 1980, in kg/U.S.$lOO (kg/capita)
Material us Western Europe Africa, Asia C Latin Americad
Steel 5.82 (627) 5.59 (473) 7.3 (41)
Paper 3.5 (282) 1.6 (132) 1.4 (7.7)
Ethylene 0.56 (61) 0.45 (39) -0.1 (-0.9)
Aluminum 0.27 (30) 0.18 (15) -0.1 (-0.05)
a Crude steel basis.
b Production of ethylene.
c See ref. 2 for data sources.
d Excluding Japan and the USSR.
Energy demand and materials flows in the economy 961
the opportunities created by computer control developments and made profitable by higher energy prices1 2
In many other countries production costs are lower than in the U&i3 strikingly so, for example, in South Korea. In certain cases, such as in East Asia, plant construction is cheaper. In countries where the creation of basic manufacturing facilities is a priority of the government, the cost of capital (effective interest rate) may be lower. Labor costs are lower in many countries not only because hourly rates are lower but also because fewer man-hours are required per ton (in part because work rules are more flexible). Ore costs for mills located near new deep-water ports are lower than the U.S. average, compensating for the U.S. advantage in coal costs. l4 In addition, some foreign operations, e.g. at antiquated European mills, are directly subsidized. l5 These advantages and the high overseas buying power of the dollar have more than made up for the transportation cost differential.
Even if import restrictions continue, the cost advantage of some foreign producers and the threat of subsidized steel will probably prevent the infusion of capital needed to make the U.S. industry more competitive. Lack of technical effort in the U.S. is widening the gap. What options are open to the industry?
One strategy for the U.S. industry would be to accompany severe retrenchment in the upstream end of the process with imports of rough-shaped steel and modernization of shaping-finishing facilities. However, the Japanese are already modernizing their shaping- finishing facilities, so the U.S. industry will face stiff competition in this area as well. Nevertheless, revolutionary changes in these technologies are now imminent.16 If U.S. manufacturers make sound decisions relating to these new technologies and invest heavily, they could leapfrog many other steelmakers. However, since the U.S. integrated steel industry does not have a strong technological orientation, it is unlikely to adopt such a strategy. This strategy also leaves unresolved the problems of the front end of the process, the production of crude steel.
An alternative strategy would be joint ventures with Japanese firms to acquire technical expertise and secure technically oriented capital. The Japanese are interested in exporting manufacturing equipment for mature industrial sectors, realizing that the potential for growth of Japanese exports of the materials is limited by protective policies. A major uncertainty regarding this strategy is whether such ventures would be able to compete with producers in developing countries where labor costs are low.
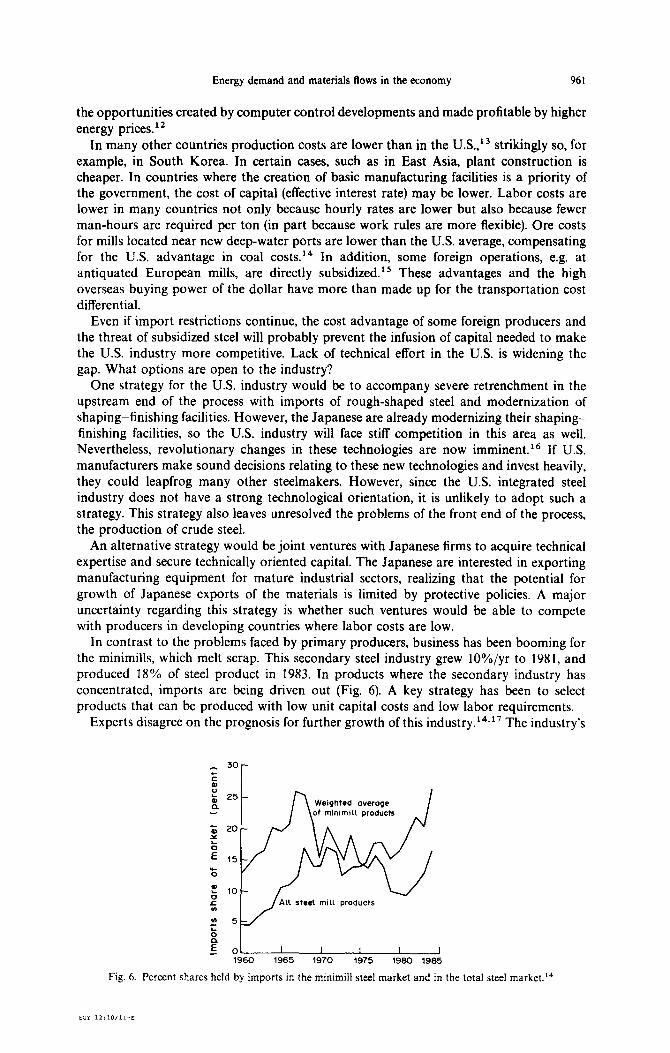
In contrast to the problems faced by primary producers, business has been booming for the minimills, which melt scrap. This secondary steel industry grew lO%/yr to 1981, and produced 18% of steel product in 1983. In products where the secondary industry has concentrated, imports are being driven out (Fig. 6). A key strategy has been to select products that can be produced with low unit capital costs and low labor requirements.
Experts disagree on the prognosis for further growth of this industry.14,” The industry’s
‘r Weighted overage
All steel mill products
1960 1965 1970 1975 1960 1965
Fig. 6. Percent shares held by imports in the minimill steel market and in the total steel market.“’

962 MARC Ross et al.
favorable position is largely built on the economic advantages of scrap compared to virgin material. The problem of copper impurities in scrap clouds the future outlook. Copper, a common contaminant in post-consumer scrap, tends to cause cracks in high-temperature forging, e.g. in hot rolling of sheet steel. If such limitations are not overcome, the secondary industry’s long-term growth rate would be low, with output restricted largely to products such as bars and light structural sections, which can be made of steel with significant impurities. However, new shaping and finishing technologies may enable the making of higher-quality products out of steel with considerable copper content, so that, for example, sheet steel to make automobiles could be made from automobile scrap. Or changes in scrapping procedures or auto design could greatly reduce the level of copper in steel scrap. Then secondary producers could continue their rapid growth and take a substantial part of the remaining market from the present integrated producers.
A different possibility would be to use direct-reduced or sponge iron as well as scrap for input. It is not clear that this would provide an economic advantage. In any case, the sponge iron would probably not be produced in the U.S. Since the favored technology uses natural gas, the primary areas for growth in sponge iron production are those now flaring natural gas,i8 or those with partly unexploited gas resources (e.g. Mexico, the Middle East, Nigeria).
B. Ethylene and derivatives
Ethylene, a major building block for many intermediate chemicals, is a good surrogate for organic chemicals generally. Ethylene came into wide use only after World War II. In the 25yr period between the end of World War II and the first oil shock, the production of ethylene in the U.S. grew almost five times as fast as GNP. Since the early 1970s however, the production of ethylene has been growing only about as fast as GNP (Fig. 3), as has the production of organic chemicals generally, with plastics used in packaging and construction leading the way.’ 9 Although markets for plastics continue to grow, a variety of developments, including changing process technologies and maturing product markets, signal an end to tonnage growth faster than GNP and an approach to the cessation in per capita demand growth.’
Linear low density polyethylene plastic, introduced in the late 1970s has allowed the use of thinner films in plastic products, saving up to half the resin while providing strength equivalent to conventional low-density polyethylene. The new product now accounts for over 35% of all low-density polyethylene produced and is expected to account for nearly 60% by 1990.
About 60% of ethylene oxide (which accounts for about 20% of all ethylene use) goes into antifreeze production and most of the rest to the manufacture of polyester fibers. Ethylene demand in these markets has been slowed by the maturation of the automobile market and the downsizing of cars discussed earlier, and by the maturation of markets for synthetic fibers. The demand for ethyl benzene, used largely to produce styrene, a basic component of styrene-butadiene rubber used in tires, was significantly affected by both the downsizing of cars and the introduction of radial tires in the 1970s. Tires weighed on average 25% less in 1983 than in 1972, and radials last about twice as long as ordinary bias-ply tires.
Western Europe and Japan consume ethylene and derivatives per dollar of GNP at about 80% of the U.S. level (Table 3). The rest of the world consumes ethylene and derivatives at a much lower rate. The growth rate for the world will continue to be faster than that for GNP.
Ethylene is made primarily from ethane, propane, and middle distillates; and major expansion in the use of heavier petroleum components as the feedstock has been contemplated. Ethane, a light hydrocarbon associated with oil and natural gas production, provides the cheapest route to ethylene (in terms of value-added). The high costs of ethane storage and transportation are good reasons for converting ethane for petrochemicals at the point of supply. Another is that a producer requiring ethane would typically be concerned about supply security, as there are relatively few suppliers.

Energy demand and materials flows in the economy 963
Substantial capacity to produce ethylene and basic derivatives such as polyethylene and other polymers, ethylene glycol, and ethyl alcohol is under construction or has recently been built near markets in the Far East and, to a greater extent, near resources in the Middle East, Canada, and Mexico. 2o Production is just now starting at huge facilities in Alberta and Saudi Arabia. Although the recent severe recession led to a stretching out of some of this construction, much of the planned capacity will be built.
Completion of planned ethylene-production facilities would substantially reduce the U.S. market share. In the medium term, U.S. exports of basic ethylene derivatives are likely to decline sharply. More important, the realization that large new plants can be built elsewhere to produce ethylene cheaply will inhibit the building of new plants here. Expectations of continued expansion of U.S. capacity will probably not be realized. New capacity based on heavy oils or crude oil will probably be long delayed.
What is true for ethylene and derivatives is also true for other basic organics. Materials that can be made directly from natural gas, like methanol and ammonia derivatives, are likely to be manufactured near isolated gas fields where gas is still flaredI or where gas supplies are not being exploited because the gas is too costly to move to markets.
C. Aluminum
The use of aluminum grew rapidly in the U.S. in the 1940s 50s and 60s. However, the consumption per dollar of GNP began to decline in the early 70s a trend which has been accelerating in the 80s. Moreover, per capita demand appears to have leveled off in the late 1970s (Fig. 3).
The largest single market for aluminum is containers and packaging, accounting for about 30% of all U.S. shipments, 80% of which goes into making beverage cans. Aluminum cans first appeared in consumer markets in the early 1960s and their use has grown phenomenally since. By 1981, they accounted for nearly 90% of all beverage cans.
In the transportation market, total shipments of aluminum grew only an average of 0.4%/yr from 1974 to 1984, although the transportation market has maintained about a 20% share of all aluminum use. This modest growth can be attributed in part to slowing growth in the use of aluminum in new cars since the mid 1970s a trend that industry experts expect will continue. Compounding this decline in growth is the approaching saturation in car ownership noted earlier.
Not only are these major markets maturing, but also reductions continue to be made in the material intensity of specific products. For example, thinner sidewalls have led to a 22% reduction in body weight of beverage cans since 1965, while the introduction of necking at the top of cans (among other changes) has reduced material requirements for the heavier, more expensive alloy used in the lids by about 13% over this same period.
Aluminum consumption per unit of real GNP in other industrial countries is some two- thirds of that in the U.S. (Table 3). Packaging applications make up most of that difference, and it is not clear how much that market will grow in those countries. For developing countries, however, the low per capita use rate and low aluminum-GNP ratio indicates future growth for aluminum use faster than GNP there. For the world aluminum demand growth slightly faster than or comparable to GNP is likely. Primary aluminum production in the U.S. will decline with respect to domestic consumption for two reasons: secondary production, which grew from 25 to 50% of primary production from 1970 to 1983, will continue growing rapidly; and imports of primary aluminum will increase.
Aluminum smelters being built in Australia, Canada, and Brazil” will be supplied with electricity from new power plants at under 2$/kWh.2 The sources are hydropower in Canada (e.g. the huge new James Bay project) and Brazil and remote surface coal in Australia. Underutilized natural gas is also a source of cheap electricity for new smelting capacity. Power contracts held by existing smelters outside the US provide for prices even lower than 2 $/kWh. Cheap electricity is important to aluminum producers because, roughly speaking, a 1 e/kWh price increase corresponds to a 10% increase in the cost of producing primary aluminum. Yet electrical rates in many parts of the U.S. are moving sharply upward toward the cost of power from new coal and nuclear plants, some 5$/kWh and
964 MARC Ross et al.
more. In the Gulf states, where 17% of the aluminum capacity is located, some smelters have already been closed as gas-fired power has become too expensive. Nuclear power investments and overcapacity have brought the electrical rates for smelters from the Tennessee Valley Authority to 3.7$/kWh. In the Pacific Northwest the price to smelters is 2.7e/kWh (although some power is temporarily available at a lower price); there the subject of who should enjoy the benefit of low cost hydro and who should pay for costly new plants is being fiercely contested by consumers. One of the few remaining favorable locations for smelters is the Ohio Valley, where low electrical demand growth may hold the real cost of coal-based power to smelters near the present 2.5 e/kWh average for some years.
In the next few years much more smelting capacity will probably be closed in the U.S. U.S. aluminum firms are joining in foreign projects, increasing their role in secondary aluminum production (where the recycling of aluminum cans is an important success story), and upgrading their domestic finishing operations.
D. Paper
The changing role of paper in the economy is reflected in the recently declining ratio of consumption to GNP (Fig. 3) which was preceeded by a steady rise up to about 1940 and then an extended period during which this ratio changed very little. Per capita consumption is continuing to grow, but much more slowly since the early 1970s.
Recent improvements in material efficiency in the production of large-volume products can be found in many sectors of the paper industry.’ For newsprint, which accounted for about 30% of paper consumption in 1982 (about 17% of total paper and paperboard consumption), there was a 6% reduction in basis weight (the weight of 500 sheets, 25 x 38” in size), from 32 to 301bs around 1974, and the industry is currently contemplating a further decrease to 28 lbs. Coated papers accounted for about 14% of paper consumption in 1982, with No. 5 coated groundwood, the lightest coated paper, accounting for about half the total tonnage. Because of its light weight and opacity (from the high lignin content), No. 5 coated groundwood is used extensively in magazines, catalogues, and for direct-mail advertising. Here rising postal rates have motivated significant reductions in basis weights: in 1968, less than 6% of No. 5 paper had basis weights less than 36lbs, but by 1979 the percentage had grown to 27%. In the last decade, the avera.ge density of bleached paperboard, widely used in food and pharmaceutical packaging applications and accounting for about 12% of all paperboard consumed, dropped some 15-20% due to process innovations that resulted in higher strength-to-weight ratios.
Some important paper markets have also matured. For example,22 the strongest growth market in the 1950s and 1960s was shipping containers (corrugated boxes), but by the early 1970s that market was saturated. Where few goods were so packaged for shipment in 1950, essentially all but large and bulk goods were by 1970.
Paper is the bright spot among the U.S. basic materials industries. Aggregate use of paper is growing, though not as rapidly as GNP (Fig. 3). Moreover, some product sectors are strong, especially computer and copying papers. 23 The paperless office is still a scheme for the future. More important, both the U.S. and Canadian industries have strong raw materials bases. Since wood logs and chips are relatively costly to ship, it pays to locate pulp mills near the wood resources. In many cases it also pays to locate large paper and board mills at the same site, although some drying and shipping of pulps is typically required to obtain the desired blend of materials. The U.S. is unique in combining the forests which can (with more intensive scientific management, including fertilization) support greatly expanded harvests with the needed skills and infrastructure.24.25
Strong growth in world demand is expected, creating major export opportunities for North American producers. At present, Scandinavian producers have the advantage in international pulp and paper trade because of the very high valuation of the dollar, but Scandinavian wood resources and, therefore, pulp and paper production are limited. Most countries have their own paper industries and supply much of their needs. They import primarily linerboard, the high-strength facing from which corrugated shipping containers

Energy demand and materials flows in the economy 965
are made, and the high-quality pulp they use to make a wide variety of products in their own papermills. The U.S. industry has focused primarily on these two exports. Sharply increased world demand and aggressive product development and marketing would lead to growth in exports of a variety of paper products by the U.S.
5. INDUSTRIAL ENERGY DEMAND IN THE YEAR 2000
The above analysis shows that the experience of the basic materials industries during the last decade does indeed signal a new trend for the industrial economies. We now provide a preliminary indication of the implications of this trend for future industrial energy requirements in the U.S.
Consumption of industrial products can be related to a projection of GNP. If GNP were to grow an average of 2S%/yr from 1984 to 2000, then we project that the output of all industry (measured by the value-added index, “gross product originating”) will grow 0.83 x 2.5 = 2.l%/yr, following its historical relation to GNP.
The present analysis indicates that this growth will be predominantly in sectors other than the basic materials processing industries. A reasonable assumption, which reflects the trends shown in Figs. 3 and 5 and the factors underlying these trends, is that materials consumption will grow no faster than population (projected by the Bureau of the Census to grow about 0.8%/yr). While projections made with macroeconomic models of the U.S. economy are usually higher, such projections (based on regression analyses of the past 30 yr and on an input-output table of the 1970s economy) exaggerate the role of materials.
The next step in our projection concerns the rise in net imports of materials. As materials manufacturing is capital intensive, the shift away from energy-intensive manufacturing in the U.S. will take time. Over a decade or two another 25% of the primary metals industry in the U.S. may be shut down. The organic chemicals industry may see its net export balance turn into a corresponding net import balance. The most certain development is that new facilities to manufacture the upstream products from virgin materials will not be built in the U.S.
For paper, the bright spot of the US. basic materials sector, the opportunities for continuing export strength are good, and would be improved with further technical development and a more favorable exchange rate. This more rosy outlook is part of a larger strength: soil and climate, infrastructure, and some technical virtuosity make the agricultural and forestry sectors and those industries based on them very strong in the U.S.
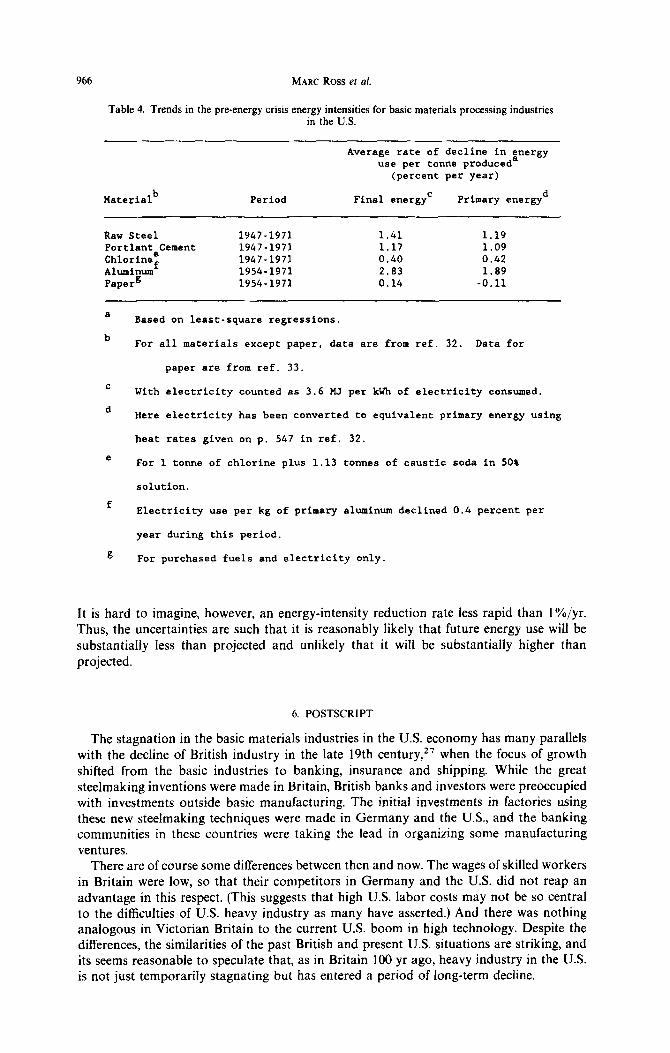
Shifts of basic materials manufacture along these lines, when weighted by energy of manufacture, roughly imply zero growth for aggregate materials production in the U.S. for the period to 2000.2 For this period we expect that, in the absence of powerful new public policies or events affecting industrial energy use, the energy intensity of industry will decline at an average rate of l-2%/yr. The lower rate was typical of many industries in the era before the energy crisis (Table 4). In that era and earlier, energy intensities declined even as energy prices fell, because the process of technological innovation tended to select innovations that improved many factors of production simultaneously.26 The 2%/yr rate would involve continuing the trend since the 1973 oil embargo. This might continue because there are many remaining cost-effective opportunities for more efficient energy use.
With zero growth in aggregate materials production and a continued decline in energy intensity averaging 2%/yr, absolute industrial energy use in 2000 would be 0.86 times that in 1984. If the rate of decline in energy intensity averaged 1 %/yr to 2000, industrial energy use in 2000 would be 1.01 times as large as in 1984. There are of course uncertainties underlying this projection. While slightly faster GNP growth and slightly slower decline of consumption of materials with respect to GNP would not be surprising, slower GNP growth and faster expansion of net imports would also not be surprising and are perhaps more likely. Similarly, still higher energy prices and possible new public policies over a period of this length could induce a higher rate of reduction in energy intensity than 2%/yr.
966 MARC Ross et al.
Table 4. Trends in the pre-energy crisis energy intensities for basic materials processing industries in the U.S.
Average rate of decline in gnergy use per tonne produced
(percent per year)
Materialb Period Final energy' Primary energyd
Raw Steel 1947-1971 1.41 1.19 Portlant Cement 1947-1971 1.17 1.09
Aluminumf Chlorinee 1947-1971 1954-1971 0.40 2.83 0.42 1.89 PapeG 1954-1971 0.14 -0.11
a
b
Based on least-square regressions.
For all materials except paper, data are from ref. 32. Data for
c
d
With
Here
heat
paper are from ref. 33.
electricity counted as 3.6 MJ per
electricity has been converted to
rates given on p. 547 in ref. 32.
kWh of electricity consumed.
equivalent primary energy using
e For 1 tonne of chlorine plus 1.13 tonnes of caustic
solution.
soda in 50%
f 0.4 percent per
g
Electricity use per kg of primary aluminum declined
year during this period.
For purchased fuels and electricity only.
It is hard to imagine, however, an energy-intensity reduction rate less rapid than l%/yr. Thus, the uncertainties are such that it is reasonably likely that future energy use will be substantially less than projected and unlikely that it will be substantially higher than projected.
6. POSTSCRIPT
The stagnation in the basic materials industries in the U.S. economy has many parallels with the decline of British industry in the late 19th century,” when the focus of growth shifted from the basic industries to banking, insurance and shipping. While the great steelmaking inventions were made in Britain, British banks and investors were preoccupied with investments outside basic manufacturing. The initial investments in factories using these new steelmaking techniques were made in Germany and the U.S., and the banking communities in these countries were taking the lead in organizing some manufacturing ventures.
There are of course some differences between then and now. The wages of skilled workers in Britain were low, so that their competitors in Germany and the U.S. did not reap an advantage in this respect. (This suggests that high U.S. labor costs may not be so central to the difficulties of U.S. heavy industry as many have asserted.) And there was nothing analogous in Victorian Britain to the current U.S. boom in high technology. Despite the differences, the similarities of the past British and present U.S. situations are striking, and its seems reasonable to speculate that, as in Britain 100 yr ago, heavy industry in the U.S. is not just temporarily stagnating but has entered a period of long-term decline.

Energy demand and materials flows in the economy 967
Acknowledgements-One of us (MR) wishes to acknowledge the support of the Special Projects and Industrial Applications Group, Energy and Environmental Systems Division, Argonne National Laboratory; the others (EDL, RHW), support from the Alida and Mark Dayton Charitable Lead Trust, the Macauley and Helen Dow Whiting Foundation, and the World Resources Institute.
1. 2.
3. 4.
5. 6.
7. a. 9.
10. 11.
12.
13.
14. 15. 16. 17. 18.
19. 20. 21. 22. 23. 24. 25. 26.
27. 28.
29.
30.
REFERENCES
P. F. Drucker, Foreign Aflairs 768 (Spring 1986). M. Ross, E. D. Larson and R. H. Williams, “Energy Demand and Materials Flows in the Economy”, PUjCEES Report, 193, Center for Energy and Environmental Studies, Princeton University, Princeton, N.J. (1985). S. Kuznets, Secular Movements in Production and Prices. Houghton Mifflin, Boston (1930). D. H. Meadows, D. L. Meadows, J. Randers and W. W. Behrens, The Limits to Growth. Universe, New York (1972). W. W. Rostow, The World Economy: History and Prospect. University of Texas Press, Austin (1978). W. Malenbaum, World Demand for Raw Materials 1985 and 2000. E/MJ Mining Information Services, McGraw-Hill, New York (1978). W. S. Humphrey and J. Stanislaw, Energy Policy 29 (March 1979). L. A. Girifalco, J. Resource Mgt Technol. 12, 191 (1983). E. D. Larson, R. H. Williams and A. Bienkowski, “Material Consumption Patterns and Industrial Energy Demand in Industrialized Countries”, PU/CEES Report 174, Center for Energy and Environmental Studies, Princeton University, Princeton, N.J. (1984). C. Kindelberger, Foreign Trade and the National Economy. Yale University Press, New Haven, Corm. (1966). R. Vernon, Two Hungry Giants, The United States and Japan in the Quesrfor Oil and Ores. Harvard University Press, Cambridge, Mass. (1983). “Industrial Investment in Energy Efficiency: Opportunities, Management Practices, and Tax Incentives”, Alliance to Save Energy, Washington, D.C. (1983). R. W. Crandall, The U.S. Steel Industry in Recurrent Crisis, The Brookings Institution, Washington, DC. (1981). D. F. Barnett and L. Schorsch, Steel: Upheaval in a Basic Industry. Ballinger, Cambridge, Mass. (1983). W. T. Hogan, World Steel in the 1980s: A Case of Suruioal. Lexington, Lexington, Mass. (1983). J. Szekely, Steel Times 551 (November 1983). C. C. Schueppert, Br. Steelmaker 48, 10 (1982). Energy Information Administration, “The International Energy Annual”, U.S. Department of Energy, DOE/EIA 0219, Washington, D.C. (1983). “Facts and Figures of the Plastics Industry”, The Society of the Plastics Industry, New York (1980). “HP1 Construction Boxscore”, Hydrocarbon Processing (February, October 1983). R. Berk et al., Aluminum: Profile of the Industry, Metals Week. McGraw-Hill, New York (1982). M. H. Ross and A. H. Purcell, Resources Policy 7, 235 (1981). Statistics of Paper, Paperboard and Wood Pulp, American Paper Institute, New York (1983). Office of Technology Assessment, Energyfrom Biological Processing, U.S. Congress, Washington, D.C. (1980). H. E. Young, J. appl. Polymer Sci. 37, 549 (1983). C. A. Berg, “Energy Conservation in Industry: the Present Approach, the Future Opportunities”, report prepared for the President’s Council on Environmental Quality,Washington, D.C. (19%). F. Crouzet, The Victorian Economy. Chapter 12. Columbia Universitv Press. New York (1982). Solar Energy Research Institute, -A New Prosperity, Building a Susiainable Future. Brickhouse, Andover, Mass. (1981). Bureau of Economic Analysis, “Gross Product by Sector or Industry of Origin”, computer printout covering 1947-1983, U.S. Department of Commerce, Washington, D.C. (1984). Bureau of the Census, Historical Statistics of the U.S. from Colonial Times to 1970. US. Department of Commerce, Washington, DC. (1975).
31. Committee on Economic Studies, Indirect Trade in Steel-1962 to 1979. International Iron and Steel Institute. Brussels (1982).
32. The Conference Board, Energy Consumption in Manufacturing. Ballinger, Cambridge, Mass. (1974). 33. Bureau of the Census, 1972 Census of Manufactures. U.S. Department of Commerce, Washington, DC.
(1973).