energy conversion in purple bacteria photosynthesis - … · · 2011-07-04energy conversion in...
TRANSCRIPT

1
Energy conversion in Purple Bacteria PhotosynthesisChapter to appear in Photosynthesis, INTECH, 2011
Felipe Caycedo-Soler1,2, Ferney J. Rodrıguez2, Luis Quiroga2,Guannan Zhao3 and Neil F. Johnson3
1Ulm University, Institute of Theoretical Physics, Ulm,Germany2Departamento de Fısica, Universidad de los Andes, Bogota, Colombia
3Department of Physics, University of Miami, Coral Gables, Miami, Florida, USA
Introduction
The study of how photosynthetic organisms convert light offers insight not only into nature’s evolutionary process,but may also give clues as to how best to design and manipulate artificial photosynthetic systems – and also how farwe can drive natural photosynthetic systems beyond normal operating conditions, so that they can harvest energyfor us under otherwise extreme conditions. In addition to its interest from a basic scientific perspective, therefore,the goal to develop a deep quantitative understanding of photosynthesis offers the potential payoff of enhancing ourcurrent arsenal of alternative energy sources for the future.
In the following Chapter, we consider the excitation dynamics of photosynthetic membranes in Rps. Photometricumpurple bacteria. The first studies on purple bacteria photosynthetic membranes were concerned with the complexunderlying detailed structure [19, 27, 32, 45]. The interested reader might find helpful the first section of this chapterwhere we present a summary of structures and processes that allow photosynthesis in purple bacteria. As improvedresolution became available for light-harvesting structures, so too the community’s interest increased in understandingthe details of the rapid femto- to picosecond timescales for the excitation transfer process within a given harvestingcomplex – even to the regime where quantum effects are expected. Indeed such quantum effects have recently beenconfirmed in, for instance, the Fenna-Matthews-Olson complex of green sulfur bacteria [9]. However, the processesoccurring at this level of detail in terms of both structure and properties of the excitation harvesting, have not yet beenshown as being crucial to the performance of the full harvesting membrane, nor with the primary goal of any givenphotosynthetic organism: to fuel its metabolism. We focus on the transfer among different complexes, in particular theinter-complex excitation transfer. We consider first a system of few complexes in order to understand the consequenceson the dynamics of the complexes’ connectedness. We also consider the relative amounts of harvesting complexes(i.e. stoichiometry) on small sized networks in order to help establish our understanding of the behavior of completechromatophore vesicles.
As a whole, chromatophore vesicles comprise sections of the purple bacteria cytoplasmic membrane where a largenumber of harvesting complexes accommodate. The current capabilities to dissect these vesicles on the nanoscalethrough Atomic Force Microscopy (AFM) has provided evidence of changes in the conformation of chromatophoresas a result of different environmental conditions. According to Ref.[34] , membranes grown under Low Light Intensity(LLI, 10 Watt/m2) present a relative amount of harvesting complexes which is different to the stoichiometry observedfor bacteria grown under High Light Intensity (HLI, 100 Watt/m2), thereby pinpointing the importance of globalchanges in the complete vesicles as an important means of fulfilling the bacteria’s metabolic requirements. In order tostudy these global conformational changes – given the fact that the inter-complex transfer time-scale involves severalpicoseconds and the excitation delocalization length is not expected to be beyond a single harvesting complex – wechoose a model of excitation dynamics which is based on a classical random walk. This random walk is coupled tothe main processes leading to electron/chemical energy transformation, and hence the bacteria’s metabolic demands.
This Chapter is organized as follows. Section 1 provides a review of the basic structures involved in excitationtransfer, along with a summary of the processes required for electron/chemical energy conversion. A discussion of thedynamics of excitations in a few model architectures is explored in section 2, in order to understand the results fromcomplete LLI and HLI adapted chromatophores in section 3 and to guide our development of an analytical model insection 4 for determining both the efficiency and power output of any given chromatophore vesicle under arbitrarylight intensity regimes. Lastly, in section 5 we explore the effect of incident light with extreme photon arrival statistics,on the resulting electronic/chemical energy conversion, in order to heuristically provide a survivability margin beyondwhich terrestrial bacteria could not survive. This is motivated by the fact that one day, it may be necessary to sendsimple bacteria into deep space and/or cope with extreme photon conditions here on Earth as a result of a catastrophicsolar change.
arX
iv:1
107.
0191
v1 [
cond
-mat
.sof
t] 1
Jul
201
1

2
FIG. 1: Representation of a lake containing both aerobic and anaerobic phototrophic organisms. Note that purple bacterialphotosynthesis is restricted to the lower anaerobic layer and so they only receive solar energy that has been filtered, mainly bychlorophylls belonging to algae, cyanobacteria and plants.
1. Important processes for solar/chemical energy conversion
Purple bacteria sustain their metabolism using photosynthesis in anaerobic conditions and under the dim lightexcitation proper of several meters deeps at ponds, lagoons and streams [30]. As depicted in Fig.1, aerobic organismsare present near the surface of water reservoirs, collect blue and red spectral components of sun’s light, leaving onlythe green and far red (> 750nm) components, from where purple bacteria must fulfill their energy requirements.
The light energy absorption is accomplished through intracytoplasmic membranes where different pigment-proteincomplexes accommodate. Light Harvesting complexes (LHs) have the function of absorbing light and transfer it toReaction Centers (RCs), where a charge separation process is initiated [7]. The unpaired charge reduces a quinone,which using a periplasmic hydrogen, converts to quinol (QBH2). RCs neutrality is restablished thanks to cytochromecyt charge carrier, which after undocking from the RC, must find the bc1 complex to receive an electron and startits cycle all over again. The electron in bc1 is given due to cytoplasmic Quinol delivery in bc1. The proton gradientinduced by the charge carriers cycling becomes the precursor of adenosyn triphosphate (ATP) synthesis: ADP+P→ATP+Energy, where ADP and P refer respectively, to adenosine diphosphate and phosphorous. The cycle is depictedin Fig.2.
1.1 Harvesting function
Light absorption occurs through organic molecules, known as chromophores, inserted in protein complexes. Bacte-riochlorophyls (BChl) and carotenoids (Car) chromophores are the main absorbers in purple bacteria photosynthesis,principally in the far red and green, respectively. The light absorption process occurs through chromophore’s Qyelectronic transition excitation. Several chromophores are embedded in protein helices, named α and β apoproteins,inside complexes, classified by their absorption spectral maximum. Light Harvesting complex 2 (LH2) reveals twoconcentric subunits that according to their absorption maxima are called B800 or B850, composed of nine pairsof apoproteins [27] comprising an inner α-helix and an outer β-helix both crossing the harvesting membrane fromperiplasm to cytoplasm, in an αβ unit that serves to anchor a highly interacting B850 dimer and one B800 chro-mophore. Hence, the B800 is composed of nine chromophores, while B850 include eighteen BChla chromophores,having dipole moments parallel and nearly perpendicular to the membrane plane, respectively. Raman spectra usingdifferent excitation wavelength [13] and stoichiometry analysis [1], indicated that one carotenoid (Car) is present pereach αβ unit. Light Harvesting complex 1 (LH1) absorbs maximally at 883 nm, and contain 32 BChls, arranged in 16bi-chromophore αβ units, surrounding an RC [22] in the same geometrical arrangement as B850 chromophores. An

3
FIG. 2: Schematic representation of the photosynthetic apparatus in the intracytoplasmic membrane of purple bacteria. Thereaction center (RC, red) is surrounded by the light-harvesting complex 1 (LH1, green) to form the LH1+RC complex, which issurrounded by multiple light-harvesting complexes (LH2s) (blue), forming altogether the photosynthetic unit (PSU). Photonsare absorbed by LHs and excitation is transferred to the RC initiating a charge (electron-hole) separation. Electrons areshuttled back by the cytochrome c2 charge carrier (blue) from the ubiquinone-cytochrome bc1 complex (yellow) to the RC. Theelectron transfer across the membrane produces a proton gradient that drives the synthesis of ATP from ADP by the ATPase(orange). Electron e− is represented in blue, and quinones QB , likely confined to the intramembrane space, in black.
RC presents a highly interacting dimer, the special pair (P), that is ionized due to the electronic excitation transferredfrom the surrounding LH1.
The complexes’ photon absorption cross section has been calculated for LH1 and LH2 complexes, where all absorbingmolecules and extinction coefficients [12] have been taken into account. A photon of wavelentht λ, is part of the powerspectrum of a source with occupation numbers n(λ). Normalized to 18 W/m2 intensity, the rate of photon absorptionfor circular LH1 complexes in Rb. sphaeroides [14]:
γA1 =
∫n(λ)σLH1(λ)dλ = 18s−1. (1)
The same procedure applied to LH2 complexes, yields a photon capture rate of γA2 = 10s−1. Since these rates arenormalized to 18 W/m2, the extension to arbitrary light intensity I is straightforward. The rate of photon absorptionnormalized to 1 W/m2 intensity, will be γ1(2) = 1(0.55)s−1. From now on, subindexes 1 and 2 relate to quantitiesof LH1 and LH2 complexes, respectively. Vesicles containing several hundreds of complexes will have an absorptionrate:
γA = I(γ1N1 + γ2N2) (2)
where N1(2) is the number of LH1 (LH2) complexes in the vesicle.
1.2 Excitation transfer
Excitation transfer happens through Coulomb interaction of electrons, excited to the Qy electronic transition inchromophores. The interaction energy can be formally written [41]:
Vij =1
2
∑m,n,p,q
∑σ,σ′
〈φmφn|V |φpφq〉c+mσc+pσ′cqσcnσ, (3)

4
where c+mσ, cnσ′ are fermion creation and annihilation operators of electrons with spin σ and σ′, in the mutuallyorthogonal atomic orbitals φm and φn. The overlap 〈φmφn|V |φpφq〉 is the Coulomb integral:
〈φmφp|V |φnφq〉 =
∫ ∫d~r1 d~r2 φ
∗m(~r1 − ~ri)φp(~r1 − ~ri)
e2
|~r1 − ~r2|φ∗n(~r2 − ~rj)φq(~r2 − ~rj) (4)
that accounts on inter-molecular exchange contribution when donor and acceptor are at a distance comparable tothe extent of the molecules, and the direct Coulomb contribution for an electron that makes a transition betweenφm and φp, having both a finite value near the position of the donnor ~r1 ≈ ~rD, while another electron is excitedbetween φn and φq at the acceptor coordinate ~r2 ≈ ~rA. In this latter situation, a commonly used framework concernsa tight-binding Hamiltonian, where details in the specific molecular orbitals |φn〉 involving mainly the Qy orbitals isleft aside, and emphasis relies on occupation with a single index labeling an electronic state |i〉 concerning occupationin a given chromophore. The Hamiltonian H in the chromophore site basis |i〉,
H = ε∑i
|i〉〈i|+∑i,j
Vij |i〉〈j| (5)
has diagonal elements 〈i|H|i〉 = ε, concerning the energy of the excitation, usually measured from the ground electronicstate. Neighboring chromophores are too close to neglect their charge distribution and its interaction is determinedsuch that the effective Hamiltonian spectrum matches the spectrum of an extensive quantum chemistry calculation[18]. In the LH2 complex, the B850 ring, with nearest neighbors coupling 〈i|H|i + 1〉 = 806 cm−1 or 377 cm −1 forchromophores respectively, within or in different neighboring αβ units. For next-to-neighboring chromophores thedipole-dipole approximation is usually used,
〈i|H|j〉 = Vij = C
(~µi · ~µjr3ij
− 3(~rij · ~µi)(~rij · ~µj)r5ij
)with i 6= j, i = j 6= ±1 (6)
where ~µi is the dipole moment and r is the distance between the interacting dipoles with constants: ε = 13059 cm−1
and C = 519 044 A3 cm−1. The LH1 complex has a spectrum maximum near 875 nm, with inter-complex distances andnearest neighbor interactions equal to the ones provided in the B850 LH2 ring. The molecular nature of chromophoresinvolve vibrational degrees of freedom that provide a manifold within each electronic states which should be accounted.However, given these parameters within a harvesting complex, intra-complex energy transfer involves sub-picosecondtime-scales, that imply relevance of electronic quantum features over the influence of thermalization in the vibrationalmanifold. If decoherence sources are not important within the time-scale of excitation dynamics on donor or acceptoraggregates, they can be known from the eigenvector problem H|φk〉 = Ek|φk〉 whose solution provides excitonic fullydelocalized states
|φk〉 =∑n
ak,i|i〉 (7)
considered to best describe the B850 ring. A slightly less interaction strength allows thermalization through thevibrational manifold in comparable time-scales, degrading delocalization in the B800 ring over 2-3 pigments, however,able to improve robustness of B800→B850 energy transfer [20].
The fact that states involved in excitation transfer in molecules include the vibrational manifold, makes enormous theHilbert space over which the sums of eq.(3) should be formally performed. When the transfer occurs with chromophoresthat belong to different complexes, say inter-complex energy transfer, rapid thermalization out stands direct Coulombmechanism, and no defined phase relationship between donor and acceptor electronic states is expected. The hermitiannature of excitonic exchange is replaced due to decoherence, by a rate to describe electronic excitation transfer withinthermalization in the vibrational manifold. According to Fermi’s golden rule, adapted to the vibrational continuum,the rate of transfer is given by [17]:
kDA =2π
h
∫dE
∫EA0
dwA
∫ED∗
0
dw∗Dg∗D(w∗D) exp(−w∗D/kBT )
Z∗D
gA(wA) exp(−wA/kBT )
ZA|UDA|2
(8)
interpreted as a the sum of Coulomb contributions from electrons at donnor (D) and acceptor (A) aggregates inground or excited states (these latter dennoted by ∗), UDA = 〈ΨD∗ΨA|VDA|ΨDΨA∗〉, weighted by Boltzmann factor
5
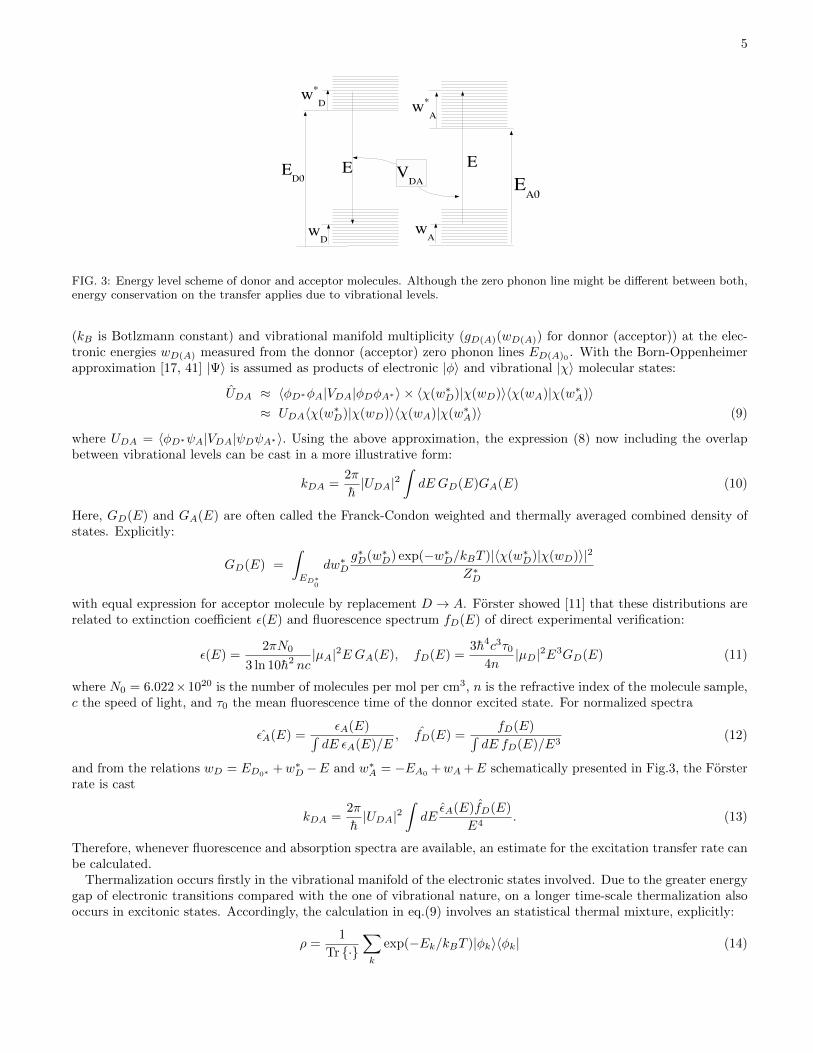
FIG. 3: Energy level scheme of donor and acceptor molecules. Although the zero phonon line might be different between both,energy conservation on the transfer applies due to vibrational levels.
(kB is Botlzmann constant) and vibrational manifold multiplicity (gD(A)(wD(A)) for donnor (acceptor)) at the elec-tronic energies wD(A) measured from the donnor (acceptor) zero phonon lines ED(A)0 . With the Born-Oppenheimerapproximation [17, 41] |Ψ〉 is assumed as products of electronic |φ〉 and vibrational |χ〉 molecular states:
UDA ≈ 〈φD∗φA|VDA|φDφA∗〉 × 〈χ(w∗D)|χ(wD)〉〈χ(wA)|χ(w∗A)〉≈ UDA〈χ(w∗D)|χ(wD)〉〈χ(wA)|χ(w∗A)〉 (9)
where UDA = 〈φD∗ψA|VDA|ψDψA∗〉. Using the above approximation, the expression (8) now including the overlapbetween vibrational levels can be cast in a more illustrative form:
kDA =2π
h|UDA|2
∫dE GD(E)GA(E) (10)
Here, GD(E) and GA(E) are often called the Franck-Condon weighted and thermally averaged combined density ofstates. Explicitly:
GD(E) =
∫ED∗
0
dw∗Dg∗D(w∗D) exp(−w∗D/kBT )|〈χ(w∗D)|χ(wD)〉|2
Z∗D
with equal expression for acceptor molecule by replacement D → A. Forster showed [11] that these distributions arerelated to extinction coefficient ε(E) and fluorescence spectrum fD(E) of direct experimental verification:
ε(E) =2πN0
3 ln 10h2 nc|µA|2EGA(E), fD(E) =
3h4c3τ04n
|µD|2E3GD(E) (11)
where N0 = 6.022×10²⁰ is the number of molecules per mol per cm3, n is the refractive index of the molecule sample,c the speed of light, and τ0 the mean fluorescence time of the donnor excited state. For normalized spectra
εA(E) =εA(E)∫
dE εA(E)/E, fD(E) =
fD(E)∫dE fD(E)/E3
(12)
and from the relations wD = ED0∗ +w∗D −E and w∗A = −EA0 +wA +E schematically presented in Fig.3, the Forsterrate is cast
kDA =2π
h|UDA|2
∫dE
εA(E)fD(E)
E4. (13)
Therefore, whenever fluorescence and absorption spectra are available, an estimate for the excitation transfer rate canbe calculated.
Thermalization occurs firstly in the vibrational manifold of the electronic states involved. Due to the greater energygap of electronic transitions compared with the one of vibrational nature, on a longer time-scale thermalization alsooccurs in excitonic states. Accordingly, the calculation in eq.(9) involves an statistical thermal mixture, explicitly:
ρ =1
Tr {·}∑k
exp(−Ek/kBT )|φk〉〈φk| (14)

6
where Tr {·} is trace of the numerator operator, used to normalize the state. Hence, in a straightforward fashion
UDA = Tr{ρVDA} =1∑
k exp(−Ek/kBT )
∑k
∑p
exp(−Ek/kBT )〈φk|VDA|φp〉
=1∑
k exp(−Ek/kBT )
∑k,p,i,j
ak,ia∗p,jVij (15)
where the element 〈φk|VDA|φp〉 are the elements of interaction among exciton states in molecules on different complexesand use is made of the individual contributions of excitonic states in chromophore’s site basis eq.(7).
Summarizing, excitation transfer occurs through induced dipole transfer, among BChls transitions. The commoninter-complex BChl distances 20-100 A [2, 34] cause excitation transfer to arise through the Coulomb interaction onthe picosecond time-scale [17], while vibrational dephasing destroys coherences within a few hundred femtoseconds[23, 29]. As noted, the Coulomb interaction as dephasing occurs, makes the donor and acceptor phase become uncor-related pointing into a classical rate behavior. Transfer rate measures from pump-probe experiments agree with thejust outlined generalized Forster calculated rates [17], assuming intra-complex delocalization along thermodynamicalequilibrium. LH2→LH2 transfer has not been measured experimentally, although an estimate of t22 = 10 ps has beencalculated [17]. LH2→ LH1 transfer has been measured for R. Sphaeroides as t21 = 3.3ps [16]. Due to formationof excitonic states [21], back-transfer LH1→ LH2 is enhanced as compared to the canonical equilibrium rate for atwo-level system, up to a value of t12 = 15.5ps. The LH1→LH1 mean transfer time t11 has not been measured, butthe just mentioned generalized Forster calculation [31] has reported an estimated mean time t11 of 20 ps. LH1→RC transfer occurs due to ring symmetry breaking through optically forbidden (within ring symmetry) second andthird lowest exciton lying states [18], as suggested by agreement with the experimental transfer time of 35-37 ps at77 K [43, 44]. Increased spectral overlap at room temperature improves the transfer time to t1,RC = 25 ps [42]. Aphoto-protective design makes the back-transfer from an RC’s fully populated lowest exciton state to higher-lyingLH1 states occur in a calculated time of tRC,1 =8.1 ps [18], close to the experimentally measured 7-9 ps estimatedfrom decay kinetics after RC excitation [40].
Table I shows the results of mean transfer times presented in Ref.[31] through the above mentioned calculation,compared with the experimental evidence restricted to different complex kind from the spectral resolution requirementof pump-probe spectroscopy. Since LH1↔ LH1 and LH2↔ LH2 transfer steps involve equal energy transitions, noexperimental evidence is available regarding the rate at which these transitions occur. The experimentally determinedB800→ B850 rate was 1/700fs [38]. The inter-complex transfer rate between LH2→ LH1 have been determinedexperimentally to be 1/3.3ps [16]. Experimentally, LH1↔ RC forward transfer rate ranges between 1/50ps and1/35ps, while back-transfer rate ranges between 1/12ps and 1/8ps [39, 40, 43]. It is interesting to note that exists atwo fold difference in the experimental and theoretical determined LH2→LH1, ascribed to BChla Qy dipole momentunderestimation. It is assumed for theoretical calculation a value of 6.3 Debye, while a greater BChla Qy dipolemoment in Prostecochloris aestuarii (not a purple bacterium) of 7.7 Debye has been determined [31]. On the otherhand, LH1→RC theoretical calculation gives a greater value for tranfer rate, thought to arise due to an overestimateof LH1 exciton delocalization [31]. This rate decreases when delocalization is assumed over fewer BChl’s, therefore,further research is needed to understand the effect of decoherence sources (static inhomogeneities and dynamicaldisorder due to thermal fluctuations) on the delocalization length.
from\ to LH1 LH2 RC
LH1 20.0/N.A. 15.5/N.A. 15.8/30-50
LH2 7.7/3.3 10.0/N.A. N.A
RC 8.1/8 N.A N.A
TABLE I: Theoretical estimation/experimental evidence of inter-complex transfer times in picoseconds. N.A are not availabledata.
1.3 Dissipation
Excitation in chromophores might be dissipated by two main mechanisms. The first is fluorescence, where the elec-tronic excited state has a finite lifetime on the nanosecond time-scale, due to its interaction with the electromagnetic

7
FIG. 4: Dissipation mechanisms. In (a), the electron de-excites due to its interaction with the quantized electromagneticvacuum field through a fluorescent photon. In (b) internal conversion mechanism, where the vibrational levels overlap inducesa transition between electronic excited and ground states. Dissipation overcomes when thermal equilibrium is reached in thevibrational manifold of electronic ground state.
vacuum [37]. The second is internal conversion, where the electronic energy is transferred to vibrational degrees offreedom.
Within the Born-Oppenheimer approximation, the molecular state Ψ, can be decomposed into purely electronicφ and (nuclear) vibrational χ states. The transition probability between initial state Ψi and final state Ψf , isproportional to 〈Ψi|H|Ψf 〉 ∝ 〈χi|χf 〉. Note that χi (χf ) are vibrational levels in the ground (excited) electronic statemanifold (see Fig.4). If the energy difference is small, and the overlap between vibrational levels of different electronicstates is appreciable, the excitation can be transferred from the excited electronic state, to an excited vibrational levelin the ground electronic state. This overlap increases with decreasing energy difference between electronic states. Ashigher electronic levels have smaller energy difference among their zero phonon lines, internal conversion process ismore probable the higher energy electronic states have. Fluorescence and internal conversion between first excitedsinglet and ground electronic states, induce dissipation in a range of hundreds of picoseconds and a few nanoseconds.Numerical simulations are performed with a dissipation time including both fluorescence and internal conversion of1/γD = 1 ns, also used in [31].
1.4 Special pair (SP) ionization
From the LH1 complex excitation reaches the RC, specifically the special pair (SP) dimer. The excitation can betransferred back to its surrounding LH1, or initiate a chain of ionizations along the A branch, probably, due to atyrosine residue strategically positioned instead of a phenylalanine present in the B branch [24]. Once the specialpair is excited, it has been determined experimentally [10] that takes 3-4 ps for the special pair to ionize and producea reduced bacteriopheophytin, H−A , in a reaction SP ∗ → SP+H−A . This reaction initiates an electron hop, to aquinone QA in about 200 ps, and to a second quinone, QB if available. Initially, the ionized quinol Q+
B captures anintrocytoplasmic proton and produces hydroxiquinol QBH, which after a second ionization that produces QBH
+ toform quinol QBH2. After any SP ionization a neutrality restablishment is required, provided by the cytochrome cytcharge carrier. After SP ionization, the cytochrome diffuses from the bc1 complex to a RC in order to replenish itsneutrality SP+ →SP, within several microseconds [26]. The first electron transfer step P ∗ → P+ occurs in the RCwithin t+ =3 ps, used for quinol (QBH2) production [17].
1.5 Quinone-quinol cycling
The RC cycling dynamics also involves undocking of QBH2 from the RC due to lower affinity among RC and thisnew product. Quinol starts a migration to the bc1 complex where enables the ionization of the cytochrome cyt chargecarrier, while a new quinone QB molecule docks into the RC. The time before quinol unbinds, and a new QB isavailable, has been reported within milliseconds [28] to highlight quinol removal o as the rate limiting step [28] ifcompared to special pair restablishment.
Even though it has been reported that excitation dynamics change as a function of the RCs state [3, 8], at a firstglance the several orders of magnitude difference among the picosecond transfer, the nanosecond dissipation and the

8
FIG. 5: Schematic of the biomolecular photosynthetic machinery in purple bacteria, together with relevant inter-complex meantransfer times tij , dissipation rate γD, and normalized light intensity rate γ1(2)
millisecond RC cycling, seems to disregard important effects due to these mechanisms’ interplay. However, the quinol-quinone dynamics leaves the RC unable to promote further quinol production and eventually enhances the influenceof dissipation of a wandering excitation, evident when none RC is available and the unique fate of any excitation isto be dissipated.
Interestingly, the quinone-quinol mechanism has been well established and thought to be of priority on adaptationsof bacteria, that seem to respond to its dynamics. For instance, an observed trend for membranes to form clustersof same complex type [33] seems to affect diffusion of quinones, enhanced when, due to higher mobility of LH1s,left void spaces help travel quinones to the periplasm. Negligible mobility of LH2s in their domains, would restrictmetabolically active quinones to LH1 domains [35]. Easier diffusion of quinones, quinol and cytochromes promoteshigher availability of charge carriers in RC domains under LLI conditions, increasing the rate at which RCs cancycle. The RC cycling dynamics and its connection to the membranes performance has been accounted in [5, 6] in aquantitative calculation to understand the effect of core clustering and stoichiometry variation in the RC supply orin the efficiency of the membranes from experimentally obtained Atomic Force Microscopy images, to be presented inthis chapter.
2. Exciton kinetics
Figure 5 summarizes the relevant biomolecular complexes in purple bacteria Rsp. Photometricum [33], togetherwith experimental– theoretical if the former are not available– timescales governing the excitation kinetics: absorptionand transfer; and reaction center dynamics: quinol removal.
2.1 Model
The theoretical framework used to describe the excitation transfer must be built around the experimental (ifavailable) and theoretical parameters just outlined. Remind that the thermalization process occurs faster than inter-complex energy transfer, and provides the support to rely in a classical hopping process, since phase information islost well within the time frame implied by direct Coulomb coupling. Accordingly, we base our analysis on a classicalrandom walk for excitation dynamics along the full vesicle, by considering a collective state with N = N2 +2N1 sites –

9
resulting from N2 LH2s, N1 LH1s and hence N1 RC complexes in the vesicle. The state vector ~ρ = (ρ1, ρ2, ..., ρM ) hasin each element the probability of occupation of a collective state comprising several excitations. If a single excitationis allowed in each complex, both excited and ground states of any complex should be accounted and the state spacesize is M = 2× 2× 2...︸ ︷︷ ︸
N
= 2N . On the other hand, if only one excitation that wanders in the whole network of
complexes is allowed, a site basis can be used where each element of the state vector gives the probability of residencein the respective complex, and reduces the state vector size to M = N . In either case the state vector time evolutionobeys a master equation
∂tρi(t) =
M∑j=1
Gi,jρj(t). (16)
where Gi,j is the transition rate from a collective state or site i– whether many or a single excitation are accounted,respectively – to another collective state or site j. Since the transfer rates do not depend on time, this yields aformal solution ~ρ(t) = ˜eGt~ρ(0). However, the required framework depends on exciton abundance within the wholechromatophore at the regime of interest.
For instance, purple bacteria ecosystem concerns several meters depths, and should be reminded as a low lightintensity environment. Within a typical range of 10-100 W/m2 and a commonly sized chromatophore having ≈ 400LH complexes, eq.(2) leads to an absorption rate γA ≈100-1000 s−1, which compared with the dissipation mechanisms(rates of ≈ 109 s−1) imply that an absorption event occurs and then the excitation will be trapped by a RC or becomedissipated within a nanosecond, and other excitation will visit the membrane not before some milliseconds haveelapsed. However, it is important to remind the nature of thermal light where the possibility of having bunched smallor long inter-photon times is greater than evenly spread, with greater deviations from poissonian statistics the graterits mean intensity is. Therefore, regardless of such deviations, under the biological light intensity conditions, theevent of two excitations present simultaneously along the membrane will rarely occur and a single excitation modelis accurate.
2.2 Small architectures
Small absorption rates lead to single excitation dynamics in the whole membrane, reducing the size of ~ρ(t) to thetotal number of sites N . The probability to have one excitation at a given complex initially, is proportional to itsabsorption cross section, and can be written as ~ρ(0) = 1
γA(γ1, ...︸ ︷︷ ︸N1
, γ2, ...︸ ︷︷ ︸N2
, 0, ..︸︷︷︸N1
), where subsets correspond to the N1
LH1s, the N2 LH2s and the N1 RCs respectively.
2.2.1 Complexes arrangement: architecture
To gain physical insight on the global behavior of the harvesting membrane, our interest lies in the probability tohave an excitation at a given complex kind k ∈ LH1,LH2 or RC, namely pk, given that at least one excitation residesin the network:
pk(t) =ρk(t)∑Ni=1 ρi(t)
. (17)
The effects that network architecture might have on the model’s dynamics, are studied with different arrangementsof complexes in small model networks, focusing on architectures which have the same amount of LH1, LH2 and RCsas shown in the top panel of Fig.6(a), (b) and (c). The bottom panel Fig.6 (d)-(e)-(f) shows that pk values for RC,LH1 and LH2 complexes, respectively. First, it is important to notice that excitations trend is to stay within LH1complexes, and not in the RC. Fig.6(d) shows that the highest RC population is obtained in configuration (c), followedby configuration (a) and (b) whose ordering relies in the connectedness of LH1s to antenna complexes. Clustering ofLH1s will limit the number of links to LH2 complexes, and reduce the probability of RC ionization. For completeness,the probability of occupation in LH1 and LH2 complexes (Figs.6(e) and (f), respectively), shows that increased RCoccupation benefits from population imbalance between LH1 enhancement and LH2 reduction. As connections amongantenna complexes become more favored, the probability of finding an excitation on antenna complexes will become

10
!a" !b" !c"
FIG. 6: Top panel: Three example small network architectures. The bottom panel shows the normalized probabilities for findingan excitation at an RC (see (d)), an LH1 (see (e)), or an LH2 (see (f)). In panels (d)-(f), we represent these architectures asfollows: (a) is a continuous line; (b) is a dotted line; (c) is a dashed line.
smaller, while the probability of finding excitations in RCs is enhanced. This preliminary result, illustrates that ifthe apparent requirement to funnel excitations down to RCs in bacterium were of primary importance, the greatestconnectedness of LH1-LH2 complexes should occur in nature as a consequence of millions of years evolution. However,as will be presented, the real trend to form LH1 clusters, reduces its connectedness to antenna LH2 complexes andsomehow pinpoints other mechanisms as the rulers of harvesting membranes conformation and architecture.
2.2.2 Relative amount of complexes: Stoichiometry
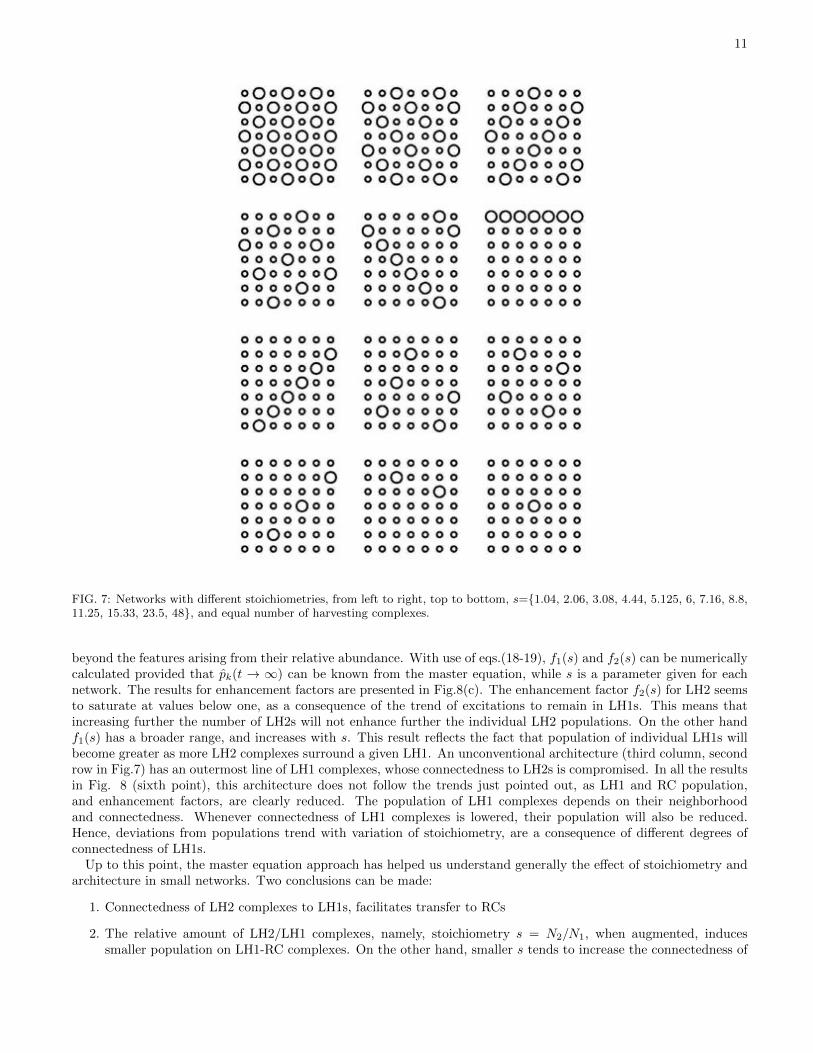
We can also address with use of small architectures the effect of variation in the relative amount of LH1/LH2complexes, able to change the population of the available states. Fig.7 shows small networks of LH-RC nodes, wherethe relative amount of LH2 and LH1 complexes quantified by stoichiometry s = N2/N1 is varied, in order to studythe exciton dynamics. In Fig.8(a) the population ratio at stationary state of LHs demonstrate that as stoichiometrys becomes greater, the population of LH1s, becomes smaller, since their amount is reduced. It is apparent that RCpopulation is quite small, and although their abundance increases the exciton trend to be found in any RC (Fig.8(b)),generally, excitations will be found in harvesting complexes. The population of LHs should be dependent on the ratioof complexes type. As verified in Fig.8(b), RCs have almost no population, and for the discussion below, they willnot be taken into account. Populations can be written as:
p1(t→∞) = f1(s)N1
N1 +N2=f1(s)
1 + s(18)
p2(t→∞) = f2(s)N2
N1 +N2=sf2(s)
1 + s(19)
where the dependence on the amount of complexes is made explicit with the ratio NkN1+N2
, and where f1(s) and f2(s)are enhancement factors. This factor provides information on how the population on individual complexes changes,
11
FIG. 7: Networks with different stoichiometries, from left to right, top to bottom, s={1.04, 2.06, 3.08, 4.44, 5.125, 6, 7.16, 8.8,11.25, 15.33, 23.5, 48}, and equal number of harvesting complexes.
beyond the features arising from their relative abundance. With use of eqs.(18-19), f1(s) and f2(s) can be numericallycalculated provided that pk(t → ∞) can be known from the master equation, while s is a parameter given for eachnetwork. The results for enhancement factors are presented in Fig.8(c). The enhancement factor f2(s) for LH2 seemsto saturate at values below one, as a consequence of the trend of excitations to remain in LH1s. This means thatincreasing further the number of LH2s will not enhance further the individual LH2 populations. On the other handf1(s) has a broader range, and increases with s. This result reflects the fact that population of individual LH1s willbecome greater as more LH2 complexes surround a given LH1. An unconventional architecture (third column, secondrow in Fig.7) has an outermost line of LH1 complexes, whose connectedness to LH2s is compromised. In all the resultsin Fig. 8 (sixth point), this architecture does not follow the trends just pointed out, as LH1 and RC population,and enhancement factors, are clearly reduced. The population of LH1 complexes depends on their neighborhoodand connectedness. Whenever connectedness of LH1 complexes is lowered, their population will also be reduced.Hence, deviations from populations trend with variation of stoichiometry, are a consequence of different degrees ofconnectedness of LH1s.
Up to this point, the master equation approach has helped us understand generally the effect of stoichiometry andarchitecture in small networks. Two conclusions can be made:
1. Connectedness of LH2 complexes to LH1s, facilitates transfer to RCs
2. The relative amount of LH2/LH1 complexes, namely, stoichiometry s = N2/N1, when augmented, inducessmaller population on LH1-RC complexes. On the other hand, smaller s tends to increase the connectedness of

12
10 20 30 40s
1
2
3
4
5
f!s" !c"
FIG. 8: In (a) stationary state populations for LH2s (circles), LH1s (diamonds) and RCs (crosses), as a function of thestoichiometry of membranes presented in Fig.7. In (b) a zoom of RC populations is made, and in (c) the enhancement factorsf1(s) (diamonds) and f2(s) (circles) are presented.
FIG. 9: Normalized probabilities pk for finding the excitation at an LH2 (dashed), LH1 (dotted) or at an RC (continuous), for(a) t+ = 3ps, and (b) t+ →∞. Crosses are the results from the Monte Carlo simulation.
LH1s to LH2s and hence, the population of individual LH1 complexes.
2.2.3 Special pair ionization
Another basic process involved in the solar energy conversion is the ionization of the special pair in the RC, andeventual quinol QBH2 formation. Remind that once quinol is formed, the special pair is unable to use further incomingexcitations before quinol undocks and a new quinone replaces it. Even though the RC neutrality-diffusion processis propelled by complicated dynamics and involved mechanisms, in an easy approach, let us assume that the RCdynamics will proceed through a dichotomic process of ”open” and ”closed” RC states. In the open state, special pairoxidation is possible, while when closed, special pair oxidation to form quinol never happens, hence t+ →∞
The effect of open and closed RC states changes the exciton kinetics. We start with a minimal configurationcorresponding to a basic photosynthetic unit: one LH2, one LH1 and its RC. Figure 9(a) shows that if the RC is open,excitations will mostly be found in the LH1 complex, followed by occurrences at the LH2 and lastly at the RC. Onthe other hand, Figure 9(b)) shows clearly the different excitation kinetics which arise when the RC is initially unableto start the electron transfer P ∗ → P+, and then after ≈ 15ps the RC population becomes greater with respect to theLH2’s. This confirms that a faithful description of the actual photosynhesis mechanism, even at the level of the minimal
13
unit, must resort into RC cycling, given that its effects are by no means negligible. Moreover, comparison amongFigs.6(d) and 9 also presents a feature that is usually undermined when small architectures are used to straightforwardinterpret its results as truth for greater, real biological vesicles. Energy funneling becomes smaller with the numberof antenna LH2 complexes, thereby, in architectures with many harvesting antenna complexes, excitation will findit more difficult to arrive to any of the relatively spread RCs. Besides, although LH2→LH1 transfer rate is five-foldthe back-transfer rate, the amount of smaller sized LH2s neighboring a given LH1 will increase the net back-transferrate due to site availability. Hence, the funneling concept might be valid for small networks [17, 31], however, innatural scenarios involving entire chromatophores with many complexes, energy funneling might not be priority dueto increased number of available states, provided from all LH2s surrounding a core complex, and globally, from therelative low RC abundance within a real vesicle.
It is important to mention that results for master equation calculations require several minutes in a standardcomputer to yield the results shown in Fig.8, and that these networks have an amount of nodes an order of magnitudesmaller than the actual chromatophore vesicles. Dynamics concerning the RC cycling have not been described yet,fact that would increase further the dimension of possible membrane’s states. To circumvent this problem, furtheranalysis will proceed from stochastic simulations, and observables will be obtained from ensemble averages.
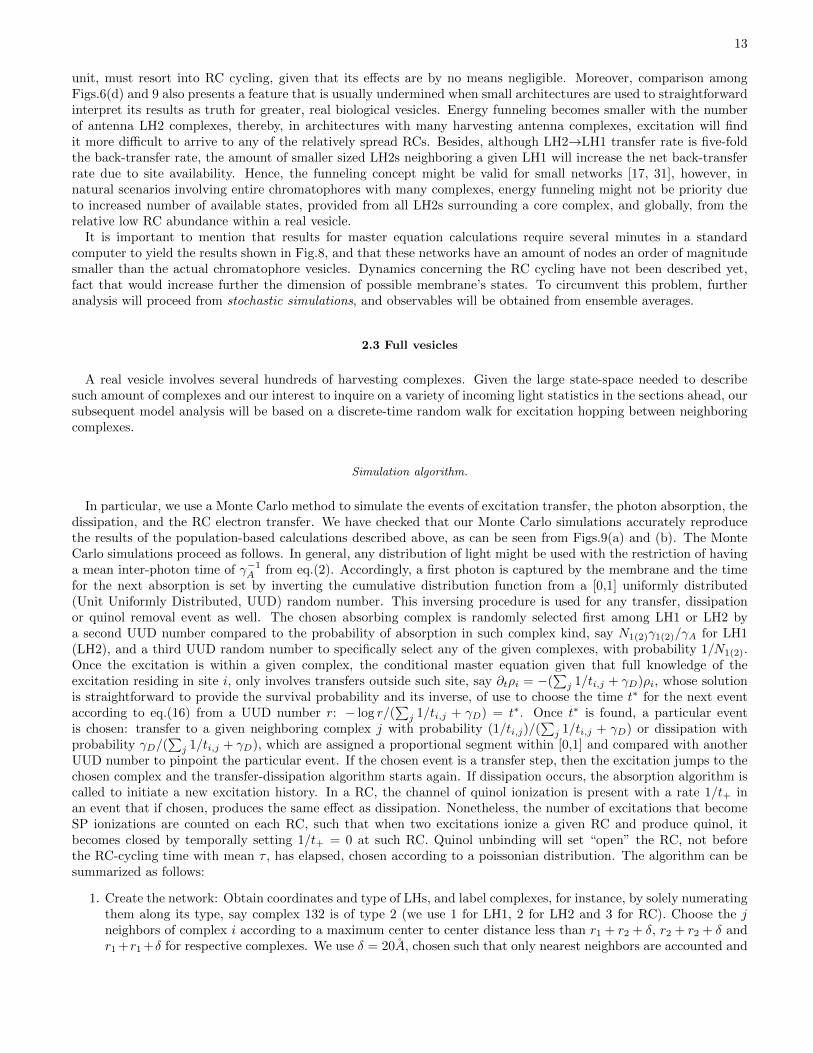
2.3 Full vesicles
A real vesicle involves several hundreds of harvesting complexes. Given the large state-space needed to describesuch amount of complexes and our interest to inquire on a variety of incoming light statistics in the sections ahead, oursubsequent model analysis will be based on a discrete-time random walk for excitation hopping between neighboringcomplexes.
Simulation algorithm.
In particular, we use a Monte Carlo method to simulate the events of excitation transfer, the photon absorption, thedissipation, and the RC electron transfer. We have checked that our Monte Carlo simulations accurately reproducethe results of the population-based calculations described above, as can be seen from Figs.9(a) and (b). The MonteCarlo simulations proceed as follows. In general, any distribution of light might be used with the restriction of havinga mean inter-photon time of γ−1A from eq.(2). Accordingly, a first photon is captured by the membrane and the timefor the next absorption is set by inverting the cumulative distribution function from a [0,1] uniformly distributed(Unit Uniformly Distributed, UUD) random number. This inversing procedure is used for any transfer, dissipationor quinol removal event as well. The chosen absorbing complex is randomly selected first among LH1 or LH2 bya second UUD number compared to the probability of absorption in such complex kind, say N1(2)γ1(2)/γA for LH1(LH2), and a third UUD random number to specifically select any of the given complexes, with probability 1/N1(2).Once the excitation is within a given complex, the conditional master equation given that full knowledge of theexcitation residing in site i, only involves transfers outside such site, say ∂tρi = −(
∑j 1/ti,j + γD)ρi, whose solution
is straightforward to provide the survival probability and its inverse, of use to choose the time t∗ for the next eventaccording to eq.(16) from a UUD number r: − log r/(
∑j 1/ti,j + γD) = t∗. Once t∗ is found, a particular event
is chosen: transfer to a given neighboring complex j with probability (1/ti,j)/(∑j 1/ti,j + γD) or dissipation with
probability γD/(∑j 1/ti,j + γD), which are assigned a proportional segment within [0,1] and compared with another
UUD number to pinpoint the particular event. If the chosen event is a transfer step, then the excitation jumps to thechosen complex and the transfer-dissipation algorithm starts again. If dissipation occurs, the absorption algorithm iscalled to initiate a new excitation history. In a RC, the channel of quinol ionization is present with a rate 1/t+ inan event that if chosen, produces the same effect as dissipation. Nonetheless, the number of excitations that becomeSP ionizations are counted on each RC, such that when two excitations ionize a given RC and produce quinol, itbecomes closed by temporally setting 1/t+ = 0 at such RC. Quinol unbinding will set “open” the RC, not beforethe RC-cycling time with mean τ , has elapsed, chosen according to a poissonian distribution. The algorithm can besummarized as follows:
1. Create the network: Obtain coordinates and type of LHs, and label complexes, for instance, by solely numeratingthem along its type, say complex 132 is of type 2 (we use 1 for LH1, 2 for LH2 and 3 for RC). Choose the jneighbors of complex i according to a maximum center to center distance less than r1 + r2 + δ, r2 + r2 + δ andr1 +r1 +δ for respective complexes. We use δ = 20A, chosen such that only nearest neighbors are accounted and

14
further increase of δ makes no difference on the amount of nearest neighbor connections, although further increasemay include non-physical next to near-neighbors. In practice, the network creation was done by three arrays,one, say neigh(i, j) with size M × S, with M complexes as described above, and S as the maximum number ofneighboring complexes among all the sites, hence requiring several attempts to be determined. Minimally j ≤ 1for an LH2, concerning the dissipation channel, j ≤ 2 for LH1 including both dissipation and transfer to its RC,and j ≤ 3 for a RC accounting on dissipation, RC ionization an transfer to its surrounding LH1. The otherarrays are built, say size(i), with M positions, that keep on each the number of neighbors of the respective ilabelled complex, and rates(i, j) where at each position the inter-complex rate i → j is saved. For instance,rates(i, 1) of any RC will be the ionization rate 1/t+.
2. Send photons to the network: On a time t∗ = − log(r)/γA according to eq.(2), with r being an UUD number.Choose an LH2 or an LH1, according to the probability of absorption from the cross section of complex typeN1(2)γ1(2)/γA. Add one excitation to the network, say n = n + 1, and assign the initial position pos(n) = i ofthe excitation according to another UUD that selects an specific labelled i complex. Remind that n is boundedby the maximum amount of excitations allowed to be at the same time within the membrane, usually being one.
3. If the ith complex is excited, the construction of the above mentioned arrays make the cycle of excitationdynamics straightforward since the network is created only once, and dynamics only require to save the complexi where the excitation is, and then go through cycles of size size(n, i) to acknowledge the stochastically generatednext time for a given event. Excitation can be transferred to the available neighbors, become dissipated or aRC ionization event. Order all times for next events in order to know which will be the next in the array, saylistimes(p) with p ≤ n, where tmin = listemp(1). In parallel, update an organized array that saves the nextprocess with the number of the neighbor to which hopping occurs, or say a negative number for RC ioinizationand another negative number for dissipation.
4. Jump to next event: By cycling over the n present excitations, increase time up to the next event tmin. If RCcycling is accounted, check which time among tmin and the next opening RC time tRC (its algorithm is to bediscussed in the following) is the closest, and jump to it.
5. Change state of excitations or that of RCs: Update the current site of the excitation n, or whether it becomesa dissipation or a RC ionization. If the latter process occurs, keep in an array, say rcstate(k) whose sizeequals the total amount of RCs, the number of excitations that have become ionizations from the last timethe kth RC was opened.If rcstate(k) = 2 then the kth RC is closed by redefinition of rate(i, 1) = 0 and apoissonian stochastically generated opening time with mean τ is generated. This time interval is kept in anarray rctimes(k). Now, introduce this time interval into an ascending ordered list among all closed RCs openingtimes such that the minimum tRC is obtained. If tRC < tmin then jump to that time and open the kth RC byletting rcstate(k) = 0 and rates(i, 1) = 1/t+.
6. Look which is minimum among t∗, tRC and tmin and jump to steps 2 or 4 according to whether t∗ < (tRC , tmin)or (tRC , tmin) < t∗, respectively.
7. If the maximum amount of excitations chosen from the initialization, have been sent to the membrane, finishall processes and write external files.
The language used to program this algorithm was FORTRAN77, to point out that these calculations do not requireany high-level language.
Excitation dynamics trends in many node-complexes networks.
In order to understand at a qualitative degree the excitation dynamics trends involved in full network chro-matophores, a few toy architectures have been studied, shown in Fig.10. In this preliminary study it is of interestto understand the excitation kinetics in complete chromatophores. In particular, it is useful to understand if anyimportant feature arises according to nature’s found tendency of forming clusters of the same complex type. In AFMimages [34] it has been found that there is an apparent trend to form clusters of LH1 complexes with simultaneousformation of LH2 para-chrystalline domains. The reason that has been argued for this trend [34] involves the RCcycling dynamics and can be explained as follows.
The charge carrier quinone-quinol require diffusing through the intracytoplasmic membrane within the void spacesleft among harvesting complexes, in order to reach the bc1 complex and complete the electric charge cycle with

15
cytochorme that however, diffuses through the periplasm as schematically shown in Fig.2. The closeness among LH2complexes in these para-chrystalline domains restricts the void spaces required for diffusion of quinone-quinol to theLH1 domains, where charge separation is taking place. Then, such aggregation indeed helps to improve the timeit takes to quinone perform the whole RC-bc1-RC cycle, by restricting its presence to RC domains. However, anadvantage concerning excitation dynamics has been heuristically proposed, where the path an excitation has to travelto reach an open RC once it encounters a closed RC is reduced due to LH1 clustering. In this section we investigatethis latter possibility from a more quantitative point of view and address the former in the next section.
In order to understand exciton kinetics, for instance, let us fix our attention on the probability of a RC ionizationwhen excitations start in a given LH2 on the configurations shown in Fig.10. To that end, let us introduce first thenumber nRCij of excitations that are absorbed at site i and become ionization of the special pair at a given RC,labeled j. Also let rij be the unitary vector pointing in the direction from LH2 site i to RC site j. As an analogous toa force field, let vector field v correspond to a weighted sum of the directions on which RC ionizations occur, startingfor a given LH2 complex
vi =
∑j nRCij rij√∑
j n2RCij
. (20)
of help as a purely numerical calculation of graphical interpretation. The normalization gives a basis to compareonly the directions for RC ionizations independent whether excitations are dissipated or not. Note that rij has bothpositive and negative signs, hence the vector vi will have greater magnitude as RC ionizations occur more frequentlyat a given direction, or less magnitude as ionizations occur in more spread out directions.
Several features can be understood from this vector field. Figure 10 shows the vector fields attracted to the LH1most abundant regions. The arrows illustrate the favored statistical direction in which excitations will become RCionization, and they do not imply that an excitation will deterministically move in that direction if it were absorbedin such place. Firstly, in all cases, a tendency to point on clustered LH1s stands from distant LH2 complexes, a factthat emphasizes the very rapid transfer rates that lead to excitation’s rapid global membrane sampling. Secondly, itis evident that better excitation attractors are made with increasing the core centers cluster size, easily observed inthe top panel. Hence, according to this result one may naively state that a funneling effect is apparent and stronglydependent on cluster size. However, on the middle panel, it can be seen that this funneling effect is vanishingly smallat sites where some degree of symmetry is present concerning the distribution of neighboring RCs, even though if theselatter display some clustering degree. Third, a trend is displayed where the spreading of the flux becomes smallerwith a lesser amount of RCs. However it is important to be aware that in more detail and in a general fashion, onealso sees that even the LH2s closest to a given RC, ”feel” the presence of further RCs. This implies that a significantamount of excitations that reach LH2 complexes neighboring a given LH1, will better prefer hopping to neighboringLH2 complexes to eventually reach a distant RC: no ”funneling”, as usually understood.
In a more realistic situation, the clustering of LH1 complexes is just a trend, and in average any cluster is formedby a few 3-4 core complexes in HLI situations and somehow less for LLI membranes as shown in Fig.11, whereempirical architectures are presented in complete accordance with experimental data, taken from Ref.[33]. Alongthese figures, the vector field calculated for the HLI and LLI empirical membranes is made, to highlight no clear trendof excitations to be transferred immediately to neighboring LH1 complexes, and disregard a funneling LH2→LH1 asthe unique direction of excitation flux when many complexes are accounted.
In detail, from the reasons just provided, in Fig.11(a) it is apparent that in HLI membranes, individual LH1complexes are not efficient attractors of excitations. Here, not even the LH2s closest to a core center complex arenotably attracted to such cores. On the other hand, a more uniform flux seems to be shared on clusters of LH2sin the LLI membrane (Fig.11(b)), that points to locations where more core centers are displayed. Hence, it is moreevident the directionality of the flux to the most LH1 abundant locations that gives a statistical preference to ionizethe closest RCs due their low global abundance in LLI membranes. The greater amount of LH1 complexes in the HLImembrane induces no significant preference for excitations to hop to the closest lying RCs and provides evidence thatthe excitation process proceeds without a clear funneling effect. If a single excitation can become an ionization in asingle RC, the flux is clear, but if there are many and spread, the flux becomes random, as would be expected fromany random walk. In summary, these results allow a mental picture of the excitation transfer process: Excitationsbecome absorbed and start wandering along the membrane in a random walk regardless of a funneling effect, up tothe moment where they reach a RC and become ionized, in a process where statistical preference is present in LLImembranes due to the reduced amount of RC, and presenting more clearly the random wandering on HLI due tohigher spread out possibilities of ionization. This fact can also be quantitatively investigated.
Suppose that a given LH1 is surrounded by a few LH2 complexes. If an excitation is absorbed into one of these

16
FIG. 10: Vector field v for different configurations, where the effect of core centers clustering is investigated (100000 runsstarting in each site).
neighboring LH2s, it will have a survival probability decaying with rate 1/t21+n/t22 where n wold be 3-4 correspondingto the number of LH2s neighboring such absorbing LH2. Given the presented transfer times (remind t21 = 3.3ps andt22 = 10ps) both terms in the survival decay rate become almost equal for n = 3, and hence no preference willoccur on the excitation to be transferred to the closest LH1. If LH2→LH1 transfer would actually happen, the sameexercise can be done for the survival probability within the LH1 complex, decaying with a rate m/t12 + 1/t1,RC(remind t12 = 15.5ps and t1,RC ≈ 30ps) which assuming a single surrounding LH2 complex (m = 1) would givea preference for excitations to return to antenna complexes. Hence, if the availability of neighbors is accounted,the funneling LH2→LH1 is lost, which along the enhanced back-transfer rate LH1→LH2 as compared to LH1→RC,provides the basis for understanding complete chromatophores as networks where actual performance depends uponthe RC availability, since the event of ionization only depends on the probability to get to RC sites having no preference

17
FIG. 11: Vector field v for HLI (a) and LLI (b) membranes (100000 runs each site).
to be visited within the network. Excitations sample great portions of the whole membrane in its hopping, hencebecome able to reach RCs far away from the absorption sites before dissipation overcomes.
Dissipation itself also provides interesting features. The dissipation di measures the probability for excitations todissipate at site i from the the total amount of excitations being absorbed in the membrane nA:
di =nDinA
(21)
that has an straightforward relation with the global efficiency η of the membrane, that accounts on the probability ofany excitation to be used as an SP ionization. Given that excitations can only become RC ionizations or be dissipated,the sum over all complexes of dissipation probability will give the probability of any excitation to be dissipated, hence
η = 1−∑i
di (22)
Figure 12 shows the dissipation on the membranes shinned with the respective illumination rate of their growth(LLI 10 W/m2 and HLI 100 W/m2). Figure 12(a) shows that the LLI membrane has highly dissipative clusters ofLH2s, in contrast to the uniform dissipation in the HLI membrane (see Fig.12(b)).
This result addresses distinct features probably connected with the own requirements for bacteria when differentlight intensity is used during growth. Under LLI, bacterium might require use of all the available solar energy topromote its metabolism. In the numerical simulations (as expected from nature), the dissipation rate is set equal onany site, and therefore dissipation is only dependent on the probability for an excitation to be in a given complex.If more dissipation is found in some regions, it can there be supposed that excitations remain more time at suchdomains. Hence the tendency for excitations to dissipate implies they reside longer in LH2 complex domains andjustify the view of LH2 clusters as excitation reservoirs. Although RC cycling has not been accounted yet, a givenhistory might include an event where the excitation reaches closed clustered RCs and then jumps back to these LH2domains waiting before the RCs become available again. On the other hand, HLI membranes display an evenlydistributed dissipation. For instance, at HLI not all excitations might be required and dissipation can be used as aphoto-protective mechanism. In this case, if dissipation were highly concentrated, vibrational recombination wouldoverheat such highly dissipating domains.
Beyond these local details, an analysis regarding average values of dissipation Dk and residence pRk probabilitieson a complex type k (k = 1, 2 are respectively LH1, LH2 complexes) better supports the view of a completely randomexcitation hopping process. Table II shows the numerical results of pRk , that concerns the probability to find anexcitation in a given complex type and is calculated from the sum of the residence times of excitations at a given

18
FIG. 12: Contour plots for dissipation in LLI (a) and HLI (b) membranes. Greater contrast means higher values for dissipation.The simulation is shown after 106 excitations were absorbed by the membrane with rate γA.
complex type. It is straightforward to see that pRk is closely related to the probability of dissipation at such complextype, therefore, dissipation can correctly measure where excitations are to be found in general. The randomnessof excitation dynamics is illustrated by realizing that dissipation in a given complex type depends primarily on itsrelative abundance, since Dk
Dj≈ Nk
Nj, and justifies that apart from LH2 clusters local variations, in the mean, all sites
behave equivalently, and no dynamical feature arises to set a difference among LH1s and LH2s able to argue on thestoichiometry adaptation experimentally found. Lastly, as expected from the dynamical equivalence of sites, along theresult obtained with toy architectures of varying stoichiometry where RC population heavily rose due their abundancebut relatively invariant to arrangement, the probability to reach a RC solely depends on its abundance, and thereforethe global efficiency η is greater in HLI membranes.
Membrane pR2 pR1 D2 D1D2D1
s = N2N1
η = 1− nDnA
LLI 0.72 0.25 0.74 0.26 9.13 9.13 0.86
HLI 0.50 0.46 0.52 0.48 3.88 3.92 0.91
TABLE II: Dissipation Dk, residence probability pRk , on k = {1, 2} corresponding to N1 LH1 and N2 LH2 complexes respec-tively. Stoichiometry s and efficiency η are also shown.
Hence, for the present discussion, the most important finding from these numerical simulations is that the adaptationof purple bacteria does not lie in the single excitation kinetics. In particular, LLI membranes are seen to reduce theirefficiency globally at the point where photons are becoming scarcer – hence the answer to adaptation must lie in somemore fundamental trade-off (as we will later show explicitly). Due to the dissimilar timescales between millisecondabsorption from eq.(2) and nanosecond dissipation, multiple excitation dynamics are also unlikely to occur within amembrane. However, multiple excitation dynamics cannot be regarded a priori not to be a reason for purple bacteriaadaptation. A numerical study in Ref.[5] involving blockade in which two excitations can not occupy the same site andannihilation, where two excitations annihilate due to vibrational recombination occurring due to significant Frank-Condon overlap on higher exciton states, shows that these mechanisms decrease the efficiency of membranes equallyon LLI and HLI membranes, therefore, keeping the best performance to HLI.
Nevertheless a more comprehensive study to be presented in the next section taking into account the coupledexciton-RC cycling is able to justify nature’s choice of proceeding with the observed bacterial adaptations.

19
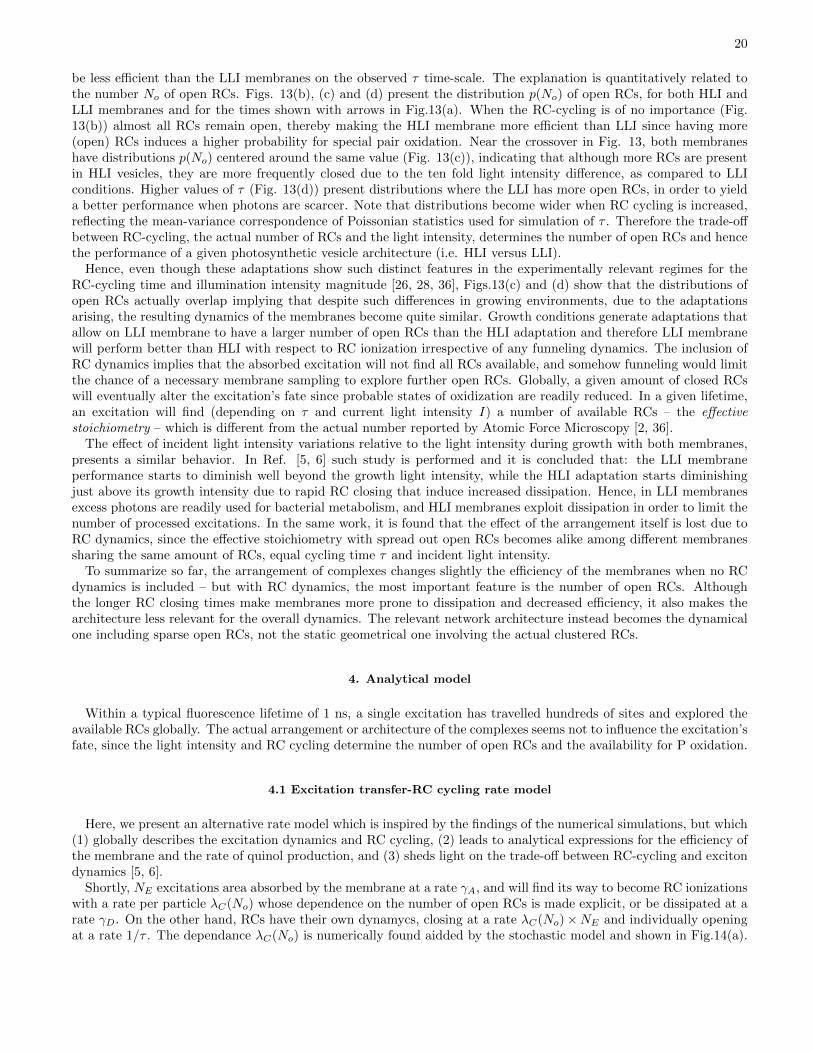
FIG. 13: (a) Monte Carlo calculation of efficiency η of HLI (diamonds) and LLI (crosses) grown membranes, as a function ofthe RC-cycling time τ . Continuous lines give the result of the analytical model. (b), (c) and (d) show the distributions p(No)of the number of open RCs for the times shown with arrows in the main plot for HLI (filled bars) and LLI (white bars).
3. Complete chromatophores: Exciton and RC cycling coupled dynamics.
It has been here repeatedly commented that RCs perform a cycle that provides the required exciton-chemicalenergy conversion. We now explain that the answer as to how adaptation can prefer the empirically observed HLI andLLI structures under different illumination conditions, lies in the interplay between the excitation kinetics and RCcycling dynamics. By virtue of quinones-quinol and cytochrome charge carriers, the RC dynamics features a ‘dead’(or equivalently ‘busy’) time interval during which quinol is produced, removed and then a new quinone becomesavailable [26, 28]. Once quinol is produced, it leaves the RC and a new quinone becomes attached. These dynamicsare introduced into the simulation algorithm as presented in section , by closing an RC for a (random) poissoniandistributed time with mean τ after two excitations form quinol. The cycle can be sketched as follows: open RC→2 ionizing excitations form quinol → closed RC in a time with mean τ→ open RC. This RC cycling time τ impliesthat at any given time, not all RCs are available for turning the electronic excitation into a useful charge separation.Therefore, the number of useful RCs decreases with increasing τ . Too many excitations will rapidly close RCs,implying that any subsequently available nearby excitation will tend to wander along the membrane and eventuallybe dissipated - hence reducing η. For the configurations resembling the empirical architectures (Fig.12), this effectis shown as a function of τ in Fig. 13(a) yielding a wide range of RC-cycling times at which LLI membrane ismore efficient than HLI. Interestingly, this range corresponds to the measured time-scale for τ of milliseconds [26],and supports the suggestion that bacteria improve their performance in LLI conditions by enhancing quinone-quinolcharge carrier dynamics as opposed to manipulating exciton transfer. As mentioned, a recent proposal [35] has shownnumerically that the formation of LH2 para-crystalline domains produces a clustering trend of LH1 complexes withenhanced quinone availability – a fact that would reduce the RC cycling time.
However, the crossover of efficiency at τ ≈ 3 ms implies that even if no enhanced RC-cycling occurs, the HLI will
20
be less efficient than the LLI membranes on the observed τ time-scale. The explanation is quantitatively related tothe number No of open RCs. Figs. 13(b), (c) and (d) present the distribution p(No) of open RCs, for both HLI andLLI membranes and for the times shown with arrows in Fig.13(a). When the RC-cycling is of no importance (Fig.13(b)) almost all RCs remain open, thereby making the HLI membrane more efficient than LLI since having more(open) RCs induces a higher probability for special pair oxidation. Near the crossover in Fig. 13, both membraneshave distributions p(No) centered around the same value (Fig. 13(c)), indicating that although more RCs are presentin HLI vesicles, they are more frequently closed due to the ten fold light intensity difference, as compared to LLIconditions. Higher values of τ (Fig. 13(d)) present distributions where the LLI has more open RCs, in order to yielda better performance when photons are scarcer. Note that distributions become wider when RC cycling is increased,reflecting the mean-variance correspondence of Poissonian statistics used for simulation of τ . Therefore the trade-offbetween RC-cycling, the actual number of RCs and the light intensity, determines the number of open RCs and hencethe performance of a given photosynthetic vesicle architecture (i.e. HLI versus LLI).
Hence, even though these adaptations show such distinct features in the experimentally relevant regimes for theRC-cycling time and illumination intensity magnitude [26, 28, 36], Figs.13(c) and (d) show that the distributions ofopen RCs actually overlap implying that despite such differences in growing environments, due to the adaptationsarising, the resulting dynamics of the membranes become quite similar. Growth conditions generate adaptations thatallow on LLI membrane to have a larger number of open RCs than the HLI adaptation and therefore LLI membranewill perform better than HLI with respect to RC ionization irrespective of any funneling dynamics. The inclusion ofRC dynamics implies that the absorbed excitation will not find all RCs available, and somehow funneling would limitthe chance of a necessary membrane sampling to explore further open RCs. Globally, a given amount of closed RCswill eventually alter the excitation’s fate since probable states of oxidization are readily reduced. In a given lifetime,an excitation will find (depending on τ and current light intensity I) a number of available RCs – the effectivestoichiometry – which is different from the actual number reported by Atomic Force Microscopy [2, 36].
The effect of incident light intensity variations relative to the light intensity during growth with both membranes,presents a similar behavior. In Ref. [5, 6] such study is performed and it is concluded that: the LLI membraneperformance starts to diminish well beyond the growth light intensity, while the HLI adaptation starts diminishingjust above its growth intensity due to rapid RC closing that induce increased dissipation. Hence, in LLI membranesexcess photons are readily used for bacterial metabolism, and HLI membranes exploit dissipation in order to limit thenumber of processed excitations. In the same work, it is found that the effect of the arrangement itself is lost due toRC dynamics, since the effective stoichiometry with spread out open RCs becomes alike among different membranessharing the same amount of RCs, equal cycling time τ and incident light intensity.
To summarize so far, the arrangement of complexes changes slightly the efficiency of the membranes when no RCdynamics is included – but with RC dynamics, the most important feature is the number of open RCs. Althoughthe longer RC closing times make membranes more prone to dissipation and decreased efficiency, it also makes thearchitecture less relevant for the overall dynamics. The relevant network architecture instead becomes the dynamicalone including sparse open RCs, not the static geometrical one involving the actual clustered RCs.
4. Analytical model
Within a typical fluorescence lifetime of 1 ns, a single excitation has travelled hundreds of sites and explored theavailable RCs globally. The actual arrangement or architecture of the complexes seems not to influence the excitation’sfate, since the light intensity and RC cycling determine the number of open RCs and the availability for P oxidation.
4.1 Excitation transfer-RC cycling rate model
Here, we present an alternative rate model which is inspired by the findings of the numerical simulations, but which(1) globally describes the excitation dynamics and RC cycling, (2) leads to analytical expressions for the efficiency ofthe membrane and the rate of quinol production, and (3) sheds light on the trade-off between RC-cycling and excitondynamics [5, 6].
Shortly, NE excitations area absorbed by the membrane at a rate γA, and will find its way to become RC ionizationswith a rate per particle λC(No) whose dependence on the number of open RCs is made explicit, or be dissipated at arate γD. On the other hand, RCs have their own dynamycs, closing at a rate λC(No)×NE and individually openingat a rate 1/τ . The dependance λC(No) is numerically found aidded by the stochastic model and shown in Fig.14(a).

21
FIG. 14: (a) Numerical results showing the rate of ionization λC(No) of an RC for HLI (diamonds) and LLI (crosses) membranes,together with a quadratic (dashed line) and linear (continuous) dependence on the number of closed RCs (N1−No). The fittingparameters for a + bNo are a = {15.16, 7.72}ns−1, b = {−0.21,−0.21} ns−1; and for a + bNo + cN2
o , a = {16.61, 8.21}ns−1,b = {−0.35,−0.33}, and c = {3.6, 1.5}µs−1, for HLI and LLI membranes respectively. (b) η as function of τ and α = I/I0,obtained from the complete analytical solution for LLI (white) and HLI (grey) membranes
Rate equations can therefore be written:
dNEdt
= −(λC(No) + γD)NE + γA (23)
dNodt
=1
τ(N1 −No)−
λC(No)
2NE . (24)
to be solved, and of use for the calculation of the steady-state efficiency η = nRC/nA:
η =λC(No)NE
γA. (25)
A linear fit for λC(No) allows an analytical expression for η:
η(τ, γA(I)) =1
γAλ0Cτ
{2N1(λ0C + γD) + γAλ
0Cτ− (26)√
4N21 (λ0C + γD)2 + 4N1γAλ0C(γD − λ0C)τ + (γAλ0Cτ)2
}(27)
where λ0C is the rate of RC ionization when no RC-cycling is accounted, dependent only on the amount of RCspresent in the vesicle [5]. This analytical expression is shown in Fig.14(b) and illustrates that η ≥ 0.9 if the transfer-Preduction time is less than a tenth of the dissipation time, not including RC cycling. As can be seen in Figs. 13(a),the analytical solution is in good quantitative agreement with the numerical stochastic simulation, and providessupport for the assumptions made. Moreover, this model shows directly that the efficiency is driven by the interplaybetween the RC cycling time and light intensity. Figure 14(b) shows up an entire region of parameter space whereLLI membranes are better than HLI in terms of causing P ionization, even though the actual number of RCs thatthey have is smaller. In view of these results, it is interesting to note how clever Nature has been in tinkering withthe efficiency of LLI vesicles and the dissipative behavior of HLI adaptation, in order to meet the needs of bacteriasubject to the illumination conditions of the growing environment.
4.2 Bacterial metabolic demands
Photosynthetic membranes must provide enough energy to fulfill the metabolic requirements of the living bacteriaquantified by the quinol output or quinol rate
W =1
2
dnRCdt
(28)

22
1010.1I!I0
20
2
W"103 !s
# $a%
0 20 40 60 80 100 120 140I!Watt"m2#2
4
6
8
10
s
!b#
FIG. 15: (a) Quinol rate W in HLI (diamonds, I0 = 100W/m2) and LLI (crosses, I0 = 10W/m2) grown membranes, as afunction of incident intensity I. (b) Quinol rate contours of W = {1900, 2000, 2100, 2200} s−1 in black, blue, red and pink,respectively.
which depends directly on the excitations that ionize RCs nRC . The factor 12 accounts for the requirement of two
ionizations to form a single quinol molecule. Although these membranes were grown under continuous illumination,the adaptations themselves are a product of millions of years of evolution. Using RC cycling times that preservequinol rate in both adaptations, different behaviors emerge when the illumination intensity is varied (see Fig. 15(a).The increased illumination is readily used by the LLI adaptation, in order to profit from excess excitations in anotherwise low productivity regime. On the other hand, the HLI membrane maintains the quinone rate constant,thereby avoiding the risk of pH imbalance in the event that the light intensity suddenly increased. We stress thatthe number of RCs synthesized does not directly reflect the number of available states of ionization in the membrane.LLI synthesizes a small amount of RCs in order to enhance quinone diffusion, such that excess light intensity isutilized by the majority of special pairs. In HLI, the synthesis of more LH1-RC complexes slows down RC-cycling,which ensures that many of these RCs are unavailable and hence be advantageous of evenly distributed dissipation tosteadily supply quinol independent of any excitation increase. The very good agreement between our analytic resultsand the stochastic simulations, yields additional physical insight concerning the stoichiometries found experimentallyin Rsp. Photometricum.
A closed form expression regarding all dynamical parameters involved can be obtained [5]:
2W (s, I) =γA(s, I)
2+
1
B(s)
(1 +
γDλ0c
)+
√[γA(s, I)
2+
1
B(s)
(1 +
γDλ0c
)]2 +
γA(s, I)
2B(s)(29)
where the dependence on stoichiometry is made explicit due to absoprtion cross section in γA and on B(s) =τ(s)(A1+sA2)
f(s)A0, which is a parameter that depends on area A1(2) of individual LH1 (LH2) complexes and filling fraction
f(s). The filling chromatophore fraction dependence on s is available from experimental data of Ref.[35] and τ(s) isconstructed from an interpolation scheme [5].
As emphasized in Ref. [34], membranes with s=6 or s=2 were not observed, which is to be compared with thecontour plots regarding constant quinol output, of s as a function of growing light intensity I0, shown in Fig.15(b).These results support a dichotomic observation where s ≈ 4 predominantly on a great range for growing light intensity.However, a prediction can be made for 30-40 W/m2 where a great sensitivity of stoichiometry ratios rapidly build upthe number of antenna LH2 complexes. Very recently [25], membranes were grown with 30W/m2 and an experimentalstoichiometry of 4.8 was found. The contour of 2200 s−1 predicts a value for stoichiometry of 4.72 at such growing lightintensities. This agreement is quite remarkable, since a simple linear interpolation among the values s ≈ 4, I0 = 100W/m2 and s ≈ 8, I0 = 10 W/m2 would wrongly predict s = 7.1 at 30 W/m2. We encourage experimentalists toconfirm the full range of predicted behaviors as a function of light-intensity and stoichiometry. Such exercise wouldwithout doubt confirm/expand the understanding on RC-exciton dynamics trade off, pinpointing a direction to pursuesolar energy conversion research, provided by Nature itself.
23
4.3 Performance of photosynthetic membranes under extreme photon statistics
Photosynthetic (e.g purple) bacteria provide the crucial coupling between the Sun’s energy and the production offood on Earth, and have adapted successfully to a variety of terrestrial conditions since the beginnings of life on Earthseveral billion years ago. In this section we explore whether terrestrial bacteria, which are the product of millions ofyears of evolutionary pressure on Earth, could survive if suddenly exposed to incident light with extreme statistics.We are therefore mimicking a scenario in which purple bacteria are either (i) suddenly transported to some unknownextreme solar environment elsewhere in the universe, or (ii) where our own Sun suddenly picks up extremal behaviorin terms of the temporal statistics of its emitted photons, or (iii) the bacteria are subjected to extreme artificiallight sources such as that in Ref. [4] involving stimulated Raman scattering, as well as in coherent anti-Stokes Ramanscattering in silicon, or (iv) the external membrane skin of the bacterium is modified in such a way that the absorptionof photons takes on extreme statistical properties.
Our discussion is qualitatively different from previous work looking at life in extreme conditions, since those dis-cussions have tended to focus on environmental extremes affecting the biochemical metabolism or extremes in theincident light intensity. By contrast, our current discussion focuses on extremes in the incident photon statistics.Although the setting is largely hypothetical, our theoretical predictions are based on a realistic semi-empirical modelwhich incorporates (i) high precision empirical AFM information about spatial locations of LH1 and LH2 biomolec-ular complexes in the membrane architecture of Rsp. Photometricum purple bacteria, and (ii) full-scale stochasticsimulations of the excitation kinetics and reaction center dynamics within the empirical membrane.
As with any process involving events occurring in a stochastic way over time, the statistical properties of arrivingphotons may show deviations from a pure coin-toss process in two broad ways: burstiness and memory [15]. Firstconsider the simplest process in which the rate of arrival of a photon has a constant probability per unit time. Itis well known that this so-called Poisson process produces a distribution of the waiting time for the next photonarrival which is exponential in form, given by PP(τ) ∼ exp(−τ/τ0). The extent to which the observed arrival timedistribution P (τ) deviates from exponential, indicates how non-Poissonian the photon arrival is. Following Barabasi[15], we refer to this as ‘burstiness’ B and define it by its deviation from a purely Poisson process:
B ≡ (στ/mτ − 1)
(στ/mτ + 1)=
(στ −mτ )
(στ +mτ )
where στ and mτ are the standard deviation and mean respectively of the empirical distribution P (τ). For a purePoisson process, the mean and standard deviation of the arrival time distribution are equal and hence B = 0. Theother property which can be noticeable for a non-Poisson process is the memory M between consecutive inter-arrivaltimes which, following Barabasi, we define as:
M ≡ 1
nτ − 1
nτ−1∑i=1
(τi −m1)(τi+1 −m2)
σ1σ2
where nτ is the number of inter-arrival times measured from the signal and m1(m2) and σ1(σ2) are sample mean andsample standard deviation of τi(τi+1)’s respectively (i = 1, . . . , nτ − 1). For a pure Poisson process, M = 0. BothB and M range from −1 to +1, with the value B = 0 and M = 0 for a strict Poisson process. We will assume forsimplicity that the arriving photons are all absorbed and hence one exciton created within the membrane by eachphoton. This can easily be generalized but at the expense of adding another layer of statistical analysis to connectthe statistics of arriving photons to the statistics of the excitons being created within the LH2/LH1 membrane –indeed, taking a constant absorption probability less than unity would not change our main conclusions. We will alsoneglect the possibility that several photons arrive at exactly the same time. In principle, incident photons can begenerated numerically with values of B and M which are arbitrarily close to any specific (M,B) value – however thisis extremely time-consuming numerically. Instead, we focus here on specific processes where the B and M can becalculated analytically. Although this means that the entire (M,B) parameter space is not accessed, most of it canindeed be – and with the added advantage that analytic values for B and M are generated.
Figure 16 summarizes our findings in terms of the incident photons (i.e. excitation input) and metabolic outputfrom the LH2/LH1 membrane, over the entire (M,B) parameter space. The subspace shown by the combination ofthe white and dotted regions (i.e. the region in the (M,B) space which is not diagonally shaded) comprises pointswith (M,B) values that can be generated by one of three relatively simple types of photon input: (a) step input, (b)bunched input and (c) power-law step input, as shown in the three panels respectively. Each point in the blank or
24
dotted region denotes a time-series of initial excitations in the membrane with those particular burstiness and memoryvalues (B and M). This train of initial excitations then migrates within the membrane of LH2/LH1 complexes, subjectto the dynamical interplay of migration and trapping as discussed earlier in this paper, and gives rise to a given outputtime-series of ’food’ (quinol) to the bacteria. Figure 16 shows explicitly a variety of initial (M,B) values (crossesand stars) and the trajectory represents the locus of resulting quinol outputs from the reaction centers (RC) for thisparticular (M,B) input. The trajectory is generated by varying the RC closing time within the range of physicallyreasonable values. The trajectory is finite since the range of physically reasonable RC closing times is also finite (20to 1000Hz). As the time during which the RC is closed increases, the output becomes more Poisson-like, i.e. the Band M output values from the membrane after absorption at the RC, tend towards 0. Hence the trajectories headtoward the center as shown.
The (M,B) values for natural sunlight on Earth lie near M = 0 and B = 0 since the incident photon arrival fromthe Sun is approximately a Poisson process. This produces a quinol output which is also a Poisson process (M = 0and B = 0). Now suppose a terrestrial bacteria is suddenly subjected to an extreme incident light source with (M,B)values which lie at a general point in (M,B) parameter space. Can it survive? It is reasonable to expect that thebacteria will not survive if the resulting quinol output is very different from that on Earth (i.e. very different fromB = 0 and M = 0) since the bacteria is well-tuned for Life on Earth only. Hence we say that the bacteria can onlysurvive if the quinol output has (M,B) values within 0.01 of the terrestrial values of B = 0 and M = 0. The blankspaces denote (M,B) values for which the bacteria would survive, while the dotted spaces are where the bacteriawould die.
Remarkably, there are therefore substantial regions of extreme incident photon statistics (i.e. B 6= 0 and M 6= 0)where the bacteria would survive, producing a quinol output for the rest of the organism which resembles that onEarth (i.e. |B| < ε and |M | < ε where ε = 0.01). The fact that these blank spaces have an irregular form is dueto the highly nonlinear nature of the kinetic interplay between exciton migration and trapping, as discussed earlierin this chapter. For example, panel (c) shows that a bacterium which is only tuned to survive on Earth can have amaximally negative burstiness B = −1 and a maximal memory M = 1, meaning that the incident photons arrive likethe regular ticks of a clock. The same applies to all the incident photon conditions demonstrated by the blank spaces.If we make the survival criterion more generous (i.e. ε > 0.01) the blank spaces corresponding to survivability of theterrestrial bacterium increase in size until no dotted space remains (i.e. when ε = 1). All the dotted areas in Fig. 16become blank spaces and hence represent survivable incident photon conditions for the bacteria.
5. Perspectives: Photosynthetic membranes of purple bacteria as a basis to develop stable energy conversion
This chapter has covered a comprehensive review of purple bacteria adaptation to light intensity conditions and hasprovided a basis to understand the chromatic adaptation of photosynthetic harvesting membranes as a consequence ofthe requirement imposed by nature on living organisms to develop a machinery capable of fuel production in a stablemanner. It is worth to emulate, and certainly interesting to develop in artificial devices to surpass the usual bleachingon semiconductor panels, an analogous mechanism to the excitation kinetics and RC dynamics interplay, in order toshift the emphasis of requirements of fuel production and allow highly efficient energy transfer to available chargecarriers (quinones) in low light intensity conditions, while consistently, a leveled fuel (quinol) production statistics isaccomplished when photon arrival varies both in intensity and photon waiting time statistics.
Acknowledgments
The authors acknowledges financial support from Research Projects Facultad de Ciencias, Universidad de los Andes,Banco de la Republica and Fundacion Mazda.
[1] Arellano, J. B., Raju, B. B., Nakvi, K. R. and Gilbro, T. [1998]. Estimation of pigment stoichiometries in photosyn-thetic systems of purple bacteria: special reference to the (abscence of) second caroteniod in LH2, Photochemistry andPhotobiology 68: 84.
[2] Bahatyrova, S., Freese, R. N., Siebert, C. A., Olsen, J. D., van der Werf, K. A., van Grondelle, R., Niederman, R. A.,Bullough, O. A., Otto, C. and Hunter, N. C. [2004]. The native architecture of a photosynthetic membrane, Nature430: 1058.

25
FIG. 16: The (M,B) phase diagram governing survivability of a terrestrial bacteria under a wide range of incident photontime-series with a given burstiness B and memory M . The sum of the blank and dotted areas in each diagram is the regionaccessible by each of the three photon processes shown. For each (M,B) value, a time-series of photons is created with theseproperties and used to generate excitations within the membrane. The resulting quinol output time-series is then calculated.Assuming that this output needs to be similar to that on Earth, the dotted region corresponds to photon (M,B) input valuesfor which the bacteria would die, while the blank region corresponds to photon input for which the bacteria would survive. Thetrajectories represent the range of quinol outputs from the reaction centers (RC) as we span the range of physically reasonableRC closure times, given a particular input (shown as a star or cross of the same color). As the time during which the RC isclosed increases, the B and M output values tend to move toward the origin (i.e. toward B = 0 and M = 0). Bottom: Photoninputs correspond to (a) step input, (b) bunched input and (c) power-law step input. Lower row in each case shows photonarrival process (left, black barcode) and waiting time τ between photon arrivals (right, red histogram).
[3] Borisov, A. Y., Freiberg, M., Godik, V. I., K., R. K. and Timpmann, K. E. [1985]. Kinetics of picosecond bacteriochlorophyllluminescence in vivo as a function of the reaction center state, Biochimica et Biophysica Acta 807: 221.
[4] Borlaug, D., Fathpour, S. and Jalali, B. [2009]. Extreme value statistics in silicon photonics, IEEE Photonics Journal 1: 1.[5] Caycedo-Soler, F., Rodrıguez, F., Quiroga, L. and Jonhson, N. [2010a]. Interplay between excitation kinetics and reaction-
center dynamics in purple bacteria, New Journal of Physics 12: 095008.[6] Caycedo-Soler, F., Rodrıguez, F., Quiroga, L. and Jonhson, N. [2010b]. Light-Harvesting Mechanism of Bacteria exploits
a critical interplay between the dynamics of transfer and trapping, Phys. Rev. Lett. 104: 158302.[7] Codgell, R. J., Gall, A. and Kohler, J. [2006]. The architecture and function of the light-harvesting apparatus of purple
bacteria: From single molecule to in vivo membranes, Quart. Rev. Biophys. 39: 227–324.[8] Comayras, F., Jungas, C. and Lavergne, J. [2005]. Functional consequences of the orgnization of the photosynthetic
apparatus in rhodobacter sphaeroides. i. quinone domains and excitation transfer in chromatophores and reaction centerantenna complexes, J. Biol. Chem. 280: 11203–11213.
[9] Engel, G., Calhoun, T., Read, E., Ahn, T., Mancal, T., Cheng, Y., Blankenship, R. and Fleming, G. [2007]. Evidencefor wavelike energy transfer through quantum coherence in photosynthetic systems, Nature 446: 782–786.
[10] Fleming, G. R., Martin, J. L. and Breton, J. [1988]. Rates of primary electron transfer in photosynthetic reaction centresand their mechanistic implications, Nature (London) 333: 190.
[11] Forster, T. [1965]. Delocalized excitation and excitation transfer, Academic Press, New York.[12] Francke, C. and Amesz, J. [1995]. The size of the photosynthetic unit in purple bacteria., Photosynthetic Res. 46: 347.[13] Gall, A., Gardiner, A. R., Gardiner, R. J. and Robert, B. [2006]. Carotenoid stoichiometry in the LH2 crystal: no spectral
26
evidence for the presence of the second molecule on the αβ-apoprotein dimer, FEBS Letters 580: 3841.[14] Geyer, T. and Heims, V. [2006]. Reconstruction of a Kinetic model of the Chromophores Vesicles from Rhodobacter
sphaeroides, Biophyscal Journal 91: 927.[15] Goh, K. and Barabasi, A. [2008]. Burstiness and memory in complex systems, Europhy. Lett. 81.[16] Hess, S., Cachisvilis, M., Timpmann, K. E., Jones, M., Fowler, G., Hunter, N. C. and Sundstrom, V. [1995]. Temporally
and spectrally resolved subpicosecond energy transfer within the peripheral antenna complex (lh2) and from lh2 to thecore antenna complex in photosynthetic purple bacteria, Proceedings Natinal Academy of Sciences 92: 12333.
[17] Hu, X., Ritz, T., Damjanovic, A., Autenrie, F. and Schulten, K. [2002]. Photosynthetic apparatus of purple bacteria.,Quart. Rev. of Biophys. 35: 1–62.
[18] Hu, X., Ritz, T., Damjanovic, A. and Schulten, K. [1997]. Pigment Organization and Transfer of Electronic Excitation inthe Photosynthetic Unit of Purple Bacteria, Journal of Physical Chemistry B 101: 3854–3871.
[19] Jamieson, S. J. and al, e. [2002]. Projection structure of the photosynthetic reaction centre-antenna complex of Rhodospir-illum rubrum at 8.5 A resolution., EMBO Journal 21: 3927.
[20] Jang, S., Newton, M. D. and Silbey, R. J. [2004]. Multichromophoric Forster Resonance Energy Transfer, Phys. Rev. Lett.92: 218301.
[21] Jang, S., Newton, M. D. and Silbey, R. J. [2007]. Multichromophoric fo1rster resonance energy transfer from b800 tob850 in the light harvesting complex 2: Evidence for subtle energetic optimization by purple bacteria, J. Phys. Chem. B111: 6807–6814.
[22] Karrasch, S., Bullough, P. A. and Ghosh, B. [1995]. The 8.5 A. projection map of the light harvesting complex I fromRhodospirillum rubrum reveals a ring composed of 16 subunits, EMBO Journal 14: 631.
[23] Lee, H., Cheng, Y. and Fleming, G. [2007]. Coherence dynamics in photosynthesis: Protein protection of excitoniccoherence, Science 316: 1462.
[24] Lia, Y., DiMagno, T. J. Chang, T. C., Wang, Z., Du, M., Hanson, D. K., Schiffer, M., Norris, J. R., R., F. G. and Popov,M. S. [1993]. Inhomogeneous electron transfer kinetics in reaction centers of bacterial photosynthesis, J. Phys. Chem.97: 13180.
[25] Liu, L., Duquesne, K., Sturgis, J. and Scheuring, S. [2009]. Quinone pathways in entire photosynthetic chromatophores ofrhodospirillum photometricum, J. Mol. Biol 27: 393.
[26] Milano, F., A., A., Mavelli, F. and Trotta, M. [2003]. Kinetics of the quinone binding reaction at the qb site of reactioncenters from the purple bacteria rhodobacter sphaeroides reconstituted in liposomes, Eur. Journ. Biochem 270: 4595.
[27] McDermott, G., Prince, S. M., Freer, A. A., Hawthornthwaite-Lawless, A. M., Papiz, M. Z. and Codgell, J. [1995]. Crystalstructure of an integral membrane light-harvesting complex from photosynthetic bacteria, Nature 374: 517.
[28] Osvath, S. and Maroti, P. [1997]. Coupling of cytochrome and quinone turnovers in the photocycle of reaction centersfrom the photosynthetic bacterium rhodobacter sphaeroides, Biophys. Journ 73: 972–982.
[29] Panitchayangkoona, G., Hayes D., Fransteda, K. A., Caram J. R., Harel, E., Wen, J., Blankenship, R. and Engel, G. S.[2010]. Long-lived quantum coherence in photosynthetic complexes at physiological temperature, PNAS 107: 12766–12770.
[30] Pfenning, N. [1978]. The Photosynthetic Bacteria, Plenum Publishing Corporation, New York.[31] Ritz, T., Park, S. and Schulten, K. [2001]. Kinetics of exciton migration and trapping in the photosynthetic unit of purple
bacteria, Journal of Physical Chemistry B 105: 8259.[32] Roszack, A. W. and et al [2003]. Crystal Structure the RC-LH1 core complex from Rhodopseudomonas palustris, Science
302: 1969.[33] Scheuring, S., Rigaud, J. L. and Sturgis, J. N. [2004]. Variable lh2 stoichiometry and core clustering in native membranes
of rhodospirillum photometricum, EMBO 23: 4127.[34] Scheuring, S. and Sturgis, J. [2005]. Chromatic adaptation of purple bacteria, Science 309: 484.[35] Scheuring, S. and Sturgis, J. N. [2006]. Dynamics and diffusion in photosynthetic membranes from rhodospirillum photo-
metricum., Biophys. J. 91: 3707.[36] Scheuring, S., Sturgis, J. N., Prima, V., Bernadac, Levi, D. and Rigaud, J. L. [2004]. Watching the photosytnhetic
apparatus in native membranes, Proceeding of National Academy of Sciences USA 101: 1193.[37] Scully, M. O. and Zubairy, M. S. [1997]. Quantum Optics, Cambrige University Press.[38] Shreve, A. P., Trautman, J. K., Franck, H. A., Owens, T. G. and Albrecht, A. C. [1991]. Femtosecond energy-transfer
processes in the b800-b850 light-harvesting complex of rhodobacter sphaeroides 2.4.1, Biochimica et Biophysica Acta1058: 280–288.
[39] Timpmann, K., Freiberg, A. and Sundstrom, V. [1995]. Energy trapping and detrapping in the photosynthetic bacteriumrhosopseudomonas viridis: transfer to trap limited dynamics, Chemical Physics 194: 275.
[40] Timpmann, K., Zhang, F., Freiberg, A. and Sundstrom, V. [1993]. Detrapping of excitation energy transfer from thereaction center in the photosynthetic purple bacterium rhodospirillum rubrum, Biochemical et Biophysica Acta 1183: 185.
[41] van Amerongen, H., Valkunas, L. and R, G. [2000]. Photosynthetic Excitons, World Scientific Publishing Co., Singapore.[42] van Grondelle, R. Dekker, J., Gillbro, T. and Sundstrom, V. [1994]. Energy transfer and trapping in photosynthesis,
Biochim. et Biophys. Acta 11087: 1–65.[43] Visscher, K., Bergstrom, H., Sundstrom, V., Hunter, C. and van Grondelle, R. [1989]. Temperature dependence of
energy transfer from the long wavelength antenna bchl-896 to the reaction center in rhodospirillum rubrum, rhodobactersphaeroides (w.t. and m21 mutant) from 77 to 177k, studied by picosecond absorption spectroscopy, PhotosynthesysResearch 22: 211.
[44] Visscher, K. J., Chang, M. C. van Mourik, F., Parkes-Loach, P. S., Heller, B. A., Loach, P. A. and van Grondelle, R. [1991].Fluorescence polarization and low-temperature absorption spectroscopy of a subuntit form of light harvesting complex I
27
from purple photosynthetic bacteria, Biochemistry 30: 5734.[45] Waltz, T., Jamieson, S. J., Bowers, C. M., Bullough, P. A. and Hunter, C. N. [1998]. Projection structure of three
photosynthetic complexes from Rhodobacter sphaeroides: LH2 at 6 A, LH1 and RC-LH1 at 25 A 282: 883.