energy and phytate phosphorus in wheat by broiler …
TRANSCRIPT

Effect of supplemental enzymes on the utilization of energy and phytate phosphorus in wheat by broilerchicksby Ragothaman Ramachandran
A thesis submitted in partial fulfillment of the requirements for the degree of Master of Science inAnimal ScienceMontana State University© Copyright by Ragothaman Ramachandran (1994)
Abstract:In mature cereal grains, legumes and oil seeds, the major portion of the total phosphorus is present inthe form of phytic acid (phytate). A mixture of fiber degrading enzyme, proteolytic and phospholyticenzymes were supplemented to a wheat soybean meal based diets and were evaluated for theireffectiveness in improving the production performance of Broiler chicks and their ability to release thephytate phosphorus from wheat and soybean meal and expose to endogenous phosphatases present inthe gastrointestinal tract of the chick. Three experiments were conducted. In the first experiment threevarieties of wheat were compared with and without enzyme at 0.1% level. In the second experimentfour different levels of dietary phosphorus were compared with and without enzyme at 0.1% level. Inthe third experiment six levels of enzyme mixture were compared. Production performance of chicksfed diets supplemented with enzyme did not differ from those fed the control diets in all the threeexperiments. Level of dietary phosphorus had a positive correlation to fecal excretion of calcium andphosphorus and Bone Ash content. Enzyme mixture did not have any effect on phosphorus or calciumexcretion. In order to release the phosphorus from phytin in a high fiber diets possibly warrants use ofthe phytase enzyme obtained from microbial sources apart from using fiber degrading enzyme so thatthe combined effect could increase effective phosphorus utilization from cereal grains and legumes andbetter utilization of fiber to improve performance in chicks.

EFFECT OF SUPPLEMENTAL ENZYMES ON THE UTILIZATION OF
ENERGY AND PHYTATE PHOSPHORUS IN WHEAT BY
BROILER CHICKS
by
Ragothaman Ramachandran
A thesis submitted in partial fulfillment of the requirements for the degree
of
Master of Science(
in
Animal Science
MONTANA STATE UNIVERSITY Bozeman, Montana
March 1994
ii
APPROVAL
of a thesis submitted by
Ragothaman Ramachandran
This thesis has been read by each member of the thesis committee and has been found to be satisfactory regarding content, English usage, format, citations, bibliographic style, and consistency, and is ready for submission to the College of Graduate Studies.
.5 % ^ / / y ///< /Date Chairperson, GraduateCbmmittee
Approved for the Major Department
3 M / WT 7
Date Iajor Department
Approved for the College of Graduate Studies
Date Graduate Dean

STATEMENT OF PERMISSION TO USE
In presenting this thesis in partial fulfillment of the requirements for a
master’s degree at Montana State University, I agree that the Library shall make
it available to borrowers under rules of the Library.
If I have indicated my intention to copyright this thesis by including a
copyright notice page, copying is allowable only for scholarly purposes, consistent
with "fair use" as prescribed in the U.S. Copyright Law. Requests for permission
for extended quotation from or reproduction of this thesis in whole or in parts may
be granted only by the copyright holder.
Signature
Date

ACKNOWLEDGEMENTS
My sincere thanks to Dr Walt Newman for his support, guidance, and
encouragement throughout my graduate program. Without his direction and tireless
assistance it would have been impossible to complete my degree. To Dr. Rosemary
Newman, a sincere thanks for her confidence in me. I wish to recognize Petrea
Hofer for her patience, understanding and guidance during the entire course of my
project work.
Warm appreciation is extended to all the work study students in the lab. I
am grateful to my fellow graduate students, Alan and Linji, who provided continual
moral support. Additionally, I wish to thank Finnfeeds International inc.
Marlbourough, U.K and Dr. Mike Bedford for their financial support of this
Research project.
Special thanks to my Mom, Dad and family, who are many miles away and
yet had faith in me and provided me with encouragement.

INTRODUCTION
TABLE OF CONTENTSPage. I
LITERATURE REVIEW .....................................................................................
Enzymes and Their Use in Poultry D ie ts ...............................................................The science of Enzymology....................................................................... . . . ,
Historical perspective..................................................................................... ..Enzyme classification....................................................................... ..
Enzyme use in industry and agriculture................... . . ....................................Historical perspective.......................................................................................... ..Substrate targets in poultry diets . . .................................................... .............Enzymes for substrate targets in poultry diets .................................................
Present status of Enzyme applications in poultry d iet................................. .. . ./3-glucanase...........................................................................................................Pentosanase . . . ............................................................... ............. .....................Phytase...................................................................................................................
STATEMENT OF THE PROBLEM ....................................................................Hypothesis and objectives......................................................... ..........................
MATERIALS AND M ETH O D S.............................. ....................... .....................
Grains, Preparation, Sampling, Tissue Collection and Chemical Analyses . .Chicks and Experimental conditions................... .. ........................................ ..Experiments and diets . ...................... ............................. ..Statistical analysis.................................................................................. .............
RESULTS .................................................... .. .................... ................. .. ................
DISCUSSION................................................. ........................................... ...........
SUM M ARY........... .. ................................... .. .............................. .. .....................
, 3
3334557
1012
.14,16.18
2223
24
24252628
.33
,57
,60
LITERATURE CITED 62

Vl
LIST OF TABLES
Table Page
1. Percentage composition of diets fed inExperiment I, (as fed b asis)................... ........................................... .. .............29
2. Percentage composition of diets fed inExperiment 2, (as fed b asis)............................................................ ...................30
3. Percentage composition of diets fed inExperiment 3, (as fed b asis)................... ................................ ........................ .31
4. Percentage composition of wheats andsoybean meal, on dry matter basis......................................................................32
5. Percentage composition of diets fed inExperiment I, as analyzed................................................................................... 42
6. Growth performance of broiler chicks fed diets prepared with three varieties ofwheat with and without an Enzyme supplementin Experiment I .............................. ........................................... ........................ 43
7. Growth performance of broiler chicks fed diets prepared with three varieties of wheat with and without enzymesupplement in Experiment I ................................................................ 44
8. Composition of feces produced by chicks at two and three weeks age fed diets prepared with three types of wheat with and withoutan Enzyme supplement in Experiment I ..........................................................45
9. Composition of feces produced by chicks at two and three weeks age fed diets prepared with three types of wheat with and withoutan Enzyme supplement in Experiment I ...........................................................46
vii
LIST OF TABLES— Continued
Table Page
10. Percentage composition of diets fed inExperiment 2, as an a lyzed ....................................................................... 47
11. Growth performance of Broiler chicks fed differing levels of phosphorus with andwithout an enzyme supplement in Experiment 2 ......................................... 48
12. Growth performance of broiler chicks fed diets with differing levels of phosphorus with and without anenzyme supplement in Experiment 2 ................................................................ 49
13. Composition of feces produced by chicks at three and six weeks age fed diets prepared with differing levels of phosphorus with andwithout an Enzyme supplement in Experiment 2 .................................... . . 5 0
14. Composition of feces produced by chicks at two and three weeks age fed diets prepared with differing levels of phosphorus with andwithout enzyme supplement in Experiment 2 ........................... ...................51
15. Percentage bone ash of chicks at three and sixweeks age in Experiment 2 ............................................................................ 52
16. Percentage composition of diets fed inExperiment 3, analyzed on a dry matter b asis................... ...........................53
17. Growth performance of Broiler chicks fed differinglevels of supplemental enzymes in Experiment 3 .................................... . . 5 4
18. Composition of feces produced by chicks at two and three weeks age fed diets prepared with differing levels of supplemental enzymes inExperiment 3 .........................................................................................................55
19. Percentage bone ash of three week old chicks inExperiment 3 ........................ 56

viii
ABSTRACT
In mature cereal grains, legumes and oil seeds, the major portion of the total phosphorus is present in the form of phytic acid (phytate). A mixture of fiber degrading enzyme, proteolytic and phospholytic enzymes were supplemented to a wheat soybean meal based diets and were evaluated for their effectiveness in improving the production performance of Broiler chicks and their ability to release the phytate phosphorus from wheat and soybean meal and expose to endogenous phosphatases present in the gastrointestinal tract of the chick. Three experiments were conducted. In the first experiment three varieties of wheat were compared with and without enzyme at 0.1% level. In the second experiment four different levels of dietary phosphorus were compared with and without enzyme at 0.1% level. In the third experiment six levels of enzyme mixture were compared. Production performance of chicks fed diets supplemented with enzyme did not differ from those fed the control diets in all the three experiments. Level of dietary phosphorus had a positive correlation to fecal excretion of calcium and phosphorus and Bone Ash content. Enzyme mixture did not have any effect on phosphorus or calcium excretion. In order to release the phosphorus from phytin in a high fiber diets possibly warrants use of the phytase enzyme obtained from microbial sources apart from using fiber degrading enzyme so that the combined effect could increase effective phosphorus utilization from cereal grains and legumes and better utilization of fiber to improve performance in chicks.

I
INTRODUCTION
With increasing cost of production using conventional cereal grains like corn
and sorghum in poultry diets, the poultry industry is turning to unconventional
grains like barley, oats, rye, and wheat. . The latter is often price-competitive with
other small grains when bread quality standards are not met. Of the four small
grains, wheat has the greatest feed potential due to its high starch and low fiber
content. Although it is difficult to maximize growth performance with these grains,
compared to highly digestible, high energy-dense diets based on corn, the use of
supplemental enzymes may solve the digestibility problem to a certain extent.
In the Pacific Northwest and Great Plains states, barley and wheat are grown
in large quantities while oats and rye are grown to a lesser extent. These grains are
readily available in these areas of the country and are less expensive than corn,
which must be shipped from midwestem markets. Wheat and barley are often used
in poultry diets, but, wet, sticky fecal waste (litter quality) and inefficiency in
performance of birds somewhat restricts their use, even when they are more cost
effective than com. Apart from performance problems, increased excretion of
phosphorus and nitrogen in fecal waste from both poultry and pigs fed small grains
has caused concern in areas of high population densities of animals and humans.

2
Certain enzymes have been tested in poultry feeds as a potential solution for litter
quality and growth problems. Some success in performance has been achieved at
the experimental level, although it remains to be seen if supplemental enzymes will
work as well in commercial operations and in different production environments.
Phytate represents a potentially valuable source of phosphorus for
monogastrics and removal of the phosphate groups deactivates its anti-nutrient
activity. Phytate hydrolyzing enzymes, phytases, are produced in a variety of
microorganisms and in limited amounts in monogastric animals (Power and Kahn,
1993). The concept of adding microbial phytase to the feedstuffs of monogastric
animals to effect the release of phytate phosphorus was described over 25 years ago
(Ware et al., 1967). Recent trials have shown that supplemental microbial phytase
significantly improves phytate phosphorus availability in diets for monogastricsI
(Cromwell et al., 1994). Although the commercial production of microbial-derived
phytase is now possible, technical difficulties still exist which preclude the
widespread use of this enzyme in feedstuffs. The main area of concern for the most
commonly used phytase (Aspergillus ficuum phytase) is its behavior under different
pH conditions. The enzyme is unusual in that it has two pH optima; one at 2.5 and
the other at 5.5. It is 48% less active at pH 2.5 than at pH 5.5 (Power and Kahn,
1993). The second major obstacle is that, while quite thermo-tolerant, pelleting at
70°C reduced the enzyme’s activity by 25%. Pelleting temperatures of SO0C or
greater led to unacceptable loss of activity (Schwarz and Hoppe, 1992).
3
LITERATURE REVIEW
Enzymes and Their Use in Poultry Diets
The Science of Enzymology
Historical Perspective. The science of enzymology began in the early 19th
century with the discovery by Payen Persoz in 1833 that an alcohol precipitate of
malt extract contained a thermolabile substance which converted starch into
fermentable sugars. The enzyme was termed diastase because of its ability to
separate soluble dextrins from insoluble starch grains. Several enzymes, including
pepsin, polyphenol oxidase, peroxidase and invertase were identified in the middle
and late 19th century. In 1884, Jokichi Takamine patented the first industrial
application for an enzyme which he named "Taka-Diastase". This diastatic enzyme
was derived from a mold, Aspergillus oryzae, that was grown on rice; Enzymology
evolved at a relatively slow pace over the next few years. The term "enzyme" was
first proposed by Kuhne in 1878 and Emil Fischer developed the concept of enzyme
specificity in 1894. The studies of Fischer resulted in the famous "lock and key"
analogy of enzyme substrate interaction which is illustrated in the following
equation:
[Enzyme]+ [Substrate] -» [Enzyme-Substrate] = [Enzyme]+[Product]

4
With the acceptance off this concept, quantitative methods were developed for
describing the action off enzymes. In 1913, Michaelis and Menton derived their
famous mathematical expression which described quantitatively the kinetic behavior
off the enzyme substrate complex (Lehninger, 1975).
Several research groups began purifying enzymes in the 1920’s, although the
chemical composition off these compounds remained unknown. In 1926 Sumner was
the first to succeed in purifying and crystallizing an enzyme which released ammonia
from urea. Sumner reported the enzyme (urease) to be a protein, but it was not
until 1929 that this was acknowledged by the scientific community. Following
Sumner’s publication in 1926, many enzymes were crystallized and purified in the
1930’s. In 1959, Koshland introduced the "induced fit" concept off enzyme substrate
combination. The "induced fit" theory retained the Fischer’s concept off
stereospecific conformation between enzyme and substrate, but rejected the idea that
the binding site on the enzyme was a rigid structure. Koshland proposed that the
presence off substrate near the active site could cause changes which would bring
about a closer fit between substrate and enzyme (Lehninger, 1975).
Enzyme Classification. Enzymes are proteins which are natural catalysts
produced by living cells (Enari, 1983). Underkofler et al. (1958) proposed the
following definition off an enzyme: "Enzymes are biocatalysts, produced by living
cells to bring about specific biochemical reactions generally forming parts off the
metabolic process off the cells. Enzymes are highly specific in their action on
substrates and often many different enzymes are required to bring about, by

5
concerted action, a sequence of metabolic reactions performed by the living cell. All
enzymes which have been purified are protein in nature, and may or may not
possess a non-protein prosthetic group".
Enzymes are named and classified according to their specificity for substrate
and resulting reactions. The letters "ase" are added to end of the name of the\
substrate upon which the enzyme acts. There are six groups into which enzymes are
classified, depending upon the reaction catalyzed. These are oxidoreductases,
transferases, hydrolases, lyases, isomerases, and ligases. Each classification is
further subdivided until enzymes are identified by a chemically meaningful six figure
code. Enzymes are also classified as "endo" or "exo", referring, to the way the
enzyme attacks the substrate molecule. Endo- enzymes attack the substrate at the
interior bonds, while exo- enzymes approach the substrate from one or the other
ends of the molecule (Dixon and Webb, 1964).
Enzyme use In industry and agriculture
Historical Perspective
The first serious attempts to use enzymes for industrial purposes in the early
1900’s met with limited success. This was due largely to a lack of understanding of
enzyme activity. As knowledge progressed with the characterization of enzymes and
an understanding of enzyme kinetics, applications were developed for a variety of
industrial processes. The majority of enzymes currently used in industry i.e.,
pectinases, lipases, carbohydrases, etc. may be described as hydrolytic
depolymerases. The inclusion of proteases and amylases in detergent preparations

6
is the single most significant industrial application of enzymes to date.
Carbohydrases, especially amylases and pectinases, account for a significant portion
of the remaining market. Glucose isomerase is one of the few non-depolymerases
that is widely used in industry (Sears and Walsh, 1993). A growing use of enzymes
is their application to analytical biochemistry as in the analysis for extractable and
nonextractable /J-glucans developed by McCleary and Glennie-Holmes (1985).
Various enzymatic preparations have been used medically as digestive aides,
such as lactase for lactose intolerance in people. The therapeutic benefit of using
enzymes for such purposes in humans has been long recognized (Sears and Walsh,
1993). Similarly, the concept of using microbial-derived enzymes in animal feeds to
improve the nutritive value of low quality feeds and the performance of animals
dates back over thirty years. Feeding of partially sprouted barley and rye was
found to increase the nutritive value of these grains in early 1950’s. The
improvements were possibly due to the activation of endogenous native enzymes
present in the seeds. Two of the early attempts in enzyme application to improve
animal feed were made by Jensen et al. (1957) and Biimett (1962), who added crude
amylase and protease preparations to chicken diets. These preparations were later
found to contain jS-glucanase activity (Rickes et al., 1962). Ware et al.(1967) and/
Nelson et al. (1968) demonstrated the effectiveness of microbial produced phytase
for increasing the utilization of phosphorus from plant sources by chickens. As with
the industrial application of enzymes, several factors contributed to failure or low
overall effectiveness of enzymes in these earlier attempts to use them in animal
7
feeds. These factors included the use of crude enzyme preparations, little
understanding of animal physiology and feedstuff composition, as well as little
knowledge of optimal pH for maximum enzymatic activity, and the mode and
kinetics of the reactions. Confusion also developed because of differences in
response to supplemental enzymes by different experimental animals.
Although a great amount of research has been performed, it is only recently
that the true potential of incorporating enzymes into animal diets has been
appreciated. Goals of enzyme supplementation of animal diets are to remove or
destroy anti-nutritive factors, enhance overall digestibility, render certain nutrients
biologically available, and reduce the pollution impact of animal excreta (Inborr,
1989). Since the early beginnings, applied research on the use of enzymes in diets
for poultry and other monogastric animals has greatly intensified.
Substrate Targets in Poultry Diets/ '
Cereal grains make up the greatest portion (70 to 80%) of poultry diets in
North America, with the bulk of the rest being soybean meal and other high protein
feedstuffs (USDA, 1992). In the Northern Great Plains and Pacific Northwest states,
wheat and barley are the major cereal grains. Smaller amounts of rye, triticale and
oats are also grown. These crops are referred to as small grains, as opposed to corn
or maize. Although considerable amounts of com are used in poultry diets in this
geographical area, it must be imported at substantial cost from the midwestern and
southern states.
The majority of the components in small grain cereals, as with corn, are
8
carbohydrates (> 80%) which are primarily starch and nonstarch polysaccharide
(NSP) with a small portion (I to 3%) of free sugars (Henry, 1985). Of the
carbohydrates in small grain cereals, 75% to 90% is composed of starch, with
nonstarch polysaccharides (NSP) making up from 10 to 25% of the total. Although
cereal grains provide a significant portion of protein to poultry diets, the major
nutrient furnished by cereal grains is energy. Dietary energy is primarily derived
from starch with smaller amounts coming from lipids, nonessential amino acids, free
sugars and NSP. Most of the NSP is not digested by monogastrics because they
lack the necessary enzymes in the gastrointestinal tract to do so. That portion of
NSP that is digested furnishes only a small percentage of the total energy released
from the cereal grains. This is accomplished primarily in the caecum and large
intestine by microbial fermentation. In many instances, the soluble portion of NSP
in cereal grains increases the viscosity of the digesta thereby restricting nutrient
absorption not only affecting the absorption of basic nutrients such as glucose, fat
and protein (Fengler and Marquardt, 1988b; Wang, 1992), but the utilization of
calcium, phosphorus and zinc (Southgate, 1987; Gordon, 1990). Under these
conditions soluble NSP are classified as antinutrients.
Two forms of starch are found in cereal grains, amylose and amylopectin.
Amylose is a linear chain of glucose units linked via a-1,4 glycosidic bonds.
Amylopectin, on the other hand, is highly branched. Successive glucose units are
linked via a-1,4 glycosidic bonds with branching points linked with a-1,6 glycosidic
bonds. The NSP of small grain cereals is composed principally of cellulose, mixed

9
linked (1-3), (l-4)-j3-gIucans, commonly referred to as /3-glucans, and pentosans
(arabinoxylans). Covered or hulled barley and oats are the only small grains that
contain significant amounts of cellulose. Most of the cellulose in barley and oats is
in the hulls, although small amounts are found in the aleurone and endosperm cell
walls as is the case with wheat, rye, and triticale. Naked or hulless barley is similar
to wheat and rye in cellulose content. Although not a carbohydrate, lignin is
generally included as part of NSP because of its relationship with cellulose. /3-
glucans are the major NSP in the endosperm and cell walls of barley and oats. In
barley, /3-glucans are found in both the aleurone and endosperm cell walls but in
greater concentrations in the latter. The concentration of /8-glucans in barley as well
as their molecular weights vary with genotype (Bengtsson et al., 1990; Xue et al.,
1991). In contrast to barley, /3-glucans in oats are concentrated in the outer portion
of the kernel with considerably less in the endosperm cell walls (Back and Stone,
1981). About one-third of the endosperm cell wall NSP in barley is arabinoxylan.
In wheat, rye, and triticale, arabinoxylans are the major NSP with only small
amounts of /3-glucans (Mares and Stone, 1973; Ciacco and D’Appolonia, 1982;
Henry, 1985). As with /3-glucans in barley and oats, the arabinoxylans of wheat,
rye, and triticale are located in the aleurone and endosperm cell walls (D’Appoloma
and MacArthur, 1976). Two types of pentosans have been described in rye
(Bengtsson and Aman, 1990). Pentosan-1 is characterized by single arabinose units
linked /3-(1-3) to the primary xylan /3-(l-4) chain. A second fraction, Pentosan-2 was
isolated and found to contain sequential xylose residues (4-5) that were doubly
10
branched at the -2 and -3 positions.
Phytic acid comprises 1.0 to 1.5% of the content of cereal grains and typically
represents from 50 to 80% of total seed phosphorus (Raboy, 1990). Phytic acid is
principally deposited as discrete globular inclusions in single-membrane storage
microbodies referred to as protein bodies (Pemollet, 1978; Lott, 1984). In wheat
and barley, the protein bodies contain proteinaceous matrix, which surrounds
phytate-rich globoid crystals (Jacobsen et al., 1971; Raboy, 1990). Most of the
phytate (approximately 90%) in wheat (and possibly in barley) is found in the
aleurone, with about 10% found in the germ (embryo and scutellum). In maize, the
reverse occurs, with nearly 90% of the phytate localized in the germ and 10% in the
aleurone (O’Dell et al., 1972).
Enzymes for Substrate Targets in Poultry Diets
The major starch degrading enzymes are oc- and /8-amylases, glucoamylases,
pullulanases, and isoamylases (Lehninger, 1975). or-Amylase is an endo-enzyme
which splits a-l,4-glucosidic bonds, except for that of maltose, in an apparently
random fashion. /3-Amylase, an exo-enzyme, effects the successive removals of
maltose units from the nonreducing ends of glucose chains in starch. Neither or- nor
/8-amylase exhibits activity against or-(l-6) bonds or against /3-(l-4) bonds.
Glucoamylase, also known as amyloglucosidase, is an exoenzyme catalyzing the
sequential removal of glucose residues from the nonreducing ends of the glucose
chains, splitting both or-(1-4) bonds and or-(1-6) bonds. Pullulanase and isoamylase
are endoenzymes capable of hydrolyzing or-(l-6) bonds found at the branching points

11 :
in amylopectin. Endoenzymes that catalyze the hydrolysis of a-(l-6) bonds are
called debranching enzymes. Under normal conditions, starch in cereal grains is
almost completely converted to glucose for absorption by the digestive system.
Cleavage of the (3-(l-4) glycosidic bonds in cellulose requires a combination
of celluloses rather than any specific single enzyme (Sears and Walsh, 1993).
Additionally, lignin encrustation renders access to the glycosidic bonds in cellulose
by the enzymes difficult, if not impossible. The most important enzymes that
depolymerize the cell wall /3-glucans are the (1-3),(1-4) |3-glucan 4 glucohydrolases.
Two (1-3), (l-4)-j8-glucan endohydrolases have been purified from extracts of
germinated barley. The optimum pH for these /S-endoglucanases is 4.7, thus they
are not entirely suited to the gastric or intestinal pH of monogastric animals. The
complete depolymerization of cell wall arabinoxylans in barley is accomplished by
the concerted action of endo- and exoxylanases, a-arabinofuranosidase, and possibly
xylobiase (Preece and MacDougaIl, 1958).
The enzyme phytase (mesoinositol hexaphosphate phosphohydrolase) acts on
phytate to yield inositol and orthophosphates (Reddy et al., 1982). Phytase occurs
in varying amounts in plants and is produced by yeast, fungi, and bacteria
(Patwardhan, 1937). While the flora of ruminants are well known to produce potent
phytases (Reid et al., 1947) it is less commonly known that phytate hydrolyzing
enzymes exist in the intestines of most monogastric animals (Spitzer and Phillips,
1945; Nelson, 1967; Davies et al., 1970; Davies and Motzok, 1972; Pointillart et al.,
1984) including humans (Bitar and Reinhold, 1972) 4 However, these enzymes are

I
extremely weak and are inhibited by nutrients such as calcium (Power and Kahn,
1993). Cereal grain seeds have active phytases, but these enzymes have pH optima
ranging from 5.0 to 7.5, making them apparently unsuitable for use at low stomach
pH values (Power and Kahn, 1993). However, earlier reports indicate that plant
phytases retain their activity under in vitro conditions similar to that of the chick
intestine (Singsen et al., 1944; Courtois, 1945; MoIlgaard, 1946).
Present status of Enzyme applications in poultry diets
/3-Glucanases and pentosanases are the two major categories of enzyme
supplements that have been extensively researched and are currently used
commercially in poultry feeding systems with the intent to improve nutrient
utilization, litter quality and (or) egg cleanliness. Of the two enzymes, /3-glucanase
has proven in many experiments to be dramatically effective (Hesselman et al.,
1982). Pentosanases have shown variable results (Annison, 1992). Poultry research
reports on the specific effects of other enzyme categories such as celluiases,
pectinases, proteases, lipases, and amylases are limited. Most enzyme additives for
animal feeds are crude preparations and generally exhibit activity towards a range
of substrates (Campbell and Bedford, 1992). Commercial enzyme products are often
blends of two or more of the enzyme groups and are referred to as "enzyme
cocktails" (H. Graham, personal communication).
Little scientific evidence supports the use of amylases in poultry diets, even
though the concept of improving starch digestibility for genetically improved, fast
growing birds is intriguing. The pioneering studies of Willingham et al. (1959)
12
13
showed that crystalline amylase was ineffective in improving barley diets for poultry
and that the beneficial effects he reported were due to /3-glucanase present in the
crude enzyme mixture. Amylase excretion in the small intestine of poultry is
obviously at such a level that starches are well digested and utilized (Moran, 1982).
It has been postulated by a number of authors (see review by Campbell and
Bedford, 1992) that very young birds could benefit most from amylases and other
enzyme supplements in the feeds. Such is the case with jS-glucanase and
pentosanases, but scientific evidence with other enzyme systems to support this
contention is limited (Campbell and Bedford, 1992).
Equally intriguing as the idea of using amylases is the concept of using
cellulase to enhance energy levels in feedstuffs high in insoluble fiber, such as hulled
barley, oats or byproducts of the brewing and distilling industries. The process of
enzymatic hydrolysis of cellulose is extremely complex, however, involving many
different cellulase activities. Additionally, cellulose is rarely found in pure form in
nature (cotton being the exception), especially in feedstuffs.
Currently, phytase is the only enzyme that has the potential to dramatically
improve nutrient utilization in poultry feeds at the same magnitude as that of
glucanases and pentosanases. Given a maximum effect on phytate, the resulting
improvements could exceed that of these two carbohydrases. Whereas the problems
of jg-glucans are limited to barley and oats, and pentosans to rye and to a lesser
extent wheat, phytate is universally present in all plant material. As previously
noted, phytate in feedstuffs represents a major source of phosphorus for meeting the

14
requirements for growth and bone development, but as such is almost' entirely
unavailable for poultry. The fact that phytate is an antinutrient, in that it
irreversibly chelates divalent cations and interferes with amino acid absorption in
the gastrointestinal tract of birds as well as other monogastrics, is sufficient cause
to attempt to remove it from feedstuffs. Additionally, the fecal excretion of phytate
phosphorus and chelated minerals is a major source of soil and water pollution when
wastes are applied to farm land. Given these three reasons, improved utilization of
plant phosphorus, removal of an antinutrient and the reduction of pollution, the
successful utilization of phytase should surpass the overall benefits of any other
single enzyme or enzyme system used in feeding regimens for monogastric animals,
including poultry.
The following is a review of the pertinent early research and current reports
on the application of glucanase, pentosanase and phytase to poultry diets.
/?-glucanase
Supplementation of barley diets with glucanase has been shown to be effective
in improving growth rate and feed efficiency of poultry. The greatest benefits have
been shown in young broiler chicks (Elwinger and Saterby, 1987), although feeding
trials to market weight have also demonstrated benefits in older birds (Campbell et
al., 1984; Classen et al., 1988). As noted previously, in early work with
carbohydrases, enzymes utilized were in crude mixtures. Rickes et al. (1962)
obtained a purified glucanase from the enzyme mixture fed earlier by Jensen et
al.(1957); they concluded that j3-glucanase was responsible for improvement in

15
performance of the birds. GohI et al. (1978) reported that /3-ghicanase or water
treatment (mixing with warm water for 2 hours followed by drying) did not
significantly influence the nutritional value of medium viscosity barley. However,
when applied to high viscosity barley, /3-glucanase or water treatment improved
litter quality as well as performance of the birds. Hesselmann et al. (1981) showed
that /3-gIucanase supplementation as a dry powder in the feed or drinking water of
broiler chicks improved feed consumption, weight gain, and feed efficiency up to 21
days of age. Dry matter of excreta was increased and cage cleanliness was improved
when the enzyme was consumed. This and later studies by Hesselmaim et al.(1982;
1986) confirmed earlier findings of Rickes et al. (1962) that j8-glucanase was the
active enzyme in improving the growth rate and feed efficiency of broiler chicks.
Response to dietary /3-glucanase is not uniform among barleys. Early reports
alluded to differences between "Western" and "Eastern" barley (Willingham et al
1960). Western barley gave poorer initial growth of broilers, but a larger response
to dietary enzyme inclusion. This difference was attributed by these authors to
possibly higher endogenous enzyme (/3-glucanase) levels found in Eastern barley.
Burnett (1966) found that Australian barley had lower endogenous /3-glucanase levels
than Irish barley which corresponded to their feeding value. However, the pH
optima of endogenous /S-glucanases in the barley kernel precludes very little if any
benefit from these enzymes under normal feeding conditions. Absolute viscosity
and /S-glucan levels of barley are affected by both genotype and environment
(Aastrup, 1979; Hesselman and Thomke, 1982; Hockett et al., 1987; Newman and

16
Newman, 1987;1988). Barleys having higher levels of /5-glucans always show greater
response to glucanase supplementation as measured by improved chick performance
(Newman and Newman, 1987; 1988; Classen et ah, 1988; CampbeU et aL, 1989).
Although studied much less extensively than barley, oats appear to behave similarly
in regard to 0-glucan content and /^glucanase supplementation (Elwinger and
Saterby, 1987; Pettersson et aL, 1987; Cave et aL, 1990).
Several studies reported improvement in the absorption of fat, starch,
nitrogen, and amino acids by chicks fed enzyme treated barley (Classen et aL, 1988;
Hesselman and Aman, 1986; Edney et aL, 1989; Rotter et aL, 1989; Wang, 1992).
The improvement in nutrient digestibility in barley is believed to foe due to the
reduction of digesta viscosity by disruption of the /3-glucan molecule. Complete
conversion of 0-glucan to glucose by /3-glucanase would theoreticaUy increase the
metabolizable energy of barley or oats; however, most researchers conclude that the
major effect is due to the reduced digesta viscosity.
Pentosanases
Halpin et al. (1936) concluded that rye was unsuitable for poultry because of
reduced feed consumption and poor growth which was accompanied by sticky
droppings. Similar results were found in later studies reported by Wieringa (1967)
and Moran et al. (1969). It was then confirmed that nutrient utilization was
depressed in chicks fed rye based diets (Misir and Marquardt, 1978a,b,c,d;
Marquardt et al., 1979; Lee and Campbell, 1983) and the resulting performance was
severely depressed.
17
Studies by Marquardt et al. (1979) and Antoniou et al. (1980) revealed that
the depression of nutrient digestion, especially that of saturated fat, was due to a
nonspecific antinutritional factor in rye. This factor was found to be concentrated
in a water extractable fraction and it was hypothesized to be a water soluble portion
of the pentosans (Fernandez et al., 1973a; Antoniou and Marquardt, 1981.
Fractionation studies by Antoniou et al. (1981) indicated that the fraction causing
nutrient depression was water soluble and was in fact rich in pentosans. Reports
of Fengler and Marquardt (1988a,b) confirmed these findings. In vitro studies by
Fengler and Marquardt (1988b) demonstrated that a pentosan-rich fraction extracted
from rye impeded the dialysis of three different salts and glucose. Digestion of the
pentosan with a crude extract of Trichoderma viride eliminated the viscosity of the
solution and the dialysis rate was normalized. These authors further demonstrated
that nearly all of the antinutritive activity of rye, as assessed by fat retention, was
associated with the pentosan rich isolate. The causative factor of sticky droppings
in poultry consuming barley was determined to be jS-glucans which cause excessive
losses of fat (Wang, 1992). The similar problem with sticky droppings from poultry
fed rye diets was eliminated by supplemental /3-ghicanase and xylanase (Pettersson
and Aman, 1989). These studies and that of GrootWassink et al. (1989), who fed
a crude arabinoxylanase preparation to broiler chicks, confirmed that the
antinutritive factor in rye grain is a water soluble pentosan. Further, these reports
confirm the efficacy of pentosanase enzymes for improving the nutritive value of
poultry diets based on rye.

18
The pentosans of wheat have also been implicated as antinutritive factors for
poultry. Choct and Annison (1990) reported that addition of isolated arabinoxylans
to broiler chick diets caused a depression in apparent metabolizable energy (AME)
and growth. It has also been demonstrated that glycanase (glucanase + xylanase)
supplementation of wheat-based broiler chick diets is beneficial (Mborr and
Graham, 1991), indicating that wheat NSP are deleterious to broiler chick
performance. A recent study showed a strong negative correlation between wheat
(Australian) AME values and the level of water soluble -NSP, which are
predominately arabinoxylans (Annison, 1991). A later report by this author
provided further evidence that cell wall material of wheat possesses antinutritive
activity which may be reduced by supplementation of diets with glycanase
preparations (Annison, 1992). In this study, supplemental enzymes raised the AME
of wheat from 14.26 MJ/kg to 15.2 to 15.75 MJ/kg. From studies such as these it
may be possible at some future date to predict nutritive value of wheat based on
viscosity extracts which are directly related to intestinal viscosity created by
pentosans (Choct and Annison, 1992) as /3-glucans in barley (Campbell et al., 1989,
Rotter et al., 1989; Wang et al., 1992).
Phytase
Phytate represents a potentially valuable source of phosphorus for
monogastric animals because small grain cereals contain relatively high levels of this
compound. Additionally, soybean meal, the most commonly used source of
supplemental protein in poultry , diets in North America, contains even higher levels

of phytate than cereal grains (Raboy, 1990). Phytate phosphorus, however, must
be released enzymatically in order to become available for absorption and utilization
in animals. As noted previously, low levels of active phytase occur in
gastrointestinal tracts of humans, poultry, and other animals. Wheat, rye, triticale,
and their byproducts, and to a lesser extent barley, were fairly rich sources of
phytase (McCance and Widdowson, 1942; Mollgaard, 1946); whereas, oats, com,
and soybean meal contained little or no phytase. Recently, Bos (1990) reported that
wheat, triticale, jye and wheat grits contained high levels of phytase while barley
contained moderate amounts. Pigs fed wheat- or barley-based diets require less
supplemental phosphorus than those fed com- or grain sorghum-based diets to
maximize performance and bone mineralization (Cromwell et al., 1972a, 1974;
1979). These results could have been influenced by the higher total levels of
phosphorus in these grains compared to that in com and grain sorghum. However,
other researchers have reported that the availability of wheat or triticale phosphorus
is higher than that of corn for pigs (Pointillart et al., 1984, 1987) and poultry
(Sauveur, 1989). A review of literature by Nelson (1967) on the utilization of
phytate phosphorus by poultry cited widely varying views of researchers up to that
date on the availability of plant phosphorus. The preponderance of data presented
by Nelson (1967) indicated that it is questionable whether any portion of phytate
phosphorus should be considered available for utilization by poultry.
Phytate interference with mineral absorption is a well documented fact in
humans (McCance and Widdowson, 1942; Reinhold, 1971; Reinhold et al.,1973;

20
Reinhold et al., 1976; Faramarz et ah, 1977) and domestic animals (Melanby, 1949;
Vohra and Kratzer, 1966; Reinhold et al., 1974; Southgate, 1987). Phytate can form
undigestible chelates with metallic divalent cations such as zinc, nnagnpcmimi and iron
(Graf, 1986). The severity of phytate interference on mineral absorption depends
upon several factors: the presence and activities of endogenous seed and yeast (in
leavened breads) phytases, type of phytate salt, i.e., magnesium, potassium etc.,
dietary calcium level, total dietary fiber level and type (soluble or insoluble),
presence of vitamin D, species and age of animals (Reinhold et al., 1976; Farah et
al., 1984; Ballam et al., 1985). For several years, it has generally been accepted
among nutritionists that phytase has the potential to enhance phosphorus availability
when added to the diets of nonruminants. Recent studies with pigs have clearly
demonstrated enhancement (Simons et al., 1990; Jongbloed et al., 1990; Ketaren et
al., 1991; Mroz et al., 1991; Lei et al., 1991; Young et al., 1993; Cromwell et al.,
1994; Power and Kahn, 1993). These studies showed one or more of the following
improvements: increased overall phosphorus digestibility, improved phytate
phosphorus availability, increased growth rate, increased feed efficiency, improved
ileal protein digestibility and protein deposition, increased bone strength and
decreased fecal phosphorus.
Nelson et al. (1968) were the first to report an improvement in the
availability of phytate phosphorus in chicks due to supplemental phytase. The
enzyme, produced by a culture of Aspergillus Jicuum (strain NRRL 3135), was added
to liquid soybean meal and incubated at SO0C for 24 hours. When treated dried
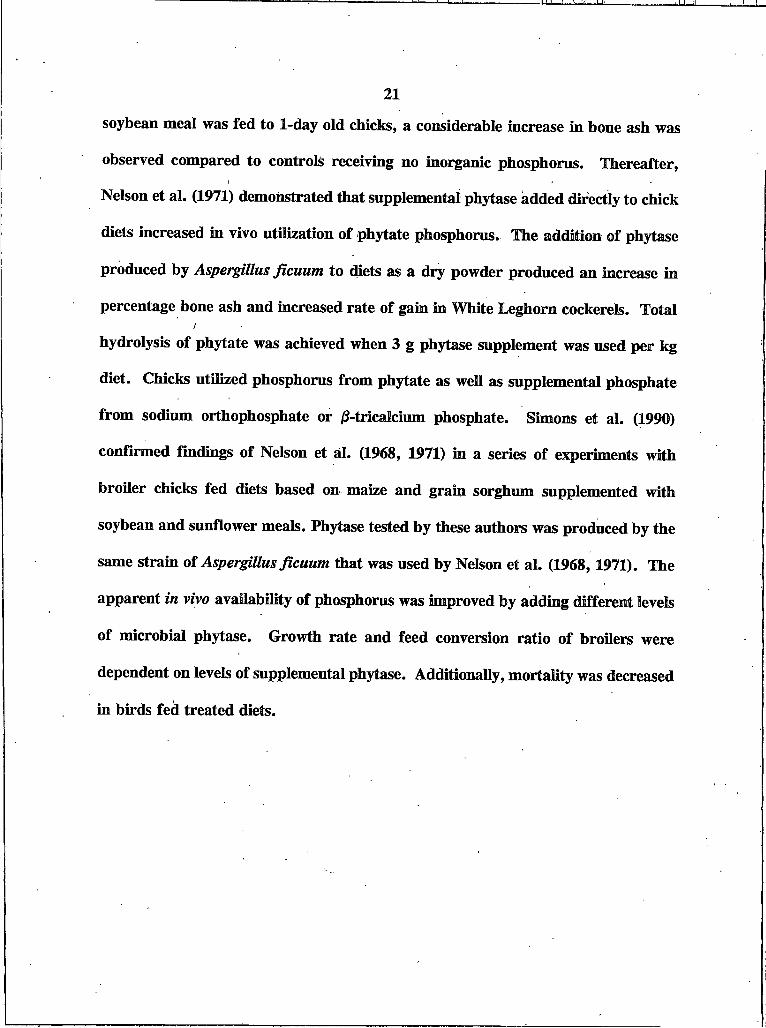
21
soybean meal was fed to 1-day old chicks, a considerable increase in bone ash was
observed compared to controls receiving no inorganic phosphorus. Thereafter,
Nelson et al. (1971) demonstrated that supplemental phytase added directly to chick
diets increased in vivo utilization of phytate phosphorus. The addition of phytase
produced by Aspergillus ficuum to diets as a dry powder produced an increase in
percentage bone ash and increased rate of gain in White Leghorn cockerels. TotalI
hydrolysis of phytate was achieved when 3 g phytase supplement was used per kg
diet. Chicks utilized phosphorus from phytate as well as supplemental phosphate
from sodium orthophosphate or jS-tricakium phosphate. Simons et al. (1990)
confirmed findings of Nelson et al. (1968, 1971) in a series of experiments with
broiler chicks fed diets based on maize and grain sorghum supplemented with
soybean and sunflower meals. Phytase tested by these authors was produced by the
same strain of Aspergillusficuum that was used by Nelson et al. (1968,1971). The
apparent in vivo availability of phosphorus was improved by adding different levels
of microbial phytase. Growth rate and feed conversion ratio of broilers were
dependent on levels of supplemental phytase. Additionally, mortality was decreased
in birds fed treated diets.
22
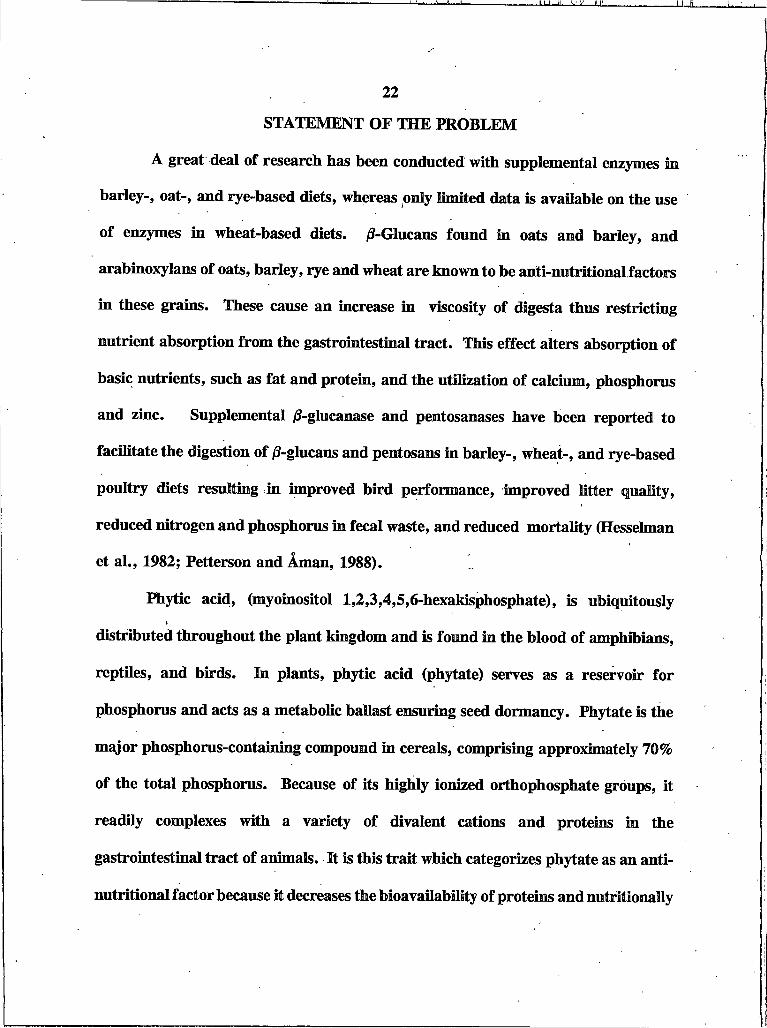
STATEMENT OF THE PROBLEM
A great deal of research has been conducted with supplemental enzymes in
barley-, oat-, and rye-based diets, whereas only limited data is available on the use
of enzymes in wheat-based diets. /J-Glucans found in oats and barley, and
arabinoxylans of oats, barley, rye and wheat are known to be anti-nutritional factors
in these grains. These cause an increase in viscosity of digesta thus restricting
nutrient absorption from the gastrointestinal tract. This effect alters absorption of
basic nutrients, such as fat and protein, and the utilization of calcium, phosphorus
and zinc. Supplemental /J-glucanase and pentosanases have been reported to
facilitate the digestion of /S-glucans and pentosans in barley-, wheat-, and rye-based
poultry diets resulting in improved bird performance, improved litter quality,
reduced nitrogen and phosphorus in fecal waste, and reduced mortality (Hessehnan
et al., 1982; Petterson and Aman, 1988).
Phytic acid, (myoinositol 1,2,3,4,5,6-hexakisphosphate), is ubiquitously
distributed throughout the plant kingdom and is found in the blood of amphibians,
reptiles, and birds. In plants, phytic acid (phytate) serves as a reservoir for
phosphorus and acts as a metabolic ballast ensuring seed dormancy. Phytate is the
major phosphorus-containing compound in cereals, comprising approximately 70%
of the total phosphorus. Because of its highly ionized orthophosphate groups, it
readily complexes with a variety of divalent cations and proteins in the
gastrointestinal tract of animals. It is this trait which categorizes phytate as an anti-
nutritional factor because it decreases the bioavailability of proteins and nutritionally

23
important minerals such as calcium, zinc, magnesium and iron. In addition to its
anti-nutrient activity, phytate phosphorus is unavailable for use by monogastrics due
to the absence of sufficient levels of endogenous phytase in their digestive tracts
(Power and Kahn, 1993).
Hypothesis and Objectives
Hypothesis
The presence of arabinoxylan in the cell wall structure of wheat aleurone and
endosperm tissue possibly inhibits the digestibility of starch and protein by
preventing contact with digestive enzymes. Fiber degrading enzymes, such as
xylanase may enhance the digestive process by permitting greater enzyme/substrate
contact.
The location of phytate in the aleurone layer of wheat kernels, suggests that
the use of fiber-degrading enzymes such as j8-glucanase and pentosanase in
combination with phytase, could possibly enhance the activity of the latter or
endogenous phytases in the gastrointestinal tracts of monogastric animals.
Objectives
(1) To evaluate the effectiveness of a mixture of supplemental xylanase,
protease, and phosphatase on the production performance of broiler chickens fed
wheat-soybean meal diets, and
(2) To evaluate the ability of these enzymes to release phytate from the plant
cell walls, exposing the compound to endogenous microbial phytases present in the
gastrointestinal tract of chickens.

24
MATERIALS AND METHODS
Grains, Preparation, Sampling, Tissue Collection and Oianical Analyses
Three types of wheat were used in this study, hard red spring (BOlS), hard
red winter (HRW) and soft white (SW). All were grown near Bozeman MT in 1991.
The HRS and SW wheats were provided by Western Plant Breeders, Inc., Bozeman
MT and the HRW wheat was grown on the Montana Agricultural Experiment
Station farm. The three wheats were compared in Experiment I with and without
enzyme. HRW wheat was fed in Experiment 2 and 3 to test the effect of level of
phosphorus and enzyme mixture. Experiments I and 3 were conducted for three
weeks and Experiments for six weeks. Com was fed instead of wheat in adaptation
diets. Soybean meal (44% protein), obtained from a local feed supplier, was used
for supplemental protein in all diets. Prior to incorporation into diets, the com,
wheats and soybean meal were ground through a 3.175 mm hammer mill screen.
For analyses, representative samples of the ground grains and soybean meal were
further ground in a Udy cyclone sample mill through a .5 mm screen. Analyses of
the grains and soybean meal included dry matter, protein, ether extract
(Anonymous, 1971), acid detergent fiber, ash, (AOAC, 1980), calcium (Clark and
Collip, 1925), phosphorus (Fiske and SubbaRow, 1925), phytic acid (HRW wheat;
Raboy et al., 1984), total dietary fiber, insoluble dietary fiber, and soluble dietary
25
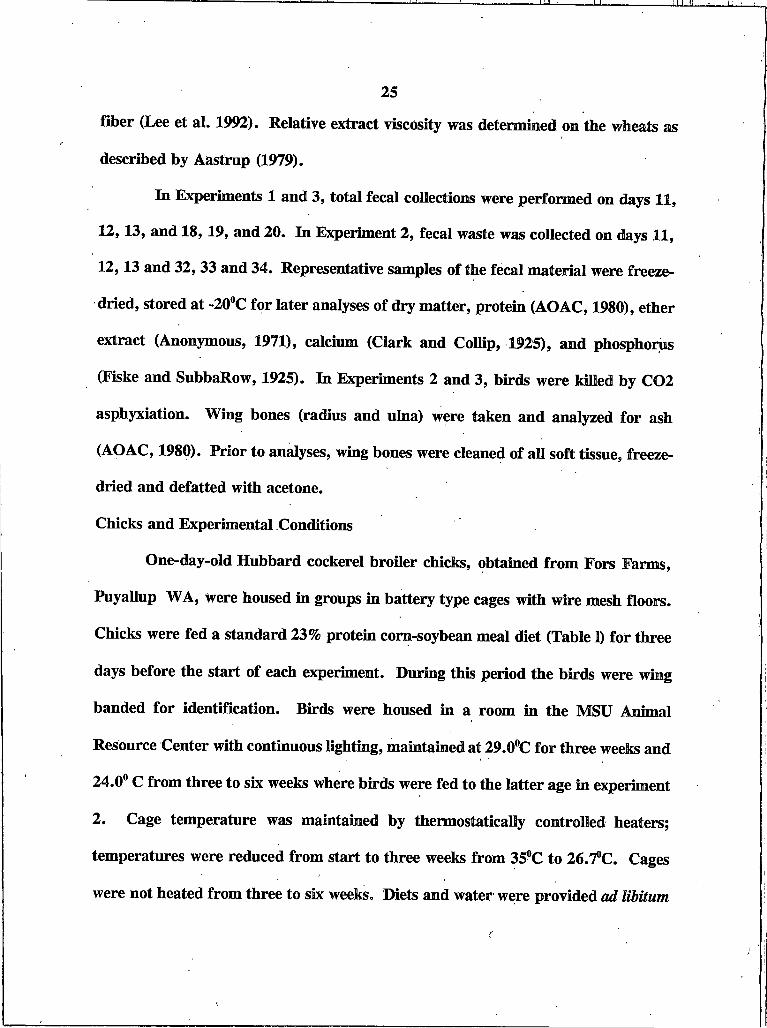
fiber (Lee et al. 1992). Relative extract viscosity was determined on the wheats as
described by Aastrup (1979).
In Experiments I and 3, total fecal collections were performed on days 11,
12,13, and 18, 19, and 20. In Experiment 2, fecal waste was collected on days 11,
12,13 and 32, 33 and 34. Representative samples of the fecal material were freeze-
dried, stored at -20°C for later analyses of dry matter, protein (AOAC, 1980), ether
extract (Anonymous, 1971), calcium (Clark and Collip, 1925), and phosphorus
(Flske and SubbaRow, 1925). In Experiments 2 and 3, birds were killed by C02
asphyxiation. Wing bones (radius and ulna) were taken and analyzed for ash
(AOAC, 1980). Prior to analyses, wing bones were cleaned of all soft tissue, freeze-
dried and defatted with acetone.
Chicks and Experimental Conditions
One-day-old Hubbard cockerel broiler chicks, obtained from Fors Farms,
Puyallup WA, were housed in groups in battery type cages with wire mesh floors.
Chicks were fed a standard 23% protein corn-soybean meal diet (Table I) for three
days before the start of each experiment. During this period the birds were wing
banded for identification. Birds were housed in a room in the MSU Animal
Resource Center with continuous lighting, maintained at 29.0°C for three weeks and
24.0° C from three to six weeks where birds were fed to the latter age in experiment
2. Cage temperature was maintained by thermostatically controlled heaters;
temperatures were reduced from start to three weeks from 35°C to 26.7°C. Cages
were not heated from three to six weeks. Diets and water were provided ad libitum

26
for each treatment. Experiment I contained four replicates of eight birds per group
for a total of 192 birds. Experiment 2 contained three replicates of 10 birds per
group for a total of 240 birds. Experiment 3 contained three replicates of eight
birds per group for a total of 192 birds. Individual body weights were recorded
initially, weekly, and at the conclusion of each experiment. Feed consumption for
each cage was recorded at the end of each week and at the end of the experiment.
Birds that died or were removed due to deformed legs during the course of the study
were identified, weighed and the date and cage number recorded. Feed consumed
by chicks that died before completion of experiment was taken into account while
calculating the total feed intake of each cage group. Feed/gain (F/G) ratio was
calculated weekly for each group and for the overall feeding period.
Experiments and Diets
A total of 192 male Hubbard broiler chicks were used in Experiment I to
determine the influence of wheat type (hard red spring (HRS), hard red winter
(HRW), soft white (SW) with and without dietary supplemental enzymes (Avizyme®,
Finnfeeds International, Marlborough UK) on average daily gain, average daily feed
intake, feed efficiency, fecal composition, and bone ash. Avizyme is an enzyme
mixture containing xylanase, amylase and protease enzymes. Six wheat-soybean
meal based rations were formulated to contain 21% protein and 1.2% lysine (NRC,
1984) (Table I). NRC, (1984) recommended minimum levels of all nutrients were
met or exceeded in all diets. Cornstarch was added in the nonsupplemented diets
to compensate for the enzyme added in the supplemented diets. This experiment

27
consisted of chicks in four replicate groups of six dietary treatments in a 3x2
factorial treatment arrangement.
In the second experiment a total of 240 male Hubbard day old broiler chicks
were used to determine the influence of four levels of total dietary phosphorus
(0.54%, 0.49%, 0.44%, and 0.39%) on a HRW wheat-soybean based diet with and
without enzyme xylanase (Table 2) on average daily gain, average daily feed intake,
feed efficiency, fecal composition, and bone ash. After three weeks of feeding, one-
half of the birds from each cage were sacrificed for bone analysis and the remainder
killed and bones taken for analysis at the end of six weeks. This experiment
consisted of 10 chicks in three replicate groups of eight dietary treatments in a 4x2
factorial arrangement of treatments.
In Experiment 3, a total of 192 day old male Hubbard broiler chicks were
used to determine the influence of six levels of an enzyme mixture containing
xylanase, protease and phosphatase enzymes on averages daily gain, averages daily
feed intake, feed efficiency, fecal composition, and bone ash. This experiment
consisted of eight chicks in three replicate groups of eight dietary treatments. Seven
diets were formulated to contain 0.55% total phosphorus with the following enzyme
supplements: Diet I, negative control with no enzyme; diet 2, 0.0002 % phosphatase;
diet 3, 0.001% phosphatase; diet 4, 0.005% phosphatase; diets 5, 6 and 7 were
prepared as diets 2, 3, and 4 + 0.1% xylanase/protease mixture + 0.02% xylanase,
respectively. An eighth diet was formulated to contain 0.67% total phosphorus with
no enzyme supplement for a positive control (Table 3).

28
Statistical Analysis
Data were analyzed by ANOVA using the General Linear Model procedure
(SAS, 1985). The interaction between wheat type and enzyme supplement was tested
in Experiment I. In Experiment 2, the data were analyzed for linear, quadratic and
cubic effects. Differences between means were compared by Least-Square Means
using MSUSTAT (Lund, 1987).
r

Table I. Percentage composition of diets fed in Experiment I, (as fed basis).
DietWheat*Enzyme
IHRS
+
2
HRS3
HRW+
4HRW
5SW
+
6
SW
Wheat 58.70 58.70 58.70 58.70 52.70 52.70
Soybean meal 32.00 32.00 32.00 32.00 38.00 38.00
Com oil 4.00 4.00 4.00 4.00 4.00 4.00
Dicalcium 1.90 1.90 1.90 1.90 1.90 1.90phosphate
Limestone 2 . 1 0 2 . 1 0 2 . 1 0 2 . 1 0 2 . 1 0 2 . 1 0
Salt 0.50 0.50 0.50 0.50 0.50 0.50
Vitamin/Trace 0.25 0.25 0.25 0.25 0.25 0.25mineral mixb
Antibioticd 0 . 1 0 0 . 1 0 0 . 1 0 0 . 1 0 0 . 1 0 0 . 1 0
DL-Methionine 0.15 0.15 0.15 0.15 0.15 0.15
Choline chloride 0 . 2 0 0 . 2 0 0 . 2 0 0 . 2 0 0 . 2 0 0 . 2 0
Enzymec 0 . 1 0 - 0 . 1 0 - 0 . 1 0 -
Cornstarch - 0 . 1 0 - 0 . 1 0 - 0 . 1 0
"HRS=Hard red spring wheat; HRW= Hard red winter wheat; SW= Soft white wheat.1VitaminyTrace mineral mix (per 454g of mix) Vitamin A, 2,000,000 LU); VitaminD,, 500,000 LU; Vitamin E, 6,000 LU; Vitamin B11, 2.5mg; Riboflavin, l,100mg; D pantothenic acid, 2,000mg; Choline, 70,000mg; Niacin, 7,000mg; Pyridoxine,700mg; Menadione, 600mg; Thiamine, 350mg’; Folic acid, 180mg; d-Biotin, 30mg; Manganese, 99.9mg; Zinc, 120 Jm g; Iron, 154.4mg; Copper, 15.4mg; Iodine, 0.14mg; Selenium, O.OSmg. "Enzyme=Avizyme (xylanase/amylase/protease)-10,000 units/g.* Terramycin-50 .

Table 2. Percentage composition of diets fed in Experiment 2, (as fed basis).
Diet I 2 3 4 5 6 7 8
Wheat* 56.03 56.13 56.11 56.21 56.28 56.38 56.38 56.48
Soybean meal 32.15 32.15 32.15 32.15 32.15 32.15 32.15 32.15
Com oil 5.90 5.90 5.90 5.90 5.90 5.90 5.90 5.90
Limestone 1.64 1.64 1.78 1.78 1 . 8 8 1 . 8 8 1.99 1.99
Dicalcium 1.55 1.55 1.33 1.33 1.06 1.06 0.85 0.85phosphate
L-Lysine 0.08 0.08 0.08 0.08 0.08 0.08 0.08 0.08
DL-Methionine 0.30 0.30 0.30 0.30 0.30 0.30 0.30 0.30
Vitamin/Trace 1 . 0 0 1 . 0 0 1 . 0 0 1 . 0 0 1 . 0 0 1 . 0 0 1 . 0 0 1 . 0 0
mineral mixb
Mineral mix' 1 . 0 0 1 . 0 0 1 . 0 0 1 . 0 0 1 . 0 0 1 . 0 0 1 . 0 0 1 . 0 0
Salt 0.25 0.25 0.25 0.25 0.25 0.25 0.25 0.25
Enzymed 0 . 1 0 0 . 1 0 0 . 1 0 0 . 1 0 - - - -
“Hard red winter wheat.
kVitaminZTrace mineral mix (per 454g of mix) Vitamin A, 2,000,000 LU; Vitamin D3, 500,000 LU; Vitamin E, 6,000 LU; Vitamin B11, 23m g; Riboflavin, l,100mg; D-pantothenic acid, 2,000mg; Choline, 70,000mg; Niacin, 7,000mg; Pyridoxine, 700mg; Menadione, 600mg; Thiamine, 350mg; Folic acid, IgOmg; d Biotin, 30mg; Manganese, 99.9mg; Zinc, 385Jm g; Iron, 154.4mg; Copper, 15.4mg; Iodine, 0.14mg; Selenium, O.OSmg.
'Mineral mix (g/kg) - Calcium phosphate dibasic, 500g; sodium chloride, 74g; potassium citrate monohydrate, 220g; Potassium sulfate, 52g; Magnesium oxide, 24g; Manganous carbonate, 3^g ; Ferric citrate, 6g; Zinc carbonate, 1.6g; Cupric carbonate, OJg; Potassium iodate, O.Olg; Sodium selenite, O.Olg; Chromium potassium sulfate, 0J5g; Sucrose, 118g.
'Enzyme- Xylanase - 10,000 units/g.

Table 3. Percentage composition of Diets fed in Experiment 3, (as fed basis).
Diets I 2 3 4 5 6 7 8
Wheat” 52.865 52.8648 52.864 52.86 52.7448 52.744 52.74 53.685
Soybean meal 38.56 38.56 38.56 38.56 38.56 38.56 38.56 37.06
Com oil 5.20 5.20 5.20 5.20 5.20 5.20 5.20 5.20
Dicalcium 0.50 0.50 0.50 0.50 0.50 0.50 0.50 1.70phosphate
Limestone 2.24 2.24 2.24 2.24 2.24 2.24 2.24 1.72
Vitamin/Trace 0.275 0.275 0.275 0.275 0.275 0.275 0.275 0.275mineral mixb
Salt 0.25 0.25 0.25 0.25 0.25 0.25 0.25 0.25
L-Lysine 0.05 0.05 0.05 0.05 0.05 0.05 0.05 0.05
DL-Methionine 0.06 0.06 0.06 0.06 0.06 0.06 0.06 0.06
Enzyme mix-lc - 0 . 0 0 0 2 0 . 0 0 1 0.005 0 . 0 0 0 2 0 . 0 0 1 0.005 -
Enzyme Hiix-Zd - - - - 0 . 1 0 0 . 1 0 0 . 1 0 -
Enzyme mix-3* - - - - 0 . 0 2 0 . 0 2 0 . 0 2 -
"Hard red winter wheat.kVitaminZTrace mineral mix (Per 2500 g). Vitamin B11, IOmg; Riboflavin, 6,000mg; Niacin, 30,000mg; D pantothenic acid, 9000mg; choline chloride, 500,000mg; Menadione, 4,000mg; Folic acid, 300mg; Ethoxyquin, 56,700mg; Thiamine, l,000mg; Pyridoxine,I 1OOOmg; Selenium, 272mg; DL-Methionine, 1,135 g; Biotin, lOOmg; Vitamin A, 10,000,000 LU; Vitamin D,, 4,000,000 LU; Vitamin E, 10,000 LU., Manganese, 750mg, Copper, 40mg, Iodine, 12Jm g, Zinc, 555mg, Iron,' 417Jm g.cEnzyme mix-1 - Phosphatase 10,000 units/g.dEnzyme mix-2 - xylanase/protease mixture, 100 units of each/g."Enzyme mix-3 - xylanase 10,000 units/g.

Table 4. Percentage composition of wheats and soybean meal as analyzed on dry matter basis.
Experiments I and 2
Wheats/Soybeanmeal"
Drymatter
Protein Etherextract
Ash Aciddetergentfiber
Totaldietaryfiber
Viscositycp
SW 91.7 8.4 1.7 1.5 2.5 1 0 . 2 0.93
HRS 91.0 1 2 . 0 2 . 2 1.4 3.4 1 1 . 1 0.99
HRW 90.7 1 2 . 1 1 . 8 1.4 2 . 8 1 0 . 8 0.96
SBM 91.5 46.6 1 . 0 6 . 1 5.3 20.5 .
Experiment 3
Drymatter
Protein Etherextract
Ash Calcium Phosphorus total phytate
Aciddetergentfiber
Totaldietaryfiber
HRW 92.9 1 2 . 0 1.9 1.7 0.03 0.36 0.25 3.3 1 1 . 6
SBM 90.6 44.5 1 . 2 5.8 0.16 0.66 0.46 4.3 2 0 . 2
‘SW = soft white wheat; HRS= hard red spring wheat;HRW= hard red winter wheat; SBM= soybean meal. cpCentipoise units.
33
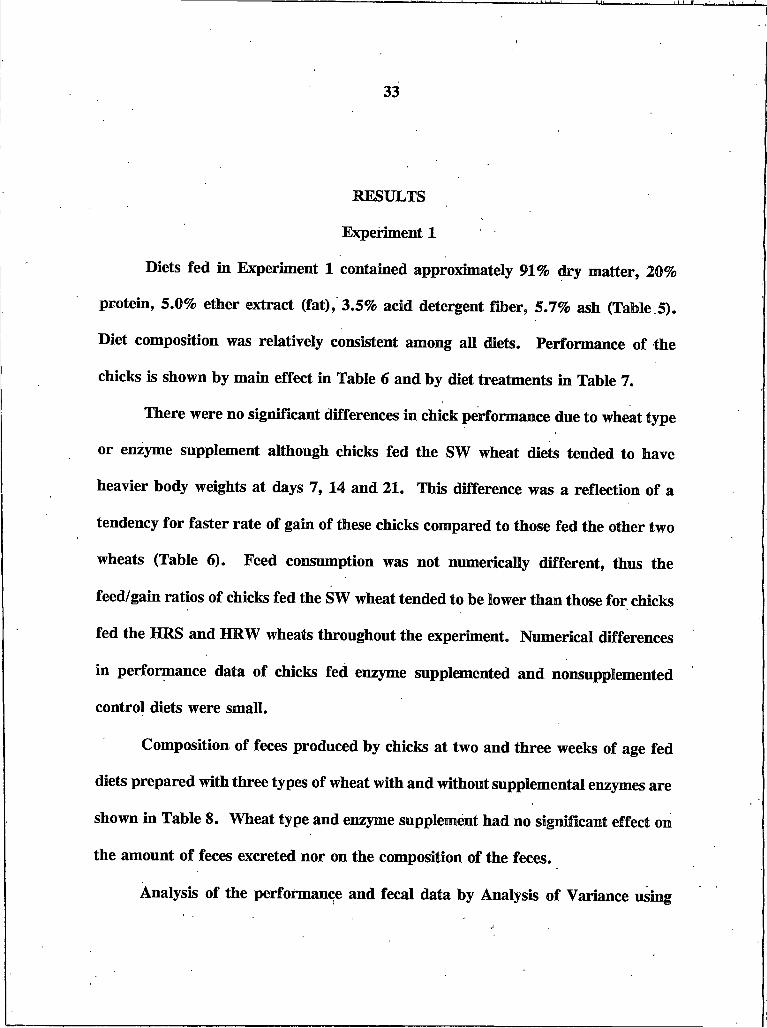
RESULTS
Experiment I
Diets fed in Experiment I contained approximately 91% dry matter, 20%
protein, 5.0% ether extract (fat), 3.5% acid detergent fiber, 5.7% ash (Table 5).
Diet composition was relatively consistent among all diets. Performance of the
chicks is shown by main effect in Table 6 and by diet treatments in Table 7.
There were no significant differences in chick performance due to wheat type
or enzyme supplement although chicks fed the SW wheat diets tended to have
heavier body weights at days 7, 14 and 21. This difference was a reflection of a
tendency for faster rate of gain of these chicks compared to those fed the other two
wheats (Table 6). Feed consumption was not numerically different, thus the
feed/gain ratios of chicks fed the SW wheat tended to be lower than those for chicks
fed the HRS and HRW wheats throughout the experiment. Numerical differences
in performance data of chicks fed enzyme supplemented and nonsupplemented
control diets were small.
Composition of feces produced by chicks at two and three weeks of age fed
diets prepared with three types of wheat with and without supplemental enzymes are
shown in Table 8. Wheat type and enzyme supplement had no significant effect on
the amount of feces excreted nor on the composition of the feces.
Analysis of the performance and fecal data by Analysis of Variance using

34
Least Significant Differences to differentiate between diet means for the three wheats
(HRS, HRW and SW) with (+) and without (-) enzyme supplement (Enz) are shown, (
in Tables 8 and 9 respectively. Chick body weights differed (P<0.05) among diet
treatments on days 7,14 and 21 (Table 8). On day 7, average body weight was
highest in chicks fed SW+Enz and SW-Enz, lowest in those fed HRS+Enz,
intermediate in the rest of the treatment groups. On day 14 and 21, chicks fed
SW+ Enz had the highest weights and those fed HRW+ Enz had the lowest weights.
Average daily feed intake differed (P< .05) among the diet treatments. Feed intake
was lowest for chicks fed HRS+Enz, highest for those fed SW-Enz with other■ '
treatments similar to each other at Day 7. At day 14, intake was highest for chicks
fed SW-Enz with other treatments similar to each other. Average daily feed intake
at day 21 was highest for chicks fed diets HRS-Enz, HRW-Enz5 SW+Enz and SW-
Enz while those fed HRS+Enz and HRW+Enz were lowest. Average daily body
weight gain was lowest for chicks fed HRS+Enz, highest for those fed SW+Enz,
with other treatments intermediate on Day 7. On day 14, gains were highest for
chicks fed SW+ Enz & SW-Enz, lowest for those fed HRW+ Enz. By day 21, weight
gains of chicks fed HRS and HRW diets were similar to each other. Chicks fed SW
had higher gain than those fed HRW+Enz but similar to those fed HRS+Enz, HRS-
Enz and HRW-Enz diets. Feed conversion ratio was highest for chicks fed HRS-
Enz, HRW+Enz, HRW-Enz diets and lowest for those fed SW+Enz, SW-Enz and
HRS+Enz diets at day 7. By day 14, chicks fed SW+Enz and HRS+Enz diets were
lowest while those fed HRW+Enz, HRW-Enz, SW-Enz, HRS-Enz diets were
similar to each other. Chicks fed HRS-Enz diet had feed conversion similar to all
treatments except chicks fed SW+Enz diet. There were no differences in feed
conversion ratio among treatments by day 21.
Total fecal excreta differed (PC0.05) among the diets (Table 9). Excretion
was highest in chicks fed SW-Enz diet and lowest in those fed diet HRS+Enz and)
HRW+Enz at 2 weeks of age (Table 9). At 3 weeks of age the highest value was
seen in chicks fed SW-Enz and HRW+Enz diet, while the lowest was recorded for
those fed SW+ Enz diet. Both at 2 and 3 weeks, enzyme treated groups tended to
excrete less total feces than the control groups although the differences were not
significant (P>0.05). Percentage dry matter and protein in the feces did not differ
among treatments at either the second or third week. During the second week, fecal
ash differed (P<0.05) among the chicks; those fed the HRW+Enz diet had the
highest fecal ash, and those fed HRS-Enz diet had the least fecal ash.
During the third week, feces of chicks fed SW+Enz & SW- Enz diet differed
(PC0.05) in ether extract from those fed diets HRW and HRS diets. Chicks fed
HRW+ Enz diet had the highest (PC0.05) fecal ash, and those fed SW-Enz had the
lowest fecal ash.
Experiment 2~
Diets fed in Experiment 2 contained 90 to 91% dry matter; and
approximately 21% protein, 6.5% fat (ether extract), 11.6% total dietary fiber, 6.2%
ash, 1% calcium and 0.46% total phosphorus (Table 10). Diet composition was
relatively consistent among all diets. Performance of the chicks is shown by main
35
36
effect in Table 11 and by dietary treatments in Table 12.
Analysis of the data for linear, quadratic and cubic effects of dietary
phosphorus level are shown in Table 11. Dietary phosphorus level had a significant
linear effect (P < 0.05) on chick body weight, average daily feed intake, and average
daily gain at both 21 day and 42 day periods, while there was a significant linear*
effect (P < 0.05) on feed/gain ratio at the 21 day period. There were no differences
(P>0.05) in the feed/gain ratio at 42 days. There was no effect (P>0.05) due to
supplemental enzyme at any level of phosphorus although chicks fed the enzyme
tended to have the lowest feed/gain ratio on day 42.
Chick performance data comparing the level of dietary phosphorus with and
without supplemental enzymes is shown in Table 12. At 21 days, chicks fed 0.44%
total phosphorus with enzyme supplement had the highest body weight, and 0.49%
total phosphorus control group had the lowest body weight with rest of the
treatments having intermediate values. Except for the low phosphorus group
(0.39%) all the other groups with enzyme supplementation had similar body weights
compared to their controls. At 42 days, the 0.44% phosphorus with enzyme
supplementation group had the highest body weight and the low phosphorus control
group had the lowest body weight, except chicks fed diets 4,5,6. Other treatment
combination had intermediate results. Chicks fed with various diets differed
(P < 0.05) in average daily feed intake, average daily weight gain and feed conversion
ratio both at 21 days and 42 days (Table 12). At 21 days of age, chicks fed diet 4i
(containing enzyme supplement) had the lowest feed intake and lowest weight gain
v

37
compared to all other diet treatments. Chicks fed diet 6, with 0.49% phosphorus
and no enzyme supplementation, had higher feed intake than those fed diets 3,4,7
and 8. At the end of 42 days the same trend was observed with chicks fed the
enzyme supplemented diet with 0.39% phosphorus (diet 4) having the lowest feed
intake and those fed the high phosphorus control diet with 0.54% phosphorus (diet
5) with the highest feed intake. Chicks fed various diets differed (PC0.05) in body
weight gain with high phosphorus control diet (diet 5) having higher gain than those
fed diets 3,7,8 and those fed the low phosphorus enzyme supplemented diet (diet 4)
having the lowest gain at the end of 21 days. At 42 days, chicks fed diets 1,3 and
5 had the highest gains and those fed diets 2,4 and 8 had the lowest gains. Chicks
fed the high phosphorus diet with enzyme (diet I) had a better feed conversion ratio
(P < 0.05) than those fed diet 8 at 21 days, while at 42 days, those fed diet 6 had a
higher feed conversion ratio than those fed diets 4,5 and 7. The enzyme supplement
did not influence the feed conversion ratio, regardless of phosphorus level.
Effects of dietary phosphorus level and supplemental enzymes on fecal
excretion and composition are shown in Table 13. There were no significant effects
(P>0.05) in fecal weight, percentage dry matter, ether extract or ash due to
phosphorus level or supplemental enzyme. There were, however, significant effects
in the percentage of fecal calcium and phosphorus due to diet treatment. Feces from
chicks fed the low phosphorus diet (0.39%) contained a higher (P>0.05) percentage
of calcium at 21 days. At 42 days, however, feces from chicks fed the intermediate
dietary phosphorus levels (0.49% and 0.44%) contained more (P < 0.05) calrinm than

38
the feces from those fed the high and low dietary phosphorus levels. Fecal
phosphorus was not significantly affected by dietary phosphorus level at 21 days
although there was a tendency for the feces from chicks fed the highest level of
phosphorus to contain more phosphorus. At 42 days, feces from chicks fed the high
phosphorus diet contained more (P > 0.05) phosphorus than those fed the other three
diets. Feces from chicks fed the 0.49% phosphorus diet were intermediate in
phosphorus and higher (P < 0.05) than feces from those fed the low phosphorus diet.
The percentage of calcium in feces from chicks fed the supplemental enzymes
tended (P> 0.05) to be higher than that in feces from chicks fed the control diets at
day 21. This difference was continued at day 42 and was significant (P<0.05). The
supplemental enzyme had no effect (P> 0.05) on percentage fecal phosphorus at day
21 or 42.
Total fecal excreta differed (PC0.05) among the diets at three weeks (Table
14) with the highest excretion occurring from chicks fed diets 2, 5 and 6. The lowest
excretion occurred in those fed diet 4. At all levels of phosphorus, there was no
difference between the enzyme treated and untreated groups in the amount of feces
excreted. During the second collection at six weeks, chicks fed diet 5 had the highest
fecal excretion while those fed diet 2 had the least amount of fecal excreta.
No differences occurred in fecal dry matter between treated and control
groups at all levels of dietary phosphorus both at three and six weeks of age.
Chicks fed low phosphorus diet 4 with enzyme differed (P<0.05) in fecal
calcium excretion from the rest of treatments at three weeks (Table 13). At six

weeks both the presence of enzyme and phosphorus level in diets influenced fecal
calcium excretion. Feces from chicks fed various diets differed (P<0.05) in amount
of calcium excreted. Chicks fed diets 6 and 7 had low values and chicks fed enzyme
supplemented diets 2 and 3 had high values with the rest of the treatments having
intermediate values (Table 13).
Feces from chicks fed various diets differed (F e 0.05) in fecal phosphorus
excretion, with chicks fed diets I and 5 having highest values and those fed diets
3,4,7 and 8 registering lowest values at the end of three weeks (Table 13). At 42
days the differences were more distinct with low phosphorus diets (0.39% phos)
having lower values for fecal phosphorus, while feces for chicks fed high phosphorus
diets (0.54% phos) had the highest values (Table 13). Enzyme supplementation had
no effect on phosphorus excretion regardless of phosphorus level.
At 21 days, chicks fed control diet 7 had the lowest bone ash % and the
enzyme supplemented diet containing 0.49% phosphorus had the highest bone ash
% (Table 15). Other treatment groups had similar ash values. At 42 days, chicks
fed the control diet 7 differed (P < 0.05) in bone ash from all other treatments except
those fed diet 8. Bone from chicks fed diet 3 with enzyme supplement had higher
bone ash % than those fed the unsupplemented counterpart diet (diet 7). Although
the differences were not significant, bones from birds fed the enzyme supplemented
diets at both 21 and 42 days of age contained a greater percentage of ash than those
fed the diets without the enzyme supplement. Average bone ash percentage from
enzyme supplemented and unsupplemented diets at 21 and 42 days of age were
39
40
50.8% vs 46.1% and 54.0% vs 51.5%, respectively.
Experiment 3
Diets fed in Experiment 3 contained approximately 91% dry matter, 6.0%
ether extract (fat), 22% protein, 12% total dietary fiber, 7% ash, 0.90% calrlnm and
0.55% phosphorus with the exception of diet 8 which contained 0.67% phosphorus
(Table 16).
No differences occurred in chick body weights among the enzyme
supplemented groups (diets 2,3,4,5,6 and 7) (Table 17). Growth rate of enzyme
supplemented chicks, as indicated by body weights and average daily gains, were not
significantly different (P>0.05) from those chicks fed the low phosphorus control
diet. Body weights, however, tended to be the heavier in chicks fed the enzyme
supplemented diets at each weigh period (days 8 ,15 and 22) except for those fed diet
8 on day 8. Chicks fed the high phosphorus control diet had (P<0.05) higher body
weights at all the three weigh periods. Average daily feed intake of chicks did not
differ (P> 0.05) among enzyme treated groups. The group fed the high phosphorus
diet (diet 8) had higher daily feed intake and produced higher average daily gain
than those fed the other diet treatments in each of the three periods. Feed
conversion ratio did not differ (P>0.05) between any of the eight diet treatment
groups at the end of the experiment although chicks fed diet 8 differed significantly
from rest of the treatments during the first two weeks (Table 17).
At 2 weeks, the amount of fecal excreta was similar for all enzyme
supplemented groups (Table 18). However, during second collection at three weeks

41
of age, a significant difference (P < 0.05) occurred among chicks fed diets I, 6 and
those fed diet 3, 8 (about 160 g) in the amount of excreta (Table 18).
Fecal fat, fecal dry matter, and fecal ash values were similar among
treatments during both the second week and third weeks (Table 18).
Calcium excretion was highest (PC0.05) in chicks fed diet 2 and 3, compared
to those fed diets I and 4, but was not different (P>0.05) among the other diets at
two weeks of age (Table 18). Chicks fed the low phosphorus control diet tended to
excrete less calcium followed by those fed the high phosphorus control diet. At the
three week sampling time, chicks fed diet 2 produced feces with higher calcium
values in the excreta than those fed diets I, 4 and 5 (Table 18).
Fecal phosphorus values were not different among treatments during the
second week but during the third week phosphorus excretion was highest (P<0.®5)
in feces from those fed diets 2,5,7 and 8 compared to that in feces from chicks fed
diet 4.
Bone ash % was higher (P<0.05) in bones from chicks fed the high
phosphorus control diet (diet 8) than in those fed diets 2,3,4,5 and 6 (Table 19).
Bone ash from chicks fed diet 7 were intermediate and not different in bones from
chicks fed the control diet nor from that of any of the chicks fed the other diets.
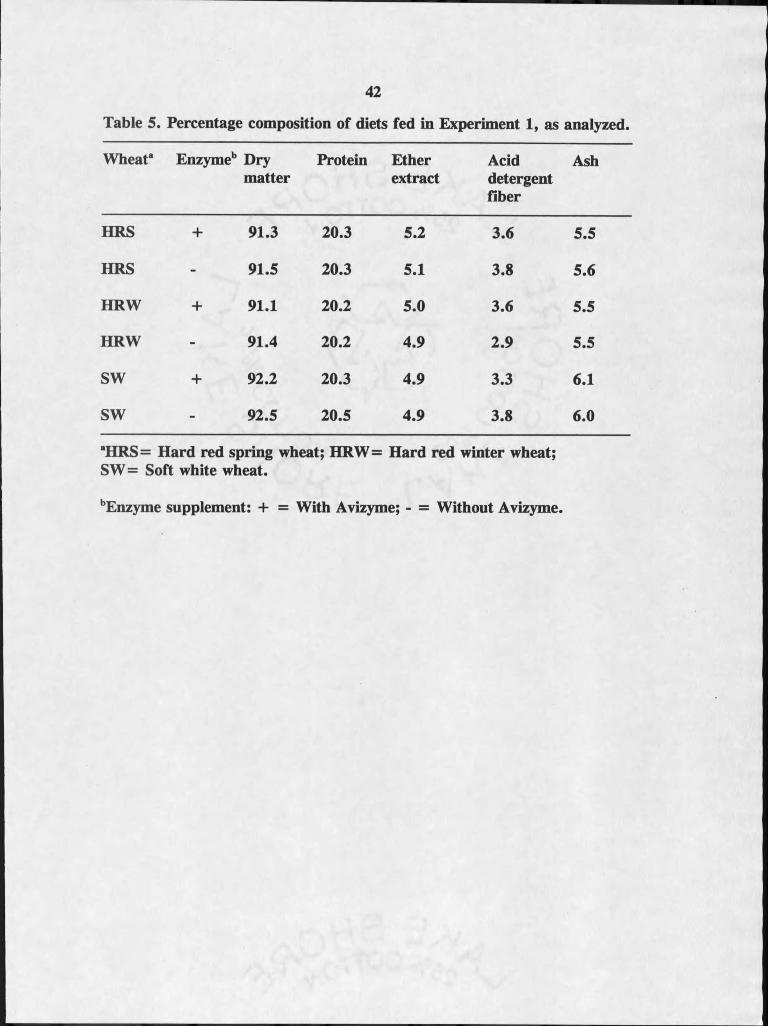
42
Table 5. Percentage composition of diets fed in Experiment I, as analyzed.
Wheat” Enzymeb Drymatter
Protein Etherextract
Aciddetergentfiber
Ash
HRS + 91.3 20.3 5.2 3.6 5.5
HRS - 91.5 20.3 5.1 3.8 5.6
HRW + 91.1 20.2 5.0 3.6 5.5
HRW - 91.4 20.2 4.9 2.9 5.5
SW + 92.2 20.3 4.9 3.3 6.1
SW - 92.5 20.5 4.9 3.8 6.0
aEDRS= Hard red spring wheat; HRW = Hard red winter wheat; SW = Soft white wheat.
bEnzyme supplement: + = With Avizyme; - = Without Avizyme.

Table 6. Growth performance of broiler chicks fed diets prepared with three varieties of wheatwith and without Enzyme supplement in Experiment I.
Type of Wheat1 Enzymeb CVc, %
HRS HRW SW + -
Chick body weight, g
Day 7 195.1 197.5 205.5 198.7 2 0 0 . 0 3.0Day 14 423.8 410.9 439.1 422.7 426.5 2.7Day 21 741.0 730.3 769.1 741.7 751.8 3.9
Average daily feed intake, g
Day 7 28.0 29.7 30.2 29.5 30.5 3.6Day 14 38.2 38.7 37.4 38.6 41.0 3.3Day 21 50.3 52.7 50.9 52.8 53.3 5.9
Average daily gain, g
Day 7 19.2 19.6 20.7 19.8 19.9 4.2Day 14 26.0 25.0 27.1 25.9 26.2 3.2Day 21 32.4 31.9 33.8 32.4 32.9 4.2
Feed/gain ratio , g/g
Day 7 1.50 1.52 1.45 1.48 1.50 3.3Day 14 1.48 1.52 1.47 1.47 1.51 2.3Day 21 1.59 1.63 1.57 1.58 1.61 4.3
1HRS=Hard Red Spring wheat; HRW=Hard Red Winter wheat; SW=Soft White wheat b+ = With enzyme; - = Without enzyme "Coefficient of variation
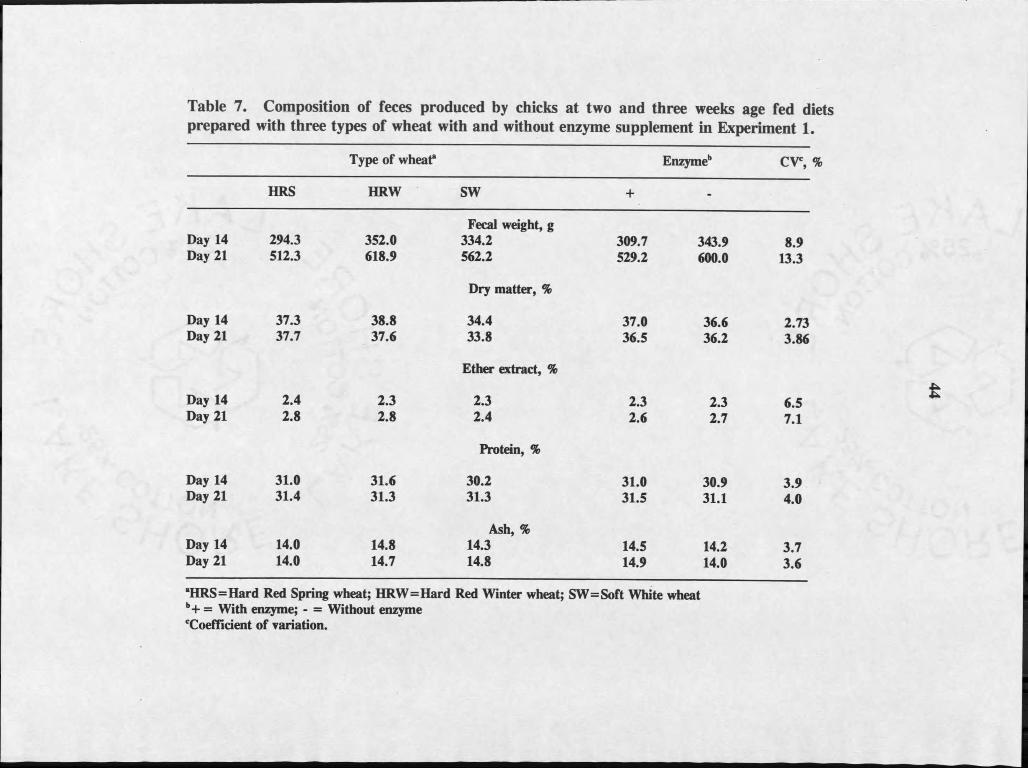
Table 7. Composition of feces produced by chicks at two and three weeks age fed dietsprepared with three types of wheat with and without enzyme supplement in Experiment I.
Type of wheat* Enzymeb CVt,
HRS HRW SW + -
Fecal weight, gDay 14 294.3 352.0 334.2 309.7 343.9 8.9Day 21 512.3 618.9 562.2 529.2 600.0 13.3
Dry matter, %
Day 14 37.3 38.8 34.4 37.0 36.6 2.73Day 21 37.7 37.6 33.8 36.5 36.2 3.86
Ether extract, %
Day 14 2.4 2.3 2.3 2.3 2.3 6.5Day 21 2 . 8 2 . 8 2.4 2 . 6 2.7 7.1
Protein, %
Day 14 31.0 31.6 30.2 31.0 30.9 3.9Day 21 31.4 31.3 31.3 31.5 31.1 4.0
Ash, %Day 14 14.0 14.8 14.3 14.5 14.2 3.7Day 21 14.0 14.7 14.8 14.9 14.0 3.6
aHRS=Hard Red Spring wheat; HRW=Hard Red Winter wheat; SW=Soft White wheat b+ = With enzyme; - = Without enzyme 'Coefficient of variation.
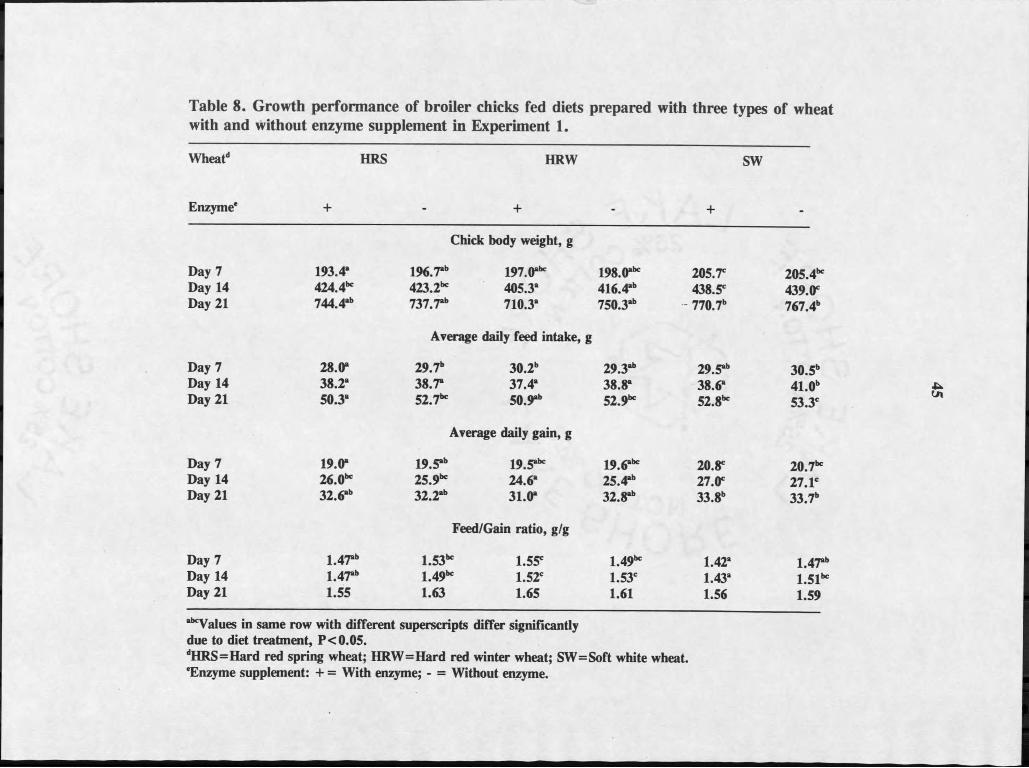
Table 8. Growth performance of broiler chicks fed diets prepared with three types of wheatwith and without enzyme supplement in Experiment I.
Wheatd HRS HRW SW
Enzyme' + - + - + -
Chick body weight, g
Day 7 193.4* 196.7*" 197. Olbc 198.0"* 205.7C 205.4""Day 14 424.4bc 423.2"c 405.3* 416.4*" 438.5" 439.0"Day 21 744.4*" 737.7*" 710.3* 750.3*" 770.7" 767.4"
Average daily feed intake, g
Day 7 28.0* 29.7" 30.2" 29.3*" 29.5*" 30.5"Day 14 38.2* 38.7* 37.4* 38.8* 38.6* 41.0"Day 21 50.3* S l J bc 50.9*" S l J bc 52.8"* 53.3"
Average daily gain, g
Day 7 19.0* 19.5*" 19.5"* 19.6"* 2 0 .8 " 20.7""Day 14 26.0bc 25.9"c 24.6* 25.4*" 27.0" 27.1"Day 21 32.6*" 32.2*" 31.0* 32.8*" 33.8" 33.7"
Feed/Gain ratio, gig
Day 7 1.47*" LSSbc LSSc 1.49"c 1.42* 1.47*'Day 14 1.47*" 1.49"c 1.52c 1.53c 1.43* 151"Day 21 1.55 1.63 1.65 1.61 1.56 1.59
abcValues in same row with different superscripts differ significantly due to diet treatment, P<0.05.dHRS=Hard red spring wheat; HRW=Hard red winter wheat; SW=Soft white wheat. ‘Enzyme supplement: + = With enzyme; - = Without enzyme.
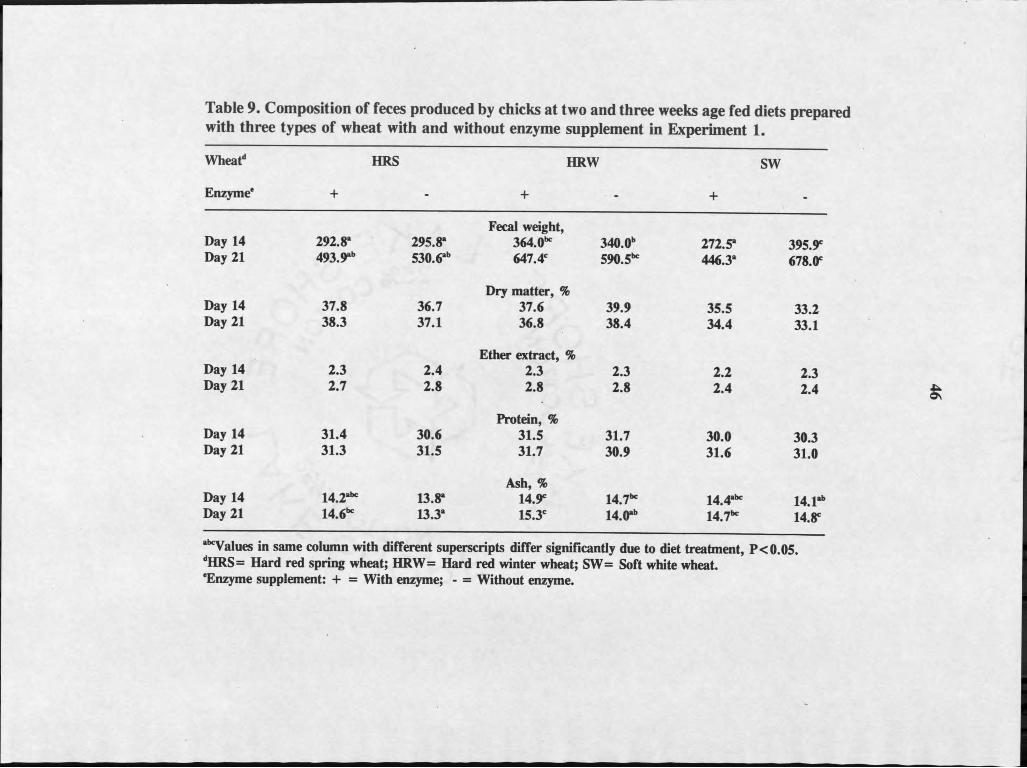
Table 9. Composition of feces produced by chicks at two and three weeks age fed diets preparedwith three types of wheat with and without enzyme supplement in Experiment I.
Wheatd
Enzyme' +
HRS HRW
+ +
SW
Day 14 292.8' 295.8“Fecal weight,
364. Obc 340.0b 272.5" 395.9"Day 21 493. Pab 530.6ab 647.4C 590.5"* 446.3' 678.0"
Day 14 37.8 36.7Dry matter, %
37.6 39.9 35.5 33.2Day 21 38.3 37.1 36.8 38.4 34.4 33.1
Day 14 2.3 2.4Ether extract, %
2.3 2.3 2 . 2 2.3Day 21 2.7 2 . 8 2 . 8 2 . 8 2.4 2.4
Day 14 31.4 30.6Protein, %
31.5 31.7 30.0 30.3Day 21 31.3 31.5 31.7 30.9 31.6 31.0
Day 14 14.2abc 13.grAsh, %
14.9C 14.7"* 14.4abc M1 IabDay 21 14.6bc 13.3' 15.31 M-Oab 14.7bc 14.8"
abcValues in same column with different superscripts differ significantly due to diet treatment, P <0.05. dHRS= Hard red spring wheat; HRW= Hard red winter wheat; SW= Soft white wheat.‘Enzyme supplement: + = With enzyme; - = Without enzyme.

Table 10. Percentage composition of diets fed in Experiment 2, as analyzed.
Diet1 Enzymeb Drymatter
Protein Etherextract
TotalDietaryFiber
Ash Calcium Phosphorus
I + 92.1 2 1 . 6 6.7 1 1 . 8 6.4 0.94 0.54
5 - 91.7 21.4 6.7 11.4 6 . 2 0.92 0.54
2 + 90.9 20.9 6 . 6 1 1 . 2 6 . 2 0.95 0.49
6 - 91.1 2 1 . 2 6.5 1 1 . 6 6.4 0.98 0.49
3 + 90.4 2 1 . 1 6.4 1 2 . 1 6 . 2 0.99 0.44
7 - 90.5 2 1 . 2 6.5 11.4 6 . 2 0.96 0.44
4 + 91.3 2 1 . 1 6 . 0 11.5 6 . 2 1 . 0 0 0.39
8 - 90.1 20.9 6 . 2 11.3 6 . 1 1 . 0 0 0.39
“Diets 1&5=0.54% phosphorus; diets 2&6=0.49% phosphorus; diets3&7=0.44% phosphorus; diets 4&8=0.39% phosphorus.
bEnzyme supplement: + = With xylanase; - = Without xylanase.

Table 11. Growth performance of Broiler chicks fed differing levels of phosphorus with and without anEnzyme supplement in Experiment 2.
.54
Level of Phosphorus, %
.49 .44 .39 +
Enzymeb CVc, %
Chick body weight, g
Day 21“ 683.1 632.7 550.7 505.0 553.2 632.6 16.0Day 42“ 2 1 1 2 . 0 1891.5 1882.0 1733.7 1902.3 1907.2 5.0
Average daily feed intake, g
Day 21“ 47.2 47.3 43.8 40.5 43.4 46.1 4.5Day 42“ 123.6 116.7 110.4 101.7 1 1 1 . 6 114.6 8 . 6
Average daily gain, g
Day 21“ 30.6 29.9 27.1 24.3 27.2 28.8 6 . 2
Day 42* 66.4 57.6 59.7 54.3 59.9 59.0 7.2
Feed/gain ratio, g/g
Day 21“ 1.55 1.58 1.62 1.67 1.60 1.60 4.2Day 42 1.87 2.03 1.85 1 . 8 8 1 . 8 6 1.95 8 . 0
“Significant linear effect due to level of dietary phosphorus, P<0.05.
b + = With enzyme; - = Without enzyme.
Coefficient of variation.

Table 12. Growth performance of Broiler chicks fed differing levels of phosphorus with and without an Enzyme supplementin Experiment 2.
Diet
Phosphorus, %
Enzymef
I
.54
+
2
.49
+
3
.44
+
4
.39
+
5
.54
6
.49
7
.44
8
.39
Chick body weight, g
Day 21 SSiUbc 529. Sab 707.2' STLSlbc 595.8abc 428.01 669.5bc SSJ1OabcDay 42 2070.6de 1920. Sbcd 2153.3* 1843.3^ 1843.4lbc 1774.8lb 1939.8cd 1692.6*
Average daily feed intake, g
Day 21 46.0bcd 45.8bcd 42.8" 38.8“ 48.4cd 48.9" 44 J bc 42.3lbDay 42 1 2 2 . Ibc 109. Ilbc ILLTabc IOLSa 125.3' 124.2' 107. Ilb 1 0 1 .8 “
Average daily gain, g
Day 21 30. Ide 29. Icde 26.3abc 23.3* 31.1' 30.7d* J7 Sbcd 25.4lbDay 42 SSJcd 56.4lb SOJbcd STJab S7.4d SSJbc SSJbc S lJ 1
Feed/Gain ratio, g/g
Day 21 1.541 LSTab 1.64lb LSSlb LSSab 1.59lb !.S lab LSTbDay 42 !.STlb 1.94lb LSTab LTT1 1 .8 6 1 2 . 1 2 " 1.82" 1.99ab
lbcdeValues in same row with different superscripts differ significantly due to diet treatment, P < 0.05. fEnzyme supplement: + = With enzyme; - = Without enzyme.

Table 13. Composition of feces produced by chicks at 3 and 6 weeks age fed diets prepared with differinglevels of phosphorus with and without an Enzyme supplement in Experiment 2.
.54
Level of Phosphorus, %
.49 .44 .39
Enzymed
+
CV*, %
Day 21 449.0 472.2 355.7Fecal wt, g
304.8 368.4 422.4 23.7Day 42 724.0 547.3 544.5 426.6 520.2 600.9 30.7
Day 21 34.9 31.7 34.7Dry matter, %
32.9 33.9 33.2 1 2 . 0
Day 42 28.5 29.7 31.1 32.5 30.5 30.4 14.0
Day 21 3.0 2.9 2.9Ether extract, %
2 . 8 2.9 2 . 8 2 . 1
Day 42 2.7 3.1 3.0 2.9 3.0 2.9 2 . 1
Day 21 16.0 16.1 16.1Ash, %
16.9 16.3 16.2 4.0Day 42 17.8 17.2 17.3 17.3 17.6 17.2 3.9
Day 21 0.98" 0.92" 1 .0 1 bCalcium, %
1.52* 1.18 1.04 15.3Day 42 0.59" 0.90* 1.19* 0.49" 1.30* 0.29" 54.4
Day 21 1.41 1.29 1.17Phosphorus, % 1.17 1.26 1.26 3.5
Day 42 1.70* 1.49" IJOc 1 .2 0 = 1.43* 1.42* 4.9
abcValues in same row with different superscripts differ significantly (P<0.05) due to diet treatment. d + = With enzyme; - = Without enzyme.* Coefficient of variation.

Table 14. Composition of feces produced by chicks at 21 and 42 days age fed diets prepared with differing levels ofphosphorus with and without and enzyme supplement in Experiment 2, on a dry matter basis.
Diet
Phosphorus, %
Enzyme*
I
.54
+
2
.49
+
3
.44
+
4
.39
+
5
.54
6
.49
7
.44
8
.39
Day 21 398. Slbc 445.7"*Fecal wt, g
350.8“"* 278.5“ 499.2* 498.6* 360.6“"* 331.0“"Day 42 673.Obcd 372.3“ 605.3“"*" 430.3“"* 774.8" 722.3*" 483.7“"*" 422.9“"
Day 21 37.5 31.4Dry matter, %
35.0 31.7 32.2 32.0 34.4 34.1Day 42 • 29.7 30.6 30.2 31.6 27.3 28.8 31.9 33.5
Day 21 2.97 3.03Ether extract, %
2.86 2.79 2.95 2.82 2 . 8 6 2.73Day 42 2.77 3.01 3.21 2.83 2.71 3.16 2.83 2.89
Day 21 15.8“ 15.9“Ash, %
15.9“ 17.5" 16.1“ 16.2“ 16.3“ 16.3“Day 42 18.2“ 17.2ab 17.2“" 17.9“" 17.4“" 17.1“" 17.3*" 16.8“
Day 21 0.93" 1 .0 0 “Calcium, %
0.91“ 1.88" 1.03“ 0.84“ 1.13“ 1.16“Day 42 0.73" 1 .6 6 * 2.26" 0.56“" 0.45“" 0.14“ 0.13“ 0.43“
Day 21 1.40* 1.29"Phosphorus, %
1.16“ 1 .2 0 “ 1.42* 1.28" 1.18“ 1.15“Day 42 1.74" 1.46* 1.30" 1 .2 0 “ 1 .6 6 " 1.52* 1.30" 1 .2 0 “
lbcdValues in same row with different superscripts differ significantly due to diet treatment, P<0.05. ‘Enzyme supplement: + = With enzyme; - = Without enzyme. rExpressed on dry matter basis.
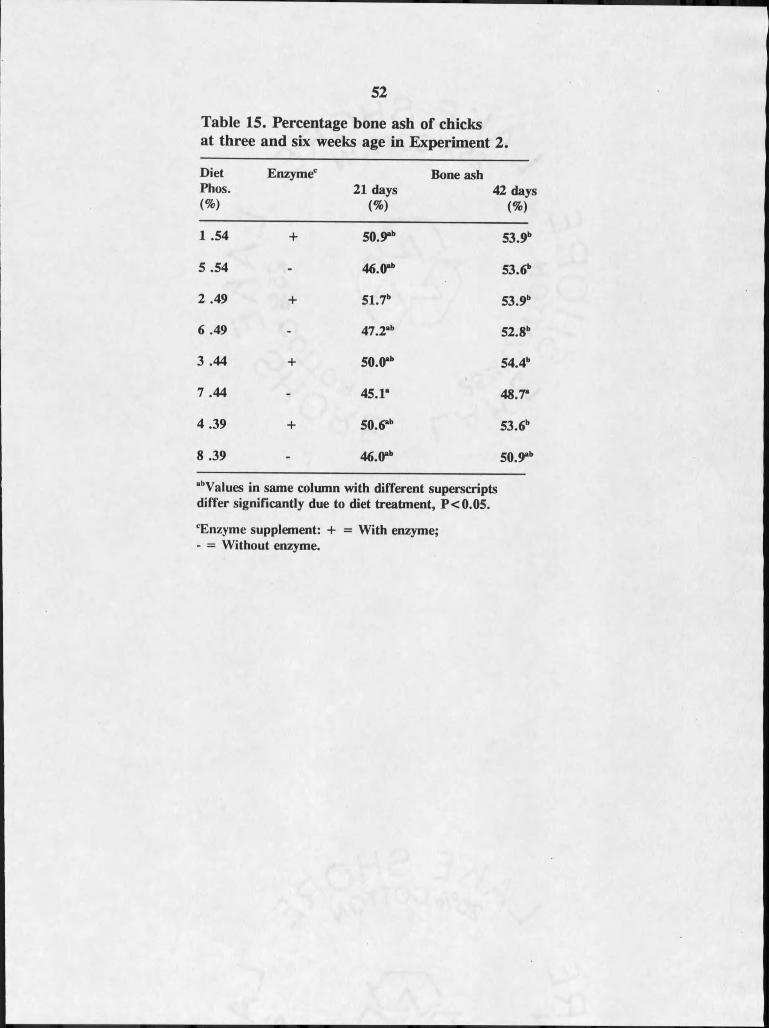
52
Table 15. Percentage bone ash of chicks at three and six weeks age in Experiment 2.
DietPhos.(%)
Enzymec2 1 days
(%)
Bone ash42 days
(%)
I .54 + 50.9"" 53.9"
5 .54 - 46.0ab 53.6"
2 .49 + 51.7" 53.9"
6 .49 - 47.2"b 52.8"
3 .44 + 50. Oab 54.4"
7 .44 - 45.1" 48.7"
4 .39 + 50.6"b 53.6b
8 .39 - 46.0"b 50.9“b
ilbVaIues in same column with different superscripts differ significantly due to diet treatment, P<0.05.
cEnzyme supplement: + = With enzyme;- = Without enzyme.
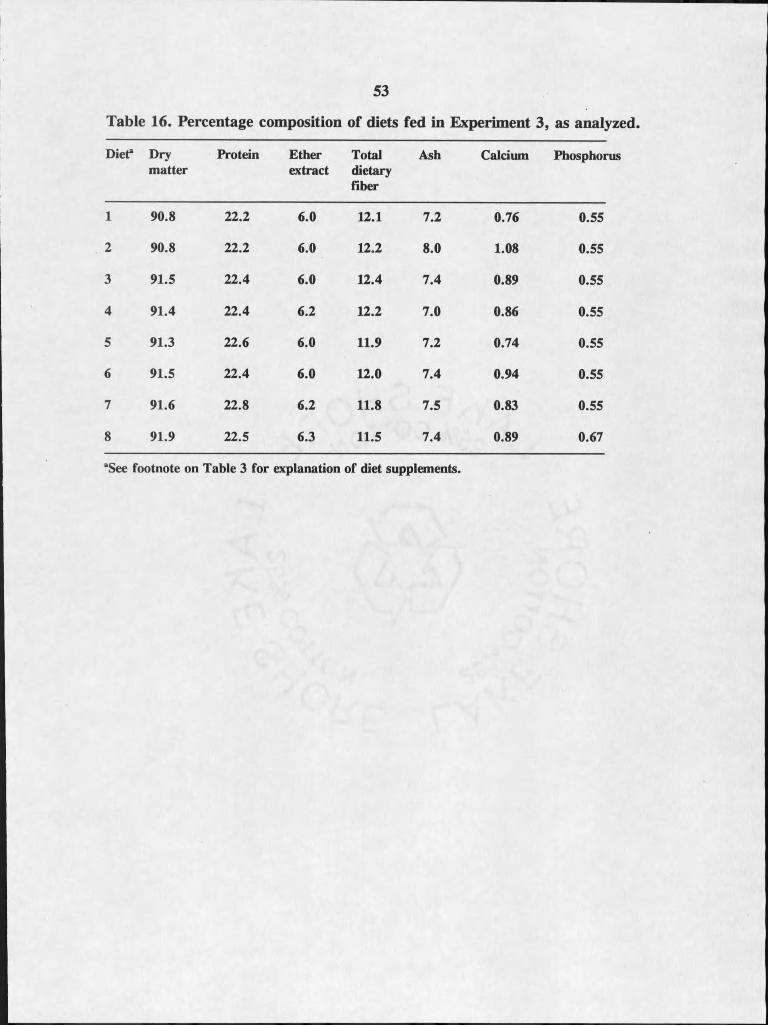
53
Table 16. Percentage composition of diets fed in Experiment 3, as analyzed.
Dieta Drymatter
Protein Etherextract
Totaldietaryfiber
Ash Calcium Phosphorus
I 90.8 2 2 . 2 6 . 0 1 2 . 1 7.2 0.76 0.55
2 90.8 2 2 . 2 6 . 0 1 2 . 2 8 . 0 1.08 0.55
3 91.5 22.4 6 . 0 12.4 7.4 0.89 0.55
4 91.4 22.4 6 . 2 1 2 . 2 7.0 0 . 8 6 0.55
5 91.3 2 2 . 6 6 . 0 11.9 7.2 0.74 0.55
6 91.5 22.4 6 . 0 1 2 . 0 7.4 0.94 0.55
7 91.6 2 2 . 8 6 . 2 1 1 . 8 7.5 0.83 0.55
8 91.9 22.5 6.3 11.5 7.4 0.89 0.67
“See footnote on Table 3 for explanation of diet supplements.

Table 17. Growth performance of broiler chicks fed differing levels of supplemental enzymes in Experiment 3.
Enzyme' - + + + + + + - CVr, %
Dietd I 2 3 4 5 6 7 8
Chick body weight, gDay 8 250.4“ 262.4“ 260.0“ 256.3“ 255.4“ 260.0“ 250.9“ 306.5b 2 . 1 2Day 15 475.4“ 497.0“ 500.8“ 498.2“ 494.4“ 497.7“ 492.0“ 608. Ob 3.55Day 22 772.3“ 832.9“ 809.6“ 817.5“ 812.4“ 819.0“ 819.6“ 991.5" 4.97
Average daily feed intake, g
Day 8 30.6“ 31.7“ 31.9“ 32.0“ 31.4“ 32.1* 30.3“ 36.6" 3.60Day 15 52.6“ 53.4“ 53.6“ 53.7“ 51.7“ 52.1“ 51.4“ 63.6" 3.97Day 22 72.0“ 79.0“b 79.3‘b 77.0“b 80. Ib 7 9 7“b 78.7“b 94.0'
5 8 1 tz,Average daily gain, g
Day 8 21.5“ 23.3“ 22.9" 22.7“ 22.3“ 22.9“ 2 1 .6 “ 29.6" 5.08Day 15 32.4“ 33.5“ 34.4“ 34.6“ 34.1“ 33.8“ 34.4“ 43.2" 4.91Day 22 42.4“ 45.9“ 44.1“ 44.7“ 45.4“ 45.9“ 46.8“ 54.8" 7.34
Feed/gain ratio, g/g
Day 8 1.42“ 1.37“ 1.40“ 1.43“ 1.42“ 1.41“ 1.40“ 1.24" 2.43Day 15 1.62“ 1.59“ 1.55“ 1.55“ 1.51“ 1.54“ 1.50“ 1.47" 2.97Day 22 1.69 1.72 1.80 1.73 1.79 1.73 1 . 6 8 1.72 6.75
abrValues in same row with different superscripts differ significantly due to diet treatment, P <0.05.dSee footnote on Table 3 for explanation of diet supplements. e + — With enzyme; - = Without enzyme. r Coefficient of variation.

Table 18. Composition of feces produced by chicks at 15 and 22 days age fed diets prepared with differing levels of supplemental enzymes in Experiment 3 on a dry matter basis.
Enzyme'
Dietd I
+
2
+
3
+
4
+
5
+
6
+
7 8
Day 15 331.7 343.3 350.7Fecal wt, g
374.7 296.3 313.0 304.0 333.0Day 22 655.3“ 715.0“" 803.7" 712.7“" 699.3*" 651.3“ 785.3“" 818.0"
Day 15 44.8 44.3 41.2Dry matter, %
41.1 45.1 44.6 46.8 47.7Day 22 29.8 31.7 29.6 29.2 29.8 29.4 28.2 30.7
Day 15 3.1 3.0 2.9Ether extract, %
3.2 3.0 2.9 3.0 3.3Day 22 3.4 3.3 3.3 3.5 3.2 3.3 3.4 3.5
Day 15 19.3 19.9 19.0Ash, % 19.7 19.1 18.7 18.7 18.9Day 22 19.4 18.5 19.2 19.3 18.4 19.3 19.0 19.6
Day 15 1.28“ 2.74' 2.58"'Calcium, %
1.40“" 1 .6 6 “"' 2.17“"' 2.06“"' 1 .6 8 “"'Day 22 0.76“ 1.70" 1.60“" 0 .8 6 “ 0.83“ 0.94“" 1 . 1 1 “" 0.97“"
Day 15 1.13 1 . 0 2 1.09Phosphorus, %
0.95 1 . 1 0 1 . 1 1 1 . 1 2 1.06Day 22 1 . 1 1 1 . 2 1 1.17 1.06 1 . 2 0 1.16 1 . 2 0 1 . 2 1
abcValues in same row with different superscripts differ significantly due to diet treatment, P<0.05.dSee footnote on Table 3 for explanation of diet supplements. * + = With enzyme; - = Without enzyme.
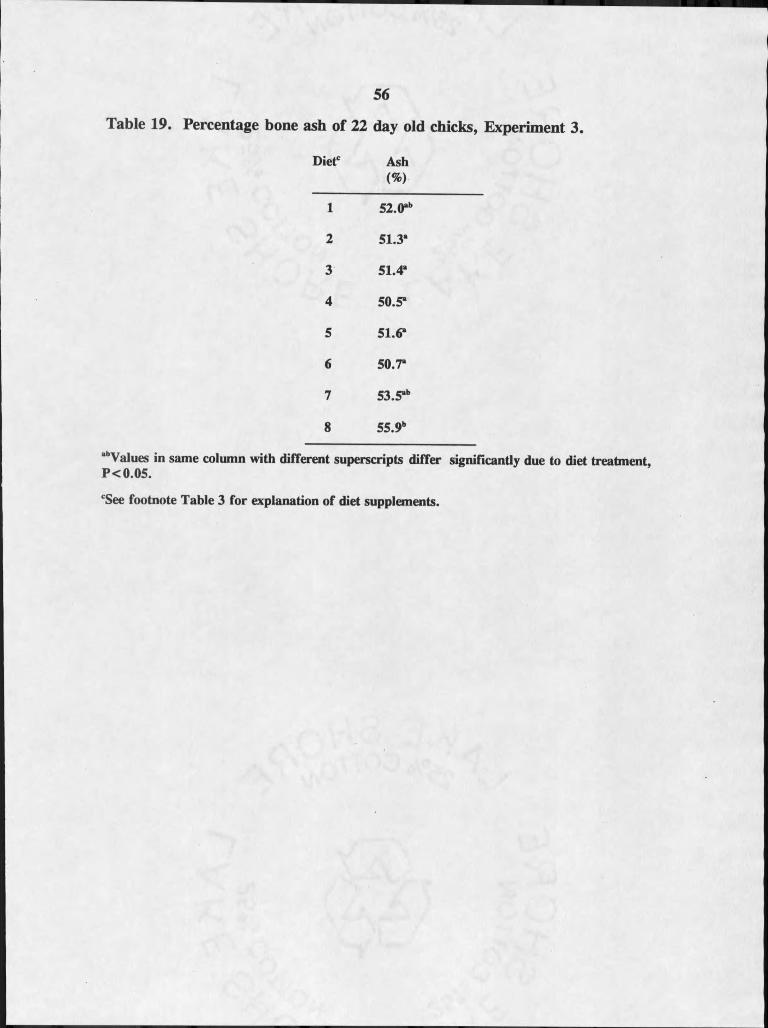
56
Dietc Ash(% )
1 SZ-Oab
2 51.3a
3 51.4“
4 SO-Sa
5 Sl-Sa
6 SO-Ta
7 SS-Sab
8 55.9"
abVaIues in same column with different superscripts differ significantly due to diet treatment, P <0.05.
cSee footnote Table 3 for explanation of diet supplements.
Table 19. Percentage bone ash of 22 day old chicks, Experiment 3.

I I H I
57
DISCUSSION
Experiment I
Enzyme addition to wheat based diets did not (P> 0.05) improve performance
of chicks in this study, but chicks fed diets with enzyme supplement had better feed
conversion ratios than those fed untreated diets. The data showed no significant
difference among three wheat types, HRS, HRW and SW. It also indicated that
there was no effect due to a commercial enzyme (Avizyme) for all three wheat types.
It is possible that inclusion level of 0.1% enzyme as used in these studies may not
have been enough to elicit a response. Previous work at other laboratories showed
that addition of pentosanase//3-glucanase mixture at 0.4% inclusion level had a
significant effect on improving the feed to gain ratio of broiler chicks (Brenes et ah,
1993) fed a wheat based diet. Conflicting results as to beneficial effects of enzyme
treatment of wheat-based diets were reported by PawIik et al. (1990) and only
marginal improvements were demonstrated by Teitge et al. (1991). In this
experiment, chicks fed HRS wheat diet performed the best, followed by those fed
HRW and SW diets. With enzyme supplementation, chicks fed HRW diet
performed best followed by those fed SW and HRS diets.
It has been reported that the pentosans increase digesta viscosity thus

58
reducing nutrient utilization. The viscosity values of wheats used in this study were
very low (< I) which suggest that the digesta viscosity would not be significantly
increased. There was no difference in viscosity among the wheat types, so the
digestibility and absorption of nutrients by chicks would not have varied between the
diets without considering the viscosity of the other ingredients. When chicks were
fed diets with enzyme supplement, they excreted less feces compared to those fed
diets without enzyme supplement. The data showed no differences in dry matter,
ether extract and protein at both the collections between chicks fed various diets.
Experiment 2
Feed conversion ratio between chicks fed enzyme supplemented diets and
those fed diets without enzyme supplement at all 4 levels of phosphorus did not
differ. This indicates that the level of phosphorus or enzyme supplement did not
affect the growth performance of chicks. Fecal composition revealed no differences
in dry matter, ether extract and ash values at both the collection periods.
Differences in fecal calcium and phosphorus were varied but differences in fecal
calcium percentage was influenced by both dietary phosphorus and supplemental
enzyme. Bone ash percent was higher in chicks fed diets treated with enzyme
compared to those fed diets without enzyme, suggesting an increase in the utilization
of phytate phosphorus.
Experiment 3
The data showed no difference in growth performance between the chicks fed
diets with different levels of the supplemented enzyme mixture. The only difference

59
that was noted was between the low and high dietary phosphorus control groups.
There was variable response in amount of calcium and phosphorus excreted in fecal
excreta by chicks fed various diets. No difference was observed in fecal dry matter,
ether extract and ash at both collections in chicks fed various diets. The enzyme
xylanase probably did not break the cell wall of fiber sufficiently enough to release
the nutrients to be acted upon by endogenous phytase enzymes or the activity of the
latter was low. Phytic acid may not have been exposed sufficiently to the
phosphatase enzyme present for oxidation, which could explain the lack of difference
in performance of birds as well as a lack of difference in fecal phosphorus excretion.

60
SUMMARY
Three types of wheat, hard red spring (HRS), hard red winter (HRW) and
soft white (SW) were compared with and without supplementation of a commercial
enzyme (Avizyme) in Broiler chicks in first experiment. There was no difference in
body weight of chicks between control and enzyme treated groups. At the end of
three weeks, chicks fed with different diets did not differ in feed conversion ratio.
There was a significant difference in the amount of fecal excreta between chicks fed
three types of wheat, although there was no difference between the control and
enzyme supplemented group. Chicks fed SW wheat diet excreted more followed by
those fed HRS wheat diet and HRW diet at both collection periods. The composition
of the excreta did not vary among the chicks fed different diets.
In second experiment, four levels of total dietary phosphorus, that were well
below the NRC requirement, were compared with and without supplemental enzyme
(xylanase) in Broiler chicks. There was no difference in body weight, average daily
feed intake, average daily gain and feed conversion ratio between chicks fed control
diet and those fed enzyme supplemented diets although there was a negative
61
correlation between dietary phosphorus level and feed conversion ratio. As the
phosphorus level increased the feed conversion ratio decreased. Variation in fecal
excretion of calcium and phosphorus was not consistent between chicks fed diets
supplemented with different levels of enzyme at both fecal collection periods
although at six weeks age percentage of calcium excreted in feces was positively
correlated to the dietary phosphorus levels. Percentage bone ash differed between
control and enzyme supplemented group at all four levels of phosphorus at three
weeks period, but at six weeks there was not much difference in bone ash percent
between different levels of phosphorus irrespective of enzyme treatment.
In third experiment, eight different diets were formulated. Diets one and
eight served as controls without enzyme, having .55% and .67% total dietary
phosphorus. Diets 2 through 7 were formulated to contain .55% available dietary
phosphorus and six levels of a commercial enzyme mixture containing xylanase,
phosphatase, and protease enzymes. There was no difference in body weight,
average daily feed intake, average daily gain and feed conversion ratio between the
different enzyme supplemented groups. While there was no difference in fecal
phosphorus excretion between different diet treatments, the variation in calcium
excretion between different groups was not consistent although there was statistically
significant difference between some of the diet treatments. Bone ash percentage did
not differ between chicks fed different enzyme supplemented diets although those fed
high phosphorus diet had higher bone ash values than rest of the treatments.

62
LITERATURE CITED
Aastrap, S. 1979. The relationship between the viscosity of an acid flour- extract of barley and its beta-glucan content. Carlsberg Res. Commun. 44:289-304.
Annison, G., 1991. Relationship between the levels of soluble non-starch polysaccharides and the apparent metabolizable energy of wheats assayed in broiler chickens. J. Agric. Food Chem., 39:1252 1256.
Annison, G. 1992. Commercial enzyme supplementation of wheat based diets raises ileal glycanase activities and improves apparent metabolizable energy, starch and pentosan digestibilities in broiler chickens. Anim. Feed. Sci. Technol. 38:105-121.
Anonymous, 1971. Determination of crude oils and fats. Off. J. Eur. Comm., L 297:995-997.
Antoniou, T., Marquardt, R. R. and Misir, R. 1980. The utilization of rye by growing chicks as influenced by calcium, vitamin D-3, and fat type and level. Poult. Sci. 59:758-769.
Antoniou, T., Marquardt, R. and Cansfield, P. E. 1981. Isolation, partial characterization, and antinutritional activity of a factor (pentosans) in rye grain. J. Agric. Food Chem. 29: 1240-1247.
Antoniou, T. C. and Marquardt, R. R. 1981. Influence of rye pentosans on the growth of chicks. Poult. Sci. 60:1898-1904.
Association of Official Analytical Chemists 1980. Official Method of Analysis, ed. 13, Washington D. C.
Bacic, A. and Stone, B. A. 1981. Isolation and Ultrastructure of aleurone cell walls from wheat and barley. Aust. J. Plant Physiol. 8:453-474.
Ballam G.C., Nelson, T.S. and Kirby, L.K. 1985. Effect of different dietary levels of calcium and phosphorus on phytate hydrolysis by chicks. Nutr. Rep. Inter 32:909-913.

63
Bengtsson, S. and Aman, P. 1990. Isolation and chemical characterization of water-soluble arabinoxylan in rye grain. Carbohydr. Polym.
. 12:267-277.
Bengtsson, S., Aman, P., Graham, H., Newman, C. W. and Newman, R. K. 1990. Chemical studies on mixed link beta-glucans in hulless barley cultivars giving different hypocholesterolaemic responses in chickens. J. Sci. Food Agile. 52: 435-445.
Bitar, K. and Reinhold, J.G. 1972. Phytase and alkaline phosphatase activities in intestinal mucosae of rat, chicken, calf and man. Biochem. Biophys. Acta 268:442-452.
Bos, K. D. 1990. Chemical background of phosphorus compound and phytase in livestock feed. Proc. Symp. Livestock Feed and Environment: The manure Problem: Tackling through Pig and Poultry Feed. Lelystad, The Netherlands.
Brenes, A., Guenter, W., Marquardt, R. R. and Rotter, B. A. 1993. Effect of /3-glucanase/pentosahase enzyme supplementation on the performance of chickens and laying hens fed wheat, barley, naked oats and rye diets. Can. J. Anim. Sci. 73:941-951.
Burnett, G.S., 1962. The effect of damaged starch, amylolytic enzymes, and proteolytic enzymes on the utilization of cereals by chickens. Br. Poult. Sci. 3:89-103.
Burnett, G. S. 1966. Studies of viscosity as the probable factor involved in the improvement of certain barleys for chickens by enzyme supplementation. Br. Poult. Sci. 7:55-75.
Campbell, G. L., Classen, H. L. and Salmon, R. E. 1984. Enzyme supplementation of barley diets for broilers. Feedstuffs„ May 7, pp.26-27.
Campbell, G. L., Rossnagel, B. G., Classen, H. L. and Thacker, P. A. 1989. Genotypic and environmental differences in extract viscosity of barley and their relationship to its nutritive value for broiler chickens. Anim. Feed Sci. Technol. 26:221-230.
Campbell, G E. and Bedford, M.R. 1992. Enzyme applications for monogastric feeds: A review. Can. J. Anim. Sci. 72:449-466.

u Ki n
64
Cave, N. A., Wood, P. J. and Burrows, V. D. 1990. The nutritive value of naked oats for broiler chicks as affected by dietary addition of oat germ, enzyme, antibiotic, bile salt and fat-soluble vitamins. Can. J. Anim. Sci. 70:623-633.
Choct, M. and Annison., 1990. Anti-nutritive activity of wheat pentosans in broiler diets. Br. Poult. Sci. 30:811-821.
Choct, M. and Annison, G., 1992. Anti-nutritive effect of wheat pentosans in broiler diets: Roles of viscosity and gut microflora. Br. Poult. Sci. 33(4): 821-834.
Ciacco, C. F. and D’Appolonia, B.L. 1982. Reconstitution studies with sound and sprouted wheat flour. Cereal chem. 59(2):77-81.
Clark E. P., and Collip, J.B. 1925. A study of the Tisdall method for the determination of Blood Serum calcium with a suggested modification. J. Biol. Chem. 63, 461-464.
Classen, H. L., Campbell, G. L. and GrootWassink, J. W. D. 1988.- Improved feeding value of Saskatchewan-grown barley for broiler
chickens with dietary enzyme supplementation. Can. J. Anim. Sci. 68:1253-1259.
Courtois, J. 1945. Phytase. I. Comparative action of various enzyme preparations on inositol hexaphosphate and sodium glyceralphosphate. Bull. Soc. Chem. Biol. 27:411.
Cromwell, G. L., Hays, V.W. and Overfield, J.R. 1972a. Effects of phosphorus levels in com, milo and wheat based diets on performance and bone strength of pigs. J. Anim. Sci. 35:1103 (Abstr.).
Cromwell, G. L., Hays, V.W. and Overfield, J.R. 1974. Effects of phosphorus levels in com, wheat and barley diets on performance and bone strength of swine. J. Anim. Sci. 39:180 (Abstr.).
Cromwell, G.L. 1979. Availability of phosphorus in feedstuffs for swine. Proc. Distillers Feed Research conf. pp. 40-52. Distillers Feed Research council, Des Moines, IA.
Cromwell, G. L., Stahly, R. D. Coffey, H. J. Monegue, and Randolph, J.H. 1994. Efficacy of phytase in improving the bioavailability of phosphorus in soybean meal and corn-soybean meal diets for pigs. J. Anim. Sci. (at press).

65
D’Appolonia, B. L. and MacArthur. L. A. 1976. Comparison of bran and endosperm pentosans in immature and mature wheat. Cereal chem. 53(5):711-718.
Davies9 M.I., Ritcey9 G.M. and Motzok9 I. 1970. Intestinal phytase and alkaline phosphatase of chicks: Influence of dietary calcium, inorganic and phytate phosphorus and vitamin D-3. Poultry Sci. 49:1280-1286.
Davies9 M I. and Motzok9 I. 1972. Properties of chick intestinal phytase. Poultry Sci. 51:494-501.
Dixon9 M and Webb9 E.C. 1964. Enzymes. Second edn. Academic press, Inc., New York. New york. pp. 167-197.
Edney9 M. J., Campbell, G. L. and Classen, H. L., 1989. The effect of /3- glucanase supplementation on nutrient digestibility and growth in broilers given diets containing barley, oat groats or wheat. Anim. Feed Sci. Technol., 25:193-200.
Elwinger9 K. and Saterby9 B. 1987. The Use of /3-glucanase in practical broiler diets containing barley and oats. Effect of enzyme level, type and quality of grain. Swedish J. AgrL Res. 17:133-140.
Enari9 T M. 1983. Microbial Cellulases. In: Microbial Enzymes and Technology (W.M. Fogarty9 ed.).
Farah9 D. A., Hall, M.J., Millsand P R. and R.I. Russell. 1984. Effect of wheat bran on zinc absorption. Hum. Nutr. Clin. Nutr. 88:433-441.
Faramarz Ismail-Beigi9 Reinhold9 J.G., Bahram Faraji and Parichehr Abadi. 1977. Effects of Cellulose added to diets of Low and High Fiber content upon the metabolism of calcium, Magnesium9 zinc and phosphorus by Man. J. Nutr. 107: 510-518.
Fengler9 A l. and Marquardt9 R.R. 1988a. Water-soluble pentosans from rye:I. Isolation, partial purification, and characterization. Cereal Chem. 65:291-297.
Fengler9 A.I. and Marquardt9 R.R. 1988b. Water-soluble pentosans from rye: H. Effects on rate of dialysis and on the retention of nutrients by the chick. Cereal Chem. 65:298-302.
Fernandez9 R., Lucas, E. and McGinnis, J. 1973a. Fractionation of a chick growth depressing factor from rye. Poult. Sci. 52:2252-2259.

66
Fiske, C. H. and SubbaRow, Y. 1925. The colorimetric determination of phosphorus. J. Biol. Chem., 66: 375.
Gobi, B., Alden, S., Elwinger, K. and Thomke, S. 1978. Influence of (3- glucanase on feeding value of barley for poultry and moisture content of excreta. Br. Poult. Sci. 19:41-47.
Gordon, D.T., 1990. Total dietary fiber and mineral absorption. In: Dietary Fiber (D. Kritchevsky, C. Bonfield, and J. W. Anderson, ed.) pp. 105-128. Plenum Press, NY.
Graf, E. 1986. Phytic acid, chemistry and applications. PUatus Press, Minneapolis MN. pp. 1-21.
GrootWassink, J. W. D., CampbeU5 G.L. and Classen, H. L. 1989. Fractionation of crude pentosanase (arabinoxylanase)for improvement of the nutritional value of rye diets for broUer chickens. J. Sci. Food Agric. 46:389-400.
Halpin, J. G., Holmes, C E. and Hart, E. B. 1936. Rye as a feed for poultry. Poult. Sci. 15: 3-8.
Henry, R.J. 1985. A comparison of the non-starch carbohydrates in cereal grains. J. Sci. Food Agric. 36:1243-1253.
Hesselman, K. and P. Aman. 1986. The effect of j8-glucanase on the utilization of starch and nitrogen by broUer chickens fed on barley of low- or high-viscosity. Anim. Feed Sci. Tech. 15:83-93.
Hesselman, K., Elwinger, K. and Thomke, S. 1982. Influence of increasing levels of j3-glucanase on the productive value of barley diets for broiler chickens. Anim. Feed Sci. Tech. 7:351-358.
Hesselman, K., Elwinger, K., Nilsson, M. and Thomke, S. 1981. The effect of /3-glucanase supplementation, stage of ripeness and storage treatment of barley in diets fed to broUer chickens. Poult. Sci. 60:2664-2671.
Hesselman, K. and Thomke, S. 1982. Influence of some factors on development of viscosity in the water extract of barley. Swed. J. Agric. Res. 12:17-22.

67
Hockett, E. A., McGuire, C. F., Newman C. W. and Prentice, N. 1987. The relationship of barley beta-glucan content to agronomic and quality characteristics. In: Yasuda, S and Konishi, T. (Eds) Barley genetics V (Proceedings of the 5th International Barley Genetics Symposium), Sanyo Press, Okayama, Japan, pp. 851-60.
Inborr, J. 1989. The use of supplementary enzymes in pig nutrition. Proc. of the 25th Annual Nutrition Conference for Feed Manufacturers, Toronto, Ontario, pp. 32-44.
Inborr, J. and Graham, H., 1991. Effect of enzyme supplementation of wheat-based diets on performance of broiler chickens. Proc. Aust. Poult. Sci. Sym., pp. 50-55.
Jacobsen, J. V., Knox, R. B., and Pyliotis, N. A. 1971. The structure and composition of aleurone grains in the barley aleurone layer. Planta 101, 189.
I
Jensen, L.S., Fry, R.E. Allred and McGinnis, J. 1957. Improvement in the nutritional value of barley for chicks by enzyme supplementation. Poultry Sci. 36:919-921.
Jongbloed, A.W., Kemme, P A. and Mroz, Z. 1990. The effect of Aspergillus niger phytase in diets for pigs on concentration and apparent digestibility of dry matter, total phosphorus and inositol phosphates in different sections of the alimentary tract. Report no. 221. Research Institute for Livestock Feeding and Nutrition, Lelystad, The Netherlands.
Ketaren, P.P., Batterham, E.S. and Farrell, D.J. 1991. Recent advances in the use of phytase enzyme in diets for growing pigs. In: Recent Advances in Animal Nutrition in Australia. (D.J. Farrell, Ed.).
Lehninger, 1975. Biochemistry. The molecular basis of cell structure and function. 2nd edn. Worth publishers, inc.
Lee, B. D. and Campbell, L. D. 1983. Lifluence of rye and dietary salt level on water and sodium metabolism in intact and colostomized roosters. Poult. Sci. 62:472-479.
Lee, S C., Prosky, L. and DeVries, J. W. 1992. Determination of total, soluble and insoluble dietary fiber in foods: Collaborative study. J. Assoc. Off. Anal. Chem. 75:395-416.
68
Lei, X. G., Ku, P.K., Miller, E.R. and Yokoyama. M.T. 1991. Lnprovement of phytate phosphorus utilization by a microbial phytase in weanling pigs. J. Anim. Sci. 69(suppl.l):374 (Abstr).
Lott, J.N.A. 1984. Accumulation of seed reserves of phosphorus and other minerals. In: Seed Physiology (D.R. Murray, Ed.) pp 139-166, Academic Press, NY.
Lund, R. E. 1987. A User’s Guide to MSUSTAT. Research & Development Institute Inc., Montana State University, Bozeman, MT 59717, U S A.
Mares, D.J. and Stone, B.A. 1973. Studies on wheat endosperm. I. Chemical compositions and ultrastructure of the cell walls. Aust. J. Biol. Sci. 26:793-812.
Marquardt, R. R., Ward, A. T. and Misir, R. 1979. The retention of nutrients by chicks fed rye diets supplemented with amino acids and penicillin. Poult. Sci. 58: 631-640.
McCance, R.A. and Widdowson, E.M. 1942. Mineral metabolism of healthy adults on white and brown bread dietaries. J. Physiol. Sci. 101:44-85.
McCleary, B.V. and GIennie-Holmes, M. 1985. Enzymatic Quantitation of (l-3)(l-4)-/3-glucan in barley and malt. J. Inst. Brew. 91:285-295.
Mellanby, E. 1949. Rickets-producing and anti-calcifying action of phytate. J. Physiol. Sci. 488-533.
Misir, R. and Marquardt, R. R. 1978a. Factors affecting rye (Secale cereale L.) utilization in growing chicks. I. The influence of rye level, ergot and penicillin supplementation. Can. J. Anim. Sci. 58:691-701.
Misir, R. and Marquardt, R. R. 1978b. Factors affecting rye (Secale cereale L.) utilization in growing chicks. II. The influence of protein type, protein level and penicillin. Can. J. Anim. Sci. 58:703-715.
Misir, R. and Marquardt, R. R. 1978c. Factors affecting rye (Secale cereale L.) utilization in growing chicks. HI. The influence of Milling fractions. Can. J. Anim. Sci. 58:717-730.
Misir, R. and Marquardt, R. R. 1978d. Factors affecting rye (Secale cereale L.) utilization in growing chicks. IV, The influence of autoclave treatment, pelleting, water extraction and penicillin supplementation. Can. J. Anim. Sci. 58:731-742.
A

69
Mollgaard, H. 1946. On phytic acid, its importance in metabolism and its enzymic cleavage in bread supplemented with calcium. Biochem. J. 40:589-603.
Moran, E.T. 1982. Starch digestion in fowl. Poul. ScL 61:1257-1267.
Moran, E. T., Lall, S. P. and Summers, J.D. 1969. The feeding value of rye for the growing chick. Effect of enzyme supplements, antibiotics, autoclaving and geographical area of production. Poult. Sci. 48:939- 949.
Mroz, A., Jongbloed, A.W., Kemme P A. and Lenis5 N P. 1991. Heal and overall digestibility of nitrogen and amino acids in a diet for pigs as influenced by Aspergillus niger phytase and feeding frequency or levels. 6th Int. Symp. Protein Metabolism and Nutrition, Heming BK.
National Research Council. 1984. Nutrient requirements of Poultry.
Nelson, T. S., 1967. The utilization of phytate phosphorus by poultry - A review. Poul. Sci. 46:862-871.
Nelson, T. S., Shieh, T.R., Wodzinski, R.J. and Ware, J.H. 1971. Effect of supplemental phytase on the utilization of phytate phosphorus by chicks. J. Nutr. 101:1289-1294.
Nelson, T.S., Ferrara L.W. and Storer, N.L. 1968. Phytate phosphorus content of feed ingredients derived from plants. Poult. Sci. 47:1372.
Newman, R.K. and Newman, C.W. 1987. j8-Glucanase effect on the performance of broiler chicks fed covered and hull-less barley isotypes having normal and waxy starch. Nutr. Rep. Jnt. 36:693-699.
Newman, R.K. and Newman, C.W. 1988. Nutritive value of a new hulless barley cultivar in broiler chick diets. Poul. Sci. 67:1573-1579.
O’Dell, B.L., de Boland A.R. and Koirtyohann, S R. 1972. Distribution of phytate and nutritionally important elements among the morphological components of cereal grains. J. Agric. Food Chem. 20:718-721.
Patwardhan, V. N., 1937. The occurrence of phytin-splitting enzyme in the intestines of albino rats. Biochem. J. 31:560.

70
Pawlik, J. R., Fengler, A. I. and Marquardt, R. R= 1990. Improvement of the nutritional value of rye by the partial hydrolysis of the viscous water-soluble pentosan following water-soaking or fungal enzyme treatment. Br. Poult. Sci. 31:525-538.
Pernollet, J.C. 1978. Protein bodies of seeds: ultrastructure, biochemistry, biosynthesis and degradation. Phytochem. 17:1473-1480.
Pettersson,. D and Aman, P. 1988. Effects of enzyme supplementation of diets based on wheat, rye or triticale on their productive value for broiler diets. Anim. Feed Sci. Technol. 20: 313-324.
Pettersson D. and Aman, P. 1989. Enzyme supplementation of a poultry diet containing rye and wheat. Br. J. Nutr. 62:139-149.
Pettersson, D., Graham, K. and Aman, P. 1987. The productive value of whole and dehulled oats in broiler chicken diets, and influence of beta- glucanase supplementation. Nutr. Rep. Int. 36:743-750.
Pointillart, A., Fontaine, N. and Thomasset, M. 1984. Phytate phosphorus utilization and intestinal phosphatases in pigs fed low phosphorus: wheat or corn diets. Nutr. Rept. Intemat. 29:473-483.
Pointillart, A., Fourdin5 A. and Fontaine, N. 1987. Importance of cereal phytase activity for phytate phosphorus utilization by growing pigs fed diets containing triticale or com. J. Nutr. 117:907-913.
Power, R. and Kahn, N. 1993. Phytase: The limitations to its universal use and how biotechnology is responding. In: Biotechnology in the Feed Industry. (T. P. Lyons, Ed.) pp 355-368. Alltech Publications, Nicholasville, KY.
Preece, LA. and MacDougall, M. 1958. Enzymatic degradation of cereal hemicelluloses. IL Pattern of pentosan degradation. J. Inst. Brew. 64:489-500.
Raboy, V., Dickinson, D B. and Below, F.E. 1984. Variation in Seed Total phosphorus, phytic acid, zinc, calcium, magnesium, and protein among lines of Glycine max and G. soja. Crop Science, Vol.24, May- June, p.431-434.
Raboy, V. 1990. 5. Biochemistry and genetics of phytic acid synthesis. In: Inositol Metabolism in Plants, pp 55-76. Wiley-Liss, Inc.
71
Reddy, N.R., Sathe, S.K. and Salunkhe, D.K. 1982. Phytates in legumes and cereal. In: Advances in Food Research, pp 1-92. Academic Press, NY.
Reid, R.L., Franklin M.C. and HaHsworth, E G. 1947. The utilization of phytate phosphorus by sheep. Aust. Vet J. 23:136-140.
Reinhold, J. G., 1971. High Phytate content of rural Iranian bread:a possible cause of human zinc deficiency. Am. J. Clin. Nutr. 24:1204- 1206.
Reinhold, J. G., Lahimgarzadeh., A., Nasr, K. and Hedayati, H. 1973. Effects of purified phytate and phytate-rich bread upon metabolism of zinc, calcium, phosphorus and nitrogen in man. The Lancet, Feb. 10, 1973. pp. 283-288.
Reinhold, J. G., Parsa., A., Karimian., N., Hammick., J.W. and F. Ismail- Beigi. 1974. Availability of zinc in leavened and unleavened wholemeal breads as measured by solubility uptake by rat intestine in vitro. J. Nutr. 104, 976-982.
Reinhold, J. G., Fartyi, B., Abadi, P. and Ismail-Beigi, F. 1976. Decreased absorption of calcium, magnesium, zinc and phosphorus by humans due to increased fiber and phosphorus consumption as wheat bread. 1976. J. Nutr. 106:493-503.
Rickes, E.L., Ham, E.A., Moscatelli, E.A. and Ott, W.H. 1962. The isolation and biological properties of beta-glucanase from B. subtilis. Arch. Biochem. Biophys. 96:371-375.
Rotter, B. A., Marquardt, R. R., Guenter, W., Biliaderis, C. and Newman, C. W. 1989. In vitro viscosity measurements of barley extracts as predictors of growth responses in chicks fed barley based diets supplemented with a fungal enzyme preparation. Can. J. Anim. Sci., 69:431-439.
SAS. 1985. Statistical Analysis Systems User’s Guide: Statistics. Version 5 ed. SAS Institute Inc., Cary, NC.
Sauveur, B., 1989. Phosphore phytique et phytases dans !’alimentation des volailes. INRA Prod. Anim. 2:5:343.
Schwarz, G. and Hoppe, P.P. 1992. Phytase enzyme to curb pollution from pigs and poultry. Feed Magazine 1/92, pp 22-26.
72
Sears, A. and Walsh, G. 1993. Industrial enzyme applications: Using these concepts to match animal, enzyme and substrate in feed industry applications. In: Biotechnology in the Feed Industry. (T. P . Lyons, Ed.) pp 373-394. AUtech Pubhcations, NicholasviUe, KY.
Simons, P.C.M., Versteegh, H.A.J., Jongbloed, A.W., Kemme, P.A., Slump, P., Bos, K.D., Welters, M.G.E., Beudeker, R F. and Verschoor, G.J. 1990. Improvement of phosphorus avaUability by microbial phytase in broUers and pigs. Brit. J. Nutr. 64:525-540.
Singseri, E. P., and MitcheU, H.H. 1944. Soybean meal chick rations need no inorganic phosphorus supplements. Poultry Sci. 23:152.
Southgate, D.A.T. 1987. Minerals, trace elements, and potential hazards. Amer. J. Clin. Nutr. 45:1256-1266.
Spitzer, R.R. and Phillips, P.H. 1945. Enzymatic relationships in the utilization of soybean oU meal phosphorus by the rat. J. Nutr. 30:183.
Tietge, D. A., Campbell, G. L. and GrootWassink, J. W. D., 1988. Heat pretreatment as a means of improving the response to dietary pentosanase in chicks fed rye. Can. J. Anim. Sci., 71:507-513.
Underkofler, L. A., Barton, R.R. and Rennert, S.S. 1958. Microbiological process Report. Production of Microbial enzymes and their applications. AppUed Microbiology. Vol 6, No. 3, pp 212-220.
United States Department of Agriculture. 1992. Agricultural Statistics. United States government Printing office, Washington D. C.
Vohra, P. and Kratzer, F.H. 1966. Influence of various phosphates and other complexing agents on the avaUabUity of zinc for turkey poults. J. Nutr. 89, 106-112.
Wang, L. 1992. Influences of oU and soluble fiber of barley grain on plasma cholesterol concentrations in chicks and Hamsters. PhD Thesis. Montana State University, Bozeman, Montana.
Wang, L., Newman, R.K., Newman, C.W., Hofer P.J. and A.I. Fengler. 1992. Barley jS-glucans alter intestinal viscosity and reduce plasma cholesterol concentration in chicks. J. Nutr. 12:2292-2297.

73
Ware, J.J., Bluff, L. and Shieh, T.R. 1967. Concept of adding microbial phytase to feeds for monogastric animals.U.S. patent no. e,297,548.
Wieringa, G. W. 1967. On the occurrence of growth inhibiting substances in rye. Publ. 156. Institute for storage and processing of Agriculture produce: Wageningen, The Netherlands.
Willingham, H.E., Jensen, L.S. and McGinnis, J. 1959. Studies on the role of enzyme supplements and water treatment for improving the nutritional value of barley. Poultry Sci. 38:539-544. .
Willingham, H. E., Leon, K. C. and Jensen, L. S. 1960. Influence of geographical area of production on response of different barley samples to enzyme supplements or water treatment. Poult. Sci. 39:103-108.
Xue, Q., Newman, R.K., Newman, C.W. and McGuire, C.E. 1991. Waxy gene effect on /3-gIucan, dietary fiber content and viscosity of barleys. Cereal Res. Comm. 19:399 404.
Young L. G., Leunissen, M. and Atkinson, J.L. 1993. Addition of Microbial phytase to diets of young pigs. J. Anim. Sci. 71:2147-2150.

H O I K H f NHINDfKY I I f)
UTICA 'IMAHA