energetics of the loop-to-helix transition leading to the coiled-coil structure of influenza virus...
TRANSCRIPT

proteinsSTRUCTURE O FUNCTION O BIOINFORMATICS
Energetics of the loop-to-helix transitionleading to the coiled-coil structure ofinfluenza virus hemagglutinin HA2 subunitsQiang Huang,1* Thomas Korte,2 P. Sivaramakrishna Rachakonda,2
Ernst-Walter Knapp,3 and Andreas Herrmann2*1 State Key Laboratory of Genetic Engineering, School of Life Sciences, Fudan University, Shanghai 200433, China
2 Institute of Biology, Molecular Biophysics, Humboldt University Berlin, 10115 Berlin, Germany
3 Institute of Chemistry and Biochemistry, Free University Berlin, 14195 Berlin, Germany
INTRODUCTION
Influenza virus enters the host cell via receptor-mediated endo-
cytosis. Subsequently, the fusion of the viral and endosomal mem-
branes is mediated by the integral membrane protein hemaggluti-
nin (HA) of the virus.1,2 The three-dimensional structure of the
ectodomain of HA from influenza virus X31 (subtype H3)3 and
more recently from H1,4,5 H5,6 H9,7 and H78 subtypes at neutral
pH has been solved. All of these structures show that HA forms a
homotrimer. Each of the monomers contains two subunits (HA1
and HA2) linked by a disulphide bond. In the HA2 subunit, one
short and one long a-helical segments are oriented antiparallel and
connected by a loop. The N-terminal segment next to the short a-
helix is the so-called fusion sequence consisting of 20 amino acids,
while C-terminal of the long a-helix HA2 is anchored to the viral
membrane.
Experiments have shown that the acidic pH (pH�5) in the
endosome triggers conformational changes of the HA ectodomain,
which activates its membrane fusion capacity.9–12 The crystal
structures of HA2 fragments from influenza virus X31 at low
pH13,14 and studies on related peptides15 revealed that the con-
formational changes of HA involve a folding of the loop connect-
ing the two a-helical segments of HA2 into a helix (hereafter we
designate this conformational change as the loop-to-helix transi-
tion) [Figs. 1(A,B)]. As a result, the three HA2 subunits of the tri-
meric HA form an extended triple-stranded coiled-coil structure.
The formation of this rod-like structure—the so called ‘‘spring-
loaded mechanism’’15—is essential for the fusion process, since it
moves the fusion sequence that originally is buried 100-A distal of
the HA ectodomain to the tip of the ectodomain and enables the
Grant sponsor: National Natural Science Foundation of China; Grant number: 30570406; Grant
sponsor: Shanghai Leading Academic Discipline Project; Grant number: B111; Grant sponsor:
Deutsche Forschungsgemeinschaft; Grant number: SFB 765.
*Correspondence to: Andreas Herrmann, Institute of Biology, Molecular Biophysics, Humboldt
University Berlin, Invalidenstr. 42, 10115 Berlin, Germany. E-mail: [email protected]
berlin.de; or Qiang Huang, School of Life Sciences, Fudan University, 220 Handan Rd., Shanghai
200433, China. E-mail: [email protected]
Received 29 September 2007; Revised 19 April 2008; Accepted 23 May 2008
Published online 10 July 2008 in Wiley InterScience (www.interscience.wiley.com).
DOI: 10.1002/prot.22157
ABSTRACT
Fusion of influenza virus with the endosomal
membrane of the host cell is mediated by the
homotrimer-organized glycoprotein hemagglutinin
(HA). Its fusion activity is triggered by a low pH-
mediated conformational change affecting the
structure of the HA1 and HA2 subunits. The HA2
subunits undergo a loop-to-helix transition leading
to a coiled-coil structure, a highly conserved motif
for many fusion mediating viral proteins. How-
ever, experimental studies showed that the HA2
coiled-coil structure is stable at neutral and low
pH, implying that there is no direct relationship
between low pH and the HA2 loop-to-helix transi-
tion. To interpret this observation, we used a com-
putational approach based on the dielectric contin-
uum solvent model to explore the influence of
water and pH on the free energy change of the
transition. The computations showed that the elec-
trostatic interaction between HA2 fragments and
water is the major driving force of the HA2 loop-
to-helix transition leading to the coiled-coil struc-
ture, as long as the HA1 globular domain covering
the HA2 subunits in the nonfusion competent con-
formation is reorganized and thereby allows water
molecules to interact with the whole loop seg-
ments of the HA2 subunits. Moreover, we show
that the energy released by the loop-to-helix tran-
sition may account for those energies required for
driving the subsequent steps of membrane fusion.
Such a water-driven process may resemble a gen-
eral mechanism for the formation of the highly
conserved coiled-coil motif of enveloped viruses.
Proteins 2009; 74:291–303.VVC 2008 Wiley-Liss, Inc.
Key words: virus-cell membrane fusion; fusion-
mediated protein; conformational change; free
energy change; protein protonation; continuum
solvent model; Poisson-Boltzmann equation.
VVC 2008 WILEY-LISS, INC. PROTEINS 291

sequence to penetrate into the target cell membrane. Sev-
eral studies have shown that the structural feature of an
extended, triple-stranded rod-shaped a-helical coiled-coil
is conserved for fusion proteins of various enveloped
viruses (for a review, see Ref. 16) and implies a common
mechanism of membrane fusion.
What drives the HA2 loop-to-helix transition? At a
first glance, one may wonder whether the transition is
caused directly by low pH (low pH-driven mechanism),
i.e., by enhanced protonation of titratable side chains of
the HA2 subunits affecting the electrostatic interactions
within the trimeric HA. However, experimental studies
on HA2 coiled-coil-like synthetic peptides15 and
HA217,18 have shown that the coiled-coil structure is
stable at neutral pH and low pH, implying that there is
no direct relationship between low pH and the loop-to-
helix transition. In agreement with the experimental
observations, a computational study has shown that the
low pH conformation of the coiled-coil part of HA by
itself is energetically more stable than the native confor-
mation.19 All these results imply that the HA2 coiled-
coil might form by a mechanism that is essentially inde-
pendent of low pH. However, to the best of our knowl-
edge, a theoretical interpretation to the driving force of
the transition is not yet firmly established.
The goal of this study is to provide an explanation
why the HA2 loop-to-helix transition leading to the
coiled-coil structure occurs spontaneously at both low
and neutral pH. One possible explanation is that pH-
independent interaction between HA2 subunits and water
is the major driving force for the formation of the
coiled-coil structure (water-driven mechanism). This
assumption is supported by the observation that the
HA2 polypeptide possesses the well-known heptad repeat
pattern of hydrophobic/hydrophilic amino-acids [Fig.
1(C)], which has been shown to be crucial for the forma-
tion of coiled-coil structures.15 In aqueous solution, the
formation of the HA2 coiled-coil structure buries the
hydrophobic residues in the helical interfaces and exposes
the hydrophilic residues to bulk water stabilizing this
structure. Obviously, to trigger and drive the formation
of the coiled-coil structure, it is necessary for water mol-
ecules to directly interact with the hydrophilic residues.
However, in the neutral pH conformation [Fig. 1(A)],
part of the loop segment in HA2 is not water-accessible
because it is covered by the HA1 globular domain. If this
globular domain opens up as a result of a conformational
change and thus water can interact with the whole loop
segment, the HA2 loop-to-helix transition leading to the
coiled-coil structure could be triggered. To rationalize
this water-driven mechanism, we use a computational
approach to explore the influences of pH change and
water on the free energy change of the HA2 loop-to-helix
transition in the pH range of 4–10. This approach com-
bines energy computations accounting for intra-protein
and protein-solvent interactions20 with an evaluation of
Figure 1(A) The crystal structures of the native HA ectodomain at neutral pH
and a fragment of HA2 at low pH (influenza virus X31) (PDB IDs:
2HMG and 1HTM, respectively). (B) The crystal structures of L150
from 2HMG and H150 from 1HTM. (C) The corresponding sequence
of the 50 amino acids (a.a. 40–89) of a single HA2 chain (second line).
The first line indicates the heptad repeat pattern of hydrophobic
residues. At the bottom the structural motifs in L150 are shown.
Q. Huang et al.
292 PROTEINS

the protonation pattern of titratable groups in the pro-
tein21–23 using a dielectric continuum model. The
results suggest that the loop-to-helix transition is mainly
driven by interactions between the HA2 subunits and
water, and may take place spontaneously at both neutral
and low pH.
METHODS
Structural models of HA2 subunits
This study focuses on the free energy difference of the
HA2 loop-to-helix transition leading to the coiled-coil
structure. To calculate the free energies, the crystal struc-
tures of the loop conformation3 and of the coiled-coil
conformation13 of the HA ectodomain of influenza virus
X31 (subtype H3) were used as the initial structures
to produce the conformational ensembles by molecular
dynamics (MD) simulations (see Computational Details).
The coordinates of nonhydrogen atoms were obtained
from Protein Data Bank, PDB IDs 2HMG, and 1HTM,
respectively.
To reduce the computational burden of electrostatic
energy computations, we only considered the amino acid
residues 40–89 (50 amino acids) of the HA2 subunit
[Fig. 1(B)]. The selected sequence is almost identical to
that of a 52 amino acid peptide used to characterize HA2
coiled-coil motif15 and lacks only the first two amino
acids (Leu-38 and Arg-39) because no coordinates are
available for them in the crystal structure 1HTM. This
sequence contains the loop segment (a.a. 55–76), the
short N-terminal a-helix and part of the long a-helix,
and therefore includes most of the residues that are
involved in the loop-to-helix transition (a.a. 40–76).
Consequently, each of the two trimeric conformations (L:
loop; H: helix) in Figure 1(B) consist of 150 residues
from which a total of 60 residues are titratable. In this
study, we refer to these two different trimeric structures
as L150 and H150, respectively.
The pH-dependent free energy ofconformational transition
As described by the statistical-mechanical approach of
implicit solvent models,20 we assume that the potential
energy of protein-solvent system can be decomposed as
intra-protein, protein–solvent, and solvent–solvent inter-
actions. Therefore, by averaging over the solvent degrees
of freedom, one may define a free energy function for a
given conformation i of the protein in aqueous solution,
called potential of mean force (PMF), Wi, as
Wi ¼ Ep�pi þ DGnp
i þ DGeleci : ð1Þ
The first term, Ep�pi , describes the intra-protein energy,
the second term, DGnpi , is the non-polar solvation free
energy, and the third term, DGeleci , is the polar solvation
free energy.20 The intra-protein energy can be calculated
with conventional molecular mechanics force fields,24 as
Ep�pi ¼ ebond
i þ eanglei þ edihedral
i þ eimproperi
þ evdWi þ ecoulomb
i ; ð2Þ
The six terms on the right side are bond, angle, dihe-
dral, improper torsion, van der Waals (vdW), and elec-
trostatic energies of the protein, respectively. Thus, the
Ep�pi term was also referred to as gas-phase energy. The
non-polar and polar solvation free energy in Eq. (1),
DGnpi and DGelec
i , are caused by the vdW and electrostatic
interactions between the protein and solvent, i.e., the
energy difference caused by transferring the charged pro-
tein from gas phase into solution. We determined DGnpi
by using a term depending linearly on the solvent-acces-
sible surface area SA according to DGnpi 5 gSA 1 b,
while the DGeleci term was calculated by solving finite dif-
ference Poisson-Boltzmann (PB) equation of macroscopic
continuum electrostatics (see also Computational
Details).
A change from neutral to low pH affects the protona-
tion state of the protein and thus the charge state of each
the titratable residue. If the protonation state of the pro-
tein at the given pH is known, its PMF at this pH can be
calculated directly by Eq. (1). However, in practice a large
number of different protonation states can be populated,
rendering an averaging procedure unfeasible. As an alter-
native, we assume the titratable residues to be in the
standard protonation state (i.e., the aspartates, glutamates
are unprotonated; and arginines, histidines, lysines, and
tyrosines are protonated) around neutral pH. With such
a simplification, the obtained PMF should be considered
as that of the protein in the standard protonation state.
Thus, in order to explicitly evaluate the low pH effects
on the free energy difference, we calculated the pH-de-
pendent free energy by two successive thermodynamic
steps: (i) the charged protein in the standard protonation
state is transferred from gas phase into solution; (ii) the
protonation states of the titratable sites are varied to
sample the protonation equilibrium at the given pH. So
the free energy of the protein conformation i at a given
pH is decomposed as
WpHi ¼ W std
i þ DGpHi ; ð3Þ
The first term in Eq. (3), Wstdi , is the free energy of
conformation i in the standard protonation state, and
calculated with Eq. (1). The second term, DGpHi , is the
free energy for transferring the protonation in conforma-
tion i from the standard state to the real protonation
state at the given pH, and will be calculated by the
method introduced in the next subsection.
Energetics of HA2 Loop-to-Helix Transition
PROTEINS 293

On the basis of the above energy decomposition using
the standard protonation state as reference, we have
DGpHi : 0 for the protein in the standard protonation
state. Hence, DGpHi , is actually the energy contribution,
which takes into account the electrostatic interactions
between titratable residues in the protein at a given pH
relative to the standard protonation state of the protein.
The electrostatic energy DGpHi can be decomposed into
DGpHi ¼ DeCoulomb;pH
i þ DDGelec;pHi ð4Þ
where DeCoulomb;pHi and DDGelec;pH
i are differences in the
Coulomb energy and polar solvation free energy of the
protein in the protonation state at given pH relative to
the standard protonation state. Since Wstdi is per defini-
tion independent of pH, the pH-dependence of WpHi is
governed by DGpHi alone. Thus, the intra-protein Cou-
lomb energy and the polar solvation free energy of the
protein in the protonation state at given pH are
expressed, respectively, as
eCoulomb;pHi ¼ e
Coulomb;stdi þ DeCoulomb;pH
i ; ð5aÞ
DGelec;pHi ¼ DGelec;std
i þ DDGelec;PHi : ð5bÞ
In our study we focus on the free energy of the confor-
mational transition from L150 to H150, so that the con-
formations of the Ca atoms from 2HMG and 1HTM are
mainly considered for L150 and H150, respectively. Thus,
in the MD simulations that generate conformational
ensembles for the electrostatic calculations harmonic con-
straints are applied to the Ca atoms, and the positions of
the other atoms are allowed to fluctuate freely. Taken to-
gether, with Eq. (3), the free energy difference in the con-
formational transition from L150 to H150 is
DGL!HðpHÞ ¼ hW pHH i � hW pH
L i � TðSconfH � Sconf
L Þ; ð6Þ
where h�i denotes the average over all configurations of
the L150 or H150 atoms. Therefore, the difference in en-
tropy between the structures L150 and H150 contributed
by the protonation patterns of L150 and H150 is com-
prised in the terms hWpHL i and hWpH
H i, while the confor-
mational entropies of the L150 and H150 atoms are con-
sidered separately by SconfL and Sconf
H in Eq. (6). Estimation
of the conformational entropies is explained in Computa-
tional Details section.
The protonation free energy
To calculate DGpHi , we employed the modelling frame-
work based on the continuum solvent model.23,25 In
this framework, one may use an N-component vector, x
5 (x1,. . .,xj,. . .,xN) to characterize the protonation state
of a protein conformation with N titratable sites. The
vector component, xj, is a two-value variable defining the
protonation state of the titratable site j, which is set to 0
or 1 if the site j is unprotonated or protonated, respec-
tively. Taking the neutral protonation state (designated as
x0) as the reference state, i.e., acids are protonated (x0j 5
1) and bases are unprotonated (x0j 5 0), the electrostatic
energy of the protein in protonation state, x, is given by
UðxÞ ¼XN
j�1
ðxj � x0j ÞkBT ln10ðpH � pKintr
a;j Þ
þ 1
2
XN
j¼1
XN
k¼1
ðxj � x0j Þðxk � x0
k ÞBjk ; ð7Þ
where pKa,jintr is the intrinsic pKa value of site j; Bjk is the
electrostatic interaction between two unit charges at sites
j and k.
One may use a different protonation state as the refer-
ence state of protonation, which would change the zero
point of energy but would not have any influence on
energy differences. As mentioned, in this study we
employed as reference the standard protonation state, xstd
(i.e., the aspartates, glutamates are unprotonated; and ar-
ginines, histidines, lysines, and tyrosines are protonated).
With respect to this reference state, the potential energy
of conformation i in protonation state, xn, becomes
DUn ¼ UðxnÞ � U ðxstdÞ: ð8Þ
Therefore, the protonation partition function of the
conformation i at the given pH is
ZpHi ¼
X2N
n
exp½�bDUn�; ð9Þ
where b 5 1/(kBT) (kB is Boltzmann constant). This
equation requires a summation over all possible protona-
tion states, 2N, of the conformation i. Because of current
capacity of computation, the summation usually becomes
impossible when N > 30. Because both L150 and H150
consist of 60 titratable residues, one has to use an
approximation method to calculate DGpHi . To this end,
we adopted the strategy of ‘‘reduced-site approximation’’
applied in Ref. 25. We first employed a Monte Carlo
sampling procedure26 to obtain the protonation proba-
bility y (i.e., the average number of associated proton) of
each site:
uj ¼ hxji ¼
P2N
n
xj exp½�bDUn�
P2N
n
exp½�bDUn�: ð10Þ
Usually, the y values of most sites are very close to 1
or 0. This means they are protonated or unprotonated
Q. Huang et al.
294 PROTEINS

for the accessible protonation states of the protein in
thermodynamic equilibrium. Here, we considered a site
as always protonated or unprotonated if its y value is
greater than 0.95 or less than 0.05, respectively. Based on
this approximation, we fixed the corresponding compo-
nents in the vector, x, to 1 or 0. Thus, if R components
of x are fixed, the number of all possible protonation
states to be summed over in Eq. (9) is reduced from 2N
to 2N-R. These 2N-R states may be regarded as the approx-
imation of the accessible protonation states of the protein
in equilibrium, and thus their statistical weights are of
importance to the partition function in Eq. (9). Hence,
the protonation free energy is approximated as
DGpHi ¼ �kBT ln
X2N�R
n
exp½�bDUn�: ð11Þ
As mentioned, for the protein in the standard protona-
tion state we have DGpHi : 0.
Computational details
We employed molecular dynamics (MD) simulation
to generate conformational snapshots of L150 and H150
used in the calculations of intra-protein energy, non-
polar, and polar solvation free energies of the proteins
which ionizable residues adopt standard protonation
states. The initial structures of non-hydrogen atoms of
L150 and H150 corresponded to 2HMG and 1HTM,
respectively (see Structural Models of HA2 Subunits). To
prepare the set-up for the MD simulation of the struc-
tures of L150 and H150, the hydrogen-atom coordinates
were generated using the program psfgen from the
NAMD suite of programs27 with the CHARMM27 force
field,28 with standard protonation for all titratable
groups and treating N- and C-termini of the polypeptide
chains as acetylated and amidated, respectively. Then,
the all-hydrogen atom structures were solvated with
TIP3P29 water molecules in a rectangular box, with the
thickness of the water layer between the protein and the
closest box-boundary being 14 A. The ionic concentra-
tion in the water box was set to 150 mM, as used in
related experimental studies.15,30 Equal numbers of
Na1 and Cl2 ions were first determined according to
the ionic concentration, and then additional Cl2 ions
were placed into the box to neutralize the system which
ionizable residues are in the standard protonation states.
MD simulations at constant N, P, T were run with the
program NAMD (P 5 1 atm, T 5 300 K) using a time
step of 1 fs. All Ca atoms were restrained at their initial
conditions by a small harmonic constraint force constant
of 0.1 kcal�mol21 A22. The SHAKE algorithm31 was
used to constrain covalent bonds of water molecules.
Periodic boundary conditions with particle-mesh Ewald
treatment of the electrostatics32 were employed. The
time span for each MD simulation run was 2 ns: after 1-
ns of equilibration a production phase of 1-ns followed.
For the energy calculations, snapshot structures of L150
or H150 at time intervals of 10 ps were extracted from
the production run. All energy terms of L150 or H150
were calculated for each of the snapshot structures and
then averaged.
Using the atomic coordinates of the snapshot struc-
tures obtained by the MD simulations of L150 and
H150, the Ep�pi values of L150 and H150 in Eq. (1) were
computed, where the non-bonded forces were calculated
without cut-off distance. The non-polar solvation free
energy, DGnpi , was calculated by using the mentioned sol-
vent-accessible surface model. The SA term was estimated
with the program MSMS.33 For g and b, we used the
constant values of 5.42 cal mol21 A22 and 0.92
kcal�mol21, respectively.34
The MEAD suite of programs22,35 was used for all
electrostatic calculations based on the continuum solvent
model. This program suite employs a finite difference
approach for solving the Poisson-Boltzmann equation to
obtain the electrostatic potential. We used the program
solvate to calculate the polar solvation free energy of the
proteins in the standard protonation state in solution,
DGeleci , and the program multiflex to calculate the electro-
static interactions of charged titratable residue pairs, Bjk,
in Eq. (7). In the calculations, the dielectric constant was
ep 5 4 inside the protein and ex 5 80 for the solvent.
Again, the ionic concentration was set to 150 mM NaCl,
and temperature to 300 K. For the computation of the
electrostatic potential, the finite difference lattice was
setup as a cubic box containing precisely the whole struc-
ture (L150 or H150). In the following two focusing steps,
a grid spacing of 1.0 A (grid centered at the protein) and
of 0.25 A (grid centered at the titratable group) were
used to compute electrostatic potentials.
With pKintra;j and Bjk in Eq. (7), the program Karlsberg36
was then applied to obtain the protonation probability,
yj, in Eq. (10) for every MD snapshot. To compute the
probability of an individual titratable site, 100,000 proto-
nation states were sampled by the Karlsberg Monte Carlo
procedure, with a standard deviation of less than 0.01
protons for each titratable site. Finally, the protonation
free energy in Eq. (11) was calculated by the reduced-site
method with our program redusite, which is available
free of charge by sending a request to the authors
(Q.H.). This program computed for each set of ensemble
parameters (pH, temperature, and ionic strength) the
fixed titratable sites and its number R (see The Protona-
tion Free Energy section) and then evaluated the free
energies according to Eq. (11).
Finally, the conformational entropies, SLconf and SH
conf,
in Eq. (6) were estimated by the quasi-harmonic analy-
sis37,38 of the production-run trajectories of L150 and
H150 in the MD simulations. The quasi-harmonic calcu-
Energetics of HA2 Loop-to-Helix Transition
PROTEINS 295

lations were based on the covariance matrices of the
positional fluctuations of all atoms of L150 and H150
during the trajectories.
RESULTS AND DISCUSSION
The free energy of conformational transition
We first calculated the pH-independent free energy of
the loop-to-helix transition from L150 to H150 by calcu-
lating the intra-protein interaction, Ep�pi , the non-polar
solvation free energy, DGinp, the polar solvation free
energy, DGielec in Eq. (1), and the conformational entropy,
Sconfi , in Eq. (6) for L150 and H150 in the standard pro-
tonation state. The results are listed in Tables I and II.
With Eq. (11), the protonation free energies of L150 and
H150 were also calculated in the range from pH 4 to 10,
with an increment of 0.05 pH units, as shown in Figure
2(A) (Curves 1 and 2). The obtained pH-dependent
PMFs of L150 and H150 between pH 4210 are shown in
Figures 2(B) (Curve 2) and (C) (Curve 2), respectively.
As seen in Figures 2(B,C), in the investigated pH range
the PMF of H150 is always less than that of L150. The
contributions from conformational entropy are relatively
small (Table II). Therefore, the free energy of the confor-
mational transition from L150 to H150, DGL?H (pH), is
always negative in the studied pH range 4–10 (see also
Curve 3 in Fig. 3). The negative free energies indicate
that the loop-to-helix transition can take place spontane-
ously at both neutral and low pH, in good agreement
with observations.15,17,18 However, in the neutral form
of the HA, the HA2 subunits are covered tightly by the
HA1 globular domain, which could suppress the transi-
tion, though at neutral pH the transition is thermody-
namically favored. Thus, conformational changes of the
HA1 globular domain seem to be a prerequisite to enable
the HA2 loop-to-helix transition, (see further discussion
Figure 2The PMFs of L150 and H150 as a function of pH at T 5 300 K, with
an increment of 0.05 pH units. (A) The protonation free energy of thetransition from L150 to H150. Curves 1 and 2 correspond to the
protonation free energies of L150 and H150, respectively, and Curve 3
to the energy difference associated with the transition from L150 to
H150. (B) The PMF of L150. Curve 1 corresponds to the PMF of L150
in the standard protonation state, Curve 2 to the PMF of L150 in the
actual protonation state at the given pH. (C) The PMF of H150. Curve
1 corresponds to the PMF of H150 in the standard protonation state,
Curve 2 to the PMF of H150 in the actual protonation state at the
given pH. [Color figure can be viewed in the online issue, which is
available at www.interscience.wiley.com.]
Figure 3The free energies of the transition from L150 to H150 with respect to
pH at T 5 300 K. Curve 1 corresponds to the free energies of proteins
in the standard protonation state (see Table II), Curve 2 to the values
of the intra-protein energy (see Table I) plus the protonation free
energy of the transition, and Curve 3 to the total free energies of the
transition. [Color figure can be viewed in the online issue, which is
available at www.interscience.wiley.com.]
Q. Huang et al.
296 PROTEINS

in Possible Role of Low pH for the Conformational
Changes of HA section).
The effects of protein–water interactionsat a given pH
As shown in Figure 3 (Curve 3), the computed free
energies of the loop-to-helix transition are negative at
both neutral and low pH. To unravel the major force
driving the transition, the energy term with the main
contribution to the negative free energy has to be identi-
fied. Based on the current modeling approach, the exact
values of two energy terms at a given pH—the intra-pro-
tein Coulomb energy, eCoulomb;pHi ; and the polar solvation
free energy, DGelec;pHi —cannot be determined via Eq. (5),
because the pH-dependent term, DGpHi , in Eq. (4) cannot
be separated explicitly into DeCoulomb;pHi and DDGelec;pH
i .
However, as indicated by the results in Tables I and II,
and Figures 2(B,C), DGpHi has only a very small contribu-
tion to the PMF for both L150 and H150 in the investi-
gated range of pH. For example, at pH 5 the hDGpHi i val-
ues of L150 and H150 are 24.1 and 28.4 kcal�mol21
[Curves 1 and 2 in Fig. 2(A)] respectively, whereas the
heCoulomb;stdi i values are 210744.1 and 210134.9
kcal�mol21 (Table I), respectively, and the hDG elec,stdi i val-
ues are 22126.0 and 22578.7 kcal�mol21 (Table II),
respectively. Even at the minima at pH 4, the hDGpHi i
values of L150 and H150 are relatively small [215.2 and
221.4 kcal�mol21, respectively, see Curves 1 and 2 in Fig.
2(A)]. Based on Eqs. (3)–(5), in the range of pH 4–10
we have eCoulomb;pHi � e
Coulomb;stdi , DGelec;pH
i � DGelec;stdi ,
and WpHi � Wstd
i for L150 and H150, respectively. These
results imply that at any pH in the range of 4–10 the
energy terms of L150 and H150 in the standard protona-
tion state resemble those of the proteins in their actual
protonation states. Therefore, we may directly use these
energy terms to discuss their effects on the loop-to-helix
transition at the given pH.
As shown by hEp�pi i in Table I, the energy E
p�pi of con-
formation H150 is significantly higher than that of L150.
Such a positive change in Ep�pi for the loop-to-helix tran-
sition (L150 ? H150) is mainly attributed to electro-
static energies, whereas the intra-protein vdW interac-
tions favor the relatively compact conformation H150.
Since L150 as well as H150 consist of three non-bonded
identical monomeric polypeptide chains [chains B, D,
and F as indicated in Fig. 1(B)], we further decomposed
Ep�pi into intra-monomer and inter-monomer energies
according to
DEp�pi;inter ¼ E
p�pi � E
p�pi;B � E
p�pi;D � E
p�pi;F ; ð12Þ
where DEp�pi;inter are the inter-, and E
p�pi;B , E
p�pi;D , and E
p�pi;F
the intra-monomer energies of chains B, D, and F,
respectively. The energy decomposition in Eq. (12)
showed that the inter-monomer Coulomb energy is the
main cause for the increase in Ep�pi going from the initial
structure L150 to the coiled-coil structure H150. Here
again, the inter-monomer vdW interactions favor H150
rather than L150 (Table III). The reason for the increase
of Ep�pi is that the charge states of the three monomers
are similar, and thus the inter-monomer electrostatic
energies of the relatively compact conformation H150 is
greater than that of L150 because of Coulomb repulsion
among the monomers.
The non-polar and polar solvation free energies of
L150 and H150, hDGnpi i and hDGelec
i i, and their confor-
mational entropies, Sconfi , listed in Table II show that the
relatively small, non-polar solvation free energy cannot
compensate for the positive energy change of hEp�pi i in
Table IAverage Intraprotein Energy Terms of L150 and H150 in the Standard
Protonation State Over MD Snapshots in Units of kcal mol21
Energyterms L150 H150
Differencesa
(H150 – L150)
hebond,stdi i 860.8 � 24.9 869.4 � 26.6 8.6 � 36.1heangle,stdi i 1349.2 � 27.3 1371.0 � 32.7 21.8 � 42.1hedihedral,stdi i 662.9 � 12.6 662.2 � 12.2 -0.7 � 17.4heimproper,stdi i 85.5 � 7.3 87.5 � 6.0 2.0 � 9.3hevdW,std
i i 2745.9 � 13.8 2954.4 � 14.8 2208.5 � 20.0heCoulomb,stdi i 210744.1 � 53.2 210134.9 � 73.9 609.2 � 90.2hE p2p,std
i i 28531.6 � 69.8 28099.2 � 79.2 432.4 � 104.5
aThe averages and standard deviations were computed by taking the differences of
all possible pairs of L150 and H150.
Table IIAverage pH-Independent Terms of the Free Energy Differences of L150
and H150 in the Standard Protonation State Over MD Snapshots in
Units of kcal mol21(T 5 300 K)
Energyterms L150 H150
Differencesa
(H150 – L150)
hE p2p,stdi i 28531.6 � 69.8 28099.2 � 79.2 432.4 � 104.5
hDGnp,stdi i 77.8 � 0.6 56.5 � 0.5 221.3 � 0.8
hDGelec,stdi i 22126.0 � 25.8 22578.7 � 36.9 2452.7 � 44.6
2TSconfi 2103.6 299.6 4.0
hW stdi i 2 TSi
conf 210683.4 210721.0 237.6
aThe averages and standard deviations were computed by taking the differences of
all possible pairs of L150 and H150.
Table IIIAverage Inter-Monomer Energy Terms of L150 and H150 in the
Standard Protonation State Over MD Snapshots in Units of kcal mol21
Energyterms L150 H150
Differencesa
(H150 – L150)
hDevdW,stdi i 276.6 � 8.2 2207.6 � 9.8 2131.0 � 12.6
hDeCoulomb,stdi i 2836.6 � 33.1 2227.6 � 42.6 609.0 � 53.4hDE p2p,std
i,inter i 2913.2 � 29.8 2435.2 � 41.3 478.0 � 50.4
aThe averages and standard deviations were computed by taking the differences of
all possible pairs of L150 and H150.
Energetics of HA2 Loop-to-Helix Transition
PROTEINS 297

the transition from L150 to H150. However, the electro-
static interactions between protein and solvent expressed
by the polar solvation free energy can fully compensate
for it. Again, the negative difference of the free energy
(237.6 kcal�mol21) implies that the loop-to-helix transi-
tion can take place spontaneously at any pH in the range
of 4–10, since the L150 conformer is metastable (see also
Possible Role of Low pH for the Conformational Changes
of HA section). A computational study based on two dif-
ferent energy functions, the effective energy function
EEF1 defined by the authors and generalized Born model,
has already shown that the effective energy of the HA2
coiled-coil conformation is lower than that of the loop
conformation for the residues present in 1HTM, also
indicating that in the absence of HA1 HA2 folds into the
1HTM conformation.19 Since at any pH in the range of
4–10 the electrostatic interaction between the protein and
the solvent dominates the free energy difference between
L150 and H150 (2452.7 � 44.6 kcal�mol21 in Table II),
the protein–water interactions are the major driving force
of the loop-to-helix transition.
The effects of the change fromneutral to low pH
The protonation free energies of L150 and H150, and
the free energy difference between L150 and H150,
DDGpHL!H, in the range from pH 4 to 10 has been shown
in Figure 2(A). In the investigated pH range the protona-
tion free energies of H150 are always lower than those of
L150 [Curves 1 and 2 in Fig. 2(A)] and thus their differ-
ences associated with the transition from L150 to H150
are also negative [Curve 3 in Fig. 2(A)]. As mentioned,
by taking into account both the constant contribution in
the standard protonation state (237.6 kcal�mol21) and
those of the protonation free energy [Fig. 2(A)], the total
free energies of the loop-to-helix transition within the
investigated pH range are always in favor of the coiled-
coil formation (Curve 3 in Fig. 3). The free energies of
the loop-to-helix transition at pH 5.0 and 7.4 are found
to be very similar, i.e., DDGL?H(pH7.4?5) 5 20.3
kcal�mol21 (see Curve 3 in Fig. 3).
To unravel the origin of the negative protonation free
energy of the loop-to-helix transition, we have also calcu-
lated the average (total) numbers of associated protons
with the titratable sites of L150 and H150 based on the
protonation probabilities of these sites.39 As illustrated
in Figure 4, the numbers of protons associated with
H150 are always greater than those with L150 in the
investigated pH range of 4 to 10 (Curves 1 and 2 in Fig.
4). The differences of the average numbers of protons
between H150 and L150 range from 21.74 to 1.74 pro-
tons (21.26 to 1.28 between pH 7 and 4) [see Curve 3
in Fig. 4(A)]. We found that these differences are attrib-
uted to protonations of aspartates, glutamates, and histi-
dines. Thus, from the viewpoint of chemical equilibrium,
the protonation of the titratable sites of H150 is
enhanced with respect to L150 at low pH, and therefore
the protonation free energies are lower. However, the
positive protonation differences are not simply caused by
a few titratable residues. As an example, differences of
protonation probabilities of the residues for one HA2
chain (Chain B) between H150 and L150 are shown in
Figure 4(B). From the figure, it can be seen that for some
of the residues the average number of associated protons
even decreases when transforming from L150 to H150, as
indicated by the negative values of the differences.
Possible role of low pH for theconformational changes of HA
It is well known that low pH triggers conformational
changes of HA leading to its fusion active state. Such
Figure 4Associated protons with proteins with respect to pH at T 5 300 K. (A)
The average associated protons with the titratable sites of L150 and
H150. Curves 1 and 2 correspond to the values of L150 and H150,
respectively, and Curve 3 corresponds to the differences associated with
the transition from L150 to H150. (B) The differences of the average
associated protons with the titratable sites of Chain B in L150 and
H150 as a function of pH, where H64(d) and H64(e) indicate the
d- and e-site of His-64, respectively.
Q. Huang et al.
298 PROTEINS
activation involves the formation of the HA2 coiled-coil
structure. However, supported by experimental observa-
tions15,17,18 and the present computational study, it is
likely that the HA2 coiled-coil structure that forms by
the loop-to-helix transition does not require low pH and
can take place spontaneously also at neutral pH. How-
ever, acidification may be required for the conforma-
tional changes of the HA ectodomain upstream of the
coiled-coil formation. Several studies employing chemical
cross-linking, antibody binding, proteolysis, electron mi-
croscopy, and site-specific mutation40–46 provided evi-
dence that sideward relocation of the distal HA1 globular
domains resembles an essential early step of the confor-
mational changes to a fusion-active state. In particular,
inhibition of fusion by inter-monomer disulfide bonds in
the distal domain of HA1 indicates that a sideward relo-
cation of the HA1 globular domains is a prerequisite for
adopting a fusion-active conformation.40,41 By employ-
ing cryo-microscopy and three dimensional image recon-
struction of the complete hemagglutinin of influenza virus
A/Japan/305/57 (H2), we observed a flattening of the top
of the distal HA1 subunits and formation of a continu-
ous central cavity through the whole trimer of the
fusion-competent conformation at acidic pH.42 This
reorganization of the HA1 subunits may allow the entry
of water and their interaction with the whole loop seg-
ments important for the coiled-coil formation (see Fig.
5). Recently, we have suggested that the sideward reloca-
tion of the HA1 globular domain is pH-dependent in
that an enhanced association of protons with the HA1
domain causes a repulsive electrostatic force between the
HA1 subunits.39
The water-driven mechanism may also explain the
observed pH irreversibility of the formation of the HA2
coiled-coil and its stability at physiological temperature.
As shown here the formation of the HA2 coiled-coil pro-
ceeds without significant pH-dependence and thus the
reversal of the coiled-coil formation cannot be achieved
by only altering pH. To achieve reversibility, the interac-
tion of water with respective protein domains that
mainly drive the loop-to-helix transition would need to
be diminished, which is not possible in aqueous solution.
However, because the protein–water interaction can be
altered by increasing temperature, increasing temperature
can cause a reversible thermal unfolding of the coiled-
coil and, in fact, such a thermal unfolding has been
observed in experiments with peptides harboring the
short and long a-helices as well as the loop region.15
The water-driven mechanism also rationalizes why the
ectodomain of HA2 subunits adopt the coiled-coil con-
formation upon expression in E. coli15,17,18 because
interaction of water with the HA2 residues is not
suppressed.
Loop-to-helix transition as an energysource for membrane fusion
In virus-cell membrane fusion, two separate mem-
branes (viral envelop and cellular membrane) merge and
thereby open the virus lumen to the cellular compart-
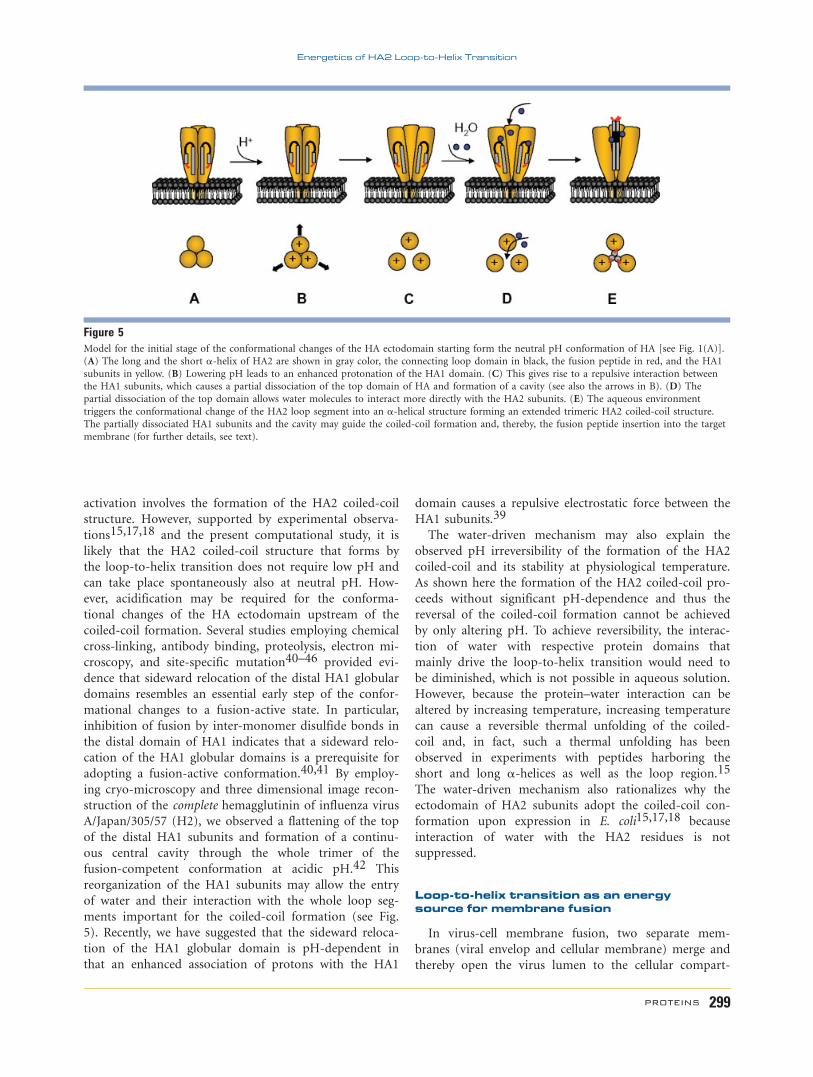
Figure 5Model for the initial stage of the conformational changes of the HA ectodomain starting form the neutral pH conformation of HA [see Fig. 1(A)].
(A) The long and the short a-helix of HA2 are shown in gray color, the connecting loop domain in black, the fusion peptide in red, and the HA1
subunits in yellow. (B) Lowering pH leads to an enhanced protonation of the HA1 domain. (C) This gives rise to a repulsive interaction betweenthe HA1 subunits, which causes a partial dissociation of the top domain of HA and formation of a cavity (see also the arrows in B). (D) The
partial dissociation of the top domain allows water molecules to interact more directly with the HA2 subunits. (E) The aqueous environment
triggers the conformational change of the HA2 loop segment into an a-helical structure forming an extended trimeric HA2 coiled-coil structure.
The partially dissociated HA1 subunits and the cavity may guide the coiled-coil formation and, thereby, the fusion peptide insertion into the target
membrane (for further details, see text).
Energetics of HA2 Loop-to-Helix Transition
PROTEINS 299

ment. Because two membranes cannot fuse spontane-
ously, energy must be supplied at the fusion site to dis-
rupt their bilayer structures and to form intermediate
lipid structures, such as the lipid stalk.47 The stalk is
characterized by contacts of the proximal lipid mono-
layers of two apposing membranes and can be described
as a hemifusion intermediate, which may evolve finally
to a fusion pore.48–50 It has been suggested as a tran-
sient structure determining the energy barrier of the
fusion reaction and, hence, limiting the fusion rate.
Recently, several theoretical studies have shown that the
free energy barrier of the stalk formation is in the order
of �40 kBT (i.e., 23.7 kcal�mol21).51–53
It is believed that fusion proteins such as HA provide
the energy to drive fusion via ‘‘spring-loaded" conforma-
tional changes.15,30 The energetic analysis in this study
supports such an idea. We have shown that the loop-to-
helix transition and thus the formation of the HA2
coiled-coil structure are associated with a release of
energy, which is in the order of that required for the
stalk formation (237.6). While we were completing this
work, a study has been published on calculating the elec-
trostatic energy of the loop-to-helix conformational
change of a trimer formed by HA2 peptides of residues
54–77. It was found that as pH decreases from 8 to 5 the
electrostatic free energy is lowered by �2 kcal�mol21.54
This value based on 24 amino-acid long HA2 peptides
seems to be not sufficient for the stalk formation. As the
authors already discussed, to accurately estimate the
energy of the conformational change, investigations on
longer or the whole HA2 polypeptides may be necessary
as done in the present study. Thus, although it is not yet
clear whether the membrane merger is driven by the
coiled-coil transition or downstream of this structural
transition (e.g., see Refs. 51 and 55), the present calcula-
tions imply that conformational changes of viral fusion
proteins like HA may account for energies typically
required to enable membrane fusion.
Besides influenza HA, the formation of a trimeric
coiled-coil structure has been shown to be typical for
other class I viral fusion proteins, including those of
Ebola,56,57 HIV,58–60 HRSV,61 HTLV,62 MoMLV,63
SIV,64,65 and SV5.66 We surmise that the formation of
the coiled-coil structures of those proteins is also driven
by the interactions between suitable protein sequences
and water molecules, and may release energy which could
be employed to drive subsequent steps of conformational
changes mediating membrane fusion or even membrane
fusion directly.
For the sake of simplicity, we have considered only the
HA2 fragments to analyze the energetics of the HA2
loop-to-helix transition. This makes sense, since the
investigated HA2 fragments contain the whole loop seg-
ments (a.a. 55–76) and have been shown to form a
coiled-coil motif, which resembles that of the full-length
HA2 subunits,13,14 i.e., the loop-to-helix transitions of
the fragments and of the full-length subunits are equiva-
lent. Besides, we neglected the interaction between the
HA1 and HA2 subunits based on two facts: (i) the HA2
loop-to-helix transition is a conformational change
downstream of the reorganization of the HA1 globular
domain; (ii) the free energy change of the HA2 loop-to-
helix transition depends only on the initial and final con-
formations of HA2 subunits, and thus the interaction
caused by the HA1 subunits does not affect this quantity.
Of course, since the reorganization of the HA1 domain is
a prerequisite of the HA2 loop-to-helix transition, inter-
actions between HA1 and HA2 subunits can influence
the overall net energy released by all HA conformational
changes in the process of membrane fusion. It is known
that both HA1 and HA2 subunits interact mainly via
salt-bridges, which stabilize the neutral pH conformation
as we have shown recently.67 The 3D structure of the
HA (X-31 strain, H3 subtype, PDB ID 1HGD) protein at
neutral pH is stabilized by a network of 15 pairwise or
more complex salt-bridges, which contribute about 60
kcal�mol21 to the free energy change in the fusion based
on the average value of �4 kcal�mol21 per salt-bridge.68
However, such an energy required for breaking the salt-
bridges at low pH becomes reduced due to enhanced
protonation.
MD simulations of proteins at low andhigh pHs
Because of the difficulty in the assignment of atomic
charges for the MD simulations based on the molecular-
mechanics force fields, L150 and H150 were first assumed
to be in the standard protonation state around neutral
pH. Thus, it was necessary to find out whether the
charge states used in the MD simulations have a signifi-
cant impact on the conformations of L150 or H150 at
low or high pH, e.g., at pH 4 or 10. To this end, we per-
formed four additional MD simulations for L150 and
H150 by assigning the protonations of the titratable resi-
dues according to their actual protonation states at pH 4
and 10, which have been determined in the calculations
of the protonation free energies. Because fractional pro-
tonation probabilities cannot be directly used in the MD
simulations with the CHARMM force field, a titratable
residue was considered as protonated only when its pro-
tonation probability is greater than 0.6 at the given pH
(4 or 10). In this way, for a protein (L150 or H150) two
simulation systems were constructed to mimic the charge
states of the protein at pH 4 and 10, respectively, using
the same initial all-atom structures for the MD simula-
tions based on the standard protonation state. Then, four
systems (two each for L150 and for H150, respectively)
were simulated with the same protocols described in Pos-
sible Role of Low pH for the Conformational Changes of
HA section of Methods except restraining all heavy atoms
by harmonic constraints. For each simulation, 100 snap-
Q. Huang et al.
300 PROTEINS

shot conformations were extracted from the MD trajecto-
ries of the production phase and compared with those
from the trajectories of the corresponding protein in the
standard protonation state. The root-mean-square devia-
tions (RMSDs) of the hydrogen atoms for the 100 snap-
shots were calculated with the initial structure as the ref-
erence. The average RMSDs over the snapshots for L150
at pH 4 and 10 are 0.91 � 0.02 and 0.92 � 0.02 A,
respectively; and those for H150 are 0.98 � 0.02 and
1.02 � 0.02 A, respectively. Since the average RMSDs for
L150 and H150 in the standard protonation state with
respect to the initial structures are 0.89 � 0.02 and 1.01
� 0.02 A, respectively, we conclude that the charge states
used in the MD simulations do not have a significant
impact on the conformations of L150 and H150 at low
or high pH.
CONCLUSIONS
To explain why the HA2 coiled-coil structure is stable
at both neutral and low pH, we have employed a compu-
tational approach based on the dielectric continuum sol-
vent model to evaluate the free energy change of the
HA2 loop-to-helix transition leading to the coiled-coil
structure. Our approach considered explicitly the contri-
butions of pH change and protein-water interaction to
the free energy of the transition. The results show that
the transition is caused mainly by the electrostatic inter-
action between the HA2 subunits and water, and does
not depend significantly on pH. In agreement with ex-
perimental observations, the results suggest that the
loop-to-helix transition occurs spontaneously at both
neutral and low pH, as long as the HA1 globular domain
covering the HA2 subunits is reorganized and thereby
allows water molecules to interact with the whole loop
segments of the HA2 subunits and to leave simultane-
ously enough space for the refolding of the HA2 chains.
Moreover, we have shown that the loop-to-helix transi-
tion is associated with a release of energy, which would
be sufficient to drive stalk formation, providing compu-
tational evidence that conformational changes of viral
fusion proteins like HA may account for the energy typi-
cally required to enable membrane fusion. It is likely that
the water-driven process resembles a general mechanism
for the formation of the highly conserved coiled-coil
motif of enveloped viruses. Finally, we would like to
point out that the computational approach presented in
this study is generally applicable to evaluate pH-depend-
ent energetics of conformational changes of proteins in
aqueous solution.
ACKNOWLEDGMENTS
The authors thank Drs. Donald Bashford and Bjorn
Rabenstein for their assistance in using the related pro-
grams, and Lingyan Jin for reading the manuscript and
making a number of helpful suggestions.
REFERENCES
1. Tamm LK, Crane J, Kiessling V. Membrane fusion: a structural per-
spective on the interplay of lipids and proteins. Curr Opin Struct
Biol 2003;13:453–466.
2. Harrison SC. Mechanism of membrane fusion by viral envelope
proteins. In: Roy P, editor. Advances in virus research, Vol. 64.
San Diego, CA, USA and London, UK. pp 231–261.
3. Wilson IA, Skehel JJ, Wiley DC. Structure of the haemagglutinin
membrane glycoprotein of influenza virus at 3-A resolution. Nature
1981;289:366–373.
4. Gamblin SJ, Haire LF, Russell RJ, Stevens DJ, Xiao B, Ha Y, Vasisht
N, Steinhauer DA, Daniels RS, Elliot A, Wiley DC, Skehel JJ. The
structure and receptor binding properties of the 1918 influenza
hemagglutinin. Science 2004;303:1838–1842.
5. Stevens J, Corper AL, Basler CF, Taubenberger JK, Palese P, Wilson
IA. Structure of the uncleaved human H1 hemagglutinin from the
extinct 1918 influenza virus. Science 2004;303:1866–1870.
6. Stevens J, Blixt O, Tumpey TM, Taubenberger JK, Paulson JC, Wil-
son IA. Structure and receptor specificity of the hemagglutinin
from an H5N1 influenza virus. Science 2006;312:404–410.
7. Ha Y, Stevens DJ, Skehel JJ, Wiley DC. H5 avian and H9 swine
influenza virus haemagglutinin structures, possible origin of influ-
enza subtypes. EMBO J 2005;21:865–875.
8. Russell RJ, Gamblin SJ, Haire LF, Stevens DJ, Xia B, Ha Y, Skehel JJ.
H1 and H7 influenza haemagglutinin structures extend a structural
classification of haemagglutinin subtypes. Virology 2004;235:287–
296.
9. Maeda T, Ohnishi S. Activation of influenza virus by acidic media
causes hemolysis and fusion of erythrocytes. FEBS Lett 1980;
122:283–287.
10. Huang RTC, Rott R, Klenk H-D. Influenza virus cause hemolysis
and fusion of cells. Virology 1981;110:243–247.
11. White J, Martin K, Helenius A. Cell fusion by Semliki forest, influ-
enza and vesicular stomatitis viruses. J Cell Biol 1982;89:674–675.
12. Wiley DC, Skehel JJ. The structure and function of the hemaggluti-
nin membrane glyprotein of influenza virus. Annu Rev Biochem
1987;56:365–395.
13. Bullough PA, Hughson FM, Skehel JJ, Wiley DC. Structure of influ-
enza haemagglutinin at the pH of membrane fusion. Nature
1994;371:37–43.
14. Chen J, Skehel JJ, Wiley DC. N- and C-terminal residues combine
in the fusion-pH influenza hemagglutinin HA2 subunit to form an
N cap that terminates the triple-stranded coiled-coil. Proc Natl
Acad Sci USA 1999;96:8967–8972.
15. Carr CM, Kim PS. A spring-loaded mechanism for the conforma-
tional change of influenza hemagglutinin. Cell 1993;73:823–832.
16. Skehel JJ, Wiley DC. Coiled-coils in both intracellular vesicle and
viral membrane fusion. Cell 1998;95:871–874.
17. Chen J, Wharton SA, Weissenhorn W, Calder LJ, Hughson FM, Ske-
hel JJ, Wiley DC. A soluble domain of the membrane-anchoring
chain of influenza virus hemagglutinin (HA2) folds in Escherichia
coli into the low-pH-induced conformation. Proc Natl Acad Sci
USA 1995;92:12205–12209.
18. Kim C-H, Macosko JC, Yu YG, Shin Y-K. On the dynamics and
conformation of the HA2 domain of the influenza virus hemagglu-
tinin. Biochemistry 1996;35:5339–5365.
19. Madhusoodanan M, Lazaridis T. Investigation of pathways for the
low-pH conformational transition in influenza hemagglutinin. Bio-
phys J 2003;84:1926–1939.
20. Roux B, Simonson T. Implicit solvent models. Biophys Chem
1999;78:1–20.
Energetics of HA2 Loop-to-Helix Transition
PROTEINS 301

21. Sitkoff D, Sharp KA, Honig B. Accurate calculation of hydration
free energies using macroscopic solvent models. J Phys Chem 1994;
98:1978–1988.
22. Bashford D, Gerwert K. Electrostatic calculations of the pKa values
of ionizable groups in bacteriorhodopsin. J Mol Biol 1992;224:473–
486.
23. Ullmann GM, Knapp EW. Electrostatic models for computing pro-
tonation and redox equilibria in proteins. Eur Biophys J 1999;
28:533–551.
24. Kollman PA, Massova I, Reyes C, Kuhn B, Huo S, Chong L, Lee M,
Lee T, Duan Y, Wang W, Donini O, Cieplak P, Srinivasan J, Case
DA, Cheatham TE. Calculating structures and free energies of com-
plex molecules: combining molecular mechanics and continuum
models. Acc Chem Res 2000;33:889–897.
25. Bashford D, Karplus M. Multi-site titration curves of proteins: an
analysis of exact and approximate methods for their calculation.
J Chem Phys 1991;95:9556–9561.
26. Beroza P, Fredkin DR, Okamura MY, Feher G. Protonation of inter-
acting residues in a protein by a Monte Carlo method: application
to lysozyme and the photosynthetic reaction center. Proc Natl Acad
Sci USA 1991;88:5804–5808.
27. Kale L, Skeel R, Bhandarkar M, Brunner R, Gursoy A, Krawetz N,
Phillips J, Shinozaki A, Varadarajan K, Schulten K. NAMD2: greater
scalability for parallel molecular dynamics. J Comp Phys 1999;
151:283–312.
28. MacKerell ADJ, Bashford D, Bellot M, Dunbrack RLJ, Evanseck JD,
Field MJ, Fischer S, Gao J, Guo H, Ha S, Joseph-McCarthy D,
Kuchnir L, Kuczera K, Lau FTK, Mattos C, Michnick S, Ngo T,
Nguyen DT, Prodholm B, Reiher WEI, Roux B, Schlenkrich M,
Smith JC, Stote R, Straub J, Watanabe M, Wiorkiewicz-Kuczera J,
Yin D, Karplus M. All-atom empirical potential for molecular mod-
eling and dynamics studies of proteins. J Phys Chem 1998;102:
3586–3616.
29. Jorgensen WL, Chandrasekhar J, Madura JD, Impey RW, Klein ML.
Comparison of simple potential functions for simulating liquid
water. J Chem Phys 1983;79:926–935.
30. Carr CM, Chaudhry C, Kim PS. Influenza hemagglutinin is spring-
loaded by a metastable native conformation. Proc Natl Acad Sci
USA 1997;94:14306–14313.
31. Ryckaert JP, Ciccitti G, Berendsen HJC. Numerical integration of
the cartesian equations of motion of a system with constrains: mo-
lecular dynamics of n-alkanes. J Chem Phys 1977;23:327–341.
32. Essmann U, Perera L, Berkowitz ML, Darden T, Lee H, Pedersen
LG. A smooth particle mesh Ewald method. J Chem Phys 1995;
103:8577–8593.
33. Sanner MF, Olson AJ, Spehner J-C. Reduced surface: an efficient
way to compute molecule surface. Biopolymer 1996;38:305–320.
34. Massova I, Kollman PA. Computational alanine scanning to probe
protein–protein interactions: a novel approach to evaluate binding
free energies. J Am Chem Soc 1999;121:8134–8143.
35. Bashford D. An object-oriented programming suite for electrostatic
effects in biological molecules. In: Ishikawa Y, Oldehoeft RR, Rey-
nders JVW, Tholburn M, editors. Scientific computing in object-
oriented parallel environments, Vol. 1343, Lectures notes in com-
puter science, ISCOPE97. Berlin: Springer; 1997. pp 233–240.
36. Rabenstein B, Knapp EW. Calculated pH-dependent population of
CO-myoglobin conformers. Biophys J 2001;80:1141–1150.
37. Teeter MM, Case DA. Harmonic and quasiharmonic descriptions of
crambin. J Phys Chem 1990;94:8091–8097.
38. Gohlke H, Case D. Converging free energy estimates: MM-
PB(GB)SA studies on the protein–protein complex Ras-Raf. J Com-
put Chem 2004;25:238–250.
39. Huang Q, Opitz R, Knapp EW, Herrmann A. Protonation and sta-
bility of the globular domain of influenza virus hemagglutinin. Bio-
phys J 2002;82:1050–1058.
40. Godley L, Pfeifer J, Steinhauer D, Ely B, Shaw G, Kaufmann R,
Suchanek E, Pabo C, Skehel JJ, Wiley DC, Wharton S. Introduction
of intersubunit disulfide bonds in the membrane-distal region of
the influenza hemagglutinin abolished membrane fusion activity.
Cell 1992;68:635–645.
41. Kemble GW, Bodian DL, Rose J, Wilson IA, White JM. Intermono-
mer disulfide bonds impair the fusion activity of influenza virus he-
magglutinin. J Virol 1992;66:4940–4950.
42. Boettcher C, Ludwig K, Herrmann A, van Heel M, Stark K.
Structure of influenza haemagglutinin at neutral and at
fusogenic pH by electron cryo-microscopy. FEBS Lett 1999;463:255–
259.
43. Doms RW, Helenius A, White J. Membrane fusion activity of influ-
enza virus hemagglutinin. J Biol Chem 1985;260:2973–2981.
44. Ruigrok RWH, Wrigley NG, Calder LJ, Cusack S, Wharton SA,
Brown EB, Skehel JJ. Electron microscopy of the low pH structure
of influenza virus hemagglutinin. EMBO J 1986;5:41–49.
45. Ruigrok RWH, Aitken A, Calder LJ, Martin SR, Skehel JJ, Wharton
SA, Weis W, Wiley DC. Studies on the structure of influenza virus
hemagglutinin at the pH of membrane fusion. J Gen Virol 1988;
69:2785–2795.
46. White JM, Wilson IA. Anti-peptide antibodies detect steps in a pro-
tein conformational change: low pH activation of the influenza vi-
rus hemagglutinin. J Cell Biol 1987;105:2887–2896.
47. Yang L, Huang HW. Observation of a membrane fusion intermedi-
ate structure. Science 2002;297:1877–1879.
48. Kozlov MM, Markin VS. Possible mechanism of membrane fusion.
Biofizika 1983;28:255–261.
49. Markin VS, Kozlov MM, Borovjagin VL. On the theory of mem-
brane fusion. The stalk mechanism. Gen Physiol Biophys 1984;3:
361–377.
50. Chernomordik LV, Kozlov MM. Membrane hemifusion: crossing a
chasm in two leaps. Cell 2005;123:375–382.
51. Chernomordik LV, Kozlov MM. Protein–lipid interplay in fusion
and fission of biological membranes. Annu Rev Biochem
2003;72:175–207.
52. Kozlovsky Y, Efrat A, Siegel DA, Kozlov MM. Stalk phase forma-
tion: effects of dehydration and saddle splay modulus. Biophys J
2004;87:2508–2521.
53. Kozlovsky Y, Kozlov MM. Stalk model of membrane fusion: solu-
tion of energy crisis. Biophys J 2002;82:882–895.
54. Choi HS, Huh J, Jo WH. Electrostatic energy calculation on the
pH-induced conformational change of influenza virus hemaggluti-
nin. Biophys J 2006;91:55–60.
55. Earp LJ, Delos SE, Park HE, White JM. The many mechanisms of
viral membrane fusion proteins. Curr Top Microbiol Immunol
2005;285:25–66.
56. Weissenhorn W, Carfi A, Lee KH, Skehel JJ, Wiley DC. Crystal
structure of the Ebola virus membrane fusion subunit. GP2,
from the envelope glycoprotein ectodomain. Mol Cell 1997;2:605–
616.
57. Malashkevich VN, Schneider BJ, McNally ML, Milhollen MA, Pang
JX, Kim PS. Core structure of the envelope glycoprotein GP2 from
Ebola virus at 1.9 A resolution. Proc Natl Acad Sci USA 1999;
96:2662–2667.
58. Weissenhorn W, Dessen A, Harrison SC, Skehel JJ, Wiley DC.
Atomic structure of the ectodomain from HIV-1 gp41. Nature
1997;387:426–430.
59. Chan DC, Fass D, Berger JM, Kim PS. Core structure of gp41 from
the HIV envelope glycoprotein. Cell 1997;89:263–273.
60. Tan K, Liu J, Wang J, Shen S, Lu M. Atomic structure of a thermo-
stable subdomain of HIV-1 gp41. Proc Natl Acad Sci USA 1997;
94:12303–12308.
61. Zhao X, Singh M, Malashkevich VN, Kim PS. Structural characteri-
zation of the human respiratory syncytial virus fusion protein core.
Proc Natl Acad Sci USA 2000;97:14172–14177.
62. Kobe B, Center RJ, Kemp BE, Poumbourios P. Crystal structure of
human T cell leukemia virus type 1 gp21 ectodomain crystallized as
a maltose-binding protein chimera reveals structural evolution of
Q. Huang et al.
302 PROTEINS

retroviral transmembrane proteins. Proc Natl Acad Sci USA 1996;
96:4319–4324.
63. Fass D, Harrison SC, Kim PS. Retrovirus envelope domain at 1.7
Angstrom resolution. Nat Struct Biol 1996;3:465–469.
64. Caffrey M, Cai M, Kaufman J, Stahl SJ, Wingfield PT, Covell DG,
Gronenborn AM, Clore GM. Three-dimensional solution structure
of the 44 kDa ectodomain of SIV gp41. EMBO J 1998;17:4572–
4584.
65. Malashkevich VN, Chan DC, Chutkowski CT, Kim PS.
Crystal structure of the simian immunodeficiency virus (SIV) gp41
core: conserved helical interactions underlie the broad inhibitory
activity of gp41 peptides. Proc Natl Acad Sci USA 1998;95:9134–
9139.
66. Baker KA, Dutch RE, Lamb RA, Jardetzky TS. Structural basis for
paramyxovirus-mediated membrane fusion. Mol Cell 1999;3:309–
319.
67. Rachakonda PS, Veit M, Korte T, Ludwig K, Bottcher C, Huang Q,
Schmidt MFG, Herrmann A. The relevance of salt bridges for the
stability of the influenza virus hemagglutinin. FASEB J 2007;21:
995–1002.
68. Kumar S, Nussinov R. Salt bridge stability in monomeric proteins.
J Mol Biol 1999;293:1241–1255.
Energetics of HA2 Loop-to-Helix Transition
PROTEINS 303