endline study of improving access to wash for levi’s rmg
TRANSCRIPT

Endline Study of Improving Access to WASH for Levi’s RMG Workers in Bangladesh Project
Prepared by
Golam Mahiyuddin Faisal Mohammad Ahamed
Aminur Rahman2 Mahmudul Hasan Mamun3
Road # 8, House #5, Mohammadia Housing Society, Mohammadpur, Dhaka –1207
Phone: (+88 02) 58150381, 58157621, 58101704 Cell phone: (+88 02) 01700743020, Fax: (+88 02) 58157620
E-mail: [email protected]; Website: www.hdrc-bd.com
March 25, 2019

Endline Study of Improving Access to WASH for Levi’s RMG Workers in Bangladesh Project
Prepared for
Prepared by
Golam Mahiyuddin1 Faisal Mohammad Ahamed2
Aminur Rahman2 Mahmudul Hasan Mamun3
Road # 8, House #5, Mohammadia Housing Society, Mohammadpur, Dhaka –1207
Phone: (+88 02) 58150381, 58157621, 58101704 Cell phone: (+88 02) 01700743020, Fax: (+88 02) 58157620
E-mail: [email protected]; Website: www.hdrc-bd.com
Dhaka: March 25, 2019
________________________________________________________
1 Study Team Leader and Senior Consultant, Human Development Research Centre (HDRC), 2 Consultant, Human Development Research Centre (HDRC) 3 Senior Research Associate, Human Development Research Centre (HDRC)

Abbreviations CIPL Cosmopolitan Industries PVT Ltd. EPB Export Promotion Bureau FGD Focus Group Discussions HH Household HDRC Human Development Research Centre ICDDR,B International Centre for Diarrhoeal Disease Research, Bangladesh JMP Joint Monitoring Programme KII Key Informant Interviews MHM Menstrual Hygiene Management PSM Propensity score matching RMG Readymade Garments (RMG) SDG Sustainable Development Goal TVC Television Channel USD US Dollar WASH Water Sanitation and Hygiene

CONTENTS Abbreviations Executive Summary ........................................................................................................................... i-iii Chapter 1: Introduction and Methodology ............................................................................................. 1 1.1 Introduction ............................................................................................................................... 1 1.2 Objectives of the Assignment ......................................................................................................... 1 1.3 Methodology ............................................................................................................................... 1
1.3.1 Impact Assessment Method (Quantitative Assessments) .................................................. 2 1.3.2 Quantitative Survey Design ................................................................................................ 3
1.4 Data Analysis ............................................................................................................................... 3 1.5 Study Limitations ............................................................................................................................ 3 Chapter 2: Study Findings ......................................................................................................................... 4 2.1 Respondents Characteristics/Background of Information ............................................................... 4
2.1.1 Household Composition ..................................................................................................... 4 2.1.2 Respondents Background Characteristics .......................................................................... 4 2.1.3 Housing Characteristics ...................................................................................................... 6
2.2 Access to Water ............................................................................................................................... 7 2.2.1 Access to Water at Household level ................................................................................... 7 2.2.2 Access to Water at Work place ....................................................................................... 10
2.3 Access to Sanitation ...................................................................................................................... 11 2.3.1 Access to Sanitation at Household level ........................................................................... 11 2.3.2 Access to Sanitation at Factory Level .............................................................................. 14 2.3.3 Hygiene facilities in the latrines ....................................................................................... 15
2.4 Access to Handwashing ................................................................................................................. 15 2.4.1 Handwashing Situation at Household level ...................................................................... 15 2.4.2 Handwashing Situation at Factories ................................................................................. 17
2.5 Menstrual Hygiene Management (MHM) ..................................................................................... 18 2.5.1 Menstrual Hygiene Management at Household ............................................................... 18 2.5.2 Menstrual Hygiene Management at Factory .................................................................... 20
2.6 Solid Waste Management .............................................................................................................. 21 2.7 Participation in Promotional Activities of WaterAid .................................................................... 21
2.7.1 Exposure to WASH Advertisement .................................................................................. 21 2.7.2 Participation in WaterAid Evening Sessions .................................................................... 22 2.7.3 Contribution of Peer Educators ........................................................................................ 22
2.8 WASH in Schools .......................................................................................................................... 23 Chapter 3: Impact Assessment ................................................................................................................ 25 3.1 Impact assessment Framework ...................................................................................................... 25 3.2 The Impact Indicators .................................................................................................................... 25 3.3 Overall Impact of the Project activities ......................................................................................... 26 3.4 Impact Assessment ........................................................................................................................ 30 3.5 Effect Size of Envisioned Impact .................................................................................................. 32 3.6 End Remarks ............................................................................................................................ 35
List of Figure Figure 1.1: Overall research approach and methodology of the survey ................................................... 2 Figure 2.1: Marital Status of the respondents ......................................................................................... 5 Figure 2.2: Structure of living houses of the respondents ........................................................................ 6 Figure 2.3: Availability of Mobile phone and smart phone ..................................................................... 7 Figure 2.4: Distribution of households by source of drinking water sources (in %) ............................... 8 Figure 2.5: Distribution of households by access to SDG service level of water sources (in %) ............ 8 Figure 2.6: Distribution of households by physical quality of drinking water (in %) ............................. 9 Figure 2.7: Distribution garment worker by access to sanitation facilities (in %) ................................. 11 Figure 2.8: Access to improved facilities by updated JMP Sanitation ladder (in %) ............................. 11 Figure 2.9: Distribution of the latrines by usability (in %) .................................................................... 13 Figure 2.10: Distribution of the latrine by location (in %) ....................................................................... 14 Figure 2.11: Handwashing Facility .......................................................................................................... 16 Figure 2.12: Handwashing management within latrines and availability of soap and water at handwashing places ......................................................................................................... 17 Figure 2.13: Duration of changing MHM materials ................................................................................. 19 Figure 2.14: Use of MHM Materials among the Factory Workers .......................................................... 20 Figure 2.15: Availability of Specific Place for MHM disposal................................................................ 21 Figure 2.16: Percentage of Levis workers watched WASH advertisement in last one month (in %) ...... 22 Figure 2.17: Percentage of Levis workers watched WASH advertisement in last one week (in %) ....... 22 Figure 2.18: Distribution of Levis workers by exposure of WASH advertisement TV Channel in last one moth (in %) ......................................................................................................... 22 Figure 2.19: Distribution of Levis workers by exposure of WASH advertisement TV Channel in last one week (in %) ........................................................................................................ 22 Figure 2.20: Distribution of respondents by learning topics from peer educators (in %) ........................ 23 Figure 3.1: Framework for impact assessment ...................................................................................... 25 Figure 3.2: Messages learned from evening sessions by target workers (intervention) ......................... 26 Figure 3.3: Differences in disease episodes at households and sick days between intervention and control .......................................................................................................................... 26 List of Table Table 2.1: Demographic indicators for surveyed household ................................................................. 4 Table 2.2: Age distribution of the surveyed respondents ........................................................................ 4 Table 2.3: Literacy/education status of the surveyed respondents ......................................................... 5 Table 2.4: Living status of respondents by sex ....................................................................................... 6 Table 2.5: Assets ownership of the Households Level ........................................................................... 7 Table 2.6: Percentage distribution of water source by functionality and availability of water ............... 8 Table 2.7: Distribution of household by water safety plan (in %) .......................................................... 9 Table 2.8: Status of the adjacent area, platform and drainage system of the water tap (in %) ............. 10 Table 2.9: Distribution of drinking water sources in the intervention garments factory by types ........ 10 Table 2.10: Percentage distribution of the respondents by status sharing latrine ................................... 12 Table 2.11: Percentage distribution of the latrines by ownership ........................................................... 12 Table 2.12: Percentage distribution latrines by distance from household and availability water ........... 13 Table 2.13: Distribution of latrines by status of cleanliness and usability .............................................. 13 Table 2.14: Percentage distribution of faecal matter by place of disposal .............................................. 14 Table 2.15: Cleaning Status of the latrines ............................................................................................ 15 Table 2.16: Percentage distribution of garment factories by availability of hygienic facilities within the latrines. ............................................................................................................... 15 Table 2.17: Availability of separate Handwashing places, within the latrines and outside the latrines ............................................................................................................................ 16 Table 2.18: Availability of handwashing agents ..................................................................................... 16 Table 2.19: Knowledge of Handwashing at critical times ...................................................................... 17 Table 2.20: Handwashing Practice at Proper time of necessary Occasions ............................................ 17 Table 2.21: Hygiene Practices at time of using Latrines ........................................................................ 18

HDRC Endline Study of Improving Access to WASH for Levi’s RMG Workers in Bangladesh Project
ii
Table 2.22: Proportion of use of MHM Materials at household level .................................................... 18 Table 2.23: Cleaning and drying of the Reusable MHM materials ........................................................ 19 Table 2.24: Disposal of MHM Materials ................................................................................................ 19 Table 2.25: MHM Facility at RMG factory latrines ............................................................................... 20 Table 2.26: Steps taken in case of need to change the used MHM materials at factories ...................... 20 Table 2.27: Places for HH waste disposal............................................................................................... 21 Table 2.28: Overall status of the safe water in terms of availability, functionality and types of water sources ................................................................................................................... 23 Table 2.29: Status of toilets and availability of single sex based toilets at schools ................................ 24 Table 3.1: Summary of Indicators ....................................................................................................... 28 Table 3.2: Notation of dependent and explanatory variables used in the regression model ................. 30 Table 3.3: Regression coefficients of expenditure on health ................................................................ 31 Table 3.4: Regression coefficients of payment received for overtime .................................................. 31 Table 3.5: Regression coefficients of day off for self-illness ............................................................... 31 Table 3.6: Regression coefficients of number of disease incidence in household ................................ 32 Table 3.7: Notation of the dependent and explanatory variables used in the regression model ........... 32 Table 3.8: Notation of the dependent and explanatory variables used in the regression model ........... 34 Table 3.9: Results of fitting logistic model to find out the effect size of WASH intervention on different outcome level indicators .................................................................................. 35 Annex: Data Tables ....................................................................................................................... 36-53

Executive Summary
Background: The ready-made garments (RMG) makes a significant contribution to the national economy. Most workers reside in and around Dhaka in urban and peri-urban slums or ‘worker colonies’ with lack reliable access to clean water, proper sanitation facilities, and drainage systems, leading to the rapid spread of water-borne illness. WaterAid Bangladesh provided technical and financial support to Sajeda Foundation to implement a project titled “Improving Access to WASH for RMG Workers in Bangladesh” in three garments including their families living in the three union at Savar upazila of Dhaka district for increasing the access to WASH services for a period of three-year from April 2016 to March 2019. The present assignment is an endline study of improving access to WASH for Levis’s RMG workers in Bangladesh project. Objectives: The broad objective of the end line study is mainly to understand the outcome level changes against project specific result indicators. The specific objectives were (i) to assess changes in WASH accessibility of the workers both at community and factory level. (ii) to explain with evidence the changes visible towards integration of WASH in health and education and (iii) to assess improvements in hygiene knowledge and practices among the workers. Methodology: The study adopted a mixed method approach where data was primarily collected through survey on garment workers in intervention as well as control group. Qualitative techniques included Focus Group Discussion (FGD) and Key Informant Interview (KII). Moreover, structured observations (water point, toilets, and hand washing facilities) were made at factories and random households. Hand washing behavior at factories during lunch break were also observed. Water quality testing was performed at factories and random households. The sample size of households for quantitative survey was determined applying multi-indicator approach. Baseline survey report was used to collect baseline value of different indicators to determine the sample size using a probabilistic approach. The sample size of households for intervention and control was equal. The survey covered 370 intervention and 370 control household. The sample households were proportionally distributed across target unions and selected randomly. Qualitative information was collected through 8 focus group discussions and 10 key informant interviews. Propensity score matching was performed using selected socio-economic indicators to ensure comparability. Apart from basic descriptive statistics, hypothesis testing (z-test and t-test) was conducted for comparative analysis. Regression analysis with principal component analysis was performed to assess impact of project activities. For impact assessment an iterative process was applied. Content analysis was accomplished using qualitative information to ensure validity of impact assessments. The quantitative data and qualitative information was analyzed separately and their findings were synthesized. Access to water: The source of drinking water both in intervention and control areas was submersible pump piped directly to their rooms/houses where 87 percent of the households in intervention and 97.6 percent in control areas had overhead water tank ensuring the readily reach and use of water when needed. Most of the drinking water sources in intervention (79%) and control (99.7%) areas were owned by the house owner. In case of service level water sources, most of the improved water sources in intervention (65.8%) and control (85%) areas were at basic service level. Almost all (99.7% in intervention; 99.4% in control) water sources in both intervention and control areas were found functional. All intervention garments had improved sources of drinking water and it was managed safely. Irrespective of intervention and control garments, main source of drinking water was supply water (56.1% in intervention; 74% in control), followed by filtered water (43% in intervention; 25.1% in control). In intervention garments, it is also observed that water taps for drinking water were
HDRC Endline Study of Improving Access to WASH for Levi’s RMG Workers in Bangladesh Project
ii
available in each floor and the water taps were wall mounted and marked as “pure drinking water”. In addition, each and every garment workers in intervention areas have the facility to collect water in their water bottle from the tap and supplied water was purified by using ultra violate ray emitting machine in each intervention garments. Access to Sanitation: The sanitation facilities used by the garment workers living in intervention (76.6%) and control (84.4%) were mostly classified as having a limited services i.e., shared with other households. However, use of sanitation facilities classified as having a basic sanitation service by the garment workers in intervention were nearly 3 times higher than that were used by the garment workers living in control areas (17% vs. 6.2%) and difference is highly significant statistically. Use of unimproved sanitation facilities among the garment workers in the control (9.4%) were also fairly higher than in intervention area (6.4%). All the intervention RMG factories have single sex based latrine facility. Two-third workers (66.7%) of intervention factories have reported that cleaning condition of their latrines are good while 56 percent of control factories have reported something like this. In addition, as high as 77 percent workers of intervention factories which is more than double of control factory workers (33%), have confessed that there are available soap within the toilets. Access to hand washing facility at household and factory level: As categorized by SDG ladder, basic service level for hand washing at the household level included 36.7 percent of the intervention areas which was nearly four times higher than the control group (8.3%). Secondly, limited service level of SDG ladder includes 30.9 percent intervention households which was slightly higher than the control group (28.3%). Lastly, 63.4 percent control households, doubly higher than the intervention households (32.4%), had no facility for hand washing. Most of the intervention garment workers (99.7%) reported that separate hand washing places with soap and water were available within the factories. On the other hand, 97 percent of control garment workers mentioned that hand washing places were available within the factories; of them 86.7 percent ensured the availability of soap or liquid soap at hand washing places. Menstrual Hygiene Management at household and factory level: According to the study findings, at the household level most of the women within intervention (70.6%) and control areas (81.8%) used reusable cloth for MHM. On the other hand, 30.7 percent of the intervention household women were habituated with practicing the disposable sanitary napkin as compared to 20.1 percent of control group.
Among our intervention factories, more than one-third of the female workers (34.8%) use sanitary napkin which is significantly higher than the control group (19.2%). On the other hand, the mostly used MHM material is reusable cloth with 66.4 percent in control which is higher than intervention (57.6%). Additionally, it is to note that, 13.9 percent of control factories which is doubly higher than intervention (6.7%) use garment leftovers known as “jhoot” as MHM materials. Solid Waste Management at household and factory level: Most of the households of intervention (96.7%) and control areas (92.6%) disposed the household waste in the dustbin or public trash. According to findings in intervention garments, many drums and dustbins were placed for waste disposal. Furthermore, big or medium plastic bins were also available on every floor of the factories. Key summary findings of the study are summarized in the table below:

HDRC Endline Study of Improving Access to WASH for Levi’s RMG Workers in Bangladesh Project
iii
Indicators Intervention Control
% of household use improved water source for drinking 100 100% of water sources at household were found functional 99.7 99.4% of household with Safely Managed drinking water service 34.2 15.0% of household with Basic drinking water service 65.8 85.0% of RMG factories using supply water as main source of drinking water
56.1 74.0
% of RMG factories using filter water as main source of drinking water
43.0 25.1
% of RMG factories using Tubewell as main source of drinking water
0.9 0.3
% household with Basic sanitation service 17.0 6.2% household with Limited sanitation service 76.6 84.4% household with Unimproved sanitation service 6.4 9.4% of RMG factories had female toilets available 99.4 97.9% of RMG factories had soap arrangement in toilet 77.0 33.0% of RMG factories’ latrine were in good cleaning condition 92.5 60.7% of household had basic hygiene facility 36.7 8.3% of household had limited hygiene facility 30.9 28.3% of household had no hygiene facility 32.4 63.4% of RMG factories had separate hand washing place with soap and water
99.7 84.09
% of adolescents (10-19) at reproductive age use disposable sanitary napkin 46.8 36.7
% of women at reproductive age use sanitary napkin 28.2 17.0
% of female workers use sanitary napkin 34.8 19.2
% of households disposed the household waste in the dustbin or public trash 96.7 92.6
Chapter 1 Introduction and Methodology
1.1 Introduction The ready-made garments (RMG) makes a significant contribution to the national economy. It has the largest contribution in export earnings. According to recent data by Export Promotion Bureau (EPB), Bangladesh’s export earnings from the RMG sector stood at USD 30.61 billion (83.5% of total export earnings), with 8.76% growth in the fiscal year 2017-181. The garment industry employs more than 4 million workers in 4,500 factories mostly concentrated around the capital. Most workers reside in and around Dhaka in urban and peri-urban slums or ‘worker colonies’ with lack reliable access to clean water, proper sanitation facilities, and drainage systems, leading to the rapid spread of water-borne illness. WaterAid Bangladesh provided technical and financial support to Sajeda Foundation to implement a project titled “Improving Access to WASH for RMG Workers in Bangladesh”. Improving Access to WASH for Levi’s RMG Workers in Bangladesh Project was undertaken as means of increasing adequate and safe water supplies, sanitation facilities and hygiene management as well as awareness to the workers of three garments including their families living in the three union at Savar upazila of Dhaka district. This was a three-year project that initiated in April 2016 and closed in March 2019. A total of 12,000 garment factory workers (around 4,000 workers from the three targeted factories and 8,000 workers from other factories) and their families (around 21,000 people) living in the three union at Savar upazila were reached. The RMG workers and their families were reached with water, sanitation and hygiene services at community level and with hygiene messages particularly on Menstrual Hygiene Management and handwashing in the factories. 1.2 Objectives of the Assignment Broader objective: The broad objective of the end line study is mainly to understand the outcome level changes against project specific result indicators. Specific objectives: Specific objectives of the endline study are as follows:
To assess changes in WASH accessibility of the workers both at community and factory level.
To explain with evidence the changes visible towards integration of WASH in health and education.
To assess improvements in hygiene knowledge and practices among the workers. 1.3 Methodology
The study design was a combination of quantitative and qualitative techniques. Data was primarily collected through garment worker’s survey (intervention and control group2) for quantitative survey. Qualitative techniques included Focus Group Discussions (FGD) and Key Informant Interviews (KII). Besides, structured observations (water point, toilets, and handwasing facilities) took place at factories and random households. Observations regarding handwashing behavior
1 Source: http://www.bgmea.com.bd/home/pages/tradeinformation 2 Intervention Group = Workers working in Levi’s Garments who live in target area Control Group = Workers not working in Levi’s Garments who do not live in target area but in close proximity

HDRC Endline Study of Improving Access to WASH for Levi’s RMG Workers in Bangladesh Project
2
took place at factories during the lunch break. Water quality testing was performed in Factories, Water points installed by Project, and Households.
Figure 1.1: Overall research approach and methodology of the survey
1.3.1 Impact Assessment Method (Quantitative Assessments) Simply examining changes in outcomes before and after the implementation of the project was not a particularly credible approach as ‘before-and-after’ differences may be due to other reasons and may not be assigned entirely to the project. This impact assessment attempted to address this attribution challenge by comparing project beneficiaries with non-beneficiaries. Such comparisons to be valid, on average, the group of project beneficiaries and non-beneficiaries (the counterfactual) was matched based on selected observable criterion (household dwelling status, demographics, household asset, communication, availability of drainage facility, occupation etc.) applying propensity score matching (PSM). Also the selection of control areas was made on the basis of similarity of service availability (road, pavement, distance from highway, drainage facility, garbage disposal etc.) after physical observation of those areas by the team member accompanied by concerned personnel of WaterAid. Besides, field level facilitators of WaterAid provided necessary support by sharing necessary information of locality. However, this assignment faced a challenge. Credible baseline estimate was not available for the impact assessment. Hence, this assignment assumed that the observable factors in control was similar to intervention during baseline and adopted a cross sectional approach with the limitation that this approach is more susceptible to
Endline Study of Improving Access to WASH for Levi’s RMG Workers in Bangladesh project
Quantitative Methods Qualitative Methods
Structured questionnaire survey: Intervention as well control
households
1. Key Informant Interviews 2. Focus Group Discussion
Field Data/Information Collection
Draft Report
Feedback from WaterAid
Data Analysis and Triangulation
Literature review, Project
Documents and reports
HDRC
WaterAid
Final Report
Presentation of draft report
1. Factory 2. Handwahing behavior
Mixed Methods (observation)
Water Quality Testing (Factory, Water points installed by Project,
Household)
Baseline Endline
TX1
TC1
Impa
ct
Figure: Proposed Impact evaluation method

HDRC Endline Study of Improving Access to WASH for Levi’s RMG Workers in Bangladesh Project
3
selection bias as compared to a panel data approach and observable as well as time-invariant unobservable traits that may influence the outcomes in a natural manner cannot be identified. Change/Impact= (TX1-TC1) where,
TX1= status of intervention unit in endline TC1= status of control unit in endline
Control area was identified in consultation with WaterAid Bangladesh keeping in mind above mentioned observational factors. Structured observation formats were prepared to observe the handwashing behavior of factory workers. This technique was administered during lunch hours at factories focusing on random workers. 1.3.2 Quantitative Survey Design The key purpose of the endline survey was to understand the impact against project specific result indicators. Multi-stage sampling strategy were used to collect data. The sample was determined using standard statistical formula, assuming 95% confidence interval and 5% level of precision, and adjusted with 1.2 for design effect and probable non-response. The sampling strategy applied data for 3 selected indicators: 1) soap and water facility within 10 steps of latrine, 2) washing both hands with soap after defecation, and 3) sandal usage while using toilet. The estimated sample size was 370 for both intervention and control area. Hence, 30 garment workers from 13 clusters in each area were interviewed. However, to ensure homogeneity between the intervention and control households, finally 330 households from intervention and 339 from control area were considered for analysis.
On the other hand, structured observation has been approached at the 3 intervention factories, 12 intervention schools and households of both treatment and control areas for assessing the existing status of WASH like water points, latrines, and handwashing facilities. Water quality testing was also adopted for detection of arsenic and bacteria level at the water points of intervention factories and schools including household levels.
Lastly, as a part of qualitative survey, 8 Focus Group Discussions (4 with men and 4 with women group) and 10 Key Informant Interviews were also conducted at time of this study survey. 1.4 Data Analysis Propensity score matching was performed using selected socio-economic indicators to ensure comparability. Apart from basic descriptive statistics, hypothesis testing (z-test and t-test) was performed for comparative analysis. Regression analysis with principal component analysis was performed to assess impact of project activities. The impact assessment adopted an iterative process. Content analysis was performed from qualitative information to add validity to impact assessments. The quantitative data and qualitative information was analyzed separately and their findings were synthesized. 1.5 Study Limitations
1. Credible baseline estimate was not available for the impact assessment. Hence, this assignment assumed that the observable factors in control was similar to intervention during baseline.
2. Due to high employee turnover rate at factories the study had to adopt cross sectional approach instead of panel approach.

HDRC Endline Study of Improving Access to WASH for Levi’s RMG Workers in Bangladesh Project
4
Chapter 2 Study Findings
2.1 Respondents Characteristics/Background of Information
2.1.1 Household Composition
Findings in Table 2.1 represents household characteristics of the respondents of treatment and Control area. Average household size is 2.5 among treatment as well as control households. Over half of the households of garment workers had 1 to 2 members (Table 2.1) in both treatment and control area. The sex ratio of female to male household members was 1.2 in treatment area which was 1.3 in control area. Some 23.3 percent households of the treatment area was female headed. Compare to control area, female headed households was somewhat higher in the control area (26.8%). Table 2.1: Demographic indicators for surveyed household
Indicators Treatment Control Surveyed HH Number 330 339 Members of HH 839 870 Household size (average) 2.53 2.54 Sex ratio (Female: Male) 1.18 1.25 Female headed household 23.3 26.8 Households with members having disability (% among HHs) 1.5 0.3
n 330 339
2.1.2 Respondents Background Characteristics Age structure Age distribution of the surveyed respondents revealed that majority of the respondents (90% in treatment and 87% in Control area) were aged between 20 and 44 years. However, more than three-fifth (69.9%) of the respondents including male and female in treatment area were between the age bracket of 24-39 years or in physically active age group. Except the female, alike treatment area, three-fifth of the respondents in control area were also between the age brackets of 24-39 years. On the other hand, female respondents in control area were relatively young and bulk (69.3%) of female them were between the age group of 20 and 34 years. Respondents at the age of 40 years or above were reportedly less in treatment (14.5%) and control (21.6%) areas. Table 2.2: Age distribution of the surveyed respondents
Age Range Treatment Control Male Female All Male Female All
15-19 0.8 13.0 3.6 0.8 14.3 4.4 20-24 11.9 14.3 12.4 8.9 31.9 15.024-29 21.3 39.0 25.5 23.4 22.0 23.030-34 29.2 15.6 26.1 27.8 15.4 24.535-39 19.4 13.0 17.9 14.1 4.4 11.540-44 10.3 1.3 8.2 14.9 7.7 13.045-49 3.2 1.3 2.7 5.6 2.2 4.7 50-54 1.2 1.3 1.2 2.8 1.1 2.4 55-59 1.6 0.0 1.2 0.8 1.1 0.9 60+ 1.2 1.3 1.2 0.8 0.0 0.6
n 253 77 330 248 91 339

HDRC Endline Study of Improving Access to WASH for Levi’s RMG Workers in Bangladesh Project
5
Marital status Regardless of treatment and control area, more than fourth-fifth (85.8% in treatment and 80.5% in control) of the respondents were married. However, in both areas, percentage of marred male respondents were higher than female (92.1% vs. 64.9 in treatment and 94% vs. 44% in control). Reported incident of divorce or separation were very few both in treatment as well as in control area. Compare to the males divorce/separation were more among the female respondents.
Figure 2.1: Marital Status of the respondents
Education and literacy
Other than the female respondents (22%) in control area, more than one-fourth the respondents including males and females in treatment (26.1%) and control (26.8%) had education up to primary level. Among the respondents, education up to higher secondary level was reported by 12.6 percent males and 5.2 percent females in treatment area and by 5.6 percent males and females in control area. Nonetheless, 15.8 percent respondents in treatment and 22.1 percent in control area could put sign whenever needed. Table 2.3: Literacy/education status of the surveyed respondents
Literacy Status/Education Treatment Control Male Female All Male Female All
Can put sign only 15.8 15.6 15.8 22.6 20.9 22.1Read and write only 3.2 1.3 2.7 7.3 2.2 5.9Primary 13.8 16.9 14.5 12.9 23.1 15.6Passed primary 24.5 31.2 26.1 28.6 22.0 26.8Secondary 20.6 28.6 22.4 16.1 22.0 17.7Passed Secondary 12.6 5.2 10.9 5.6 5.5 5.6Passed Higher Secondary 5.9 1.3 4.8 4.4 3.3 4.1Nurani/Arabic 0.0 0.0 0.0 0.4 0.0 0.3No formal education 3.6 0.0 2.7 2.0 1.1 1.8
n 253 77 330 248 91 339
7.924.7 11.8 5.6
31.912.7
92.1 64.9 85.8 94.0 44.0 80.5
1.3 0.3 0.45.5
1.89.1 2.1 18.6 5.0
Male Female All Male Female All
Treatment Control
Unmarried Married Widow Divorced/Separated

HDRC Endline Study of Improving Access to WASH for Levi’s RMG Workers in Bangladesh Project
6
2.1.3 Housing Characteristics Structure of living houses Two-third (66.7%) houses of the respondents in treatment and three-fifth (64.3%) in control area were semi building, followed by 17.9 percent in treatment and 11.2 percent in control area were built of brick and cement termed as building structurally. Living in houses made of tin were reported by 15.5 percent respondents in treatment and 24.2 percent in control area. Figure 2.2: Structure of living houses of the respondents
Living status Reportedly, majority of the respondents were living solely either with her husband or with his wife both in treatment (42.7%) and control (36%) area, followed by ‘husband/wife together with other family members’ (28.5% in treatment and 32.7% in control). Apart from these, 14.5 percent respondents in treatment and 17.1 percent in control area reported staying 'alone'.
Table 2.4: Living status of respondents by sex
Living status Treatment Control Male Female All Male Female All
Alone 22.1 12.3 14.5 28.6 14.5 17.1Together With my several friends 5.2 1.6 2.4 1.6 0.4 0.6Only Husband and wife 40.3 43.5 42.7 27.0 38.0 36.0Husband/wife and other family members 20.8 30.8 28.5 34.9 32.2 32.7With relatives 10.4 11.1 10.9 7.9 12.7 11.8Others 1.3 0.8 0.9 0.0 2.2 1.8n 253 77 330 248 91 339
Ownership of Assets Study finding shows that almost all of the households (99.1% in each of treatment and control) had electric supply or solar power. Cot/Bedstead and mobile phone were the most common household item in both treatment (96.4 and 98,4%) and control (96% in each) area, followed by chair/table’ and television (68.5 and 56.1 in treatment area, 51 and 47.8% in control area). Besides, almirah and fridge were reported in 25 percent households in treatment area. On the other hand, almirah was reported in 11.4 percent and fridge in 17.1 percent household of control area. Other less reported house items in treatment and control areas were sofa set, radio, water filter/dispenser, bicycle and motor cycle.
17.9
66.7
15.50.0 0.0
11.2
64.3
24.2
0.3 0.0
Building Semi-building Tin House Bamboo/mud wallwith tin roof
Bamboo House
Treatment Control

HDRC Endline Study of Improving Access to WASH for Levi’s RMG Workers in Bangladesh Project
7
Table 2.5: Assets ownership of the Households Level
Asset Treatment Control Electricity/solar power 99.1 99.1 Almirah (wood/steel) 24.5 11.8 Sofa set 0.6 0.9 Chair/table 68.5 51.0 Cot/Bed stead 96.4 96.5 Radio 0.3 1.8 Mobile phone 98.5 96.5 Television 56.1 47.8 Fridge 24.8 17.1 Water filter/Dispenser 0.3 1.5 Bicycle 1.8 0.6 Motorcycle 0.3 0.6 Average number of asset ownership 4.71 4.25
n 330 339 Findings in Figure show that 90.1 percent in of the respondent in treatment area and 89.7 percent in control area had mobile phone of their own. Where only 30.9 percent of the respondents in treatment area and 22.7 percent in control area had smart phone, which was found higher among the male members of the household in treatment area.
Figure 2.3: Availability of Mobile phone and smart phone
2.2 Access to Water 2.2.1 Access to Water at Household level Types of drinking water sources and services Access of the Levi's garment workers in Bangladesh to drinking water has been measured in terms of updated JMP ladders on the criteria of new global SDG indicator "Proportion of population using safely managed drinking water services".3 The figure 2.1 shows that all the garment workers
3 Updated JMP ladders of water sources
Safely managed: Drinking water from an improved water source that is located on premises, available when needed and free from faecal and priority chemical contamination Basic: Drinking water from an improved source, provided collection time is not more than 30 minutes for a round trip, including queuing. Limited: Drinking water from an improved source for which collection time exceeds 30 minutes for a round trip, including queuing.
Improved drinking water sources are those which that are potentially capable of delivering safe water by nature of their design and construction include piped water, boreholes or tube wells, protected dug wells, protected springs, and packaged or delivered water. Unimproved drinking water
98.790.1 92.1 96.8
88.0 89.7
51.3
24.130.9
37.7
18.9 22.7
Male Female All Male Female All
Treatment ControlMobile Phone Smart Phone

HDRC Endline Study of Improving Access to WASH for Levi’s RMG Workers in Bangladesh Project
8
living in intervention and control areas used improved water source for drinking purpose. The source of drinking water both in the intervention and control areas was submersible pump piped directly to their rooms/houses where 87 percent of the households in intervention and 97.6 percent in control areas had overhead water tank confirming the readily reach and use of water when needed (Figure 2.4, and Table 11, Annex 1). Availability of water when need cannot be made certain in the households in intervention and control areas without water tank. Considering the services level, majority of the improved water sources in intervention (65.8%) and control (84%) areas were at the level of basic services. Nonetheless, safely managed water sources in the intervention area was more than two-fold higher than that of control area (34.2% vs. 15%) and the difference is statistically significant (Figure 2.5).
Functional status of the drinking water sources and availability of water at source
Irrespective of intervention and control areas, almost all (over 99%) the water sources in both the areas were found functional and except in little variation, virtually water was available throughout the day and night round the year. Other than 20 percent water sources installed by WaterAid in the intervention area, most of the drinking water sources in intervention (79%) and control (99.7%) areas were owned by the house owner (Table 14, Annex 1). As the water sources piped to almost all the room/house, distance of water point from household, average water collection time were not considered for analysis. On top of this, according to the respondents, more than 99.7 percent households in intervention and over 99.4 percent in control area did not experience any problem in collecting adequate amount of water for drinking and other household chores as well (Table 2.6). Table 2.6: Percentage distribution of water source by functionality and availability of water
Functionality and availability Intervention Control Functionality 99.7 99.4 Availability of water source (Month average) 12.00 11.99 Availability of water (Hours average) 23.93 23.89
n 330 339
Drinking water from sources that are not capable of delivering safe water by their design and construction include unprotected dug well, unprotected spring and surface water (directly from river, dam, lake, pond, stream, canal or irrigation canal),
34.215
65.885
Intervention Control
Figure 2.5: Distribution of households by access to SDG service level of water sources (in %)
Safely managed Basic
8797.6
Intervention Control
Figure 2.4: Distribution of households by source of drinking water sources (in %)
Pipled water with water tankPipled water without water tank

HDRC Endline Study of Improving Access to WASH for Levi’s RMG Workers in Bangladesh Project
9
Physical quality and household intervention of drinking water prior to consumption Physical quality of the drinking water had also been assessed for acceptability on the basis clarity, colour, smell, and taste. Reportedly, drinking water of the surveyed water sources was good to 77 percent, comparatively good to 17.4 percent, and not good to 5 percent respondents in control area as compared to good to nearly all (99.7%) respondents in intervention area (Figure 2.6, Table 15, Annex 1). Primary reasons for disliking the drinking water in control area were bad smell (67.1%), skeptical to existence of germ (50%) and non-clarity (31.7%) of water. Presence of excessive iron and salty in taste was stated by a few (Table 16, Annex 1).
Findings further reveals that household intervention of drinking water before consumption was not a common practice in control area and not at all in intervention area. Among the few households in control areas who are likely treat drinking water before consumption water, 65 percent of them did that by boiling, followed by 30 percent through filtering. Details are in Table 17, in Annex 1. Water safety plan
Water safety plans are an orderly approach to safeguarding drinking-water safety from source to consumer. A water safety plan emphasizes the effective process control in water supply as the principal means of ensuring water safety. Reportedly, 53.3 percent respondents in intervention and 24.5 percent in control area cleaned their pot with drinking water before water collection from supply source. However, most of the respondents in intervention (88.5%) and majority in control (58.1%) area covered the water pot with lid at the time storing. Lastly, 60.9 percent respondents in intervention and 27.7 percent in control area used cleaned glass/mug and not dipped their finger inside the glass or reservoir while drinking water. Thus estimated percentage of respondents followed the WSP step effectively was 32.7 percent in intervention and 15.3 percent in control area (Table 2.7). Table 2.7: Distribution of household by water safety plan (in %)
Indicators Intervention Control Water pot is cleaned during water collection 53.3 24.5 Water pot is covered during water preservation 88.5 58.1 Water glass/mug is cleaned during drinking or serving water 60.9 27.7 Steps maintained effectively 32.7 15.3
n 330 339
99.7
0.3 0
77
17.4
5
Good Comparatively good Not good
Figure 2.6: Distribution of households by physical quality of drinking water (in %)
Intervention Control

HDRC Endline Study of Improving Access to WASH for Levi’s RMG Workers in Bangladesh Project
10
Status of the adjacent area, platform and drainage system of the water tap
By and large, status of water taps/standpoints in intervention area is better than the status observed in control area. More than half (58.6%) adjoining area of water taps/standpoints was unclean in control areas. Corresponding situation was noticed in one-fourth of the water taps/standpoints in intervention area. A little less than half (48.3%) of the connecting pipe of the tap/stand point were either cracked/broken or blocked by filth/garbage and equal proportion of platform of water taps/standpoints were water lodged in control area. Analogous situation of the connecting pipe and platform of the water tap/stand point was observed in less than 20 percent of the cases in intervention area. Additionally, existence of exposed pipe and crack in the platform of water tap was reported by 58 and 32.3 percent the respondents in control area against 28.8 and 19.8 percent in intervention area. The water taps on the other hand were largely fixed to the concrete wall almost equally both in intervention (94.7%) and control (90.9%) area. However the overall condition of more than half the platform and the drainage system of the water tap in intervention and close to fourth-fifth in the control were not good or environmentally safe (Table 2.8).
Table 2.8: Status of the adjacent area, platform and drainage system of the water tap (in %)
Indicators Intervention ControlUnclean environment/condition around the water tap 25.1 58.6 Cracked/broken (or blocked by filth/garbage) connecting pipe 18.0 48.3 Water lodged on the water tap platform 17.0 48.3 Cracked water tap platform 19.8 32.3 Fixed Water tap with a concrete wall 94.7 90.9 Exposed Water tap pipe 28.8 58.0 Meter attached with water Tap 2.5 3.6 Overall condition of the water tap platform was observed bad 52.6 78.2 Overall condition of the drainage system of the water tap platform was observed bad 51.4 77.6
2.2.2 Access to Water at Work place All the intervention garments had improved source of drinking water and managed safely. The main source of drinking in the intervention garments was supply (56.1%) water, followed by filtered (43%) water. Similarly in the control garments, main source of drinking water was supply (74%) water followed by the filtered (25.1%) water. Types of water sources available in the intervention garments are as follows: Table 2.9: Distribution of drinking water sources in the intervention garments factory by types
Sources RMG factory-1 RMG factory-2 RMG factory-Supply water after filtering √ Directly from tap water √ √ Tube well Ultraviolet water purification √ √

HDRC Endline Study of Improving Access to WASH for Levi’s RMG Workers in Bangladesh Project
11
Observation note on drinking water facilities in the intervention garments It had been seen that water tap(s) for drinking water was present in each floor of all the three intervention garments observed. The water taps were wall mounted and marked as "pure drinking water". The quantity of water taps however, not unique and varied from 1-3 in number across the intervention garments. A wash basin fixed to the wall under each of the water tap had also been noticed. Supplied water was purified in each garment by means of ultra violet ray emitting machine. Each and every garment workers were found to collect water from the taps in her/his own bottle. The results of water analysis reports from ICDDR,B were found hanged serially beside the drinking water tap in all the three garments. It indicated periodical analysis of the supplied drinking water were undertaken by the observed garments for faecal coliform and priority chemicals (arsenic and iron). Apart from these, several (ranged from 18-20) water taps together with a platform covered by glazed tiles were also seen in the dining room for the worker of all the garments.
2.3 Access to Sanitation 2.3.1 Access to Sanitation at Household level Types of sanitation facilities and its use Similar to drinking water, access of the Levi's garment workers in Bangladesh to sanitation has been measured in terms of updated JMP ladders on the criteria of new global SDG indicator
"Proportion of population using safely managed sanitation services including handwashing facility with soap and water."4 Regardless of intervention and control area, majority of the garment workers used improved sanitation facilities but none of these sanitation facilities meet the criteria for having a safely managed sanitation service. The sanitation facilities, used by the garment workers living in intervention (76.6%) and control (84.4%) were largely classified as having a limited services i.e., shared with other households. However, use of sanitation facilities classed as having a basic sanitation service by the garment workers in interventions were nearly 3 times higher than that were used by the garment workers living in control area (17% vs. 6.2%) and difference is highly significant statistically. Use of unimproved sanitation facilities among the garment workers in the control area (9.4%) was also fairly higher than in intervention area (6.4%). 4 Updated JMP ladders of sanitation services Safely managed: Use of improved facilities that are not shared with other households and where excreta are safely disposed of in situ or transported and treated offsite Basic: Use of improved facilities that are not shared with other households Limited: Use of improved facilities shred between two or more households Improved sanitation facilities are those designed to hygienically separate excreta from human contact include flush/pour flush to piped sewer systems, septic tanks or pit latrines; ventilated improved pit latrines, composting toilets or pit latrines with slabs Unimproved: Use of pit latrines without a slab or platform, hanging latrines or bucket latrines Open defecation: Disposal of human faeces in fields, forests, bushes, open bodies of water, beaches or other open spaces, or with solid waste
96.390.6
Intervention area Control area
Figure 2.7: Distribution garment worker by access to sanitation facilities (in %)
17 6.2
76.684.4
6.4 9.4
Intervention Control
Figure 2.8: Access to improved facilities by updated JMP Sanitation ladder (in %)
Basic Limited Unimproved

HDRC Endline Study of Improving Access to WASH for Levi’s RMG Workers in Bangladesh Project
12
Analysis by type of sanitation facilities, most the garment workers in intervention (93%) and control (88.8%) areas used latrine flush to septic hole/tank. Use of latrine flush to septic tank, open space, drain and pit latrine without slab were reported by a very few both in intervention and control area (Table 22, Annex 1). Of the latrines used by garment workers, 81.2 percent were shared jointly with other households in intervention area and 91.7 percent in control area. Average number of households shared a single latrine was 5.85 in intervention area as compared to 15.9 households in control area.). Average number of person per latrine was 11.28 in intervention area 28 in control area. The above stated differences of sharing a latrine by household or by person between the intervention and control areas were highly significant statistically (p = 0.0001). Table 2.10: Percentage distribution of the respondents by status sharing latrine
Shared latrine statistics Intervention Control Household doesn’t share latrine with others 17.6 8.3 Latrine jointly used with other HH 81.2 91.7 Latrines are open for all 1.2 0.0 n 330 339 Average Number of HH use a Latrines 5.85 15.90 Average number of person use a latrines 11.28 28.00 N 272 311
N= Number of total respondents interviewed Ownership of latrines and maintenance Most of the latrines in intervention (93.6%) and control (97.6%) area were owned by the house owner. According to the respondents most of the latrines in intervention (98.2%) and control (92.9%) area did require any repair and maintenance service (Table 27, Annex-1). Among the few, where repair of latrine was done, average cost of repair was Taka 29.8 in intervention and Taka 102.2 in control area primarily for evacuation of faeces from the tank/pit or to set up new latrine (Table 24, Annex 1). Table 2.11: Percentage distribution of the latrines by ownership
Ownership Types Intervention Control Self 0.6 0.6 Owner of the house 93.6 97.6 Joint ownership 0.3 0.9 Community 3.3 0.9 Others 2.1 -- N 330 339
Location of the latrines and distance from the household Location of the latrines were not alike in intervention and control area. Relatively such variation was more evident in the intervention area than so in the control area. In the control area, more than three-fifth (61.7%) latrines were situated the household premises, followed by beside the living room (33.9%). On the other hand, a little less than one-fourth (23.6%) of latrine were attached to their living room, 44.2 percent beside the living room and 30 percent at the household premises.

HDRC Endline Study of Improving Access to WASH for Levi’s RMG Workers in Bangladesh Project
13
Average distance of the latrines from household was 8.9 feet in intervention and 19.68 feet in control area. Percentage of households located within 20 feet of the latrines was 94.8 in intervention and 85.8 percent in control area. Availability of water inside the latrine was noted in 95.8 percent latrine in intervention and 91.4 percent in control area. However, availability of soap inside the latrine was significantly higher (P = 0.0001) in intervention area (51.5%) as compared to 17.7 percent in control area. Table 2.12: Percentage distribution latrines by distance from household and availability water
Status of latrine characteristics Intervention Control Distance of latrine from HH (Average) in feet 8.90 19.68 HH has latrine within 20 feet 94.8 85.8 Soap inside latrine 51.5 17.7 Availability of water inside latrine 95.8 91.4 N 330 339
Status of cleanliness of the latrines and usability In general cleanliness of the latrines were somewhat better in the intervention area than so in the control area. Faeces was visible on the pan and/or on the platform of the latrine in 8.9 percent of the latrines in intervention area as compared to 19.7 percent latrines in control area. Mosquito/insect noticed inside latrine in 15.5 percent latrine in intervention area against 21.5 percent in control area. Bad smell was felt in 21.5 percent latrines in intervention area as compared to nearly half (48.1%) of the latrines in control areas. Table 2.13: Distribution of latrines by status of cleanliness and usability
Condition of latrines Intervention ControlVisibility of feaces inside latrines or pan on slab 8.5 17.7 Visibility of mosquito/insects 15.5 21.5 Bad smell from latrines 21.5 48.1 Latrines are open or attached to canal/pond/ditches/river/open space 2.4 5.9 Others 25.5 12.1 N 330 339
23.6
44.2
30
2.14.1
33.9
61.7
0.3
Inside room/house Beside room/house At the premises Outside the premises
Figure 2.9: Distribution of the latrine by location (in %)
Intervention Control

HDRC Endline Study of Improving Access to WASH for Levi’s RMG Workers in Bangladesh Project
14
Regarding usability, latrines were user-friendly to majority of women in intervention (99.4%) and control (98.2%) area. On the other hand, although 71.5 percent of children could use the latrines located in intervention area but 61.9 percent children could not do so in control area. Likewise, 71.5 percent of elderly people and 36.7 percent of physically challenged persons could use the latrines in intervention area. Corresponding figures in control area were 39.2 and 22.4 percent respectively in control area.
Disposal of child faeces According to Annex Table 33, more than half of the under-5 children in intervention (52.1%) and control (58.1%) area used latrine, followed by 33.3 percent in intervention area and 33.6 percent in control area used pot for daefecation. Some, 14.6 percent of the children in intervention area and 11.3 percent in control area had no specific place for defaecation. Among under-5 children who were not using latrine for defaecation, faeces was largely disposed in the household latrine both in intervention (95.7%) and control (84.6%) area. A few both in intervention and control areas disposed the child faeces randomly surrounding the premises (Table 34, Annex 1). Cleaning of faecally soiled clothes/langot of the children in intervention (78.6%) and control (72.3%) area was largely washed inside latrine, followed by the water tap at the washing place (Table 35, Annex 1). Table 2.14: Percentage distribution of faecal matter by place of disposal
Disposal place Intervention Control Use HH latrines 56.3 52.1 Dispose in the HH latrine 41.6 44.5 No specific place/in the premises 2.1 1.6 Washed with tubewell/tap water 0.0 1.8 N 48 56
2.3.2 Access to Sanitation at Factory Level Cleaning of latrines In general, study findings revealed that cleaning status of the latrines in intervention factories is fairly better than that of the control factories. According to majority of garment workers in intervention (66.7%) and control (56%) factories, the cleaning status of the latrines at their workplace were good. On the other hand, a few workers in intervention garments factories and nearly two-fifth (39.2%) in control factories felt cleaning status of the latrines as considerably well to bad.
71.5
99.4
36.7
71.5
38.1
68.2
22.4
39.2
Children Women Phycically challenged Earderly people
Figure 2.10: Distribution of the latrines by usability (in %)
Intervention Control

HDRC Endline Study of Improving Access to WASH for Levi’s RMG Workers in Bangladesh Project
15
Table 2.15: Cleaning Status of the latrines
Status Intervention Control Very good 25.8 4.7 Good 66.7 56.0 Considerably well 7.6 34.8 Bad 0.0 4.4 N 330 339
2.3.3 Hygiene facilities in the latrines The improvement of hygiene status was assessed on the basis on the availability of soap, towel/cloth, tissue papers and bin within the latrines. The Table 00 depicted that most (93.3%) of the respondents of intervention factories reported the availability of waste disposal bin within the latrines which was reported by 44 percent respondents of control factories. Again, 77 percent respondents of the intervention factories reported the presence soap within the latrines while presence of soap within the latrines were reported by 33 percent respondents in control garments factories. Availability of towel/cloth within the latrines of intervention factories reported by 34.8 percent respondents of intervention factories as compared to 9.4 percent respondents of control factories. Table 2.16: Percentage distribution of garment factories by availability of hygienic facilities within the
latrines.
Types of improvements Intervention Control Arrangement of soap 77.0 33.0 Availability of tissue papers 13.0 .6 Availability of towel or cloth 34.8 9.4 Availability of bin for waste disposal 93.3 41.6 Others 0.6 44.0 N 330 339
Findings of observation of the intervention garments All the latrines of the observed garments were improved type and safely managed and located at each floor the factory buildings. Most of the latrines were cleaned and freed from bad smell. Furthermore, there were adequate light and ventilation facility. Latrines of all the intervention factories were cleaned daily. In addition, latrines were demarcated by writing “toilet for women” and “toilet for men” at the doors of all latrines. A poster for “using process and necessity of slipper in the toilet” has also been fixed on the wall just in front the door of the latrines. 2.4 Access to Handwashing 2.4.1 Handwashing Situation at Household level SDGs include measurement indicators concerning the availability of hand washing facilities with soap and water, professing this as a top priority in all settings. The new global SDGs have classified these facilities in three categories on the basis of service level.5 As one of the important measures of hygiene status, facility for handwashing was assessed at household level of the garment workers residing in intervention and control areas. The Figure 2.8 depicts that household 5 SDG Definition for Handwashing Facility Basic: Availability of a hand washing facility on premises with soap and water Limited: Availability of a hand washing facility on premises without soap and water No Facility: No hand washing facility on premises

HDRC Endline Study of Improving Access to WASH for Levi’s RMG Workers in Bangladesh Project
16
handwashing facilities 36.7 percent respondents in intervention area were at basic service level which was more than four times higher than the handwashing facilities of the households of respondents in control area (8.3%) and the difference is statistically significant. Limited service of handwashing facilities were reported in 30.9 percent households in intervention area which is slightly higher than the households in control area (28.3%). Last but not least, close to one-third (32.3%) households in intervention area had no facility for handwashing as compared to 63.4 percent households in control area and the deference was almost double and statistically significant.
Availability status of separate handwashing places within or outside the latrines was also explored to measure the standard of hygienic practice among the households. According to the Table presented below, the facility of separate handwashing places was available in 67.6 percent households in intervention which is significantly higher than households in control area (36.6%). Among the available handwashing places, handwashing facility/place within the latrines in intervention (99.6%) area was reportedly higher than the handwashing facility within the latrines in control (91.9%) area. As high as, 93.7 percent handwashing places in intervention area are within 10 feet of latrines which were 91.1% percent in control area. Table 2.17: Availability of separate Handwashing places, within the latrines and outside the latrines
Time/occasion Intervention Control Handwashing place 67.6 36.6N 330 339Handwashing place within latrines 99.6 91.1Handwashing place within 10 feet of latrine 93.7 75 N 223 124
In order to understand the hygiene practice among the study areas, it was necessary to understand what kinds of handwashing agents especially soap including others, were available at the handwashing places of their households. The table shows that soap or liquid soap or powder was available among 54.3 percent handwashing places in intervention area which is significantly higher than the control (22.6%) area. Table 2.18: Availability of handwashing agents
Handwashing agents Intervention Control Soap/liquid soap/powder 54.3 22.6Nothing 45.7 77.4N 223 124
32.4
63.4
30.9
28.336.78.4
Intervention Control
Figure 2.11: Handwashing Facility
No Facility Limited Basic

HDRC Endline Study of Improving Access to WASH for Levi’s RMG Workers in Bangladesh Project
17
Most of the respondents in both intervention and control (99.4) areas reported that everyone should wash hand with soap after defecation. As high as 80.3 percent respondents in intervention area had knowledge on handwashing with soap before eating, which was known to 62.5 percent respondents in control area. The Table further showed that the handwashing knowledge among the respondents in intervention area was higher than the knowledge of respondents in control across the indicators of handwashing at critical times. Table 2.19: Knowledge of Handwashing at critical times
Time/occasion Intervention Control After defecation 99.4 99.4 After rinsing child’s excreta 64.2 45.7 Before eating 80.3 62.5 Before cooking 23.0 18.6 Before Feeding Child 13.0 3.2 N 330 339
As high as 75.2 percent respondents in intervention area which is significantly higher than the control (62.8%) area washed their hands with soap after defecation. The other notable (35.2%) practice of handwashing of the respondents in intervention area was washing hands before eating which was reported by 19.8 percent respondents in control area. Handwashing practice of the respondents both in intervention and control areas at other critical times reported less frequently. Table 2.20: Handwashing Practice at Proper time of necessary Occasions
Time/occasion Intervention Control After defecation 75.2 62.8 After rinsing child’s excreta 11.8 9.4 Before eating 35.2 19.8 Before cooking 10.9 14.5 Before Feeding Child 7.0 3.8 N 330 339
2.4.2 Handwashing Situation at Factories
Among all intervention garments, handwashing facility including water and soap was available in almost all (99.7%) latrines as compared to 97.9 percent latrines of control factories. On the other hand, as compared to availability water and soap in 99.7 percent handwashing places in intervention factories, 86.7 percent of the handwashing places in control factories reported to have water and soap.
97.9
86.7
99.7
99.7
Handwashing management within latrine
Shoap and water for handwashing
Figure 2.12: Handwashing management within latrines and availability of soap and water at handwashing places
Intervention Control

HDRC Endline Study of Improving Access to WASH for Levi’s RMG Workers in Bangladesh Project
18
All the respondents of control factories (100%) reported that they used sandal or slipper at time of using latrines while such practice was reported by 92.6 percent respondents in intervention factories. Additionally, nearly half of the respondents of intervention factories reported that they washed both hand with soap and water always while only 7.1 percent of the respondents in control factories followed this practice. On the other hand, 81.4 percent of the respondents in control factories and 54.5 percent of intervention factories informed that they washed only one hand with soap and water. According to the observation findings, handwashing places with three to four wash basin were found on the every floor of all the intervention factories for both male and female separately. Even there were towel or cloth available. It is to note that electric hand drier machines were also available in at least two of our three surveyed intervention factories. Further, according to the observation findings, both water and either soap or liquid soap were available at handwashing places. Table 2.21: Hygiene Practices at time of using Latrines Indictors Intervention Control Use Sandal/slipper in latrine 100 92.6 Hand washing practice after defecation Wash with water only 2.4 11.5 Wash only one hand with soap and water 54.5 81.4 Wash both hands with soap and water 43.0 7.1
n 2.5 Menstrual Hygiene Management (MHM) 2.5.1 Menstrual Hygiene Management at Household At the household level among the women of reproductive age, the mostly used MHM materials were reusable materials like cloth (68.3%) in the intervention area which was significantly higher than those of control (78.9%). On the other hand, 30.7 percent of intervention households used disposable sanitary napkin whereas 20.1 percent of control household use such disposable MHM material. Table 2.22: Proportion of use of MHM Materials at household level
Types of MHM materials Intervention Control Reusable Materials (Cloth) 68.3 78.9Disposable sanitary napkin 30.7 20.1Cotton/Tissue paper 0.0 0.7Presently menstruation is off 1.0 0.3
n 300 303 As highest as 85.6 percent of the intervention households washed their reusable MHM materials with soap and water while 78.2 percent of the control household followed this process. But, 19.5 percent of the control area washed their reusable MHM materials with only water while only 5.2 percent of the intervention reported to do that.

HDRC Endline Study of Improving Access to WASH for Levi’s RMG Workers in Bangladesh Project
19
Table 2.23: Cleaning and drying of the Reusable MHM materials
Indicators Intervention Control Cleaning of Reusable MHM Materials Wash with water, soap and Antiseptic 8.7 3.3WASH with soap and water 85.6 78.2With water only 5.2 19.5
n 208 243Drying of Reusable MHM Materials Direct Sun dry 11.1 3.3Dry keeping under other cloth 48.7 33.9Inside the room with other cloth 40.2 62.8
n 77 91 Again, in case of drying the reusable MHM materials, 11.1 percent of intervention areas, higher than the intervention (3.3%) followed the process of direct sun dry. Most of intervention areas (48.7%) dried their MHM materials keeping under other cloths while 33.9 percent follow took this facility. Lastly, more than three-fifth of the control 62.8%) areas got dried their materials keeping inside the room with other cloth while 40.2 percent of intervention followed it.
All same proportion of HH within the intervention (57.8%) and control (57.4%) change their MHM materials within six hours or after every alternate six hours. In addition, less than half of the respondents (intervention 42.2% and control 42.5%) have reported that they changed their MHM materials after more than six hours. A larger percentage of HH from intervention group (41.3%), significantly higher than control group (25%), used dustbin for disposal of MHM materials. In addition, 48.5 percent of intervention group disposed their MHM materials with HH waste while 54.5 percent of control group followed this step. Table 2.24: Disposal of MHM Materials
Disposal Places Intervention Control With HH waste 48.5 54.5 Toilet 0.7 0.3 Dustbin 41.3 25.0 Open place/drain 0.7 0.6 Do not know 8.9 19.5 n 77 91
57.8
42.2
57.4
42.5
Within 6 hours
More than 6 hours
Figure 2.13: Duration of changing MHM materials
Intervention Control

HDRC Endline Study of Improving Access to WASH for Levi’s RMG Workers in Bangladesh Project
20
2.5.2 Menstrual Hygiene Management at Factory Most of the workers of intervention factories (92.4%) have reported that the factory latrines have the facility of MHM while 80.5 percent of control factories have opined like this. On the other hand, 92.1 percent of intervention facilities which is higher than control (79.4%) thought that the factory latrines are user friendly for MHM. Table 2.25: MHM Facility at RMG factory latrines
MHM Facility Intervention Control Facility of MHM service 92.4 80.5 User friendliness of factory latrines for MHM 92.1 79.4 n 77 91
Use trend of MHM materials among the factory workers
Among our intervention factories, more than one-third of the female workers (34.8%) use sanitary napkin which is significantly higher than the control group (19.2%). On the other hand, the mostly used MHM material is reusable cloth with 66.4 percent in control which is higher than intervention (57.6%). Additionally, it is to note that, 13.9 percent of control factories which is doubly higher than intervention (6.7%) use garment leftovers known as “jhoot” as MHM materials. At time of changing MHM materials, more than half of the respondents (53.9%) of the intervention
group which is significantly more than control (44%), disposed their MHM materials in the factories. On the other hand, 22.1 percent of intervention group got opportunity to wash the reusable materials in the factory and brought back home for further use while 34.5 percent respondents of the control factories took the same facility. Additionally, 15.5 percent of intervention group and 16.2 percent of control group did not take any step instantly though they need to change their MHM materials. Table 2.26: Steps taken in case of need to change the used MHM materials at factories
Steps Intervention Control Washed in factory and bring home 22.1 34.5 Bring it home without washing 8.5 5.3 Dispose of 53.9 44 Do nothing 15.5 16.2 N 77 91
0.9
0
0.9
13.9
19.2
66.4
0.9
0.3
1.2
6.7
34.8
57.6
Presently menstruation is off
Only panty
Tissue paper
garment leftovers (jhoot)
Sanitary napkin
Reusable Materials (Cloth)
Figure 2.14: Use of MHM Materials among the Factory Workers
Intervention Control
HDRC Endline Study of Improving Access to WASH for Levi’s RMG Workers in Bangladesh Project
21
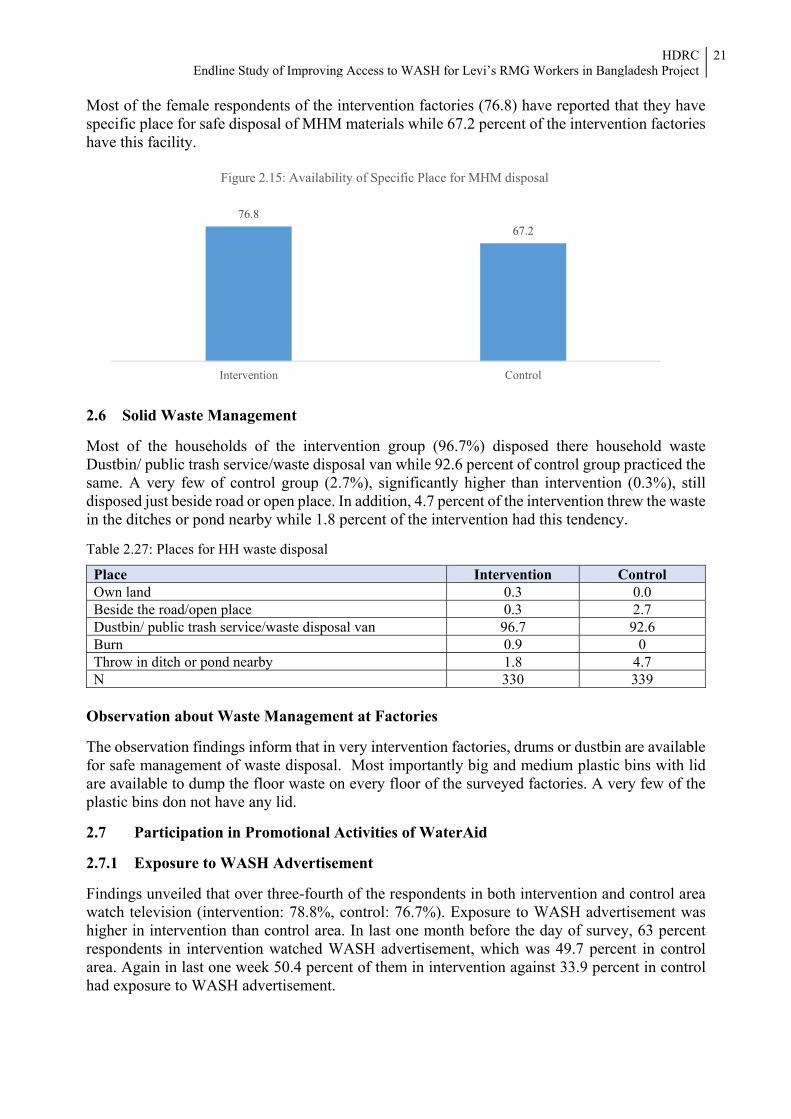
Most of the female respondents of the intervention factories (76.8) have reported that they have specific place for safe disposal of MHM materials while 67.2 percent of the intervention factories have this facility.
2.6 Solid Waste Management Most of the households of the intervention group (96.7%) disposed there household waste Dustbin/ public trash service/waste disposal van while 92.6 percent of control group practiced the same. A very few of control group (2.7%), significantly higher than intervention (0.3%), still disposed just beside road or open place. In addition, 4.7 percent of the intervention threw the waste in the ditches or pond nearby while 1.8 percent of the intervention had this tendency. Table 2.27: Places for HH waste disposal
Place Intervention Control Own land 0.3 0.0 Beside the road/open place 0.3 2.7 Dustbin/ public trash service/waste disposal van 96.7 92.6Burn 0.9 0 Throw in ditch or pond nearby 1.8 4.7 N 330 339
Observation about Waste Management at Factories The observation findings inform that in very intervention factories, drums or dustbin are available for safe management of waste disposal. Most importantly big and medium plastic bins with lid are available to dump the floor waste on every floor of the surveyed factories. A very few of the plastic bins don not have any lid. 2.7 Participation in Promotional Activities of WaterAid 2.7.1 Exposure to WASH Advertisement Findings unveiled that over three-fourth of the respondents in both intervention and control area watch television (intervention: 78.8%, control: 76.7%). Exposure to WASH advertisement was higher in intervention than control area. In last one month before the day of survey, 63 percent respondents in intervention watched WASH advertisement, which was 49.7 percent in control area. Again in last one week 50.4 percent of them in intervention against 33.9 percent in control had exposure to WASH advertisement.
76.867.2
Intervention Control
Figure 2.15: Availability of Specific Place for MHM disposal
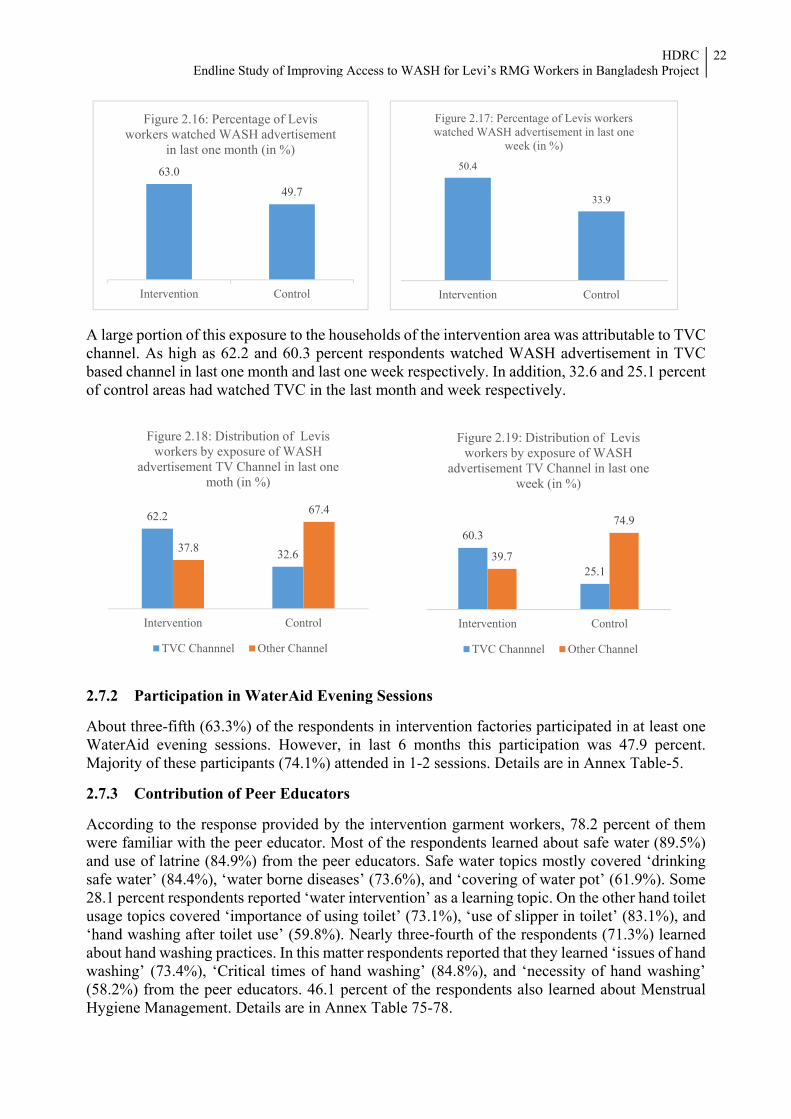
HDRC Endline Study of Improving Access to WASH for Levi’s RMG Workers in Bangladesh Project
22
A large portion of this exposure to the households of the intervention area was attributable to TVC channel. As high as 62.2 and 60.3 percent respondents watched WASH advertisement in TVC based channel in last one month and last one week respectively. In addition, 32.6 and 25.1 percent of control areas had watched TVC in the last month and week respectively.
2.7.2 Participation in WaterAid Evening Sessions About three-fifth (63.3%) of the respondents in intervention factories participated in at least one WaterAid evening sessions. However, in last 6 months this participation was 47.9 percent. Majority of these participants (74.1%) attended in 1-2 sessions. Details are in Annex Table-5. 2.7.3 Contribution of Peer Educators According to the response provided by the intervention garment workers, 78.2 percent of them were familiar with the peer educator. Most of the respondents learned about safe water (89.5%) and use of latrine (84.9%) from the peer educators. Safe water topics mostly covered ‘drinking safe water’ (84.4%), ‘water borne diseases’ (73.6%), and ‘covering of water pot’ (61.9%). Some 28.1 percent respondents reported ‘water intervention’ as a learning topic. On the other hand toilet usage topics covered ‘importance of using toilet’ (73.1%), ‘use of slipper in toilet’ (83.1%), and ‘hand washing after toilet use’ (59.8%). Nearly three-fourth of the respondents (71.3%) learned about hand washing practices. In this matter respondents reported that they learned ‘issues of hand washing’ (73.4%), ‘Critical times of hand washing’ (84.8%), and ‘necessity of hand washing’ (58.2%) from the peer educators. 46.1 percent of the respondents also learned about Menstrual Hygiene Management. Details are in Annex Table 75-78.
62.2
32.637.8
67.4
Intervention Control
Figure 2.18: Distribution of Levis workers by exposure of WASH
advertisement TV Channel in last one moth (in %)
TVC Channnel Other Channel
60.3
25.139.7
74.9
Intervention Control
Figure 2.19: Distribution of Levis workers by exposure of WASH
advertisement TV Channel in last one week (in %)
TVC Channnel Other Channel
63.0
49.7
Intervention Control
Figure 2.16: Percentage of Levis workers watched WASH advertisement
in last one month (in %)50.4
33.9
Intervention Control
Figure 2.17: Percentage of Levis workers watched WASH advertisement in last one
week (in %)

HDRC Endline Study of Improving Access to WASH for Levi’s RMG Workers in Bangladesh Project
23
2.8 WASH in Schools WASH in Schools improves attendance, health and cognitive development, increases girls’ participation, establishes positive hygiene behaviors, offers the opportunity to introduce better WASH practices in families and communities and addresses issues of inequity and exclusion.6 However, hardware installation at schools, supported by WaterAid, were an effective corridor which had helped the 12 schools to have access to improved water sources, sanitation and hygiene. And so observation method with a structured guideline had been applied to get clear picture of WASH situation and improvements of those WaterAid supported schools. All the surveyed schools have available and functional water sources which provide water round the year without any interruption. Further, all the schools have tapped water sources. On the other hand, Ultraviolet water purifiers have been fixed with the water pipeline to ensure the availability of safe water among all the observed schools. According to our observation findings, water quality is absolutely pure and good as water is free from arsenic, e-coli and any other contamination. Table 2.28: Overall status of the safe water in terms of availability, functionality and types of water
sources
Indictors Status Availability of water sources YesFunctionality of water sources YesAvailability of water for round the year yesTypes of water sources Tap or piped water Water intervention process Ultraviolet water purifier
All the schools had facility of improved latrines which are attached with septic tank through sewerage pipes. Single sex latrine facility is available in all the observed schools. Average latrines for female students is 2.6 per schools while average 2.1 latrines are available for male students per school. In addition, ramps or rails have been attached for making the toilets user-friendly for the physically challenged students.
6 Report on “WASH for School Children” Developed and Published by UNICEF Regional Office for South Asia
89.5 84.9
71.3
46.1
Safe water Use of latrines Handwashing MHM
Figure 2.20: Distribution of respondents by learning topics from peer educators (in %)
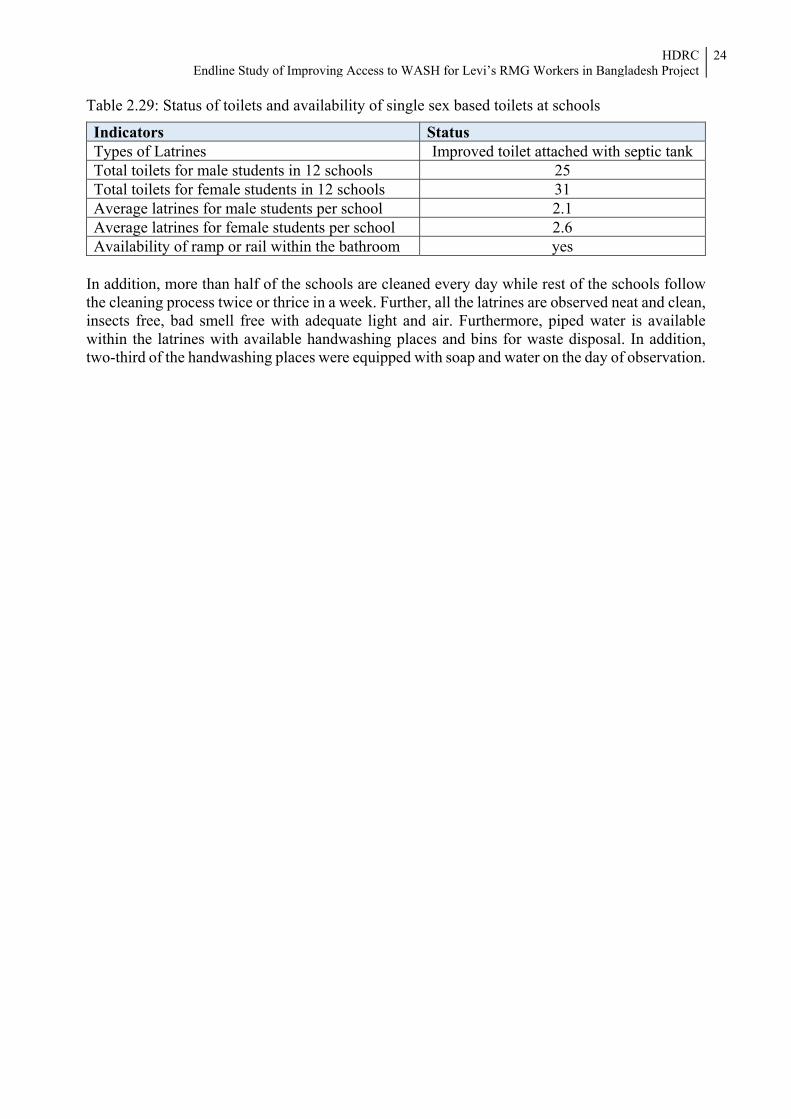
HDRC Endline Study of Improving Access to WASH for Levi’s RMG Workers in Bangladesh Project
24
Table 2.29: Status of toilets and availability of single sex based toilets at schools
Indicators Status Types of Latrines Improved toilet attached with septic tankTotal toilets for male students in 12 schools 25 Total toilets for female students in 12 schools 31 Average latrines for male students per school 2.1 Average latrines for female students per school 2.6 Availability of ramp or rail within the bathroom yes
In addition, more than half of the schools are cleaned every day while rest of the schools follow the cleaning process twice or thrice in a week. Further, all the latrines are observed neat and clean, insects free, bad smell free with adequate light and air. Furthermore, piped water is available within the latrines with available handwashing places and bins for waste disposal. In addition, two-third of the handwashing places were equipped with soap and water on the day of observation.

HDRC Endline Study of Improving Access to WASH for Levi’s RMG Workers in Bangladesh Project
25
Chapter 3 Impact Assessment
Data suggests that improving Access to WASH for Levi’s RMG Workers in Bangladesh Project has been significantly successful both in its execution and outcome and has had significant impacts on RNG workers and the lives of those households living in the surveyed areas compared to the control groups. 3.1 Impact assessment Framework This framework focuses on monetary indicators rather than non-monetary indicators (i.e., happiness, sense of relief) as the monetary indicators are easily measureable and the data collection is easier with possibility of lesser response bias. The impact of the interventions was assessed through the following framework: Figure 3.1: Framework for impact assessment
It is foreseen that the knowledge will enact change in hygiene behavior resulting decrease in disease episodes contributing to decrease in health expenditure. Also, the decrease in disease episode is expected to enable the workers to continue work more efficiently and effectively with the possibility of increase in salary and overtime payments. The increase in salary and decrease in health cost creates the possibility of better livelihood. 3.2 The Impact Indicators We already know that the hygiene messages and behavioral change motivations in took place in communities. 93.3 percent of the workers from intervention garments mentioned that they learned about using latrine safely and another 90.4 percent mentioned that they learned to use water safely. Also 75.6 percent workers learned about appropriate hand washing. These messages were also delivered in factories through peer educators (Chapter 2). Data suggest that the workers who received messages at community as well as at factory (73.0%) were more motivated in WASH behavior change.
Proj
ect A
ctiv
ity
Awareness development among garment workers•Awareness raising adevertisement in local TV channel
•Evening sessions on hygiene promotion
•Peer educator in factories
Poss
ible
Cha
nges
Following are the possible changes•Improvement in sanitation hygiene
•Improvement in hand washing practices
•Improvement in MHM management behavior
•Change in WASH expenditure
Poss
ible
Out
puts Folloiwng are the
possible outputs•Decrease in disease episode by water born disease
•Increased capasity to continue work
•Decreased leave days
•Increased productivity
Expe
cted
Out
com
es
Improvement in livelihood and productivity •Decrease in health cost
•Improvement in work hours and overtime
•Increase in salary •Increase in overtime earing

HDRC Endline Study of Improving Access to WASH for Levi’s RMG Workers in Bangladesh Project
26
Among workers in intervention factories, 3.8 percent had sick leave in the month preceding survey which was 6.4 percent among workers in non-intervention factories. Disease episode was reported in 27.3 percent households of workers in intervention factories which is significantly lower compared to such incidence (36.0%) in households of workers in non-intervention factories. Additional information available in Annex Table 86-87.
There is noticeable difference in income and overtime hours. The income among intervention workers and control workers are significantly different and it is higher in among intervention workers. A key contributing factor to the overall income is the earnings from overtime. The time spent for overtime among intervention workers in the month preceding survey is 47.1 hours (in 21 days) which is significantly higher compared to control workers 41.6 hours (in 16 days). The average salary of intervention workers is 3.6 percent higher and earning form overtime is 30.2 percent higher. Additional information available in Annex Table 81-85. 3.3 Overall Impact of the Project activities After project intervention, 34.2 percent of intervention households, which is more than double than the control areas (15.0%), have access to safely managed water sources. The groups of basic services in terms of water sources includes 65.8 percent interventions households which is lower than those of control areas. It is assumed that the reason for the decrease of access to basic water services among the intervention household is for the access of higher number of intervention households than the control group to safely managed water services.
93.2 89.7 90.497.7
92.1 93.384.1
73.3 75.6
Female Male All
Safe water use Toilet use Hand-washing
Figure 3.2: Messages learned from evening sessions by target workers (intervention)
6.43.8
27.3
36
Intervention Control
Figure 3.3: Differences in disease episodes at households and sick days between intervention and control
Workers taking sick leave (%) Disease episodes in HH (%)
HDRC Endline Study of Improving Access to WASH for Levi’s RMG Workers in Bangladesh Project
27
Improving Access to WASH for Levi’s RMG Workers in Bangladesh Project has played a vital role for a significantly successful change in sanitation facilities within the intervention areas compared to the control areas. After the project is over, 17.0 percent intervention households have access to basic sanitation facility while only 6.2 percent control household have this facility. The limited sanitation service includes 76.6 percent intervention households which is lower than the control households (84.4%). Still, 9.4 percent control households, higher than the intervention households (6.4%), exist in unimproved sanitation facility. The percentage of satisfaction for water quality among the intervention and control groups is noted with 99.7 and 77.6 respectively with a significant difference. The intervention household have access to available water for round the year (average 12 months), which is nearly same for the intervention groups (average 11.9 months) with a significant difference. Both the intervention and control households have available water access for almost round the clock. Almost all the intervention households (99.7%) have the facility to get necessary water while 98.1 percent have this opportunity as all the households of both the intervention and control have either safely managed or basic water services and there is no unproved water sources. Our study findings shows that for the case of safe water collection and storage, 19.1 percent intervention households, significantly higher than control groups (4.4%), have followed proper measures. On the other hand, there also exists a significant difference for following water consumption process between intervention and control group. In this regard, 91.1 percent intervention households know the safe and proper process while only 65.8 percent of control group can track this process. Average 5.9 households of intervention areas use a latrine while average 11.3 households of control areas have only a latrine to use. On the other hand, average 15.9 persons of the intervention areas, expressively lower than the control (average 28.0), use only a latrine. Our study shows that, soap is available within 51.5 percent latrines which is significantly higher than control (17.7%). The feaces is safely managed in 98.8 percent intervention latrines and 93.8 percent control latrines. As high as 92.4 percent RMG workers have expressed their satisfaction about the cleanliness of factory latrines, which is significantly higher than control factories (60.8%). Again, 67.7 percent RMG workers, significantly higher than control (39.8%), have reported that they have no problem for using the factory latrines. Separate slippers are available within 99.4 percent intervention latrines which is higher than control (94.7%). Further, soaps are available within 87.6 percent latrines of intervention factories which is significantly higher compared to those of control (65.5%) for hand washing. Our findings also shows that 32.7 percent control household face the water logging problem while only 22.1 percent of intervention face this problem. According to the findings, there is significantly higher facility of handwashing places among the 67.6 percent intervention households than control (36.6%). Among them, 54.3 percent intervention households have their available soap or liquid soap at the hand washing places, which is significantly higher than that of control (22.6%). As high as 42.7 percent intervention households wash both hand after defecation, which is significantly higher than the practice trend of control (6.5%). The project has also achieved a significant success in decreasing the incidents of water borne diseases especially in the intervention areas. The findings show that incident of water borne diseases has taken places for 27.3 percent household members which is significantly lower than the control (36.0%). Further, only 0.08% household members have reported that they have taken day off because of illness while this percentage is 0.12 for control. On the other hand, the monthly average payment received by intervention household was 2,429.4 BDT which is higher than the control (1,866.5 BDT).

HDRC Endline Study of Improving Access to WASH for Levi’s RMG Workers in Bangladesh Project
28
The significant improvement of access to water, sanitation and hygiene including handwashing practices and availability of soap at handwashing places among the intervention areas for both household and factory level might be a direct effect of so many activities executed at the time of project implementation. Firstly, TVC based WASH advertisement has contributed to increase awareness among the intervention areas at the household level. At the intervention household level, 30.9 percent which is significantly higher than control (12.4%) have reported that they have watched the TVC exposure. As high as 57.3 percent of intervention households have mentioned that they have learned about safe water management from the evening sessions. About 59.1 percent have learnt about using toilet appropriately and 47.9 percent have learnt about handwashing from the evening session. At RMG factory level, the engagement of peer educator for awareness build up have played a vital role to achieve significant success. At intervention factory level, 78.2 percent RMG workers have reported that they have received WASH awareness from peer educators. Among them 89.5 percent have opined that they have got knowledge about safe water management and 84.9 percent about using toilets appropriately from peer educator. At last, 71.3 percent have received knowledge on handwashing. Importantly, 46.1 percent RMG female workers have got knowledge on menstrual hygiene management from peer educator while control factories do not have this facility for the RMG workers. Table 3.1: Summary of Indicators
Indicator Measurement Intervention Control Hypothesis p-value
Contributing factor Exposure to TVC based WASH advertisement (in last month) Percentage 30.9 12.4 - 0.0001
Exposure to TVC based WASH advertisement (in last week) Percentage 23.9 6.5 - 0.0001
Expenditure on cleanliness Average 102 72 Higher in intervention 0.0001
Participation in evening sessions by WaterAid Percentage 63.3 0.3 Higher in intervention 0.0001
Learned about safe water and water safety from evening sessions Percentage 57.3 0.3 Higher in
intervention 0.0001
Learned about appropriately using toilet from evening sessions Percentage 59.1 0.3 Higher in
intervention 0.0001
Learned about handwashing from evening sessions Percentage 47.9 0.0 Higher in
intervention 0.0001
Learned about MHM (only females) from evening sessions Percentage 52.2 0.4 Higher in
intervention 0.0001
Water quality is satisfactory Percentage 99.7 77.6 Higher in intervention 0.0001
Adequate knowledge about hand washing* Percentage 67.9 42.8 Higher in intervention 0.0001
Adequate practice of hand washing* Percentage 16.6 14.1 Higher in intervention 0.0001
Problem of waterlogging Percentage 22.1 32.7 - -
Households do not dispose solid waste openly Percentage 3.3 7.4 lower in intervention 0.0093
Outcome Indicators
Days of overtime (last month) Average 21.4 16.5 Higher in intervention 0.0001

HDRC Endline Study of Improving Access to WASH for Levi’s RMG Workers in Bangladesh Project
29
Indicator Measurement Intervention Control Hypothesis p-value
Hours of overtime (last month) Average 47.1 41.6 Higher in intervention 0.008
Months of water access Average 12.00 11.99 Higher in intervention 0.212
Hours of water access Average 23.63 23.86 Higher in intervention 0.512
HHs have necessary water Percentage 99.7 98.1 Higher in intervention 0.0244
HHs follow all safety measures for water storage/collection Percentage 19.1 4.4 Higher in
intervention 0.0001
HHs follow appropriate methods for water consumption Percentage 91.1 65.8 Higher in
intervention 0.0001
The feaces is concealed safely Percentage 98.8 93.8 Higher in intervention 0.0003
Availability of soap in latrine Percentage 51.5 17.7 Higher in intervention 0.0001
HH use a latrine Average 5.9 11.3 Lower in intervention 0.0001
People use a latrine Average 15.9 28.0 Lower in intervention 0.0001
Handwashing place available in HH Percentage 67.6 36.6 Higher in intervention 0.0001
Cleaning agent available in handwashing place Percentage 54.3 22.6 Higher in intervention 0.0001
Proportion of workers reporting no problem in latrine usage in factory Percentage 67.7 39.8 Higher in
intervention 0.0001
Satisfactory cleanliness in factory latrine Percentage 92.4 60.8 Higher in intervention 0.0001
Separate slippers available for latrine in factory Percentage 99.4 94.7 Higher in intervention 0.0004
Soap for handwashing available in latrines of factories Percentage 87.6 65.5 Higher in
intervention 0.0001
Wash one hand with soap and water after defecation Percentage 54.5 81.4 Higher in
intervention 0.0001
Wash both hands with soap and water after defecation Percentage 42.7 6.5 Higher in
intervention 0.0001
Learned awareness from peer educator Percentage 78.2 0.0 - -Learned about safe water and water safety from peer educator Percentage 89.5 - - -
Learned about appropriately using toilet from peer educator Percentage 84.9 - - -
Learned about handwashing from peer educator Percentage 71.3 - - -Learned about MHM (only females) from peer educator Percentage 46.1 - - -
Impact Indicator
Expenditure on health Average 99 117 Lower in intervention 0.589
Payment received for overtime (last month) Average 2429.4 1866.5 Higher in intervention 0.0001
Day off for illness (self or HH member) Average 0.08 0.12 Lower in intervention 0.406
Incidence of water borne disease to self/ HH members Percentage 27.3 36.0 Lower in
intervention 0.0155
*Knows about at least 3 or more critical handwashing time **Always washes hand in at least 3 or more critical handwashing time 3.4 Impact Assessment

HDRC Endline Study of Improving Access to WASH for Levi’s RMG Workers in Bangladesh Project
30
We considered the following as impact indicators from different outcome indicators:
Expenditure on health (as a result of improved access to WASH facilities and hygiene behavior incidence of disease is expected to decrease resulting decrease in health expenditure)
Income (the improved access to WASH facilities and hygiene behavior is expected to enable the workers to take lesser sick days and greater overtime resulting increase in income)
Linear regression was performed to see the impacts of selective outcome and impact variables on the impact indicators- ‘expenditure on health’, ‘payment received for overtime’, ‘day off for illnesses’, and ‘number of disease incidence in household’. For this regression model, ‘watched TVC ad on water, sanitation and hygiene in last one month’; ‘attended sessions on water, sanitation and hygiene arranged by WaterAid’; and ‘received knowledge on water, sanitation and hygiene from peer educator’ were considered as independent variable or predictor variable. Assuming, Y as the dependent variable or response variable and 𝑋 (i = 1, 2, 3) as the independent or explanatory variables for the regression model which can be defined as follows (Table 3.2). Table 3.2: Notation of dependent and explanatory variables used in the regression model
Dependent variable Exploratory Variable Y X X X
Expenditure on health (in taka)/ Payment received for overtime (in taka)/ Day off for illness (in days)/ Number of Disease Incidence in household
Watched TVC ad on water, sanitation and hygiene in last one month
Attended sessions on water, sanitation and hygiene arranged by Water Aid
Received knowledge on water, sanitation and hygiene from peer educator
Here, Y is a continuous variable and 𝑋 are categorized as 𝑋 = 0= do not watch ad 1= watch ad from other channels 2= watch ad on TVC channels 𝑋 = 0=no 1=yes 𝑋 = 0=no 1=yes So, the regression model is-
Y= α+𝛽 𝑋 +𝛽 𝑋 +𝛽 𝑋 -----------------------------(1) Using this regression model, impact as well as statistically significant contribution of the outcome variables on the impact indicators has been explored. Results found are explained below: Expenditure on health ‘Watched TVC ad’ had a statistically significant contribution on expenditure on health. On average those who watch TVC ad on water, sanitation and hygiene expenses 100.1 taka more than those who watch ad on other channels; those who watch TVC ad on water, sanitation and hygiene expenses 200.2 taka more than those who did not watch ad related to water, sanitation and hygiene in last one month (Table 3.3). This is due to their increased concern on health. Other two outcome variables had no statistical significant contribution on health expenditure.

HDRC Endline Study of Improving Access to WASH for Levi’s RMG Workers in Bangladesh Project
31
Table 3.3: Regression coefficients of expenditure on health
Explanatory variable Constant (α) Coefficient (𝜷𝒊) P-value Watched TVC ad on water, sanitation and hygiene in last one month 42.573 100.051 0.000
Attended sessions on water, sanitation and hygiene arranged by Water Aid 42.573 -10.738 0.826
Received knowledge on water, sanitation and hygiene from peer educator 42.573 9.174 0.841
Payment received for overtime
All of the outcome variables had a positive impact on payment received by the respondent for overtime (Table 3.4). However, only peer educator had a statistically significant contribution on the overtime payment. On average those who had a peer educator earned 308.4 more taka than those who did not have a peer educator.
Table 3.4: Regression coefficients of payment received for overtime
Explanatory variable Constant (α) Coefficient (β) P-valueWatched TVC ad on water, sanitation and hygiene in last one month 1890.6 107.2 0.156
Attended sessions on water, sanitation and hygiene arranged by Water Aid 1890.6 67.5 0.687
Received knowledge on water, sanitation and hygiene from peer educator 1890.6 309.7 0.049
Day off for illness
‘Watched TVC ad’ had a statistically significant contribution on day off for self-illness or illness of other household members. On average those who watch TVC advertisement took .058 more days off than those who watch ad on other channels; those who watch TVC ad expenses 0.12 more days off than those who did not watch advertisement related to water, sanitation and hygiene in last one month (Table 2). Other two outcome variables had no statistical significant contribution on day off for illness. Table 3.5: Regression coefficients of day off for self-illness
Explanatory variable Constant (α) Coefficient (β) P-valueWatched TVC ad on water, sanitation and hygiene in last one month .061 .058 .036
Attended sessions on water, sanitation and hygiene arranged by Water Aid .061 .016 .793
Received knowledge on water, sanitation and hygiene from peer educator .061 -.009 .874
Number of Disease Incidence
Though no statistically significant contribution was seen of the outcome variables on number of disease incidence, all of the outcome variables was found to have a negative impact on number of disease incidence in household (Table 3.6).

HDRC Endline Study of Improving Access to WASH for Levi’s RMG Workers in Bangladesh Project
32
Table 3.6: Regression coefficients of number of disease incidence in household
Explanatory variable Constant (α) Coefficient (β) P-valueWatched TVC ad on water, sanitation and hygiene in last one month 1.247 -.001 .975
Attended sessions on water, sanitation and hygiene arranged by Water Aid 1.247 -.032 .826
Received knowledge on water, sanitation and hygiene from peer educator 1.247 -.111 .423
3.5 Effect Size of Envisioned Impact Linear regression was fitted to see the effect size of the selective outcome variables on the impact indicators- ‘expenditure on health’, ‘payment received for overtime’, ‘day off for illnesses’, and ‘number of disease incidence in household’. For this regression model, ‘watched TVC ad on water, sanitation and hygiene in last one month’, ‘attended sessions on water, sanitation and hygiene arranged by wateraid’, and ‘received knowledge on water, sanitation and hygiene from peer educator’ were considered as independent variable or predictor variable separately. Let, Y be the dependent variable or response variable and 𝑋 be the independent or explanatory variables for the regression model which can be defined as follows (Table 7). Table 3.7: Notation of the dependent and explanatory variables used in the regression model
Y 𝑋 𝑋 𝑋 Expenditure on health (in taka)/ Payment received for overtime (in taka)/ Day off for illness (in days)/ Number of Disease Incidence in household
Watched TVC ad on water, sanitation and hygiene in last one month
Attended sessions on water, sanitation and hygiene arranged by Water Aid
Received knowledge on water, sanitation and hygiene from peer educator
Here, Y is a continuous variable and 𝑋 are categorized as 𝑋 = 0= do not watch ad 1= watch ad from other channels 2= watch ad on tvc channels 𝑋 = 0=no 1=yes 𝑋 = 0=no 1=yes So, the regression model can be written as- Y= α+β 𝑋 -------------------------------------------------------------(1) where, i=1,2,3 Using this regression model, effect size as well as statistically significant contribution of the outcome variables on the impact indicators has been explored. Results found are explained below: Expenditure on health None of the outcome variables had significant effect on expenditure on health. However, the effect size was positive for all the outcome variables e.g. those who watch tvc ad related to WAS had more expenditure on health than those who watched other channels or did not watch any ad. This may due to their increased concern on health.

HDRC Endline Study of Improving Access to WASH for Levi’s RMG Workers in Bangladesh Project
33
Explanatory variable Constant (α) Coefficient (𝜷𝒊) P-value Watched TVC ad on water, sanitation and hygiene in last one month 117.3 26.46 0.439 Attended sessions on water, sanitation and hygiene arranged by Water Aid 113.8 28.38 0.560 Received knowledge on water, sanitation and hygiene from peer educator 113.5 23.40 0.612
Payment received for overtime All of the outcome variables had statistically significant effect on ‘payment received for overtime’ at 5% level of significance. On average those who watch TVC ad on water, sanitation and hygiene earned 173.05 taka more than those who watch ad on other channels; those who watch TVC ad on water, sanitation and hygiene expenses earned 346.1 taka more than those who did not watch ad related to water, sanitation and hygiene in last one month. Those who attended sessions on water, sanitation and hygiene arranged by Water Aid earned 339.28 taka more than those who didn’t attend such sessions. Those who received knowledge on water, sanitation and hygiene from peer educator earned 399.93 taka more than those who didn’t receive such knowledge.
Explanatory variable Constant (α) Coefficient (𝜷𝒊) P-value Watched TVC ad on water, sanitation and hygiene in last one month 2050.9 173.05 0.027 Attended sessions on water, sanitation and hygiene arranged by Water Aid 2037.7 339.28 0.007 Received knowledge on water, sanitation and hygiene from peer educator 1985.1 399.93 0.001
Day off for illness None of the outcome variables had statistically significant effect on ‘day off for illness’. Marginally positive effect size was found for all the outcome variables in taking day off for illness.
Explanatory variable Constant (α) Coefficient (𝜷𝒊) P-value Watched TVC ad on water, sanitation and hygiene in last one month 0.108 0.011 0.724 Attended sessions on water, sanitation and hygiene arranged by Water Aid 0.087 0.041 0.369 Received knowledge on water, sanitation and hygiene from peer educator 0.089 0.027 0.534
Number of Disease Incidence None of the outcome variables had statistically significant effect on ‘number of disease incidence’. However, effect size was negative for e.g. on average those who watch TVC ad on water, sanitation and hygiene had less disease incidence than those who watch ad on other channels or who did not watch any ad.

HDRC Endline Study of Improving Access to WASH for Levi’s RMG Workers in Bangladesh Project
34
Explanatory variable Constant (α) Coefficient (𝜷𝒊) P-value Watched TVC ad on water, sanitation and hygiene in last one month 1.232 -0.017 0.787 Attended sessions on water, sanitation and hygiene arranged by Water Aid 1.233 -0.120 0.201 Received knowledge on water, sanitation and hygiene from peer educator 1.245 -0.135 0.134
Effect size of WASH intervention on different outcome level indicators Logit model may be used for the estimation of the functional relationship between dependent and independent variables when the dependent variable is binary. This study used logit model to find out the effectiveness of WASH intervention on different individual outcome. Let, Y be the dependent variable or response variable and X be the independent or explanatory variables for the regression model which can be defined as follows. Table 3.8: Notation of the dependent and explanatory variables used in the regression model
Y X Household have access to safely manage drinking water service/ Household have access to basic sanitation service/ household effectively maintained WSP steps/ household women followed proper menstrual hygiene management
Household received WASH intervention
Y= 0= no 1= yes X= 0= household did’t receive WASH intervention 1= household received WASH intervention So, the basic form of logit regression models can be written as follows7:
P Y = 1|X = --------------------------------------------------------------------------------------- (1)
where, 𝛼 is a scalar parameter, and 𝛽 is 1×1 vector parameter. Using this logistic regression model, effect size as well as statistically significance of the contribution of the different outcome variables has been explored. Results of fitting Logistic Regression Model: Findings from the logistic regression reveal that WASH intervention had a significant contribution on ‘household access to safely manage drinking water service’, ‘household access to basic sanitation service’, ‘household effectively maintained WSP steps’, and ‘household women followed proper menstrual hygiene management’. According to odds ratio, intervention households are more likely to get access to safely manage drinking water service (3.1 times) and 7HosmerJr, D. W., Lemeshow, S., & Sturdivant, R. X. (2013). Applied logistic regression (Vol. 398). John Wiley & Sons.

HDRC Endline Study of Improving Access to WASH for Levi’s RMG Workers in Bangladesh Project
35
basic level sanitation service (2.9 times) than control households. Intervention households are also 2.7 times more likely to effectively maintain Water Safety Plan steps than control households. Further, women in intervention households are 1.8 times more likely to follow proper menstrual hygiene management than women in control households. Table 3.9: Results of fitting logistic model to find out the effect size of WASH intervention on
different outcome level indicators
Response variable (Y) Explanatory variables (X) Reference category p-value eβ (Odds
Ratio)
Household have access to safely manage drinking water service
Household receive WASH intervention No 0.000 3.095
Constant - 0.000 0.066Household have access to basic sanitation service
Household receive WASH intervention No 0.000 2.941
Constant - 0.000 0.177household effectively maintained WSP steps
Household receive WASH intervention No 0.000 2.685
Constant - 0.000 0.181household women followed proper menstrual hygiene management- disposes properly if uses sanitary pad /wash with soap and water, dry under direct sun, and changes within 6 hours if uses rag
Household receive WASH intervention No 0.002 1.760
Constant - 0.000 0.267
3.6 End Remarks
Results suggest that the interventions made significant positive changes in access to WASH and hygiene behavior resulting change in income amount (increase) and expenditure patterns (i.e., less expenses on health, greater expenditure on hygiene products). This is expected to increase the living standards of factory worker in target factories compared to other factories. Among interventions, promotional activities in factory reveal greater results compared to promotional activities at community level. However, the promotional activities at community level complemented and supplemented the promotional activities in factories for factory workers. In addition, since the promotional activities at community level was not limited to workers in intervention factories, it contributed to overall behavior change in community, reaching people beyond target group.
HDRC Endline Study of Improving Access to WASH for Levi’s RMG Workers in Bangladesh Project
36
Annex: Data Tables

HDRC Endline Study of Improving Access to WASH for Levi’s RMG Workers in Bangladesh Project
37
Tabulation for Endline Study of Improving Access to WASH for Levi’s
RMG Workers in Bangladesh Project Respondents Characteristics/Background of Information Table 1. Demographic indicators for surveyed household
Indicators Intervention Control
Surveyed HH Number 330 339 Members of HH 839 870 Household size (average) 2.53 2.54 Sex ratio (Female:Male) 1.18 1.25 Female headed household 23.3 26.8 Households with members having disability (% among HHs) 1.5 0.3
n 330 339
Table 2. Age distribution of the surveyed respondents
Age Range Intervention Control Male Female All Male Female All
15-19 0.8 13.0 3.6 0.8 14.3 4.420-24 11.9 14.3 12.4 8.9 31.9 15.024-29 21.3 39.0 25.5 23.4 22.0 23.030-34 29.2 15.6 26.1 27.8 15.4 24.535-39 19.4 13.0 17.9 14.1 4.4 11.540-44 10.3 1.3 8.2 14.9 7.7 13.045-49 3.2 1.3 2.7 5.6 2.2 4.750-54 1.2 1.3 1.2 2.8 1.1 2.455-59 1.6 0.0 1.2 0.8 1.1 0.960+ 1.2 1.3 1.2 0.8 0.0 0.6
n 253 77 330 248 91 339 Table 3. Marital Status of the respondents
Marital Status Intervention Control Male Female All Male Female All
Unmarried 7.9 24.7 11.8 5.6 31.9 12.7Married 92.1 64.9 85.8 94.0 44.0 80.5Widow 0.0 1.3 0.3 0.4 5.5 1.8Divorced/Separated 0.0 9.1 2.1 0.0 18.7 5.0
n 253 77 330 248 91 339 Table 4. Literacy/education status of the surveyed respondents
Literacy Status/Education Intervention Control Male Female All Male Female All
Can put sign only 15.8 15.6 15.8 22.6 20.9 22.1Read and write only 3.2 1.3 2.7 7.3 2.2 5.9Primary 13.8 16.9 14.5 12.9 23.1 15.6Passed primary 24.5 31.2 26.1 28.6 22.0 26.8Secondary 20.6 28.6 22.4 16.1 22.0 17.7Passed Secondary 12.6 5.2 10.9 5.6 5.5 5.6Passed Higher Secondary 5.9 1.3 4.8 4.4 3.3 4.1Nurani/Arabic 0.0 0.0 0.0 0.4 0.0 0.3No formal education 3.6 0.0 2.7 2.0 1.1 1.8
n 253 77 330 248 91 339
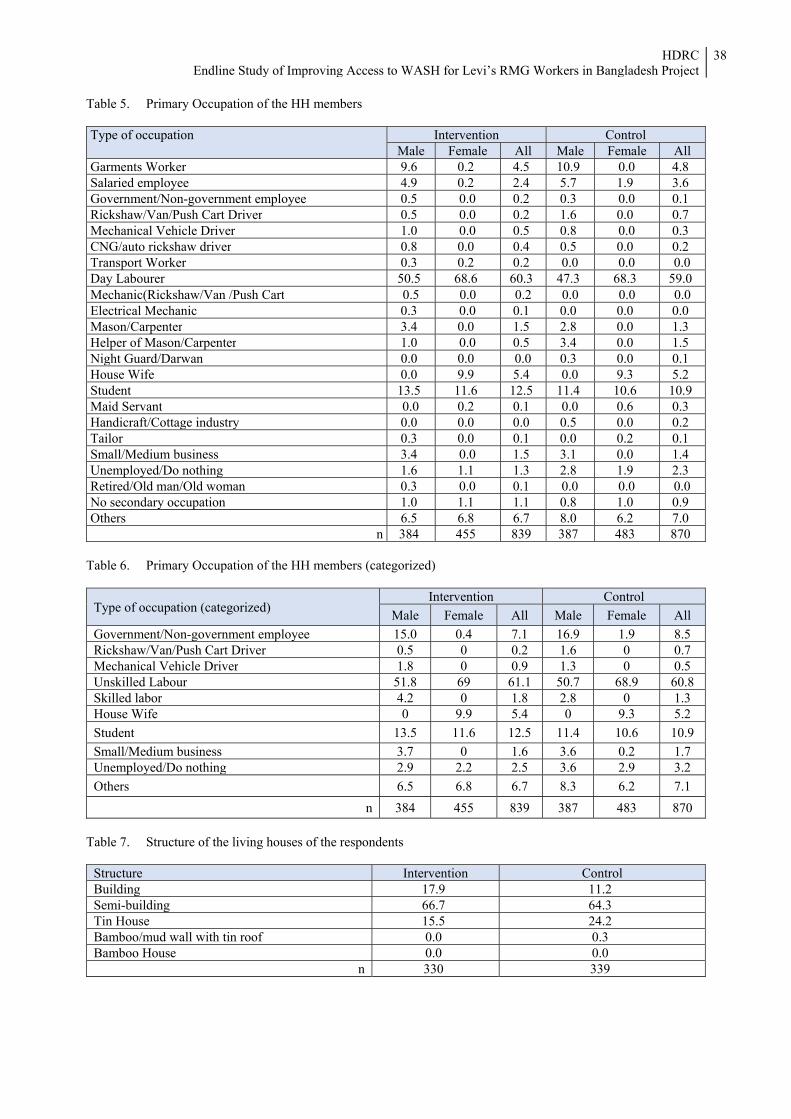
HDRC Endline Study of Improving Access to WASH for Levi’s RMG Workers in Bangladesh Project
38
Table 5. Primary Occupation of the HH members Type of occupation Intervention Control
Male Female All Male Female AllGarments Worker 9.6 0.2 4.5 10.9 0.0 4.8Salaried employee 4.9 0.2 2.4 5.7 1.9 3.6Government/Non-government employee 0.5 0.0 0.2 0.3 0.0 0.1Rickshaw/Van/Push Cart Driver 0.5 0.0 0.2 1.6 0.0 0.7Mechanical Vehicle Driver 1.0 0.0 0.5 0.8 0.0 0.3CNG/auto rickshaw driver 0.8 0.0 0.4 0.5 0.0 0.2Transport Worker 0.3 0.2 0.2 0.0 0.0 0.0Day Labourer 50.5 68.6 60.3 47.3 68.3 59.0 Mechanic(Rickshaw/Van /Push Cart 0.5 0.0 0.2 0.0 0.0 0.0Electrical Mechanic 0.3 0.0 0.1 0.0 0.0 0.0 Mason/Carpenter 3.4 0.0 1.5 2.8 0.0 1.3Helper of Mason/Carpenter 1.0 0.0 0.5 3.4 0.0 1.5Night Guard/Darwan 0.0 0.0 0.0 0.3 0.0 0.1House Wife 0.0 9.9 5.4 0.0 9.3 5.2Student 13.5 11.6 12.5 11.4 10.6 10.9Maid Servant 0.0 0.2 0.1 0.0 0.6 0.3Handicraft/Cottage industry 0.0 0.0 0.0 0.5 0.0 0.2Tailor 0.3 0.0 0.1 0.0 0.2 0.1Small/Medium business 3.4 0.0 1.5 3.1 0.0 1.4Unemployed/Do nothing 1.6 1.1 1.3 2.8 1.9 2.3Retired/Old man/Old woman 0.3 0.0 0.1 0.0 0.0 0.0No secondary occupation 1.0 1.1 1.1 0.8 1.0 0.9Others 6.5 6.8 6.7 8.0 6.2 7.0
n 384 455 839 387 483 870 Table 6. Primary Occupation of the HH members (categorized)
Type of occupation (categorized) Intervention Control
Male Female All Male Female All Government/Non-government employee 15.0 0.4 7.1 16.9 1.9 8.5Rickshaw/Van/Push Cart Driver 0.5 0 0.2 1.6 0 0.7Mechanical Vehicle Driver 1.8 0 0.9 1.3 0 0.5Unskilled Labour 51.8 69 61.1 50.7 68.9 60.8Skilled labor 4.2 0 1.8 2.8 0 1.3House Wife 0 9.9 5.4 0 9.3 5.2Student 13.5 11.6 12.5 11.4 10.6 10.9 Small/Medium business 3.7 0 1.6 3.6 0.2 1.7Unemployed/Do nothing 2.9 2.2 2.5 3.6 2.9 3.2Others 6.5 6.8 6.7 8.3 6.2 7.1
n 384 455 839 387 483 870
Table 7. Structure of the living houses of the respondents
Structure Intervention Control Building 17.9 11.2 Semi-building 66.7 64.3 Tin House 15.5 24.2 Bamboo/mud wall with tin roof 0.0 0.3 Bamboo House 0.0 0.0
n 330 339

HDRC Endline Study of Improving Access to WASH for Levi’s RMG Workers in Bangladesh Project
39
Table 8. Dwelling status of respondents by sex
Living status Intervention ControlMale Female All Male Female All
Alone 22.1 12.3 14.5 28.6 14.5 17.1Together With my several friends 5.2 1.6 2.4 1.6 .4 .6Only Husband and wife 40.3 43.5 42.7 27.0 38.0 36.0Husband/wife and other family members 20.8 30.8 28.5 34.9 32.2 32.7With relatives 10.4 11.1 10.9 7.9 12.7 11.8Others 1.3 .8 .9 0 2.2 1.8n 253 77 330 248 91 339
Table 9. Assets ownership of the Households Level
Asset Intervention Control Electricity/solar power 99.1 99.1 Almirah (wood/steel) 24.5 11.8 Sofa set 0.6 0.9 Chair/table 68.5 51.0 Cot/Bedstead 96.4 96.5 Radio 0.3 1.8 Mobile 98.5 96.5 Television 56.1 47.8 Fridge 24.8 17.1 Water filter/Dispenser 0.3 1.5 Bicycle 1.8 0.6 Motorcycle 0.3 0.6 Average number of asset ownership 4.71 4.25
n 330 339 Table 10. Availability of Mobile phone and smart phone
Availability Intervention Control Male Female All Male Female All
Mobile Phone 98.7 90.1 92.1 96.8 88.0 89.7Smart Phone 51.3 24.1 30.9 37.7 18.9 22.7
Access to Water (household): Table 11. Percentage distribution of key drinking water source
Source of Drinking water Intervention ControlPipeline water inside room/house without water tank 13.0 2.4Pipeline water inside room/house with water tank 87.0 97.6
n 330 339 Table 12. Access to water in terms of SDG service
Type Safely Managed Basic Total nIntervention 34.2 65.8 100 330Control 15.0 85.0 100 339
Table 13. Functionality and availability of water from sources
Functionality and availability Intervention ControlFunctionality 99.7 99.4Availability of water source (Month average) 12.00 11.99Availability of water (Hours average) 23.93 23.89
n 330 339

HDRC Endline Study of Improving Access to WASH for Levi’s RMG Workers in Bangladesh Project
40
Table 14. Responsible person/organization for setting up the water sources
Types of ownership Intervention ControlSelf 0.6 0.3 Owner of house 79.4 99.7 WaterAid 20.0 0.0
n 330 339 Table 15. Standard of water quality
Standard Intervention Control Good 99.7 77.6 Comparatively Good 0.3 17.4 Not good 0.0 5.0
n 330 339 Table 16. Reasons for not having good water quality (%)
Reasons Intervention ControlExistence of Arsenic *(0) 0.0Excessive iron *(1) 7.9Salty 7.9Contaminated/not transparent *(1) 31.6Bad smell 67.1Germs exists in water 50.0Others 1.3
n 1 76*Brackets contains number Table 17. Water Intervention for safe drinking water
Indicators Intervention ControlWater Intervention (%) 0.0 5.9
n 330 339Water Intervention Process Boiling water - 65.0Adding Bleaching/ chlorine - 0.0Through cloth setting stones - 0.0By filtering - 30.0By settling down water - 5.0
n 0 20 Table 18. Availability of water at water source, Water Source distance, time required to collect water, and
adequate water collection
Indicators Intervention ControlAverage distance of water point (in feet) 2.17 3.10Water point within 20 feet (%) 97.0 99.7Require less than 30 minutes to collect water 100.0 100.0Can collect adequate drinking water 99.1 98.2Can collect adequate water for other chores 99.7 98.2
n 330 339

HDRC Endline Study of Improving Access to WASH for Levi’s RMG Workers in Bangladesh Project
41
Table 19. Procedure maintained at time of drinking water collection, storage and consumption \
Indicators Intervention ControlWater pot is cleaned during water collection 53.3 24.5Water pot is covered during water collection 40.3 10.6Water pot is covered during water transportation 51.2 16.2Water pot is covered during water preservation 88.5 58.1Preserve water in a high place 27.0 11.2Water glass/mug is cleaned during drinking or serving water 60.9 27.7Steps maintained 19.1 4.4
n 330 339 Table 20. Table 36: Status of Water Tap \
Status Intervention ControlThere is unclean environment/condition around the water tap 25.1 58.6The drain connected to the water tap is cracked/broken or accumulated filth/garbage 18.0 48.3Water accumulates on the platform of water tap 17.0 48.3There is crack in the platform of the water tap 19.8 32.3The water tap is fixed with a concert wall 94.7 90.9The pipe of the water tap is exposed 28.8 58.0Meter attachment with water Tap 2.5 3.6The overall condition of the platform of the water tap is bad 52.6 78.2The overall condition of the drainage system of the water tap platform is bad 51.4 77.6
n 330 339
Access to Sanitation (household)
Table 21. Access to Sanitation according to SDG Services \
Type Basic Limited Unimproved n Intervention 17.0 76.6 6.4 330 Control 6.2 84.4 9.4 339
Note: If feaces is disposed in open space (ditch, open drain etc.), we consider it as unimproved Table 22. Types of household latrines
\ Types of Latrines Intervention Control Flush to septic tank 0.6 1.8 Flush to septic hole/latrine 93.0 88.8 Pit latrine with slab 1.2 0.3 Improved latrines/Total 94.8 90.8
n 330 339 Flush to other place 1.5 6.8 Flush to drainage system 3.3 2.1 Pit latrine without slab 0.3 0.3 Unimproved/Total 5.2 9.2
n 330 339 Table 23. Status of Shared Latrine Use \
Shared latrine statistics Intervention Control Household doesn’t share latrine with others 17.6 8.3 Latrine jointly used with other HH 81.2 91.7 Latrines are open for all 1.2 0.0 n 330 339 Average Number of HH use Latrines 5.85 15.90 Average number of person use latrines 11.28 28.00 N 272 311

HDRC Endline Study of Improving Access to WASH for Levi’s RMG Workers in Bangladesh Project
42
Table 24. Ownership of the Latrines
Ownership Types Intervention Control Self 0.6 0.6 Owner of the house 93.6 97.6 Joint ownership 0.3 0.9 Community 3.3 0.9 Others 2.1 Total 100.0 100.0 N 330 339
Table 25. Responsible person/organization for Latrine set up
Ownership Types Intervention ControlSelf 0.6 0.6 Ownership of the house 80.6 97.6Pourashava/Municipality 0.0 0.6 Union Parishad (UP) 0.0 0.3 NGO 0.3 0.0 WaterAid 18.5 0.9 N 330 339
Table 26. Types of Latrine Maintenance
Maintenance Intervention Control Repairing/maintenance 0.0 0.3 Tank filled up with feaces/Tank clean 1.2 6.2 Set up new latrines 0.3 0.6 Not necessary 98.2 92.9 Others 0.3 0.0 Total 100.0 100.0 N 330 339
Table 27. Average Latrine maintenance Cost Average
Ownership Types Intervention Control Cost Average (Take) 29.80 102.17 N 5 24
Table 28. Location of Latrines
Ownership Types Intervention Control Inside room/house 23.6 4.1 Beside room/house 44.2 33.9 Inside house area/premises 30.0 61.7 Outside house area/premises 2.1 0.3 Total 100.0 100.0 N 330 339
Table 29. Attachment status of Latrine pipeline
Location of feaces disposal Intervention Control Open Space (river/canal/pond/open space) 1.2 5.0 Safe/septic hole/septic tank 95.5 92.9 Swearage line through pipeline 3.3 0.9 Others 0.0 1.2 Total 100.0 100.0 N 330 339

HDRC Endline Study of Improving Access to WASH for Levi’s RMG Workers in Bangladesh Project
43
Table 30. Latrine status in terms of distance, availability of soap and water
Status of latrine characteristics Intervention Control Distance of latrine from HH (Average) 8.90 19.68 HH has latrine within 20 feet 94.8 85.8 Soap inside latrine 51.5 17.7 Availability of water inside latrine 95.8 91.4 Total 100.0 100.0 N 330 339
Table 31. Overall condition of latrines
Condition of latrines Intervention ControlVisibility of feaces inside latrines or pan on Slab 8.5 17.7Visibility of Mosquito/insects 15.5 21.5Bad smell from latrines 21.5 48.1Latrines are open or attached to canal/pond/ditches/river/open space 2.4 5.9Others 25.5 12.1N 330 339
Table 32. Usability status of latrines by children/women and physically challenged persons
Usability status Intervention Control For childern 71.5 38.1 For women 99.4 98.2 Physically challenge persons 36.7 22.4 For elderly people 71.5 39.2 N 330 339
Table 33. Defecation place of Under-5 children of households
Defecation place of Under-5 children Intervention ControlUse HH latrine 52.1 58.1Use Specific pot 33.3 30.6No specific place/inside the HH premises 14.6 11.3
n 48 62 Table 34. Disposal place of faeces of Under-5 children
Disposal place Intervention ControlDispose in the HH latrine 95.7 84.6No specific place/in the premises 4.3 11.5Washed with tubewell/tap water 0.0 3.8
n 23 26 Table 35. Cleaning Places for the Children used cloth/ Nappies /Langot
Cleaning Places Intervention ControlTube-well 4.8 0.0Piped water inside the latrine 78.6 72.3Piped water for household use 16.7 27.7No specific place 4.8 0.0
n 42 47

HDRC Endline Study of Improving Access to WASH for Levi’s RMG Workers in Bangladesh Project
44
Water and Sanitation Status in Factories Table 36. Main sources of drinking water at RMG Factories
Sources Intervention Control Supply water 56.1 74.0 Tube-well 0.9 0.3 Filter water 43.0 25.1 Others 0.0 0.6 N 330 339
Table 37. Improvement types of drinking water at RMG Factories
Steps for Safe drinking water Intervention ControlIncrease number of filter water or availability of water 67.9 23.6Set up new tube-wells 3.3 Management of drinking water on every floor 69.7 36.9Arrangement of free arsenic water 33.6 11.5Others 44.2N 330 339
Table 38. Type of Sanitary latrines at factories
Types of latrines Intervention Control Latrines with septic tank 100.0 99.1 Others 0.0 .9 N 330 339
Table 39. Improvement types of Sanitation at RMG Factories
Improvements Intervention ControlNumber of latrines has increased 18.2 5.3Arrangement of single sex based latrines 40.3 25.7Regular toilet cleaning 41.5 25.1Others 44.0N 330 339
Table 40. Status of Single sex latrines (for women)
Status Intervention ControlAvailability of female toilets 99.4 97.9Total number of toilet chambers for female use 39.1 63.9Average Number women use these chamber in a shift 29,0 424.5
Table 41. Problems faced by respondents
Types of Problems Intervention ControlNeed to wait for using toilet 19.8 46.1Soap is not always available 15.5 41.6Water is not always available 2.7 21.4Slipper is not always available 4.9 28.6Face problem at time of MHM 9.1 19.9It gets late to repair anything 3.0 19.3No problem 67.7 39.8Others 0.3 0.3N 328 332

HDRC Endline Study of Improving Access to WASH for Levi’s RMG Workers in Bangladesh Project
45
Table 42. Cleaning Status of the latrines
Status Intervention ControlVery good 25.8 4.7 Good 66.7 56.0 Considerably well 7.6 34.8 Bad 0.0 4.4 Very bad 0.0 0.0 N 330 339
Table 43. Frequency of cleaning the latrines
Frequency Intervention Control Daily 86.4 91.2 Twice in a week 12.1 4.4 Three times in a week 0.9 2.4 Four time in a week 0.3 1.2 Others 0.3 0.3 N 330 339
Table 44. Availability of slipper for using in latrines
Indicators Intervention Control Availability of slipper 99.4 94.7 n 330 339
Table 45. Hygiene Improvements in the toilets
Types of improvements Intervention ControlArrangement of soap 77.0 33.0Availability of tissue papers 13.0 .6Availability of towel or cloth 34.8 9.4Availability of bin for waste disposal 93.3 41.6Others 0.6 44.0N 330 339
Table 46. Latrine status with availability of various hygiene facilities
Types of improvements Intervention ControlUse of Sandal/slipper 100.0 92.6Availability of soap 87.6 65.5Availability of water 99.4 99.4Handwashing management within 10 feet of latrines 99.7 97.9Availability of soap and water 99.7 86.7N 330 339
Table 47. Sanitation practices by respondents of the factories
Practices Intervention ControlUse of Sandal/slipper 100.0 88.7Handwashing after defecation Do not wash hands 1.2 6.7Wash hands only with water 13.5 36.7Only one hand with soap and water 67.8 46.8Both hands with soap and water 17.5 9.8N 330 339

HDRC Endline Study of Improving Access to WASH for Levi’s RMG Workers in Bangladesh Project
46
Hygiene Facility and Practice (household) Table 48. Handwashing facility among HH in terms of SDG service level
Ownership Types Basic Limited No Facility n Intervention 36.7 30.9 32.4 330 Control 8.3 28.3 63.4 339
Table 49. Handwashing Knowledge among at Proper time/Occasions across
Time/occasion Intervention Control After defecation 99.4 99.4 After rinsing child’s excreta 64.2 45.7 Before eating 80.3 62.5 Before cooking 23.0 18.6 Before Feeding Child 13.0 3.2 N 330 339
Table 50. Handwashing Practice at Proper time/Occasions
Time/occasion Intervention Control After defecation 75.2 62.8 After rinsing child’s excreta 11.8 9.4 Before eating 35.2 19.8 Before cooking 10.9 14.5 Before Feeding Child 7.0 3.8 N 330 339
Table 51. Handwashing Practice at Proper time/Occasions across
Time/occasion Intervention ControlSpecial handwashing place at HH 67.6 36.6N 330 339 Handwashing place within latrines 99.6 91.1Handwashing place within 10 feet of latrine 93.7 75.0N 223 124
Table 52. Availability facility of handwashing place
Handwashing place Intervention ControlBasin with tap 78.0 87.1Bucket with full water 21.1 8.9 Jar with/vessel full water 0.9 1.6 Other 0.0 2.4 N 223 124
Table 53. Availability of handwashing agents
Handwashing agents Intervention ControlNothing 45.7 77.4Soap 50.7 21.8Powder/ soap dust 1.8 0.8 Liquid soap 1.8 0.0 N 223 124

HDRC Endline Study of Improving Access to WASH for Levi’s RMG Workers in Bangladesh Project
47
Table 54. Overall Knowledge of the respondents by the consequence of unhygienic practice
Consequence of unhygienic practice Intervention ControlDiarrhea/dysentery 73.3 64.0Spread out of water borne disease 26.1 13.3Spread out of germs of diseases thorough flies or mosquito 38.5 29.2Epidemic of disease 4.5 4.1Financial loss due to medical intervention if fallen ill 9.7 3.2Work day loss if fallen ill 10.9 4.1Environment of the area polluted 26.4 21.2Bad smell spreads all around 49.1 33.6Others 13.0 20.9N 330 339
Waste Management
Table 55. Places for HH waste disposal
Place Intervention ControlOwn land 0.3 0.0 Beside the road/open place 0.3 2.7 Dustbin/ public trash service/waste disposal van 96.7 92.6Burn 0.9 Throw in ditch or pond nearby 1.8 4.7 N 330 339
Table 56. Status of waste disposal places
Time/occasion Intervention Control Cost for waste disposal 89.7 91.2 N 330 339 Average cost for waste disposal 51.13 49.27 N 296 309 Dustbin within 100 feet 63.3 79.6 Water logging within 100 feet of HH 22.1 32.7 Drain available nearer the HH 17.0 16.5 Drain with cover 81.4 77.2 Drain packed with dirty water and waste 44.1 84.2
Menstrual Hygiene Management (Household)
Table 57. Use of MHM Materials among the HH female segregated by Adolescent and Women
Type
Adolescent (10-19) Women (20-49)
Reus
able
M
ater
ials
(Clo
th)
Disp
osab
le
sani
tary
nap
kin
Cotto
n/Ti
ssue
pa
per
N
othi
ng
n
Reus
able
M
ater
ials
(Clo
th)
Disp
osab
le
sani
tary
nap
kin
Cotto
n/Ti
ssue
pa
per
N
othi
ng
Oth
ers
n
Intervention 53.2 46.8 0.0 0.0 47 70.6 28.2 0.0 0.0 1.2 255Control 63.3 36.7 0.0 0.0 60 81.8 17.0 0.4 0.4 0.4 247
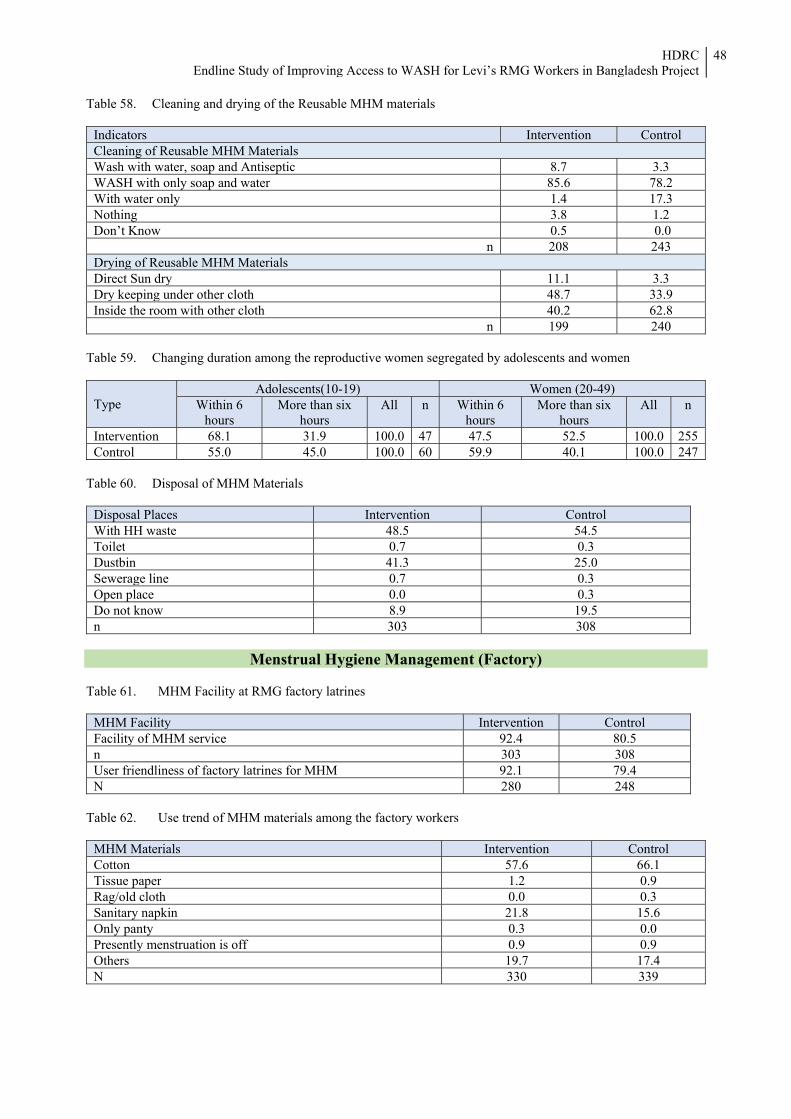
HDRC Endline Study of Improving Access to WASH for Levi’s RMG Workers in Bangladesh Project
48
Table 58. Cleaning and drying of the Reusable MHM materials
Indicators Intervention ControlCleaning of Reusable MHM Materials Wash with water, soap and Antiseptic 8.7 3.3WASH with only soap and water 85.6 78.2With water only 1.4 17.3Nothing 3.8 1.2Don’t Know 0.5 0.0
n 208 243Drying of Reusable MHM Materials Direct Sun dry 11.1 3.3Dry keeping under other cloth 48.7 33.9Inside the room with other cloth 40.2 62.8
n 199 240 Table 59. Changing duration among the reproductive women segregated by adolescents and women
Type Adolescents(10-19) Women (20-49)
Within 6 hours
More than six hours
All n Within 6 hours
More than six hours
All n
Intervention 68.1 31.9 100.0 47 47.5 52.5 100.0 255Control 55.0 45.0 100.0 60 59.9 40.1 100.0 247
Table 60. Disposal of MHM Materials
Menstrual Hygiene Management (Factory)
Table 61. MHM Facility at RMG factory latrines
MHM Facility Intervention Control Facility of MHM service 92.4 80.5 n 303 308 User friendliness of factory latrines for MHM 92.1 79.4 N 280 248
Table 62. Use trend of MHM materials among the factory workers
MHM Materials Intervention ControlCotton 57.6 66.1Tissue paper 1.2 0.9Rag/old cloth 0.0 0.3Sanitary napkin 21.8 15.6Only panty 0.3 0.0Presently menstruation is off 0.9 0.9Others 19.7 17.4N 330 339
Disposal Places Intervention Control With HH waste 48.5 54.5 Toilet 0.7 0.3 Dustbin 41.3 25.0 Sewerage line 0.7 0.3 Open place 0.0 0.3 Do not know 8.9 19.5 n 303 308

HDRC Endline Study of Improving Access to WASH for Levi’s RMG Workers in Bangladesh Project
49
Table 63. Cost about MHM materials
Cost of MHM Materials Intervention ControlAverage cost for sanitary napkin 73.96 78.69Average Cost for Cotton 72.21 75.03Average Cost for tissue paper 72.82 73.46N 142 119
Table 64. Disposal of Sanitary napkin at factories
Disposal of MHM Materials Intervention ControlSpecific place for disposal of sanitary napkin 76.8 67.2Alternative ways if no place is available for napkin disposal Dust bin 3.0 12.8Drain 0.0 2.6Others 97.0 87.2N 33 39
Table 65. Steps taken in case of need to change the used MHM materials at factories
Steps Intervention ControlWashed in factory and bring home 22.1 34.5Bring it home without washing 8.5 5.3Dispose of 33.6 25.7Do nothing 15.5 16.2Others 20.3 18.3N 330 339
Participation in Promotional Activities of WaterAid
Table 66. Trend of Watching Television among household members
Television watching status Intervention Control Male Female All Male Female All
Yes 75.3 79.8 78.8 85.7 74.6 76.7No 24.7 20.2 21.2 14.3 25.4 23.3
Table 67. Exposer to TV Channel based WASH advertisement (in last month)
Exposure Intervention Control Male Female All Male Female All
TVC channel 32.8 41.1 39.2 16.7 16.0 16.2Other Channel 17.2 25.7 23.8 27.8 35.0 33.5No 50.0 33.2 36.9 55.6 49.0 50.4
Table 68. Exposer to TV Channel based WASH advertisement (in last week)
Exposure Intervention Control Male Female All Male Female All
TVC channel 25.9 31.7 30.4 7.4 8.7 8.5Other Channel 17.2 20.8 20.0 16.7 27.7 25.4No 56.9 47.5 49.6 75.9 63.6 66.2
Table 69. Distribution of workers ever participated in WaterAid Evening Session
Indicators Intervention Control Female Male All Female Male All
Participation 57.1 65.2 63.3 0.0 0.0n 77 253 330 63 276 339

HDRC Endline Study of Improving Access to WASH for Levi’s RMG Workers in Bangladesh Project
50
Table 70. Distribution of workers participated in WaterAid Evening Session (within six months)
Incidence of participation Intervention Control Female Male All Female Male All
0 63.6 48.6 52.1 100.0 100.0 100.01 13.0 17.0 16.1 2 16.9 20.2 19.4 3 2.6 9.1 7.6 4 or more 3.9 5.1 4.8
n 77 253 330 63 276 339 Table 71. Familiarization of peer educators
Steps Intervention ControlFamiliar with peer educators 78.2 2.4
Learning/Knowledge from Peer Educator Table 72. Leaning topics from peer educators
Leaning topics from peer educators Intervention ControlAbout Safe water 89.5 -About use of latrines 84.9 -About handwashing 71.3 -About MHM 46.1 -
Table 73. Learning topics about safe drinking water from peer educator
Learning about safe drinking water Intervention ControlAbout drinking Safe water 84.4 - About water borne diseases 73.6 - About covering water pot 61.9 - About water treating 28.1 -
Table 74. Learning topics about use of toilets from peer educator
Learning about use of toilet Intervention ControlAbout related issue of using toilets 73.1 -About use of slipper in toilets 83.1 -About handwashing after toilet 59.8 -
Table 75. Learning topics about handwashing from peer educator
Learning about use of handwashing Intervention ControlAbout handwashing issues 73.4 -About times/occasions of handwashing 84.8 -About necessity of handwashing 58.2 -Others 1.6 -
Table 76. Learning topics about MHM from peer educator
Learning about MHM Intervention ControlMenstrual management 68.9 -About changes of napkin 53.8 -About the wash of MHM materials 87.4 -About general knowledge on MHM 42.9 -

HDRC Endline Study of Improving Access to WASH for Levi’s RMG Workers in Bangladesh Project
51
Impact Assessment
Table 77. Learning issues from the sessions in society
Indicators Intervention Control
Female Male All Female Male AllSafe water use 93.2 89.7 90.4 - - -Toilet use 97.7 92.1 93.3 - - Hand-washing 84.1 73.3 75.6 - - -MHM 11.4 63.0 52.2 - - -Other cleanliness 15.9 11.5 12.4 - - -
n 44 165 209 - - - Table 78. Average expenditures by sectors and type of area
Sectors Intervention Control Intervention and Medicine 147.31 98.92 Water bill/expenses 0.21 0.32 Toilet expenses 7.16 7.37 Waste management expenses 45.47 45.04 Hygiene expenses 72.01 101.55 Total expenditure 272.16 253.21
n 330 339 Table 79. Average working hour at factories
Indictor Intervention Control Average working hour 9.06 8.80
n 330 339 Table 80. Average Overtime days and hours (in a month)
Overtime Intervention Control Average overtime days 20.86 16.35 Average Overtime hours 47.11 41.59
n 330 339 Table 81. Monthly salary and income from overtime hours
Income source Intervention Control Average salaly amount 11042.45 10656.63Average income from Overtime 2429.41 1866.47
n 330 339 Table 82. Distribution of workers according to the salary range
Salary range Intervention Control Less than 7000 1.5 1.8 7000-9999 27.0 42.2 10000-12999 56.4 44.2 13000-15999 13.6 9.1 16000+ 1.5 2.7 Average salary 11042.45 10689.08
n 330 339

HDRC Endline Study of Improving Access to WASH for Levi’s RMG Workers in Bangladesh Project
52
Table 83. Distribution of workers according to the income from Overtime
Income range Intervention ControlLess than 2000 29.4 51.92000-2999 45.2 27.13000-3999 17.3 10.94000-4999 5.8 6.8 5000-5999 1.2 2.4 6000-6999 0.0 0.9 7000 or more 1.2 0.0 Average income from overtime 2429.41 1866.47
n 330 339 Table 84. Distribution of workers having sick leave in the last month
Sick leave Intervention Control Female Male All Female Male All
Workers with sick leave (%) 1.6 4.3 3.8 3.9 7.1 6.4Average sick leave days 0.02 0.10 0.08 0.06 0.13 0.12
n 63 276 339 77 253 330
Table 85. Distribution of household members suffered from any diseases in the last three months
Disease Episode Intervention ControlAt least one household members suffered from any Disease (%) 27.3 36.0Average no. of household members suffered from disease 0.32 0.44
n 330 339Types of waterborne diseases suffered by household membersHepatitis A 0.0 0.0Jaundice 2.1 1.5Typhoid 0.0 0.0Dysentery 3.1 8.4Diarrhea 5.2 13.0Cholera 0.0 0.0Flu-like symptoms 0.0 0.8Malaria 0.0 0.0Dengue 0.0 1.5Arsenicosis 0.0 0.0Skin disease 1.0 0.8
n 96 131
Table 86. Types of Health care/Service received
Health Care source Intervention ControlMBBS Doctor 15.6 15.3Hospital/clinic 3.1 5.3NGO clinic 0.0 0.0Quack/village practioneer 14.6 2.3Pharmacy 61.5 72.5Homeopathic doctor 1.0 1.5Ayurvedic practioner 0.0 0.0Thana/Upazilla Healthcare centre/comple 1.0 0.0Others 1.0 2.3No health care services received 2.1 0.8
n 96 131

HDRC Endline Study of Improving Access to WASH for Levi’s RMG Workers in Bangladesh Project
53
Table 87. Effects for suffering from diseases (among household members affected from disease)
Effects Intervention ControlAverage suffering days 5.00 5.62Average expenses for disease 606.01 860.27Loss of working days 0.66 1.11Economic loss 229.14 284.83
n 96 131
Table 88. Effects for suffering from diseases (among all household members)
Indicators Intervention ControlAverage suffering days 0.59 0.78Average expenses for disease 77.24 120.57Loss of working days 0.06 0.14Economic loss 18.59 33.19
n 839 870