end-to-end demonstrator for improved decision-making...
TRANSCRIPT

EDgE
End-to-end Demonstrator for improved
decision-making in the water sector in Europe
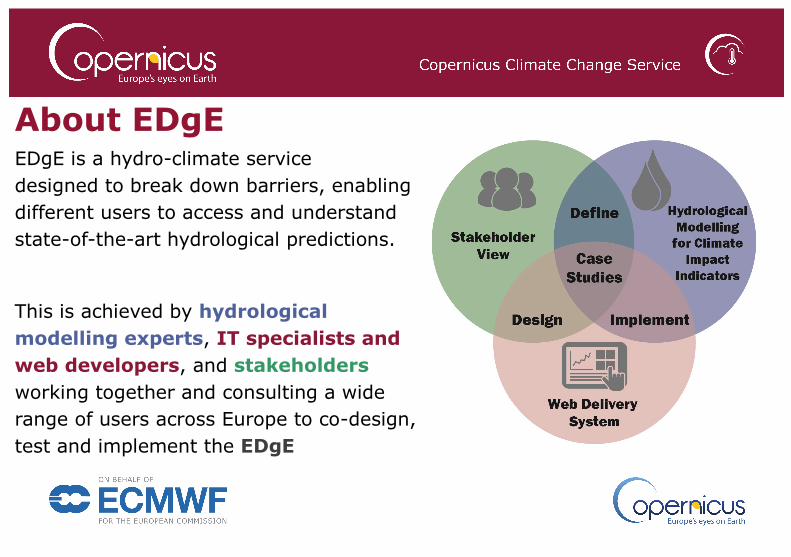
About EDgE EDgE is a hydro-climate service
designed to break down barriers, enabling
different users to access and understand
state-of-the-art hydrological predictions.
This is achieved by hydrological
modelling experts, IT specialists and
web developers, and stakeholders
working together and consulting a wide
range of users across Europe to co-design,
test and implement the EDgE

EDgE focus groups
Focus groups have been established to identify
stakeholder needs across different hydro-
climatic regions and audiences. They are
meeting four times during the project: to share
their hydro-climate service needs, to co-design
and test a web-based information service, and
to support the development of user guidance
and the implementation of the final service.
Spain
The Spanish focus group is concerned with
multiple water uses in a water-scarce
environment and focuses on operational water
resource management in the Jucar basin.
Norway
EDgE has two focus groups in Norway, one is
focused on the hydropower industry, the other a
local authority.
UK
The UK focus group is concerned with long-term
planning under climate change and water use
pressures and focuses on the public water supply
industry.

The EDgE modelling chain is a modular system of
four state-of-the-art hydrological models at 5km
resolution, and associated pre- and post-processing
scripts that enable hydrologic indicators to be derived
from any climate seasonal forecasting data.
The seasonal forecasting modelling chain delivers
an ensemble of hydro-climate re-forecast data:
Monthly time series of gridded tECVs
for selected years as NetCDF files
Probabilistic indicators aggregated
in time and space for one to six month
lead times as NetCDF / .csv files
Skill and uncertainty metrics

1. Select the
initialisation
year and month
2. Select the
indicator of
interest (e.g.
relative change
in streamflow)
3. Select
Climate Models
to include in the
ensemble
4. Select
Hydrological
Models to
include in the
ensemble
7. Adjust the
transparency to
only show results
within an
acceptable limit
of confidence
6. Click a point on
the map to display
a graph of the
distribution of
quintiles at each
lead time for that
point, along with
the quintile given
by the E-OBS data
for the month
5. Animate, or step
through the re-
forecasts at
different lead times
8. Adjust the
catchment size to
show data for
catchments
greater than the
given area
(streamflow only)

The EDgE modelling chain is a modular system of
four state-of-the-art hydrological models at 5km
resolution, and associated pre- and post-processing
scripts that enable hydrologic indicators to be derived
from any climate projection data.
The climate projection modelling chain delivers an
ensemble of hydro-climate data:
Daily / monthly time series
(1971-2099) of gridded tECVs
as NetCDF files
Indicators of changes
aggregated in time and space

1. Select the
indicator of
interest (e.g.
relative change
in monthly mean
streamflow)
2. Select
Representative
Concentration
Pathway (RCP)
3. Select Global
Climate Models
(GCMs) to
include in the
ensemble
7. Adjust the colour
bar and scale of the
map to highlight
changes of different
magnitudes
6. Click a point on
the map to display
a graph of the
projected change
in selected
indicator over
time for multiple
RCPs, with
uncertainty
bounds
4. Select
Hydrological
Models to include
in the ensemble
5. Animate, or step
through the
different projected
time horizons
8. Adjust the
catchment size to
show data for
catchments
greater than the
given area
(streamflow only)
