employment potential of renewable energy in …projects.gibb.co.za/portals/3/projects/200911...
TRANSCRIPT
Employment Potential of
Renewable Energy
In South Africa
14 November 2003
AGAMA Energy (Pty) Ltd, P O Box 606, Constantia, 7848
Prepared for
The Sustainable Energy and Climate Change Partnership
Johannesburg
Employment potential of Renewable Energy in South Africa SECCP
AGAMA Energy (Pty) Ltd 14 November 2003
i
Contributors to the study AGAMA Energy (Pty) Ltd Greg Austin Anthony Williams Glynn Morris Sustainable Solutions Randall Spalding-Fecher Earthlife Africa Richard Worthington Contact details AGAMA Energy (Pty) Ltd PO Box 606, Constantia, 7848 Telephone: 021 7017052 Facsimile: 021 7017056 Email: [email protected] www.agama.co.za Of necessity, many people are involved in preparing a wide-ranging report such as this. We thank all the participants at the two seminars for their valuable contributions, as well as all those who responded by email or telephone. A particular thank you to Johann Basson (Africon International) and Denis Tomlinson (Illovo Sugar) for their additional reviews and commentary on the report.
Employment potential of Renewable Energy in South Africa SECCP
AGAMA Energy (Pty) Ltd 14 November 2003
ii
Summary of key conclusions The basic finding of the study is that renewable energy technologies offer a quantifiable potential for creating and sustaining new and decentralised employment in South Africa, which can offset some of the employment attrition that is a current trend in the conventional energy sectors. The calculated levels of employment, as a consequence of three different levels of integration of renewable energy within the requirements for investment for new capacity in the energy sector, are set out below. The most important conclusion arising from the study is that the South African economy needs a higher target for Renewable Energy than the one currently outlined in the Draft White Paper on Renewable Energy, in order to derive the maximum employment benefits – not just in terms of total jobs but also in terms of job/TWh. This point is shown graphically in Figure 3 below. Furthermore, the degree of local manufacture is not an arbitrary one but is directly related to the magnitude of thetarget. In addition, the SA Government can stimulate massive employment gains fairly quickly and easily in the SWH and biofuels sectors – the non-electricity RE sectors. These can show good returns on limited Government investment even in the very short term. Renewable energy electricity technologies are very important, but require much more investment both in money and in skills training, and consequently more planning is required for these options. This is a significant differentiation since the RE debate iseasily diverted onto a focus on PV and wind and concerns regarding initial high costs dominate the debate. A final, high level conclusion is that outputs of this study should be integrated into the Integrated Energy Planning (IEP) process to ensure outcomes that are in society’s best interests – one of the main goals of this study was to provide a key input into theenergy planning process that has simply been missing. It is important that this new data be incorporated in all the processes leading up to the difficult investment decisions that are required.
EXECUTIVE SUMMARY
Introduction
This report presents the findings of a research study into the longer-term impacts on employment in South Africa that would result from Government commitments to developing Renewable Energy Technologies (RETs) for a more sustainable energy supply for the economy. The study quantifies and characterises the direct jobs that could be created in South Africa through implementation of wind, solar and bioenergy for both electricity generation and thermal/transport energy services. The study draws comparisons with employment associated with conventional energy sources such as coal, nuclear and natural gas. Also reported is an analysis of the range of skills required in producing and servicing RETs, and health and safety factors. The study also considers the issue of a shift in employment levels in the coal industry and the renewable energy industry. The study was undertaken by AGAMA Energy on behalf of the Sustainable Energy and Climate Change Partnership (SECCP), a partnership comprising Earthlife Africa (Johannesburg) and Worldwide Fund for Nature (Denmark).
Employment potential of Renewable Energy in South Africa SECCP
AGAMA Energy (Pty) Ltd 14 November 2003
iii
The context
Increasing demand for energy capacity The South African energy economy requires new energy capacity. Projections indicate that electricity demand will outstrip the baseload capacity within a few years. Consequently, investment in new capacity is required and it is appropriate to evaluate the options (and opportunity costs) of different supply options.
Global climate change The global trend to more environmentally sustainable energy production – to mitigate the effects of global climate change - is increasingly relevant for stakeholders in South Africa with interests in the world markets given the highly energy intensive nature of the South African economy and the dirty coal burned in electricity production. However, despite the inherent logic of this strong externally-driven imperative, the broader social and economic dimensions of energy services in South Africa’s developing economy, such as access to energy services and affordability, may outweigh the environmental implications of climate change as a consequence of carbon-based energy economy.
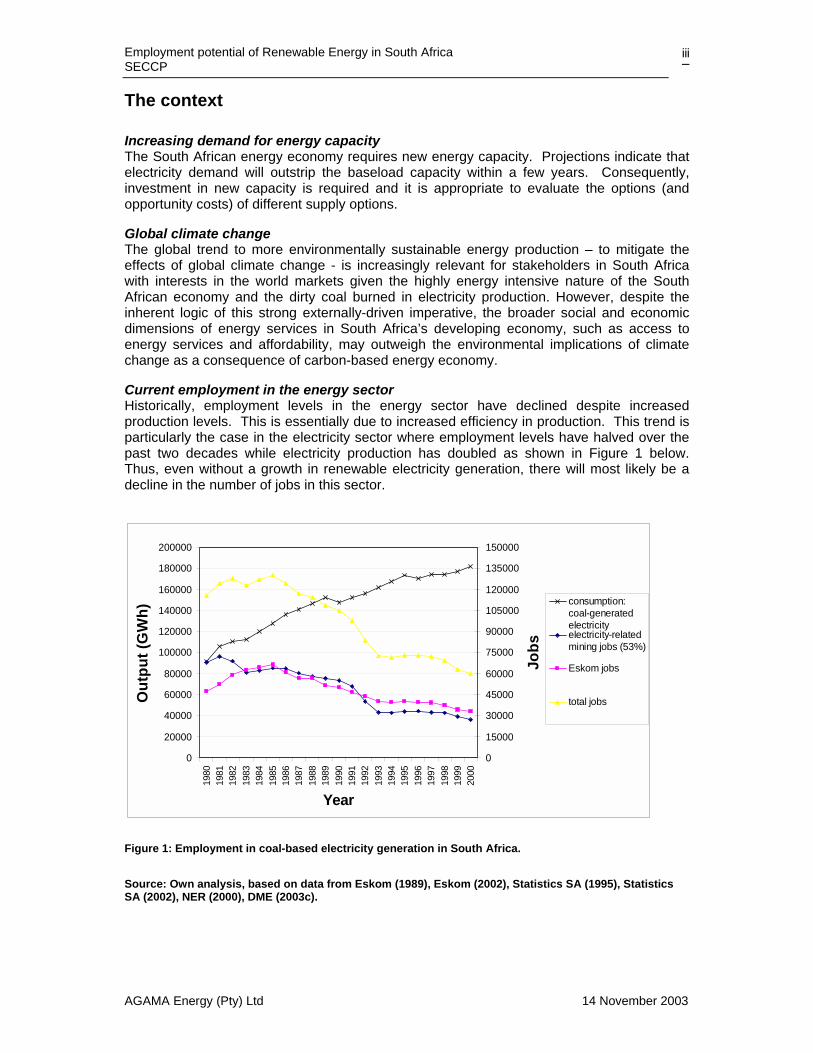
Current employment in the energy sector Historically, employment levels in the energy sector have declined despite increased production levels. This is essentially due to increased efficiency in production. This trend is particularly the case in the electricity sector where employment levels have halved over the past two decades while electricity production has doubled as shown in Figure 1 below. Thus, even without a growth in renewable electricity generation, there will most likely be a decline in the number of jobs in this sector.
0
20000
40000
60000
80000
100000
120000
140000
160000
180000
200000
1980
1981
1982
1983
1984
1985
1986
1987
1988
1989
1990
1991
1992
1993
1994
1995
1996
1997
1998
1999
2000
Year
Out
put (
GW
h)
0
15000
30000
45000
60000
75000
90000
105000
120000
135000
150000Jo
bs
consumption:coal-generatedelectricityelectricity-relatedmining jobs (53%)
Eskom jobs
total jobs
Figure 1: Employment in coal-based electricity generation in South Africa.
Source: Own analysis, based on data from Eskom (1989), Eskom (2002), Statistics SA (1995), Statistics SA (2002), NER (2000), DME (2003c).
Employment potential of Renewable Energy in South Africa SECCP
AGAMA Energy (Pty) Ltd 14 November 2003
iv
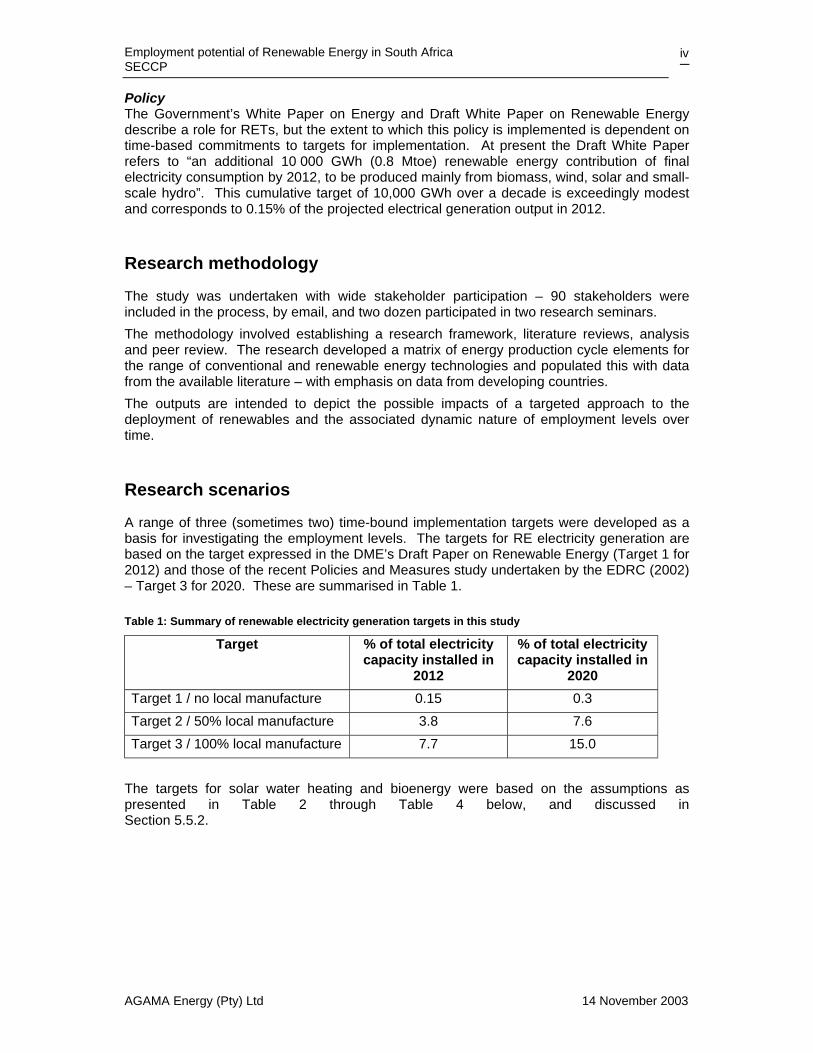
Policy The Government’s White Paper on Energy and Draft White Paper on Renewable Energy describe a role for RETs, but the extent to which this policy is implemented is dependent on time-based commitments to targets for implementation. At present the Draft White Paper refers to “an additional 10 000 GWh (0.8 Mtoe) renewable energy contribution of final electricity consumption by 2012, to be produced mainly from biomass, wind, solar and small-scale hydro”. This cumulative target of 10,000 GWh over a decade is exceedingly modest and corresponds to 0.15% of the projected electrical generation output in 2012.
Research methodology
The study was undertaken with wide stakeholder participation – 90 stakeholders were included in the process, by email, and two dozen participated in two research seminars. The methodology involved establishing a research framework, literature reviews, analysis and peer review. The research developed a matrix of energy production cycle elements for the range of conventional and renewable energy technologies and populated this with data from the available literature – with emphasis on data from developing countries. The outputs are intended to depict the possible impacts of a targeted approach to the deployment of renewables and the associated dynamic nature of employment levels over time.
Research scenarios
A range of three (sometimes two) time-bound implementation targets were developed as a basis for investigating the employment levels. The targets for RE electricity generation are based on the target expressed in the DME’s Draft Paper on Renewable Energy (Target 1 for 2012) and those of the recent Policies and Measures study undertaken by the EDRC (2002) – Target 3 for 2020. These are summarised in Table 1.
Table 1: Summary of renewable electricity generation targets in this study
Target % of total electricity capacity installed in
2012
% of total electricity capacity installed in
2020 Target 1 / no local manufacture 0.15 0.3 Target 2 / 50% local manufacture 3.8 7.6 Target 3 / 100% local manufacture 7.7 15.0
The targets for solar water heating and bioenergy were based on the assumptions as presented in Table 2 through Table 4 below, and discussed in Section 5.5.2.
Employment potential of Renewable Energy in South Africa SECCP
AGAMA Energy (Pty) Ltd 14 November 2003
v
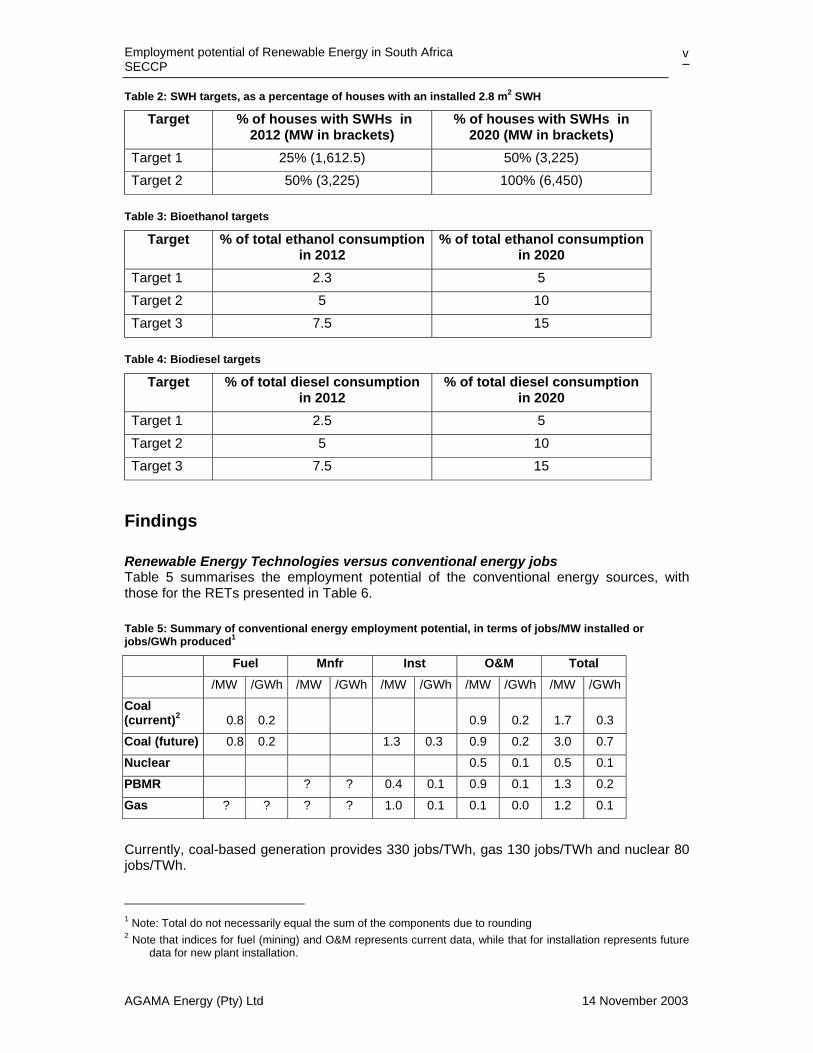
Table 2: SWH targets, as a percentage of houses with an installed 2.8 m2 SWH
Target % of houses with SWHs in 2012 (MW in brackets)
% of houses with SWHs in 2020 (MW in brackets)
Target 1 25% (1,612.5) 50% (3,225) Target 2 50% (3,225) 100% (6,450)
Table 3: Bioethanol targets
Target % of total ethanol consumption in 2012
% of total ethanol consumption in 2020
Target 1 2.3 5 Target 2 5 10 Target 3 7.5 15
Table 4: Biodiesel targets
Target % of total diesel consumption in 2012
% of total diesel consumption in 2020
Target 1 2.5 5 Target 2 5 10 Target 3 7.5 15
Findings
Renewable Energy Technologies versus conventional energy jobs Table 5 summarises the employment potential of the conventional energy sources, with those for the RETs presented in Table 6.
Table 5: Summary of conventional energy employment potential, in terms of jobs/MW installed or jobs/GWh produced1
Fuel Mnfr Inst O&M Total /MW /GWh /MW /GWh /MW /GWh /MW /GWh /MW /GWh Coal (current)2 0.8 0.2 0.9 0.2 1.7 0.3 Coal (future) 0.8 0.2 1.3 0.3 0.9 0.2 3.0 0.7 Nuclear 0.5 0.1 0.5 0.1 PBMR ? ? 0.4 0.1 0.9 0.1 1.3 0.2 Gas ? ? ? ? 1.0 0.1 0.1 0.0 1.2 0.1
Currently, coal-based generation provides 330 jobs/TWh, gas 130 jobs/TWh and nuclear 80 jobs/TWh.
1 Note: Total do not necessarily equal the sum of the components due to rounding 2 Note that indices for fuel (mining) and O&M represents current data, while that for installation represents future
data for new plant installation.
Employment potential of Renewable Energy in South Africa SECCP
AGAMA Energy (Pty) Ltd 14 November 2003
vi
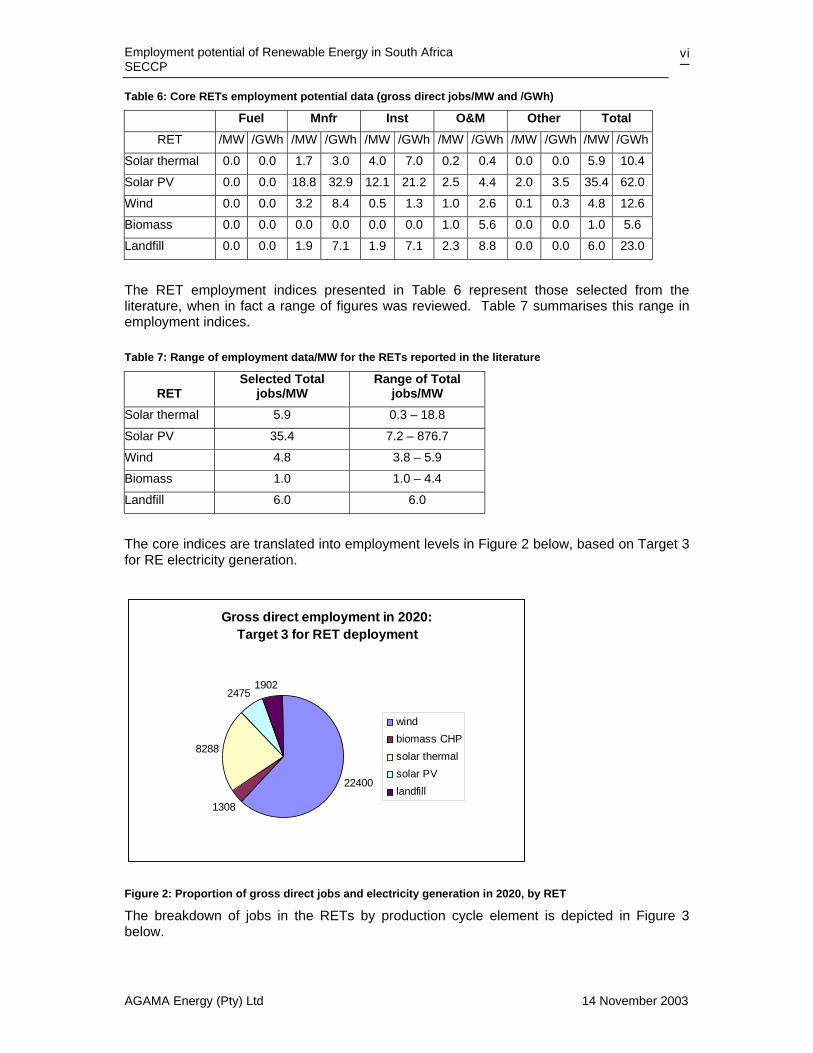
Table 6: Core RETs employment potential data (gross direct jobs/MW and /GWh)
Fuel Mnfr Inst O&M Other Total RET /MW /GWh /MW /GWh /MW /GWh /MW /GWh /MW /GWh /MW /GWh
Solar thermal 0.0 0.0 1.7 3.0 4.0 7.0 0.2 0.4 0.0 0.0 5.9 10.4 Solar PV 0.0 0.0 18.8 32.9 12.1 21.2 2.5 4.4 2.0 3.5 35.4 62.0 Wind 0.0 0.0 3.2 8.4 0.5 1.3 1.0 2.6 0.1 0.3 4.8 12.6 Biomass 0.0 0.0 0.0 0.0 0.0 0.0 1.0 5.6 0.0 0.0 1.0 5.6 Landfill 0.0 0.0 1.9 7.1 1.9 7.1 2.3 8.8 0.0 0.0 6.0 23.0
The RET employment indices presented in Table 6 represent those selected from the literature, when in fact a range of figures was reviewed. Table 7 summarises this range in employment indices.
Table 7: Range of employment data/MW for the RETs reported in the literature
RET Selected Total
jobs/MW Range of Total
jobs/MW Solar thermal 5.9 0.3 – 18.8
Solar PV 35.4 7.2 – 876.7 Wind 4.8 3.8 – 5.9 Biomass 1.0 1.0 – 4.4 Landfill 6.0 6.0
The core indices are translated into employment levels in Figure 2 below, based on Target 3 for RE electricity generation.
Gross direct employment in 2020: Target 3 for RET deployment
22400
1308
8288
24751902
windbiomass CHPsolar thermalsolar PVlandfill
Figure 2: Proportion of gross direct jobs and electricity generation in 2020, by RET
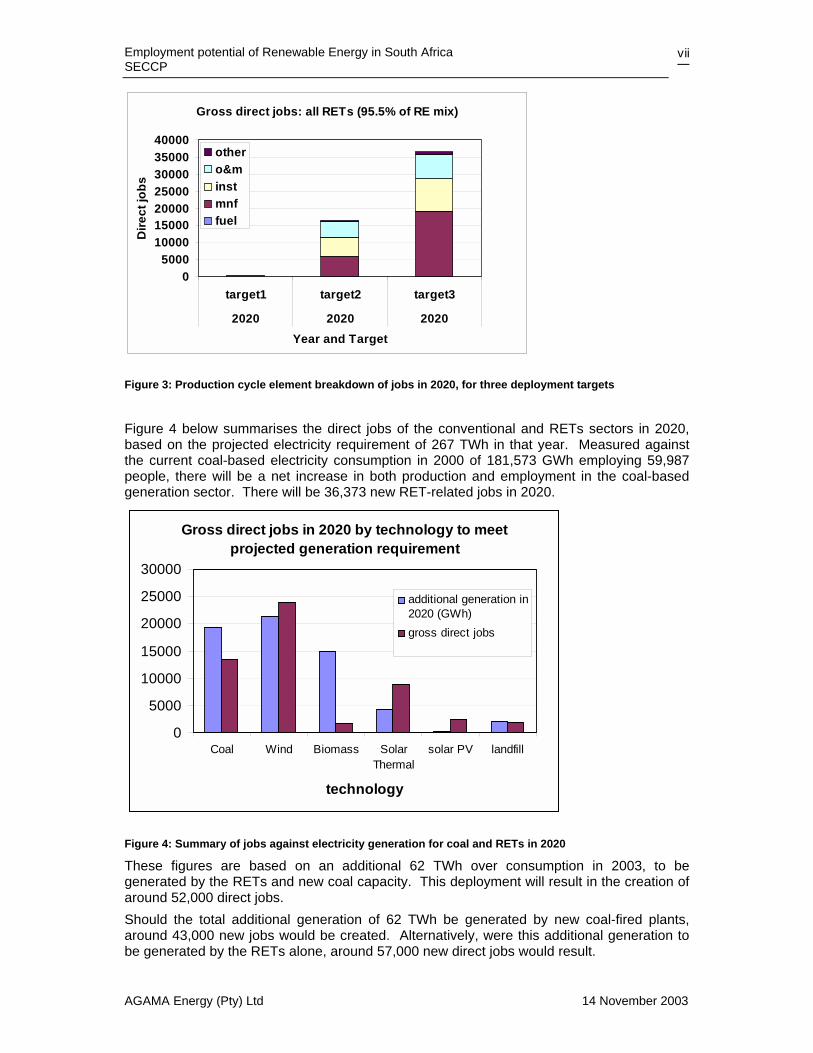
The breakdown of jobs in the RETs by production cycle element is depicted in Figure 3 below.
Employment potential of Renewable Energy in South Africa SECCP
AGAMA Energy (Pty) Ltd 14 November 2003
vii
Gross direct jobs: all RETs (95.5% of RE mix)
05000
10000150002000025000300003500040000
target1 target2 target3
2020 2020 2020Year and Target
Dire
ct jo
bsothero&minstmnffuel
Figure 3: Production cycle element breakdown of jobs in 2020, for three deployment targets
Figure 4 below summarises the direct jobs of the conventional and RETs sectors in 2020, based on the projected electricity requirement of 267 TWh in that year. Measured against the current coal-based electricity consumption in 2000 of 181,573 GWh employing 59,987 people, there will be a net increase in both production and employment in the coal-based generation sector. There will be 36,373 new RET-related jobs in 2020.
Gross direct jobs in 2020 by technology to meet projected generation requirement
0
5000
10000
15000
20000
25000
30000
Coal Wind Biomass SolarThermal
solar PV landfill
technology
additional generation in2020 (GWh)gross direct jobs
Figure 4: Summary of jobs against electricity generation for coal and RETs in 2020
These figures are based on an additional 62 TWh over consumption in 2003, to be generated by the RETs and new coal capacity. This deployment will result in the creation of around 52,000 direct jobs. Should the total additional generation of 62 TWh be generated by new coal-fired plants, around 43,000 new jobs would be created. Alternatively, were this additional generation to be generated by the RETs alone, around 57,000 new direct jobs would result.
Employment potential of Renewable Energy in South Africa SECCP
AGAMA Energy (Pty) Ltd 14 November 2003
viii
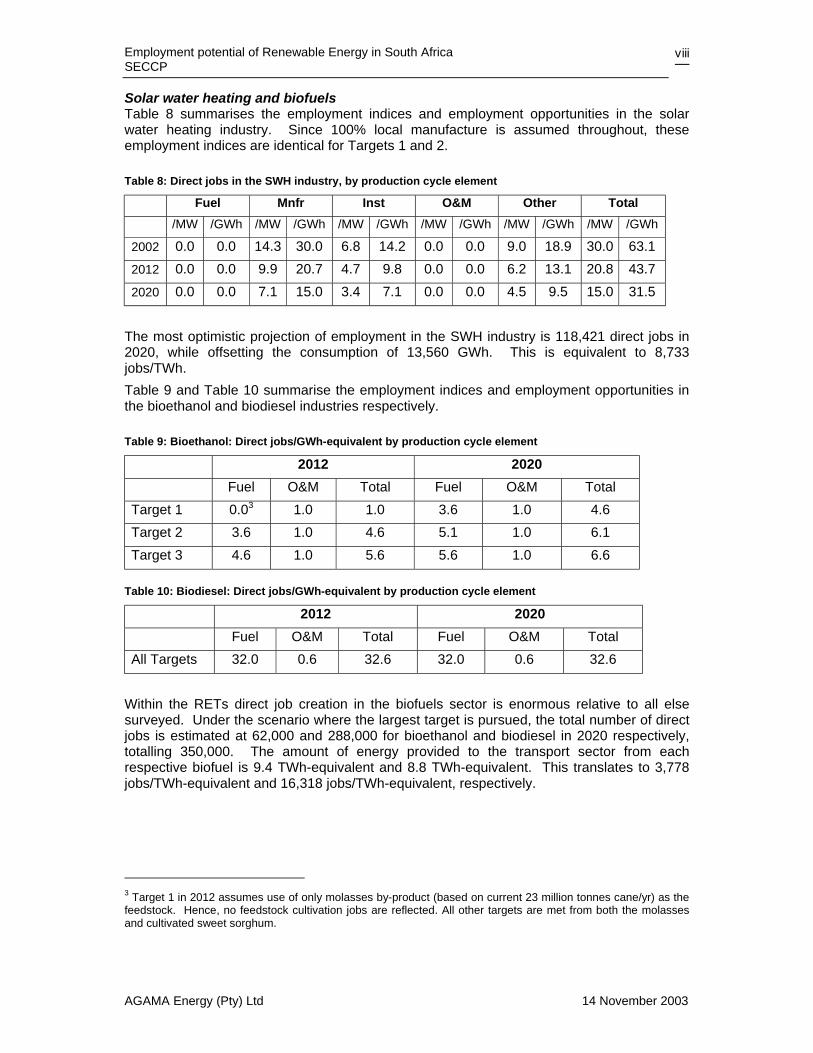
Solar water heating and biofuels Table 8 summarises the employment indices and employment opportunities in the solar water heating industry. Since 100% local manufacture is assumed throughout, these employment indices are identical for Targets 1 and 2.
Table 8: Direct jobs in the SWH industry, by production cycle element
Fuel Mnfr Inst O&M Other Total /MW /GWh /MW /GWh /MW /GWh /MW /GWh /MW /GWh /MW /GWh
2002 0.0 0.0 14.3 30.0 6.8 14.2 0.0 0.0 9.0 18.9 30.0 63.1
2012 0.0 0.0 9.9 20.7 4.7 9.8 0.0 0.0 6.2 13.1 20.8 43.7
2020 0.0 0.0 7.1 15.0 3.4 7.1 0.0 0.0 4.5 9.5 15.0 31.5
The most optimistic projection of employment in the SWH industry is 118,421 direct jobs in 2020, while offsetting the consumption of 13,560 GWh. This is equivalent to 8,733 jobs/TWh. Table 9 and Table 10 summarise the employment indices and employment opportunities in the bioethanol and biodiesel industries respectively.
Table 9: Bioethanol: Direct jobs/GWh-equivalent by production cycle element
2012 2020 Fuel O&M Total Fuel O&M Total
Target 1 0.03 1.0 1.0 3.6 1.0 4.6 Target 2 3.6 1.0 4.6 5.1 1.0 6.1 Target 3 4.6 1.0 5.6 5.6 1.0 6.6
Table 10: Biodiesel: Direct jobs/GWh-equivalent by production cycle element
2012 2020 Fuel O&M Total Fuel O&M Total
All Targets 32.0 0.6 32.6 32.0 0.6 32.6 Within the RETs direct job creation in the biofuels sector is enormous relative to all else surveyed. Under the scenario where the largest target is pursued, the total number of direct jobs is estimated at 62,000 and 288,000 for bioethanol and biodiesel in 2020 respectively, totalling 350,000. The amount of energy provided to the transport sector from each respective biofuel is 9.4 TWh-equivalent and 8.8 TWh-equivalent. This translates to 3,778 jobs/TWh-equivalent and 16,318 jobs/TWh-equivalent, respectively.
3 Target 1 in 2012 assumes use of only molasses by-product (based on current 23 million tonnes cane/yr) as the feedstock. Hence, no feedstock cultivation jobs are reflected. All other targets are met from both the molasses and cultivated sweet sorghum.
Employment potential of Renewable Energy in South Africa SECCP
AGAMA Energy (Pty) Ltd 14 November 2003
ix
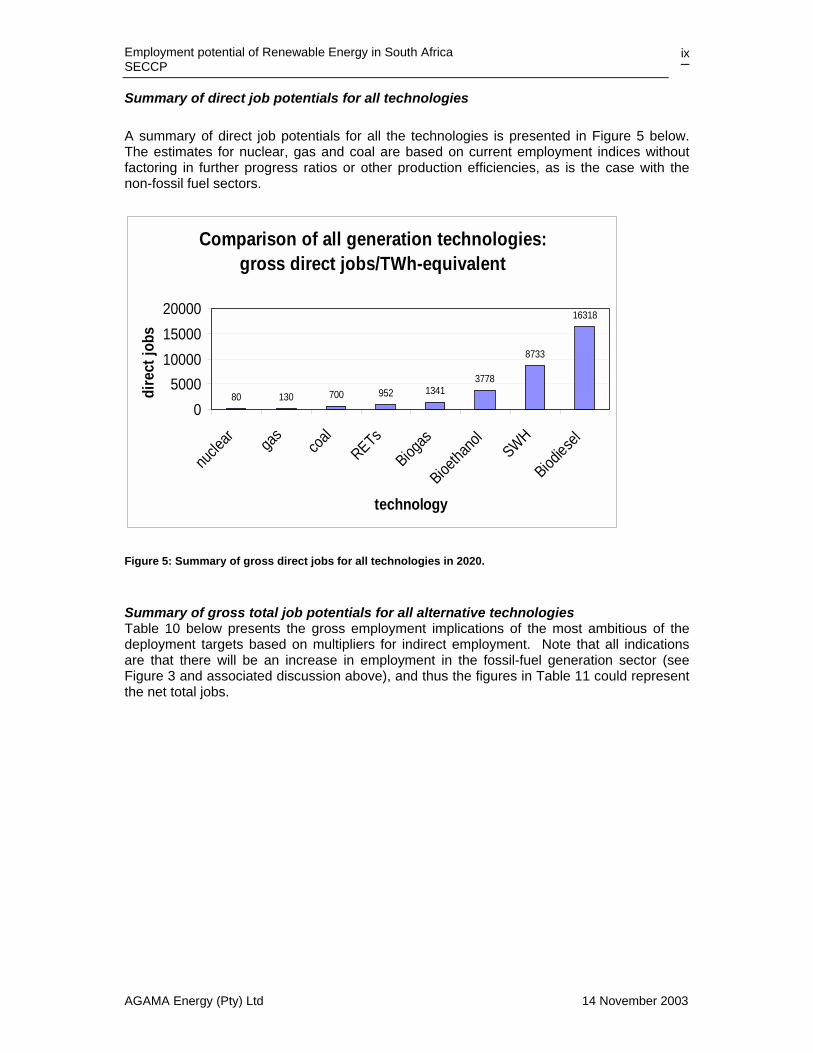
Summary of direct job potentials for all technologies A summary of direct job potentials for all the technologies is presented in Figure 5 below. The estimates for nuclear, gas and coal are based on current employment indices without factoring in further progress ratios or other production efficiencies, as is the case with the non-fossil fuel sectors.
Comparison of all generation technologies: gross direct jobs/TWh-equivalent
80 130 700 952 13413778
8733
16318
05000
100001500020000
nucle
ar gas
coal
RETsBiog
as
Bioetha
nol
SWH
Biodiesel
technology
dire
ct jo
bs
Figure 5: Summary of gross direct jobs for all technologies in 2020.
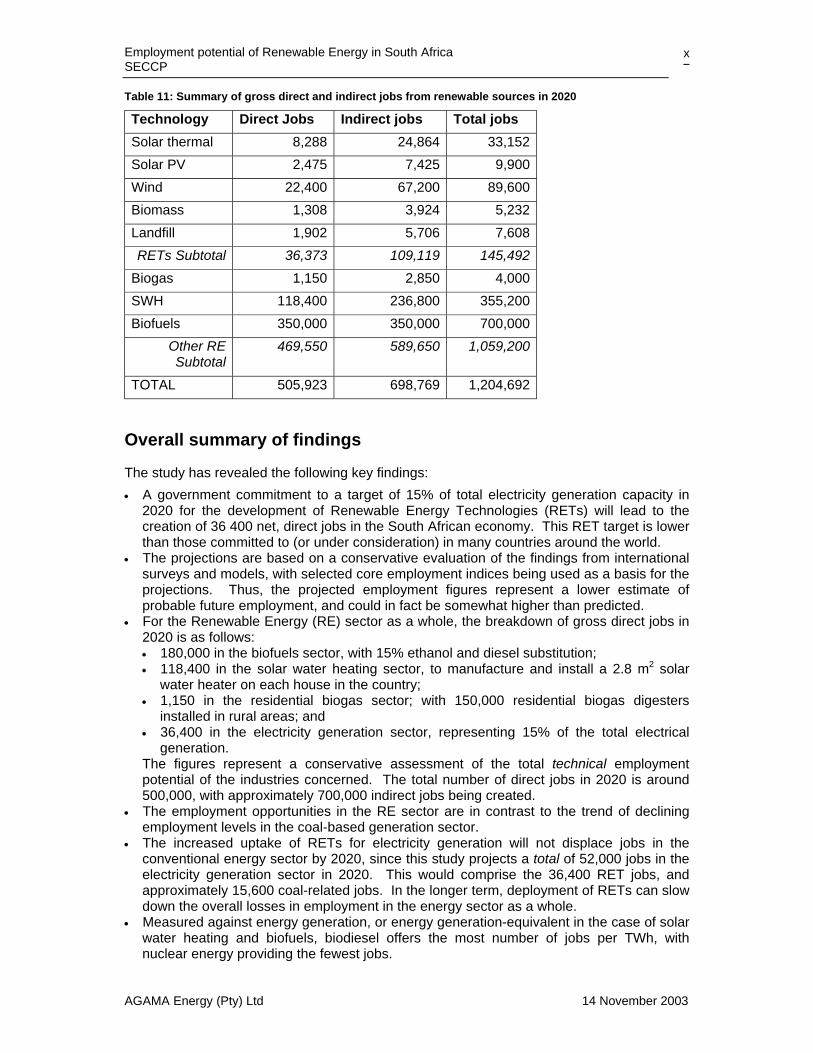
Summary of gross total job potentials for all alternative technologies Table 10 below presents the gross employment implications of the most ambitious of the deployment targets based on multipliers for indirect employment. Note that all indications are that there will be an increase in employment in the fossil-fuel generation sector (see Figure 3 and associated discussion above), and thus the figures in Table 11 could represent the net total jobs.
Employment potential of Renewable Energy in South Africa SECCP
AGAMA Energy (Pty) Ltd 14 November 2003
x
Table 11: Summary of gross direct and indirect jobs from renewable sources in 2020
Technology Direct Jobs Indirect jobs Total jobs Solar thermal 8,288 24,864 33,152 Solar PV 2,475 7,425 9,900 Wind 22,400 67,200 89,600 Biomass 1,308 3,924 5,232 Landfill 1,902 5,706 7,608 RETs Subtotal 36,373 109,119 145,492
Biogas 1,150 2,850 4,000 SWH 118,400 236,800 355,200 Biofuels 350,000 350,000 700,000
Other RE Subtotal
469,550 589,650 1,059,200
TOTAL 505,923 698,769 1,204,692
Overall summary of findings
The study has revealed the following key findings: • A government commitment to a target of 15% of total electricity generation capacity in
2020 for the development of Renewable Energy Technologies (RETs) will lead to the creation of 36 400 net, direct jobs in the South African economy. This RET target is lower than those committed to (or under consideration) in many countries around the world.
• The projections are based on a conservative evaluation of the findings from international surveys and models, with selected core employment indices being used as a basis for the projections. Thus, the projected employment figures represent a lower estimate of probable future employment, and could in fact be somewhat higher than predicted.
• For the Renewable Energy (RE) sector as a whole, the breakdown of gross direct jobs in 2020 is as follows: • 180,000 in the biofuels sector, with 15% ethanol and diesel substitution; • 118,400 in the solar water heating sector, to manufacture and install a 2.8 m2 solar
water heater on each house in the country; • 1,150 in the residential biogas sector; with 150,000 residential biogas digesters
installed in rural areas; and • 36,400 in the electricity generation sector, representing 15% of the total electrical
generation. The figures represent a conservative assessment of the total technical employment potential of the industries concerned. The total number of direct jobs in 2020 is around 500,000, with approximately 700,000 indirect jobs being created.
• The employment opportunities in the RE sector are in contrast to the trend of declining employment levels in the coal-based generation sector.
• The increased uptake of RETs for electricity generation will not displace jobs in the conventional energy sector by 2020, since this study projects a total of 52,000 jobs in the electricity generation sector in 2020. This would comprise the 36,400 RET jobs, and approximately 15,600 coal-related jobs. In the longer term, deployment of RETs can slow down the overall losses in employment in the energy sector as a whole.
• Measured against energy generation, or energy generation-equivalent in the case of solar water heating and biofuels, biodiesel offers the most number of jobs per TWh, with nuclear energy providing the fewest jobs.
Employment potential of Renewable Energy in South Africa SECCP
AGAMA Energy (Pty) Ltd 14 November 2003
xi
• The quality of the employment opportunities in the RE sector are particularly significant as they are: • more decentralised than coal, nuclear and gas generation and supply systems; • largely located in rural areas; • closer to the energy service demand explain, leading to improved regional energy
service delivery, lower transmission losses and costs, and greater reliability. • Skills requirements in the RE sector to meet future deployment demands will require
major support from the relevant Sector Education and Training Authorities (SETAs), most notably the Construction Education and Training Authority (Ceta), the Energy SETA (Eseta) and the Manufacturing, Engineering and Related Seta (Merseta).
• A wide range of skills is required to implement all the renewable electricity technologies. The greatest opportunity lies in the SWH and biofuels sectors, requiring large training programs to ensure the human resources capacity is in place to meet the projected demand.
• The large majority of jobs in the biofuels sector will be unskilled or semi-skilled, and will be based in rural areas with farmers being responsible for the planting and harvesting of appropriate energy crops.
Conclusions
Key conclusions include: • The study has clearly shown that the large-scale deployment of renewable energy
technologies will sustain and substantially boost the number of jobs in the energy sector, particularly because of the development of local manufacturing industries.
• Further, it has shown that job creation in renewable energy is only possible when progressive national deployment targets are set, due to the attendant manufacturing, installation and O&M capacity that are initiated.
• Massive employment gains can be achieved quickly and easily in the SWH and biofuels sectors, while showing good returns on a limited investment by government.
• RETs provide additional job creation when compared with new coal generation, but will require greater investment both in money and skills training which will have to be planned and accounted for.
• This information must be included in the Integrated Energy Planning process to ensure that the results from this study are considered in investment decisions. In this way a national energy strategy will evolve that takes society’s best interests into account.
Priorities for future research
The following priorities for future activities are suggested: • The cost of developing each of the technologies, and the human resources to
manufacture, install and service them, should be fully assessed if the full social benefits that are possible through R E deployment based on local manufacture are to be realised.
• A comprehensive implementation plan based on these results, and technology costs, should be developed.
• The appropriate SETAs should be fully appraised of these findings, in order to prepare their support for a nation-wide RET deployment strategy.
Employment potential of Renewable Energy in South Africa SECCP
AGAMA Energy (Pty) Ltd 14 November 2003
xii
TABLE OF CONTENTS
EXECUTIVE SUMMARY Error! Bookmark not defined.
LIST OF FIGURES xv
LIST OF TABLES xvi
Glossary and Abbreviations xvii
1. Introduction 1 1.1 Aims and objectives 1 1.2 Background 1 1.3 Scope 2
2. Project approach 4 2.1 Project team 4 2.2 Methodology 4 2.3 Data collection 5 2.4 Research seminars 5
3. South African energy in context 6 3.1 Energy in the macro-economic context 6 3.2 Conventional sources of electricity: consumption and jobs 7
3.2.1 Coal 7 3.2.2 Nuclear 8 3.2.3 Natural gas 9 3.2.4 Summary of employment in the conventional energy sector 9
3.3 Government energy policy 10 3.4 The Energy White Paper (EWP) 11 3.5 Renewable Energy according to the Energy White Paper 11 3.6 Restructuring in the electricity sector 12
3.6.1 Distribution 13 3.6.2 Electricity Supply Industry 13
3.7 Unemployment in South Africa 13
4. Literature review: renewable energy experience, potential and jobs 14 4.1 RETs: experiences and energy potential 14
4.1.1 Wind Power 14 4.1.1.1 International experience 14 4.1.1.2 South African experience and energy potential 15
4.1.2 Solar thermal 16 4.1.2.1 International experience 16 4.1.2.2 South African experience and energy potential 17
4.1.3 Solar PV 17 4.1.3.1 International experience 17 4.1.3.2 South African experience and energy potential 18
4.1.4 Landfill gas 18 4.1.4.1 International experience 18 4.1.4.2 South African experience and energy potential 19

Employment potential of Renewable Energy in South Africa SECCP
AGAMA Energy (Pty) Ltd 14 November 2003
xiii
4.1.5 Biomass Combined Heat and Power (CHP) 19 4.1.5.1 International experience 20 4.1.5.2 South African experience and energy potential 20
4.1.6 Solar water heating 22 4.1.6.1 International experience 22 4.1.6.2 South African experience and energy potential 22
4.1.7 Anaerobic biogas digestion 23 4.1.7.1 International experience 23 4.1.7.2 South African experience and energy potential 23
4.1.8 Biofuels 24 4.1.8.1 International experience 24 4.1.8.2 South African experience and energy potential: bioethanol25 4.1.8.3 South African experience and energy potential: biodiesel 26
5. Methodological issues and data analysis framework 27 5.1 Job definitions 27
5.1.1 Direct jobs 27 5.1.2 Indirect jobs 28
5.2 Electricity generation capacity factors 28 5.3 Labour productivity and technology learning curves 29 5.4 Investment and capacity thresholds 29 5.5 Targets for renewable energy deployment 31
5.5.1 Renewable electricity targets for South Africa 32 5.5.2 Other renewable energy targets for South Africa 33
5.5.2.1 Solar water heating (SWH) 33 5.5.2.2 Bioethanol 33 5.5.2.3 Biodiesel 34
5.6 Geographic location of new RE jobs 34
6. Gross employment projections 36 6.1 Gross employment potential of the RETs 36 6.2 Employment potential of biofuels 40
6.2.1 Bioethanol 40 6.2.2 Biodiesel 40 6.2.3 Bioethanol and biodiesel employment projections 41
6.3 Biogas 41 6.4 Solar Water Heating 42 6.5 Indirect jobs multipliers 43 6.6 Discussion of employment data 43
6.6.1 Conventional energy 44 6.6.2 Renewable electricity sources 44 6.6.3 Comparison of RETs and coal electricity generators and direct jobs 45 6.6.4 Biofuels 47 6.6.5 Biogas 48 6.6.6 Solar water heating 48 6.6.7 Summary: direct jobs 48 6.6.8 Summary: direct and indirect jobs 49
7. Gearing up: new jobs, new skills 51 7.1 Types of RET jobs 51
7.1.1 Wind 51 7.1.2 Solar PV 53 7.1.3 Biofuels 54
Employment potential of Renewable Energy in South Africa SECCP
AGAMA Energy (Pty) Ltd 14 November 2003
xiv
7.1.4 Solar water heating 54 7.1.5 Biogas 55
7.2 Skills requirements for South Africa 55 7.3 Labour and training 56
8. Conclusions and recommendations 59
References 60
Appendix A: Data template for electricity technologies 65
Appendix B: Email respondent list 66
Appendix C: Notes from seminars 70
Appendix D: Forms of biomass utilisation 76
Appendix E: Discussion on jobs and revenue 77
Appendix F: Literature data for RETs employment 79
Employment potential of Renewable Energy in South Africa SECCP
AGAMA Energy (Pty) Ltd 14 November 2003
xv
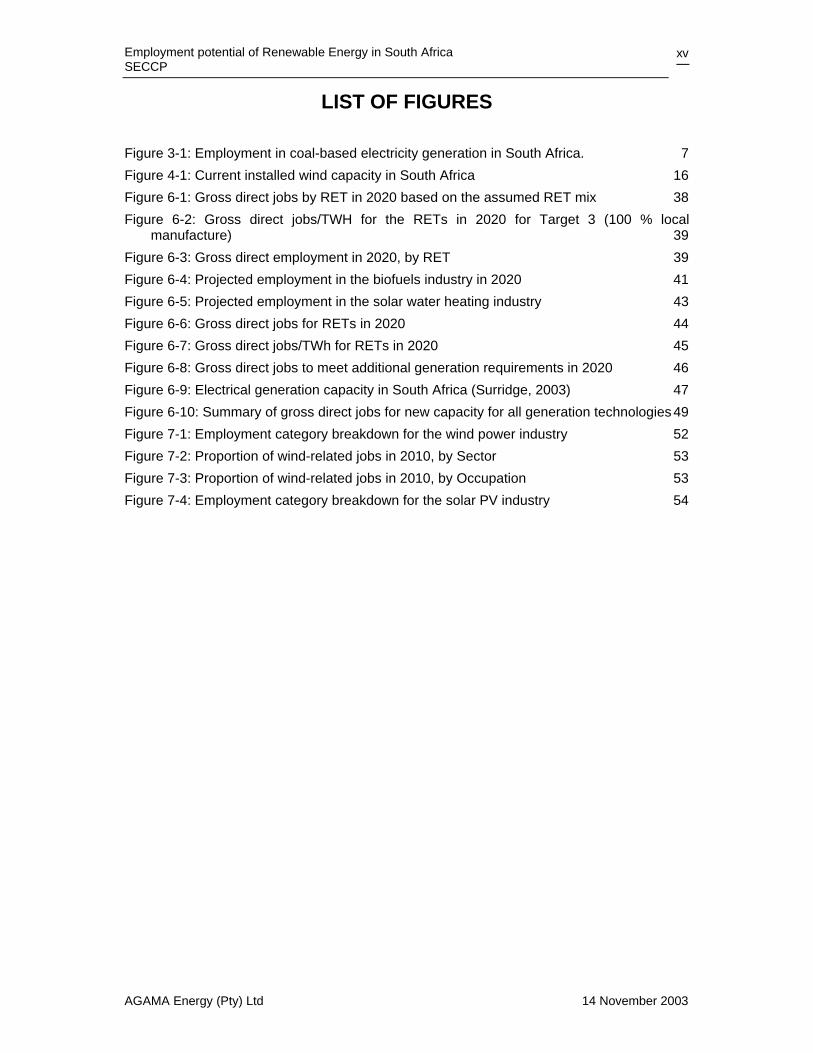
LIST OF FIGURES Figure 3-1: Employment in coal-based electricity generation in South Africa. 7 Figure 4-1: Current installed wind capacity in South Africa 16 Figure 6-1: Gross direct jobs by RET in 2020 based on the assumed RET mix 38 Figure 6-2: Gross direct jobs/TWH for the RETs in 2020 for Target 3 (100 % local
manufacture) 39 Figure 6-3: Gross direct employment in 2020, by RET 39 Figure 6-4: Projected employment in the biofuels industry in 2020 41 Figure 6-5: Projected employment in the solar water heating industry 43 Figure 6-6: Gross direct jobs for RETs in 2020 44 Figure 6-7: Gross direct jobs/TWh for RETs in 2020 45 Figure 6-8: Gross direct jobs to meet additional generation requirements in 2020 46 Figure 6-9: Electrical generation capacity in South Africa (Surridge, 2003) 47 Figure 6-10: Summary of gross direct jobs for new capacity for all generation technologies 49 Figure 7-1: Employment category breakdown for the wind power industry 52 Figure 7-2: Proportion of wind-related jobs in 2010, by Sector 53 Figure 7-3: Proportion of wind-related jobs in 2010, by Occupation 53 Figure 7-4: Employment category breakdown for the solar PV industry 54
Employment potential of Renewable Energy in South Africa SECCP
AGAMA Energy (Pty) Ltd 14 November 2003
xvi
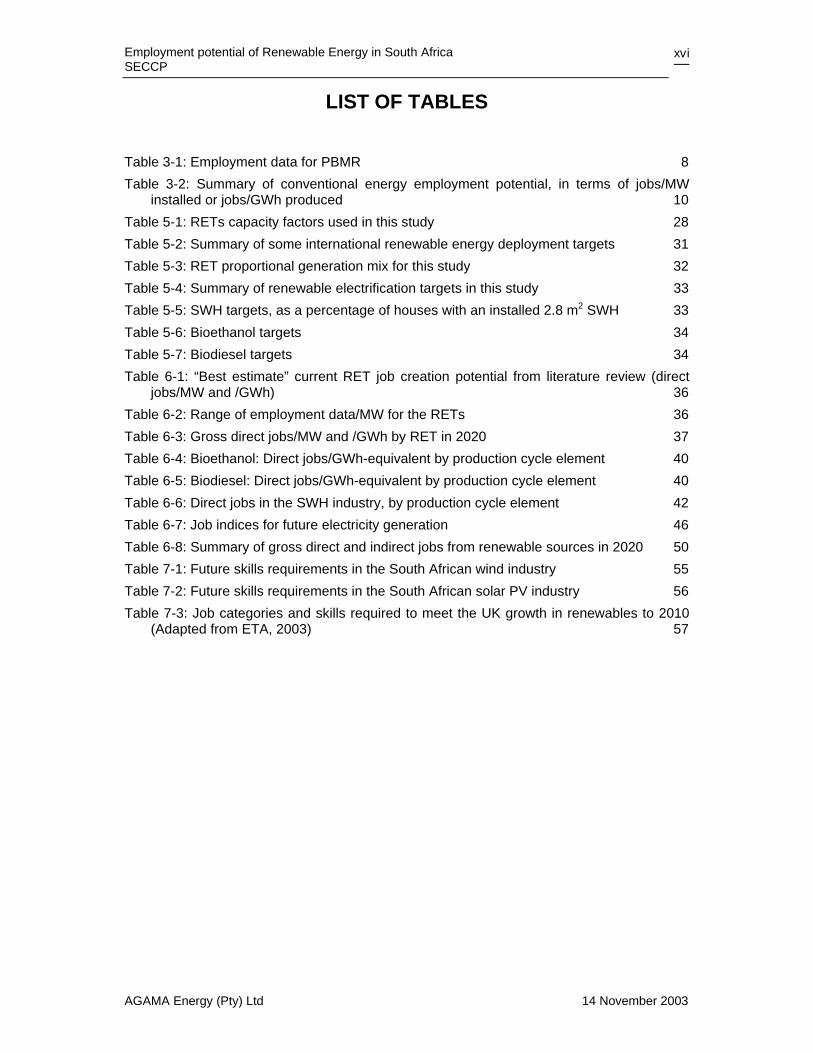
LIST OF TABLES
Table 3-1: Employment data for PBMR 8 Table 3-2: Summary of conventional energy employment potential, in terms of jobs/MW
installed or jobs/GWh produced 10 Table 5-1: RETs capacity factors used in this study 28 Table 5-2: Summary of some international renewable energy deployment targets 31 Table 5-3: RET proportional generation mix for this study 32 Table 5-4: Summary of renewable electrification targets in this study 33 Table 5-5: SWH targets, as a percentage of houses with an installed 2.8 m2 SWH 33 Table 5-6: Bioethanol targets 34 Table 5-7: Biodiesel targets 34 Table 6-1: “Best estimate” current RET job creation potential from literature review (direct
jobs/MW and /GWh) 36 Table 6-2: Range of employment data/MW for the RETs 36 Table 6-3: Gross direct jobs/MW and /GWh by RET in 2020 37 Table 6-4: Bioethanol: Direct jobs/GWh-equivalent by production cycle element 40 Table 6-5: Biodiesel: Direct jobs/GWh-equivalent by production cycle element 40 Table 6-6: Direct jobs in the SWH industry, by production cycle element 42 Table 6-7: Job indices for future electricity generation 46 Table 6-8: Summary of gross direct and indirect jobs from renewable sources in 2020 50 Table 7-1: Future skills requirements in the South African wind industry 55 Table 7-2: Future skills requirements in the South African solar PV industry 56 Table 7-3: Job categories and skills required to meet the UK growth in renewables to 2010
(Adapted from ETA, 2003) 57
Employment potential of Renewable Energy in South Africa SECCP
AGAMA Energy (Pty) Ltd 14 November 2003
xvii
Glossary and Abbreviations Bagasse: The fibrous material remaining after the extraction of juice from
sugarcane, often burned by sugar mills as a source of energy. Biomass: An energy resource derived from organic matter. These include
wood, agricultural waste and other living-cell material that can be burned to produce heat energy. They also include algae, sewage and other organic substances that may be used to make energy through chemical processes.
Capacity factor: The amount of energy that a system produces at a particular site as a percentage of the total amount that it would produce if it operated at rated capacity during the entire year.
CER: Certified Emissions Reductions. Investors in Clean Development Mechanism (CDM) projects can earn CERs for greenhouse emission reductions (measured in metric tonnes of CO2 equivalent) achieved by their CDM projects, provided they meet certain eligibility criteria.
EDI: Electricity Distribution Industry ESI: Electricity Supply Industry GW: GigaWatt. Equal to one thousand MW. GWh: Gigawatt-hour. Represents one GW of power consumption for one
hour. Insolation: Contracted from incoming solar radiation. In general, solar radiation
received at the earth's surface. Joule: The SI unit of energy, work, or quantity of heat. Multiplier: A number used to multiply an amount to get an estimate of economic
impact. It is a way of identifying impacts beyond the original expenditure. It is also used with respect to income and employment.
MW: MegaWatt. Equal to one million Watts. MWh: Megawatt-hour. Represents one MW of power consumption for one
hour. PV: Photovoltaic Rankine cycle: An ideal thermodynamic cycle, used as a standard against which to
judge the performance of heat-engine and heat-pump installations RE: Renewable energy, or energy obtained from non-finite sources such
as wind, photovoltaics, small hydro, solar thermal, geothermal, biomass
RET: Renewable Energy Technology that converts the non-finite resource to a useful energy form.
TW: TeraWatt. Equal to one thousand GW. TWh: Terawatt-hour. Represents one TW of power consumption for one
hour. Watt: The unit of power. Equal to one Joule per second (J/s). Watt-hour: Wh. Represents one Watt of power consumption for one hour.
Employment potential of Renewable Energy in South Africa SECCP
AGAMA Energy (Pty) Ltd 14 November 2003
1
1. Introduction
1.1 Aims and objectives
The South African Government is currently developing a White Paper on Renewable Energy (DME, 1998) and, among others, the issue of the impact on employment is a key consideration in policymaking. At present, there are no reliable employment data or studies to inform the policy making process and this study is intended to start addressing this gap. The objective of the study is to quantify the employment potential of key renewable energy technologies (RETs) in SA, with consideration of net benefits and impacts of progressive policies and measures for their deployment in South Africa. The study quantifies and characterises the jobs that could be created in South Africa through renewable energy implementation, and draws comparisons with jobs associated with three conventional energy sources – namely coal, nuclear and natural gas. Included is a discussion of the range of skills required in producing and servicing RETs. The study also discusses the issue of possible retraining requirements to support the shift in employment opportunities from the coal and related electricity supply industry to work in the renewable energy industry. The earlier sections of the report provide a background to energy use in South Africa, a literature review of employment in the renewable energy sector as well as the renewable energy potentials in South Africa. The methodological issues and the framework upon which the analyses are based are presented in Section 5, followed by Section 6, which presents the resultant employment projections and a discussion of those results. Section 7 discusses the issues of skills and labour requirements for meeting the increased uptake of renewables. Finally, conclusions emanating from the study are made in Section 8.
1.2 Background
The impacts of fossil-fuel based electricity generation methods – on the environment, people’s health, energy security/reliability, and national economics – have associated direct costs that are externalised, that is, they are not accounted for in market prices. This has the effect of reducing the retail price of fossil-fuel generated electricity, at the expense of the physical environment, the population’s health, energy supply and economics. With the world’s increasing reliance on stable power to support the information and communication technology networks, our economic systems are increasingly susceptible to centralised power failures. The increasing deployment of RETs increases the security of energy supply, since the distributed capability of renewables-based generating capacity brings generation closer to the end-use point, thus minimising transmission concerns (and costs) (IEA, 2002; Lovins et al, 2002). At the same time, the defenders of the status quo are making the counter-argument that industrial reforms aimed at mitigating environmental damage will increase costs and take away jobs. In the case of energy, cutting back on coal and oil “would take jobs away from miners and refiners” (Renner, 2001, p.25). In South Africa, this argument is reinforced by the notion that low electricity prices offer competitive advantage in the international markets for specific (energy intensive) products and related foreign direct investments, at least in the short to medium term.
Employment potential of Renewable Energy in South Africa SECCP
AGAMA Energy (Pty) Ltd 14 November 2003
2
However, there have been large job losses in these fossil-fuel industries, both locally and internationally. These job losses take place against the backdrop of increased electricity output, and relatively undemanding requirements of the sector to comply with more exacting environmental regulations, at least in some global markets. In general, these job losses have occurred as the technology matures, as extraction and electricity conversion efficiencies have increased, and because of the widespread privatisation of the industry. The UK coal industry is a case in point (see Shutt J, Henderson R and Kumi-Ampofo F, (2003) and Renner M (2001). At the same time, the renewable energy sector and environmental and social justice activists emphasize research data relating to the employment potential of renewable energy technologies and impacts of energy efficiency measures, waste recycling, alternative transport systems, and the like. The current status of this argument within the South African context remains poorly researched and thus difficult to resolve. Recent international studies (see Section 4.1 for a review of this literature) have begun to quantify these issues, most often within the context of the developed countries, and then most often around the fastest growing sector, namely the wind power sector. An equally important issue is the nature (or quality) of the jobs that the renewables sector has to offer, one which we attempt to address in this study. An additional factor, often overlooked, is that renewable energy technologies (RETs) alone will not supplant the conventional energy supply options for the future energy needs of the country. The study will assist in answering the question of whether RETs will take jobs away from the fossil fuel sector, while supporting a transition to a more secure and environmentally sustainable energy usage and access. As this study aims to show, this transition to a long-term secure energy supply will enhance the net number of jobs in the energy sector. Eventually a transfer of employment opportunities from the fossil sector is likely as RETs are implemented. This is most probably the basis for some of the larger energy corporations becoming increasingly involved in the renewables sector. By addressing the employment impacts of increased, targeted deployment of RETs, and framing them within the context of different deployment scenarios, this analysis hopes to assist policy makers and labour leaders in understanding both the quantity and quality of jobs that a transition to RETs offers over the next couple of decades.
1.3 Scope
This study seeks to address the following questions: • How many direct jobs can be created per renewable energy technology (RET) in
South Africa? • How do these employment figures compare with conventional fossil fuel jobs? Thus,
what are the resulting net direct jobs for each RET? • What types of jobs are represented, and what skills are required to fulfil them? • What does a production cycle breakdown of these jobs look like? Consequently, in
which part of the production cycle do the majority of jobs, for a given RET, lie? • How does the level of local manufacture affect the number of local jobs created, and
to what extent do RET deployment levels affect the overall employment creation? • What training/retraining is required to support the transition and uptake of further
RETs for electricity and energy generation?
Employment potential of Renewable Energy in South Africa SECCP
AGAMA Energy (Pty) Ltd 14 November 2003
3
In probing the issue of RETs for electricity generation, the RETs in question include: • Solar photovoltaic (PV) • Solar thermal • Wind • Biomass gasification (combined heat and power (CHP), of bagasse and energy
crops); and • Anaerobic digestion (landfill gas).
The study also extends to assessing the employment creation potential of the development of the biofuels industry in South Africa, the bulk of which are liquid fuels that would be consumed in the transport sector. In the thermal energy sector, the technologies assessed include
• solar water heating (SWH) • residential anaerobic biogas generation
At the same time, it is important to note that this study does not take into account the effect of multipliers on the economy due to the increased uptake of RETs. Where appropriate, mention will be made of such data as having being presented in the broader research literature. It is not the purpose of this study to assess policy or even motivate for specific deployment targets for RETs, since such studies have already been performed. This study will provide key socio-economic data to inform the setting of targets and motivate creation of an enabling environment, thus strengthening the policy debate.
Employment potential of Renewable Energy in South Africa SECCP
AGAMA Energy (Pty) Ltd 14 November 2003
4
2. Project approach
2.1 Project team
Greg Austin of AGAMA Energy (Pty) Ltd undertook the research, with additional support provided by Glynn Morris (AGAMA Energy). Anthony Williams undertook new research into the employment potentials of biofuels for inclusion in this study. Randall Spalding-Fecher (Sustainable Solutions) guided the research on behalf of the client, the Sustainable Energy and Climate Change Partnership (SECCP), represented by Richard Worthington.
2.2 Methodology
A review of the South African conventional and renewable energy sectors, as well as the available literature around jobs in the two sectors, was undertaken as background to this study. International experiences with the RETs were included in this review, from which a database of job figures was developed for each of the RETs. There are a number of issues that need to be grasped in order to allow a projection of jobs, based on this job database, to be undertaken. These methodological issues are discussed in Section 5, and include the definition of a typical ‘job’, a discussion of RET capacity factors, labour productivity and technology learning curves, investment and capacity thresholds, and international targets for RET deployment. Based on these international targets, and recommendations from a local study (EDRC, 2003), deployment targets are then developed for job projection purposes. A wide range of employment and technology or sectoral economic development studies was surveyed for relevant input to this research. A direct comparison between them is not possible since each study uses one of the following three unique methodological approaches, based on different assumptions and scenarios. The Input-Output (I-O) approach is a broad macro-economic modelling process that simulates activity in various economic sectors of society and calculates potential jobs. One of the primary tools in the model is the use of multipliers, which reflect the employment potential of a given industry (see ECONorthwest, 2001). A second approach is to analyse and estimate jobs per unit of energy capacity, and multiply this with scenarios for renewable energy use. Key examples are the studies done by AusWEA (2003) and Passey (2003), in which projections are made based on literature reviews and case studies of the industry in question. A third ‘bottom-up’ approach is to assess existing installations in terms of their labour requirements. One of the primary examples of this kind of approach is the work done by the Renewable Energy Policy Project in their study “The work that goes into Renewable Energy” (REPP, 2001a), which was based on a number of extensive surveys of companies responsible for renewable electricity generator deployments in the USA. While I-O models have the advantage of estimating direct jobs, indirect jobs as well as induced jobs (see Section 5.1), they do not disaggregate renewable energy jobs by specific production cycle elements, or tasks, as the survey/scenario approaches often do. On the other hand, the ‘bottom-up’ approach does not include additional jobs resulting from the multiplier effect, or jobs for manufacturing basic inputs such as steel, nor positive spin-offs to the general economy due to additional cash liquidity because of the additional jobs.

Employment potential of Renewable Energy in South Africa SECCP
AGAMA Energy (Pty) Ltd 14 November 2003
5
This study has focussed on a combination of the latter two approaches and as a result, the total job estimates can be considered conservative estimates of total labour impacts (REPP, 2001a). Importantly, this study will examine the impacts of an RE deployment strategy on direct jobs, while indicating the number of indirect and induced jobs that would result.
2.3 Data collection
The employment data was sourced using industry bodies as well as a wide range of cross-sectoral stakeholders. Information was also obtained through a wide-ranging literature review, and analysed according to each RET’s production cycle element. These elements were reduced to
• Fuel production/harvesting • Component manufacture and assembly • Power plant installation • Operations and maintenance (O&M) • Other. These include jobs that either are not defined in the reports surveyed, or do
not directly fit any of the other four elements (for example, research and development, management, clerical). Where this proportion of jobs is large, details are provided in the text.
While production cycle elements such as waste management and decommissioning were originally included, a general lack of accurate information has resulted in their being excluded. The final job data template that was used for job data collation is included as Appendix A. A database of some 190 potential respondents was prepared, spanning industry, NGO’s, labour unions and research councils, academia, private consultants and politicians, both locally and abroad (Appendix B). The respondent database was then refined, with about 90 people contributing to the research process. The respondents were encouraged to contribute both their own thoughts as well as relevant research papers.
2.4 Research seminars
Two research seminars were held to engage with interested stakeholders. The first was held on 8th September 2003 at the Energy Research Institute, University of Cape Town and the second on 29th September 2003 at the same venue. Copies of the notes from these two seminars are included in Appendix C.

Employment potential of Renewable Energy in South Africa SECCP
AGAMA Energy (Pty) Ltd 14 November 2003
6
3. South African energy in context1 In this section, the overall energy sector is reviewed, as well as current employment data for the conventional sector presented. The information provides a useful background to the future of energy in South Africa, which is moving towards a greater level of privatisation and deregulation than now, or before. With such restructuring comes an inevitable decline in the workforce, as private companies seek to reduce their cost of doing business.
3.1 Energy in the macro-economic context
The energy sector has a significant effect on the macro-economy. Investments in energy industries such as coal mines, power stations and oil refineries, represent a large demand on available investment capital that is in short supply (SAEPDD, 2003). In the past, there have been significant demands on the fiscus for funding huge investments in synthetic fuels and there are continued subsidies for both these and nuclear energy (DME, 2001), as well as the cost of guaranteeing international loans (Basson, 2003). Investment by Eskom in new power stations peaked in 1985 but relatively high levels of investment were sustained by Sasol, Mossgas and more recently by oil refiners. In this regard, note for example the recently announced US$100 million investment in improved refining of oils by BP South Africa, in a move to reduce the overall lead content in gasoline. Imports of crude oil represent nearly 10%2 of the value of total imports (which is highly dependent on crude price) and taxes on liquid fuels make up about 10% of government revenue. Because energy is a significant input to many industries - directly, and through transport costs - energy prices have a strong impact on inflation. Energy consumption has been increasing steadily but this consumption is linked to GDP growth. Whilst some industrialised economies have managed to delink energy consumption from economic growth, it appears that South Africa will continue to experience growth in total energy consumption as GDP increases. This will no doubt remain true for some time unless radical efficiency measures and restructuring of the economy occurs. The high-energy intensity of industry, the main energy-consuming sector, and relatively low cost of electricity militates against this and while this should not deter policies aimed at greater efficiency, increased consumption connected to economic growth can be expected in the short term at least. In this regard, the current and historic emphasis by government and Eskom of motivating investment in electricity intensive industries by means of the low cost and special low marginal cost pricing deals is noteworthy. The relative size of the South Africa energy sector's contribution to GDP, including energy related taxes, at 15%, is also important (SAEPDD, 1995). This compares with an average of 8% in the International Energy Agency (IEA) countries which points to both the structure of South Africa's economy as well as the relative inefficiency of the energy sector as a result of low energy prices.
1 This section draws largely from the summary of South African Energy Policy presented in “Bulk Renewable
Energy Independent Power Producers in South Africa” (DME, 2001: 37-41 & 54-59) 2 In 1995, SAEPDD 1995.
Employment potential of Renewable Energy in South Africa SECCP
AGAMA Energy (Pty) Ltd 14 November 2003
7
3.2 Conventional sources of electricity: consumption and jobs
Against this backdrop, we find an energy sector that is predominantly dependent on poor quality coal for both its final energy as well as electricity supply. Based on figures published by the National Electricity Regulator (NER, 2000), coal and nuclear account for 92.8% and 6.7% respectively of total electricity supplied, on a consumption basis. These figures are 180.5 TWh and 13.0 TWh respectively, with a total electricity supply figure of 194.5 TWh. The balance of the supply is derived from hydro, bagasse and gas sources.
3.2.1 Coal
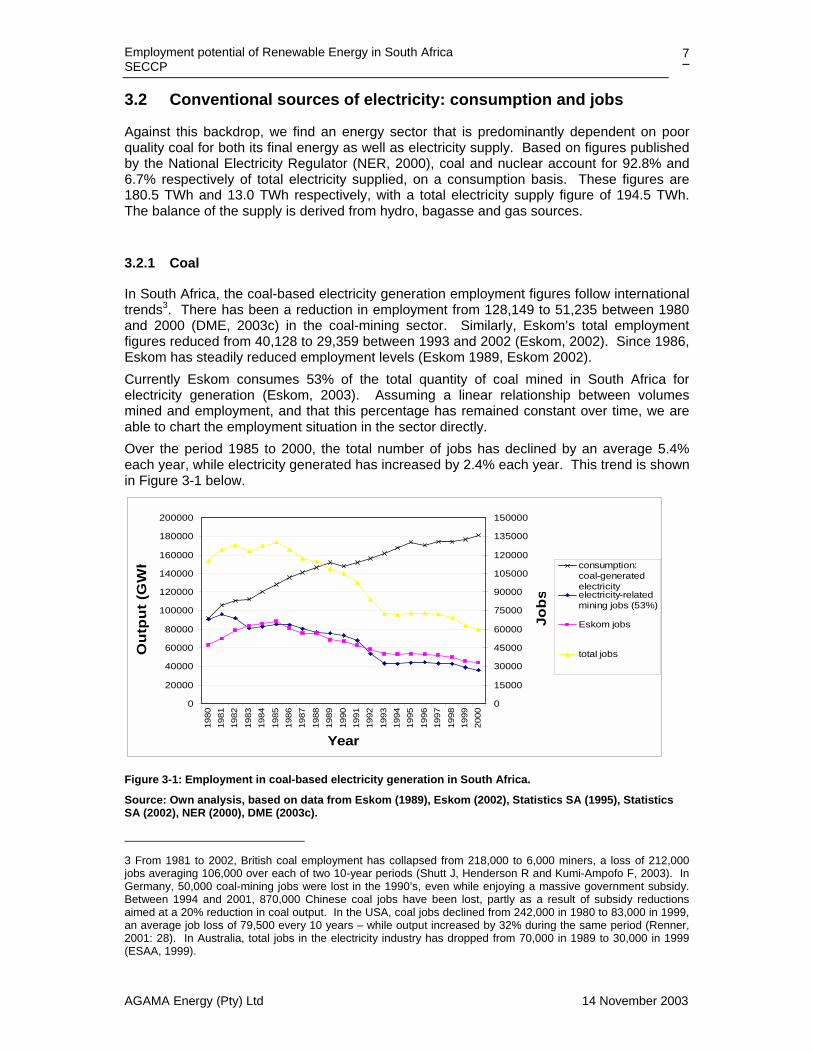
In South Africa, the coal-based electricity generation employment figures follow international trends3. There has been a reduction in employment from 128,149 to 51,235 between 1980 and 2000 (DME, 2003c) in the coal-mining sector. Similarly, Eskom’s total employment figures reduced from 40,128 to 29,359 between 1993 and 2002 (Eskom, 2002). Since 1986, Eskom has steadily reduced employment levels (Eskom 1989, Eskom 2002). Currently Eskom consumes 53% of the total quantity of coal mined in South Africa for electricity generation (Eskom, 2003). Assuming a linear relationship between volumes mined and employment, and that this percentage has remained constant over time, we are able to chart the employment situation in the sector directly. Over the period 1985 to 2000, the total number of jobs has declined by an average 5.4% each year, while electricity generated has increased by 2.4% each year. This trend is shown in Figure 3-1 below.
0
20000
40000
60000
80000
100000
120000
140000
160000
180000
200000
1980
1981
1982
1983
1984
1985
1986
1987
1988
1989
1990
1991
1992
1993
1994
1995
1996
1997
1998
1999
2000
Year
Out
put (
GW
h
0
15000
30000
45000
60000
75000
90000
105000
120000
135000
150000
Jobs
consumption:coal-generatedelectricityelectricity-relatedmining jobs (53%)
Eskom jobs
total jobs
Figure 3-1: Employment in coal-based electricity generation in South Africa.
Source: Own analysis, based on data from Eskom (1989), Eskom (2002), Statistics SA (1995), Statistics SA (2002), NER (2000), DME (2003c).
3 From 1981 to 2002, British coal employment has collapsed from 218,000 to 6,000 miners, a loss of 212,000 jobs averaging 106,000 over each of two 10-year periods (Shutt J, Henderson R and Kumi-Ampofo F, 2003). In Germany, 50,000 coal-mining jobs were lost in the 1990’s, even while enjoying a massive government subsidy. Between 1994 and 2001, 870,000 Chinese coal jobs have been lost, partly as a result of subsidy reductions aimed at a 20% reduction in coal output. In the USA, coal jobs declined from 242,000 in 1980 to 83,000 in 1999, an average job loss of 79,500 every 10 years – while output increased by 32% during the same period (Renner, 2001: 28). In Australia, total jobs in the electricity industry has dropped from 70,000 in 1989 to 30,000 in 1999 (ESAA, 1999).

Employment potential of Renewable Energy in South Africa SECCP
AGAMA Energy (Pty) Ltd 14 November 2003
8
Over this period, the total loss of jobs has been from 130,108 to 59,987 (53.9%) while electricity generation has climbed from 121,987 to 181,573 GWh, or 60.4%. Thus, the number of jobs/GWh has fallen from 1.1 jobs/GWh in 1985 to 0.3 jobs/GWh in 2000. These figures correspond to approximately 5.7 jobs/MW and 1.7 jobs/MW installed capacity respectively. It would be inexact to take these employment versus electricity consumption figures and compare them directly with the increased deployment of RETs, simply because the coal-based generation capacity already exists. Thus, it is more appropriate to associate jobs in the coal-mining sector (or 53% thereof) to the fuel production element of the production cycle, with the Eskom jobs being assigned to the O&M element. Using data for 2000, we thus have fuel production (coal mining) figures of 0.15 jobs/GWh and 0.77 jobs/MW, and for O&M 0.18 jobs/GWh and 0.93 jobs/MW. Accessing good data on the employment figures in constructing a new coal-fired thermal power station has proven surprisingly difficult. Although attempts were made to get this information from Eskom, unfortunately no firm data was available. However, one set of data has been sourced, in which expanding an existing 300 MW coal-fired plant would employ 400 people (Western Power, 2003). This is equivalent to 1.2 direct jobs/MW4, or around 2.5 jobs/GWh. The larger turbines installed in South Africa are imported, with only components of some smaller (~ 30 MW) turbines being manufactured locally. For the purposes of this study it has been assumed that larger turbines would be employed in future scaling up of coal-fired generation capacity, with no local manufacture of components.
3.2.2 Nuclear
South Africa’s single nuclear power generating station, Koeberg, has a capacity of 1840 MW and an annual output of 13 TWh, at a capacity factor of 0.81. Approximately 1000 people are employed in nuclear power generation in South Africa (Eskom, 2003). This is equivalent to 0.54 jobs/MW and 0.08 jobs/GWh, in O&M. Employment potential of the proposed Pebble Bed Modular Reactor (PBMR) demonstration plant, with an output capacity of 110 MW, has been set out in the environmental impact assessment (PBMR, 2002). The lifetime of this pilot, pre-commercialisation plant is seven years. The construction phase has been described as taking less than a year, and involving 1250 – 1400 employees. Fulltime operations and maintenance (O&M) staff has been estimated at 50 – 80 people, with a further 30 O&M jobs being outsourced. While fuel production and transport could be significant, no information in this regard was obtained. This data is summarised in Table 3-1 below, assuming a full plant lifetime of 25 years and the same capacity factor for PBMR as for the Koeberg station, namely 0.81.
Table 3-1: Employment data for PBMR
Mnfr Inst O&M Other Total /MW /GWh /MW /GWh /MW /GWh /MW /GWh /MW /GWh
? ? 0.38 – 0.42
0.05 – 0.05
0.73 – 1.0
0.1 – 0.13 0.0 0.0
1.11 – 1.42
0.15 – 0.18
4 Using Caltex refinery design and construction information for comparison purposes, the number of jobs associated with a refinery plant construction is equivalent to 0.9 jobs/MW (Adapted from information from Mackenzie-Hoy, 2003).
Employment potential of Renewable Energy in South Africa SECCP
AGAMA Energy (Pty) Ltd 14 November 2003
9
These total figures are approximately double those of the more conventional Koeberg power station. Note that the figures are based on the data for the development of the demonstration plant (operation for 7 years), with the same figures then being used for a full-production plant being in operation for 25 years. Hence, the results are very liberal in two ways: the number of jobs will be higher for a one-off, and the plant life could be more like 40 years, both of which would reduce the number of jobs below what has been presented.
3.2.3 Natural gas
A proposal currently on the table to develop the natural gas market and industry in the Western Cape provides some insight into the potential for job creation. The data has been extracted from a presentation (Hoffman B, 2003) forming part of the Public Participation Process during the scoping stages of a proposed natural gas industry for the Western Cape. Potential exists for the development of an 800 to 1400 MW Independent Power Producer (IPP) in 2006, 800 to 2000 MW IPP in 2008 and 1600 to 2000 MW in 2012. While not all the gas brought to land from the Kudu and Ibhubesi gas fields will be utilised in electrical generation plants – since there will be some fuel switching and LP gas replacement – there are nevertheless three categories of activities in which jobs will be created. In drilling and testing a gas well, it is estimated that hundreds of people are involved. This capacity exists to a large degree in the country already. In developing a gas delivery system, thousands of new jobs are created, while bringing the gas to market required the development of a dedicated commercial industry, involving the creation of tens of thousands of jobs. The available data is not specific enough to allow for a complete comparison of the employment potential of the natural gas industry, but international experience does provide some insight, mainly in the O&M element of the production cycle. In Brazil, the natural gas sector is estimated to employ directly 250 people/TWh generated (Grassi, G. 1996). The most detailed analysis of this technology was undertaken in California (CALPIRG, 2002) (see Appendix F), by means of an analysis of nineteen permit applications for proposed natural gas fired power plants. The analysis showed the employment potential of this technology to be markedly lower than that from RETs. Relative to natural gas, wind, solar PV, solar thermal and landfill gas offer 1.7, 2.2, 2.5 and 14.7 times as many jobs (for a 500 MW installation of each technology). The same study estimates that the number of jobs/MW in gas plant construction and installation, and O&M, is 1.02 and 0.13 respectively.
3.2.4 Summary of employment in the conventional energy sector
In order to allow for a direct comparison of the total jobs in the conventional energy sector against those in the RETs, the current employment figures for the conventional energies need to be extrapolated into the future, to 2012 and 2020. For coal-based electricity generation, it has been shown that the total employment has been decreasing, at least up to 2000, at 3.9% per annum. However, since the rate of job losses in the sector will tend to decrease in the future, it has been assumed for the purposes of this analysis that the job figures for 2000 remain constant to 2020, thus allowing for a conservative comparative mark. Similarly, for nuclear and natural gas (where we shall use figures from abroad, presented in CALPIRG 2002) the current employment levels are assumed to remain constant. For conventional nuclear this is a realistic assessment since the technology is already quite mature in South Africa, while for the PBMR is not mature and jobs in construction could well decline quite dramatically against those presented for the pilot plant. For natural gas, this is problematic since we will not be able to include the benefit of
Employment potential of Renewable Energy in South Africa SECCP
AGAMA Energy (Pty) Ltd 14 November 2003
10
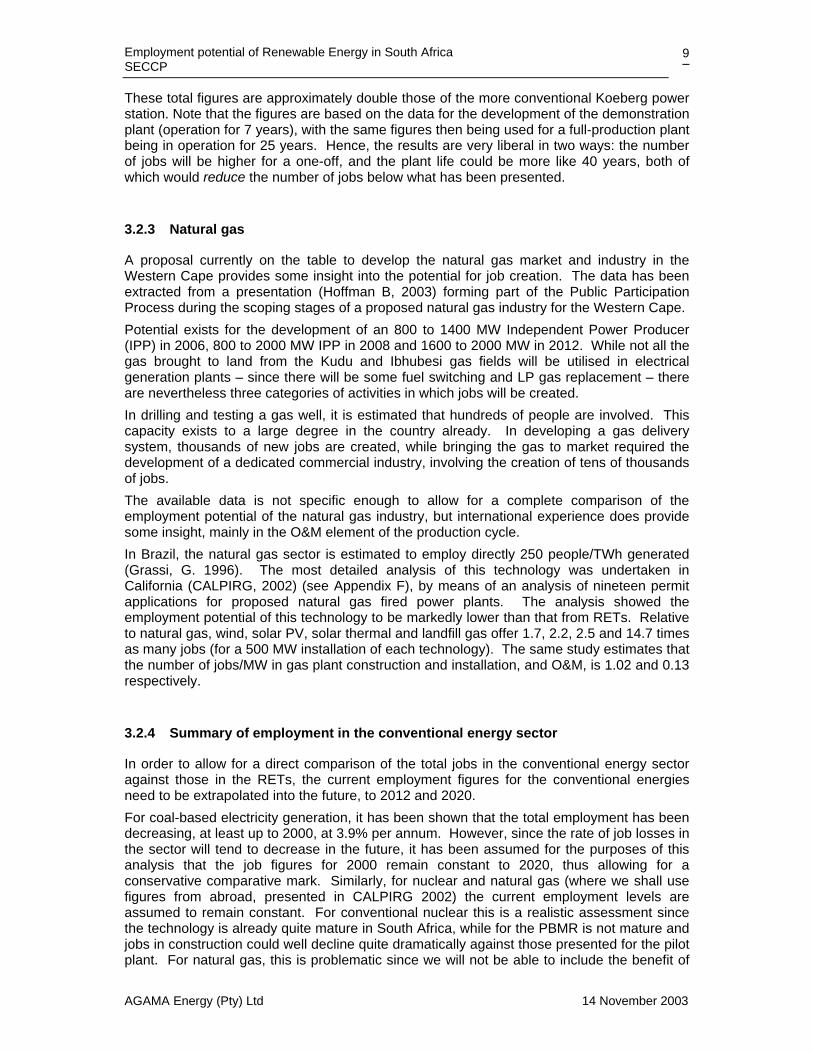
fuel distribution and manufacture. Nevertheless, the figures cited in the previous section provide an indication of the impact of natural gas in the overall electricity sector. A summary of the employment potential of the conventional energy sources is presented in Table 3-2.
Table 3-2: Summary of conventional energy employment potential, in terms of jobs/MW installed or jobs/GWh produced
Fuel Mnfr Inst O&M Total /MW /GWh /MW /GWh /MW /GWh /MW /GWh /MW /GWh
Coal (current)5 0.8 0.2 0.0 0.0 0.9 0.2 1.7 0.3 Coal (future) 0.8 0.2 0.0 0.0 1.3 0.3 0.9 0.2 3.0 0.7 Nuclear 0.5 0.1 0.5 0.1 PBMR 0.4 0.1 0.9 0.1 1.3 0.2 Gas 1.0 0.1 0.1 0.0 1.2 0.1
3.3 Government energy policy
The South African government policy pays strong attention to the development of the energy sector, but it also addresses the interdependencies and synergies to other economic sectors. Through these linkages, the energy sector can greatly contribute to a successful and sustainable national growth and development strategy. The new government has adopted a macro-economic strategy, Growth, Employment and Redistribution (GEAR), which aims at promoting growth through exports and investment; and promoting redistribution by creating jobs and reallocating resources through the budget. GEAR replaced the first reform programme devised by the new government, the Reconstruction and Development Programme. Energy policy has been recognised as an important factor contributing to economic growth and employment creation aims. The rural electrification targets of the Reconstruction and Development Programme are an example of energy policy and social and economic development linkages. The Government corporate governance protocol for state-owned entities, including the energy sector, takes the focus further by including a programme on the restructuring and privatising of national state enterprises. The privatisation drive and the opening up of the South African economy have created a much more complex environment for energy supply, demand and pricing that demands more intricate energy sector decisions. As a result, international factors now more transparently influence the energy sector. Perhaps the most significant recent international shift in international energy policy is using greater supply diversification and flexibility to achieve energy security. Consequently, the international energy sector is increasingly reliant on market-based pricing. This has lead to South Africa’s intensifying of its commercialisation efforts of the energy sector in order to be competitive in this context.
5 Note that indices for fuel (mining) and O&M represents current data, while that for installation includes new plant installation.
Employment potential of Renewable Energy in South Africa SECCP
AGAMA Energy (Pty) Ltd 14 November 2003
11
The regional integration of South Africa's energy decisions, regulations and operations is an important consideration. In the Southern African region, the Southern African Development Community (SADC) has decided to adopt an energy co-operation policy and strategy. In contrast to other sections of the economy, the energy sector has in many cases larger environmental impacts than most other economic sectors. Due to the heightened awareness of these environmental impacts, investments in energy are increasingly subjected to greater environmental scrutiny. In this context, energy policies increasingly target a reduction in emissions (within the context of Global Climate Change initiatives) and adverse environmental impacts of energy operations and energy usage. One of the avenues pursued is to promote research and development of alternative and renewable energy sources. In recent years, several renewable off-grid energy projects have been planned and begun. However, most of these initiatives focus on off-grid renewable energy supply, mainly targeted at small, decentralised units that operate at very high marginal costs and only generate a small amount of the potential energy requirements.
3.4 The Energy White Paper (EWP)
The ”White Paper on Energy Policy for the Republic of South Africa”, published by the Department of Minerals and Energy, December 1998, is the most recent and comprehensive energy policy document for South Africa. Of relevance to this study, one of the five energy sector policy objectives is stated as being the pursuance of both supply sources and primary energy carriers (DME, 1998). Some of the medium-term policy priorities are (page 14-15): • Stimulate the development of new and renewable sources of energy • Adjust electricity market structures to achieve effective forms of competition • Establish regulations which promote a cost-of-supply approach to electricity pricing for
non-domestic consumers • Investigate an environmental levy on energy sales to fund the development of renewable
energy, energy efficiency and sustainable energy activities For non-utility generation, the tariffs shall be approved “on the basis of full avoided costs”. “By including environmental costs into the pricing structure for further development of renewable and environmentally benign generation technologies such as hydro, wind, solar thermal, and waste incineration will also be encouraged”. On electricity transmission, the White Paper states “Government will legislate for transmission lines to provide for non-discriminatory open access to uncommitted capacity, transparency of tariffs, and disclosure of cost and pricing information to the National Electricity Regulator.” These are two critical facets of the White Paper that readily support the uptake of RETs, should this stated support be translated into positive action.
3.5 Renewable Energy according to the Energy White Paper
Government policy on renewable energy is concerned with meeting the following challenges: • ensuring that economically feasible technologies and applications are implemented; • ensuring that an equitable level of national resources is invested in renewable
technologies, given their potential and compared to investments in other energy supply options; and
• addressing constraints on the development of the renewable industry.

Employment potential of Renewable Energy in South Africa SECCP
AGAMA Energy (Pty) Ltd 14 November 2003
12
Government policy is based on an understanding that renewables are energy sources in their own right, are not limited to small-scale and remote applications, and have significant medium and long-term commercial potential. Thus, • Government will provide focused support for the development, demonstration and
implementation of renewable energy sources for both small and large-scale applications; • Government will support renewable energy technologies for application in specific
markets on the basis of researched priorities; • Government will facilitate the production and management of woodlands through a
national social forestry programme for the benefit of rural households, where appropriate;
• Government will promote the development and implementation of appropriate standards and guidelines and codes of practice for the correct use of renewable energy technologies; and
• Government will establish suitable information systems of renewable energy statistics, where justifiable, and will assist with the dissemination thereof.
As a result of this EWP the DME has embarked on the development of two White Papers aimed at both the promotion of RE as well as an implementation strategy.
3.6 Restructuring in the electricity sector
Government is currently considering implementing reform initiatives in both the Electricity Distribution Industry (EDI) and the Electricity Supply Industry (ESI). Reform of the EDI is being initiated primarily because the industry is fragmented, with many distributors not being financially viable. ESI reform follows international trends whereby competition and greater private sector participation is being called for (including participation by previously disadvantaged companies or individuals). The restructuring is important in the context of this study since increasing privatisation inevitably leads to greater efficiency with its associated job losses. The ultimate aim of restructuring is to improve the quality of life of all South Africans, to increase economic growth and redeployment of assets. It is essential that individual state enterprises should be competitive and efficient in the domestic and international markets and should be positioned to access global resources and markets within a proper institutional regulator framework. It is also essential that improvements in corporate governance within the public sector allow for effective management, investment policies, accountably and transparency. The Minister of Public Enterprises has given the deadline for the entire restructuring programme to be finalised by 2004 (Eskom 2003c). During the latter part of 1999, Eskom took the first of a series of steps to ready itself for the impending restructuring by splitting its business into regulated and non-regulated Divisions. The key changes pertaining to differentiating Eskom’s regulated and non-regulated businesses include:
• The creation of Eskom Enterprises, the non-regulated component, as the Eskom subsidiary company responsible for all of Eskom’s non-regulated business activities both within South Africa and beyond its borders.
• The transfer of certain functions from Eskom’s regulated structure to Eskom Enterprises.
• The strengthening of Eskom’s regulated business Divisions.
Employment potential of Renewable Energy in South Africa SECCP
AGAMA Energy (Pty) Ltd 14 November 2003
13
3.6.1 Distribution
Government’s policy on the Electricity Distribution Industry (EDI) requires the Division to be separated from Eskom and merged with the electricity departments of more than 400 municipalities to form a number of financially viable regional electricity distributors (REDs). An interim body, called EDI Holdings, will oversee the transition period. The REDs will be subsidiaries of the Holding Company until they can become independent. They will be responsible for the distribution of electricity and the collection of revenue.
3.6.2 Electricity Supply Industry
For some years now, the Government of South Africa has been considering implementing significant change in the electricity supply industry (ESI). As explained below, proposed changes will follow international developments where competition has been introduced into generation sectors, as well as in the retail services component of the distribution industry. In this process, greater private sector participation in the power sector has been encouraged. It was stated in the White Paper that “any market restructuring is likely to be delayed for a number of years while the distribution sector is restructured and the bulk of the electrification programme is undertaken”. However, it seems now that ESI restructuring may even occur in parallel with these two processes. With a pressing need to make further progress in the area of ESI reform, the DME recently commissioned a paper on “A Competitive Electricity Market for South Africa.” The paper concludes with the following steps for initial restructuring: • The corporatisation of Eskom; • The separation of Transmission into a state-owned company and the establishment of a
power exchange and a system operator within this framework; • The separation of Eskom’s power stations into a sufficiently large number of independent
competing generating companies directly owned by the State.
3.7 Unemployment in South Africa
South Africa has a high unemployment rate by international standards, emphasized recently by the publication of two sets of labour data by Statistics SA. The labour force survey, based on household surveys, shows the official unemployment rate of 31.2% in March 2003. The expanded definition, which includes people who have stopped looking for work, shows the unemployment rate to be 42.1% (Joffe H 2003). The survey of employment and earnings (based on a survey of medium to large formal-sector businesses) shows a small decline in employment in the formal sector in the first quarter of 2003. Although the data and scope of the two surveys are very different, the conclusion is that at least 5.2 million people are currently unemployed in the formal sector. Increasing the employment rate depends on the patterns of economic growth (Joffe H 2003): the rate of job creation depends on which sectors are the drivers of growth. While it is outside the scope of this research to define the impact a rapid uptake of RETs would have on the greater economy and job creation as a whole, it is generally accepted that substantial investments together with government financial and regulatory support will be required.

Employment potential of Renewable Energy in South Africa SECCP
AGAMA Energy (Pty) Ltd 14 November 2003
14
4. Literature review: renewable energy experience, potential and jobs In this section, we provide a background literature review of employment trends and energy potentials for renewable energy systems.
4.1 RETs: experiences and energy potential
In order to evaluate each RET’s employment potential, the technology’s total potential for deployment of electricity or energy capacity needs to be assessed, and these employment projections compared to the capacity potentials. In the end, the figures need to stand up to close inspection as to whether their deployment is practicable. Thus, this section is devoted to understanding the international growth of RETs, South Africa’s current use of RETs, as well as its energy and job potential. Note that the literature on employment in the RET sector is heavily biased towards studies performed in developed countries, which in general have a larger percentage of their total electricity supply being generated by RETs than exists in South Africa. As a result, the content invariably includes a greater proportion of European and American information. For a more detailed breakdown of the job data from reviewed literature for RET power generation presented below, please refer to Appendix F.
4.1.1 Wind Power
4.1.1.1 International experience
In 1998, the Institute for Prospective Technological Studies (IPTS) for the European Commission Joint Research Centre conducted a socio-economic assessment of RE projects in the Southern Mediterranean countries, such Morocco, Egypt, Tunisia and Algeria (IPTS, 1998). The study found that the employment generated from wind projects, when measured in job-years, is approximately half that of solar PV projects. By 2001, India had installed 1,340 MW of wind capacity, of a potential 20 GW (IRRD, 2001 & TERIIN, 2003). The 800 MW capacity in Tamil Nadu state has resulted in rural employment of between 7,000 and 9,000 people, at 8.75 – 11.25/MW installed. In 1999, India already had 14 domestic turbine manufacturers; spare parts production and turbine maintenance are helping at least some regions and villages generate much-needed income and employment. Argentina hopes to create 15,000 permanent jobs over the next decade (Renner, 2000). In Brazil, the estimated direct jobs in the wind industry are 918 jobs/TWh (Perez, 2001). In an excellent review of the employment impacts of renewable electricity systems, Renner (2000) cites evidence from numerous studies where wind and solar photovoltaic power has been found to compare favourably in its job-creating capacity with coal- and nuclear-generated electricity. In Germany, although wind energy contributed only 1.2 percent of total electricity generation in 1998, it provided about 15,000 jobs in manufacturing, installing, and operating wind machines. In comparison, nuclear power had 33 percent of the electricity market but supported a relatively meagre 38,000 jobs; coal-generated power had a 26 percent market share and gave rise to 80,000 jobs. A 1996 study (Danish Wind Turbines Manufacturers Association “Employment in the Wind Power Industry”, 1996 cited in Renner 2000) found that 16,000 jobs were created in the
Employment potential of Renewable Energy in South Africa SECCP
AGAMA Energy (Pty) Ltd 14 November 2003
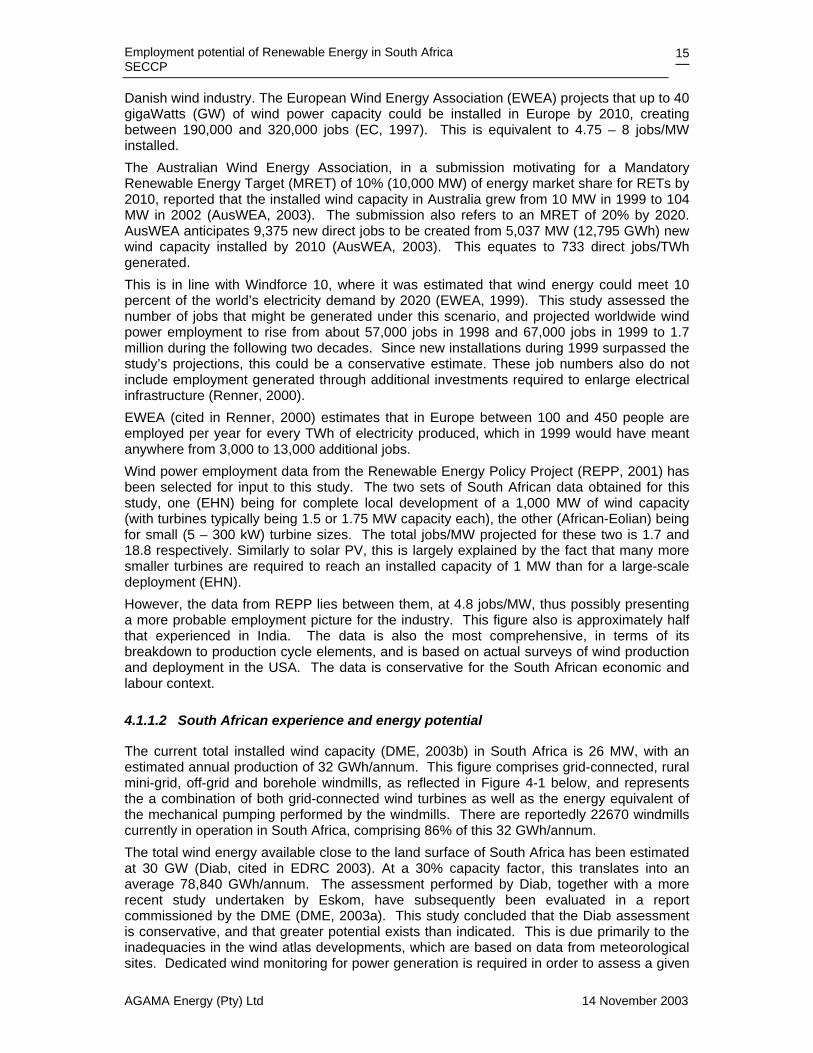
15
Danish wind industry. The European Wind Energy Association (EWEA) projects that up to 40 gigaWatts (GW) of wind power capacity could be installed in Europe by 2010, creating between 190,000 and 320,000 jobs (EC, 1997). This is equivalent to 4.75 – 8 jobs/MW installed. The Australian Wind Energy Association, in a submission motivating for a Mandatory Renewable Energy Target (MRET) of 10% (10,000 MW) of energy market share for RETs by 2010, reported that the installed wind capacity in Australia grew from 10 MW in 1999 to 104 MW in 2002 (AusWEA, 2003). The submission also refers to an MRET of 20% by 2020. AusWEA anticipates 9,375 new direct jobs to be created from 5,037 MW (12,795 GWh) new wind capacity installed by 2010 (AusWEA, 2003). This equates to 733 direct jobs/TWh generated. This is in line with Windforce 10, where it was estimated that wind energy could meet 10 percent of the world’s electricity demand by 2020 (EWEA, 1999). This study assessed the number of jobs that might be generated under this scenario, and projected worldwide wind power employment to rise from about 57,000 jobs in 1998 and 67,000 jobs in 1999 to 1.7 million during the following two decades. Since new installations during 1999 surpassed the study’s projections, this could be a conservative estimate. These job numbers also do not include employment generated through additional investments required to enlarge electrical infrastructure (Renner, 2000). EWEA (cited in Renner, 2000) estimates that in Europe between 100 and 450 people are employed per year for every TWh of electricity produced, which in 1999 would have meant anywhere from 3,000 to 13,000 additional jobs. Wind power employment data from the Renewable Energy Policy Project (REPP, 2001) has been selected for input to this study. The two sets of South African data obtained for this study, one (EHN) being for complete local development of a 1,000 MW of wind capacity (with turbines typically being 1.5 or 1.75 MW capacity each), the other (African-Eolian) being for small (5 – 300 kW) turbine sizes. The total jobs/MW projected for these two is 1.7 and 18.8 respectively. Similarly to solar PV, this is largely explained by the fact that many more smaller turbines are required to reach an installed capacity of 1 MW than for a large-scale deployment (EHN). However, the data from REPP lies between them, at 4.8 jobs/MW, thus possibly presenting a more probable employment picture for the industry. This figure also is approximately half that experienced in India. The data is also the most comprehensive, in terms of its breakdown to production cycle elements, and is based on actual surveys of wind production and deployment in the USA. The data is conservative for the South African economic and labour context.
4.1.1.2 South African experience and energy potential
The current total installed wind capacity (DME, 2003b) in South Africa is 26 MW, with an estimated annual production of 32 GWh/annum. This figure comprises grid-connected, rural mini-grid, off-grid and borehole windmills, as reflected in Figure 4-1 below, and represents the a combination of both grid-connected wind turbines as well as the energy equivalent of the mechanical pumping performed by the windmills. There are reportedly 22670 windmills currently in operation in South Africa, comprising 86% of this 32 GWh/annum. The total wind energy available close to the land surface of South Africa has been estimated at 30 GW (Diab, cited in EDRC 2003). At a 30% capacity factor, this translates into an average 78,840 GWh/annum. The assessment performed by Diab, together with a more recent study undertaken by Eskom, have subsequently been evaluated in a report commissioned by the DME (DME, 2003a). This study concluded that the Diab assessment is conservative, and that greater potential exists than indicated. This is due primarily to the inadequacies in the wind atlas developments, which are based on data from meteorological sites. Dedicated wind monitoring for power generation is required in order to assess a given
Employment potential of Renewable Energy in South Africa SECCP
AGAMA Energy (Pty) Ltd 14 November 2003
16
site’s potential power production, the important factor being the height at which the wind data is measured. The DME estimates the theoretical potential for harnessing wind power in South Africa to be around 26,000 GWh/annum (DME, 2003d), which is equivalent to around 10 GW installed capacity.
INSTALLED CAPACITY (kW)
22670; 85.9%
510; 1.9%
3160; 12.0%
45; 0.2%
National grid Rural mini-grid Off-grid Borehole windmills
Figure 4-1: Current installed wind capacity in South Africa
4.1.2 Solar thermal
Solar thermal electric systems offer considerable potential for large-scale (10MW+) electricity generation. The basis for electricity generation is that of focussing or concentrating solar radiation to achieve high temperatures to drive steam or external combustion cycle generators. Most of the technologies are still immature and require further development to achieve commercialisation. Solar thermal electric plant are either coupled in a hybrid configuration with a fuel such as natural gas or used in combination with advanced energy storage technologies such as molten salts to provide 24-hour production capacity (DME, 2001). The most widespread use of commercially available solar thermal electricity generation is by means of parabolic trough systems, which use parabolic mirrors to focus light on an oil-filled thermal collector, generating steam and driving a conventional Rankine cycle generation plant.
4.1.2.1 International experience
California has the best experience of parabolic trough systems with the installation in 1984 of nine parabolic trough systems ranging in size from 4 to 80 MW, and totalling 354 MW. These nine plants constitute over 90% of the solar thermal electricity generation in the world (Heavner B and Churchill S, 2002). In the publication Dollars from Sense, the US Department of Energy (DOE, 2003) indicates that an 80-MW solar parabolic trough employs 500 people, at an average 6.25 jobs/MW. EnviroMission in Australia are proposing to construct a 1,000 metre high solar tower, to generate 200 MW of power, and generate around 650 GWh of energy annually. The technology is the invention of German structural engineers Schlaich Bergerman, who constructed a 200-metre high demonstration power plant in Manzanares, Spain, in 1982.
Employment potential of Renewable Energy in South Africa SECCP
AGAMA Energy (Pty) Ltd 14 November 2003
17
The 50-kW plant produced electricity for seven years and then closed down after having proved the technology worked.
4.1.2.2 South African experience and energy potential
According to the DME’s White paper, potential exists in South Africa for 64.6 GW / 36.22 TWh/annum of electricity production from solar thermal sources. In this study, we will make use of data pertaining to the only technology that has enjoyed some practical experience in this area, namely the parabolic trough systems. A number of attempts were made to obtain feedback from Eskom’s SABREGen program regarding employment projections for the proposed 100 MW parabolic trough system in the Northern Cape. Unfortunately, to date no information has been forthcoming. To date there is one solar thermal source of electricity in South Africa, the Stirling-dish solar system housed at the Development Bank of South Africa in Midrand. This plant has a 25 kW output capacity, and is aimed at the distributed generation market. However, since this technology is currently at the pre-commercial stage locally (and internationally), there are no reliable data to inform this study in terms of its potential employment impacts (Van Heerden, 2003). Another potential application of solar thermal is that of the proposed 400 MW solar chimney for the Northern Cape. According to the technology proponent and consultant, three solar chimneys (or ‘Greentowers’) are proposed. At a 0.89 capacity factor, and 4% total conversion efficiency, each chimney will generate 125 GWh/annum (Stinnes, 2003).
4.1.3 Solar PV
Solar energy is used in two main ways: to make electricity (photovoltaics) and to heat water (solar thermal). Implementation of photovoltaic (PV) systems predominates and data is also more readily available. As with wind, global installed capacity has increased more than ten fold over the last decade, albeit from a very low base.
4.1.3.1 International experience
The 1998 IPTS study found that the employment generated from solar PV projects, when measured in job-years, is approximately twice as high as in wind and biomass projects. By 2001, India had installed 2,145 MWp of solar PV, with 40% of the 20 MWp produced in 2000 being exported. Total installed capacity in the OECD (Organisation for Economic Cooperation and Development) countries at the end of 2001 was less than 1 GW. The installed PV capacity base is concentrated in a relatively small number of countries. Between them, Japan, Germany and the USA account for around 80% of total installed capacity in the OECD. In 2001, Japan achieved the largest PV capacity additions of any country, adding 122 megawatts (MW) or almost 50% of total OECD capacity additions. Japan is the world's largest solar PV market with over 450 MW of installed capacity. Also in 2001, around 98 MW of capacity was added in Europe, representing a growth rate of almost 50% in installed capacity. Germany accounted for over 80% of capacity additions in Europe. In the process, Germany became the second largest market in the world in terms of installed capacity, overtaking the USA. In the same year, the US installed capacity base grew by 29 MW, a growth rate of around 21% (BP, 2003). In the USA, the Solar Energy Industries Association (SEIA) estimates that 3,800 jobs are created for every $100 million (35 MWp) in PV cell sales, and more than 350,000 net jobs will
Employment potential of Renewable Energy in South Africa SECCP
AGAMA Energy (Pty) Ltd 14 November 2003
18
be created by 2010. In 1999, the U.S. solar industries directly employed nearly 20,000 people and supported more than 150,000 indirect jobs (SEIA, 1999 cited in Renner 2000). The European Photovoltaic Industry Association projects that the production, installation, and maintenance of photovoltaics could directly employ up to 294,000 people by 2010. The European Solar Industry Federation employed more than 10,000 people in 1997 in designing, manufacturing, marketing, installing, and maintaining solar PV systems. With forecast market growth trends, the Federation projected the creation of 70,000 additional jobs in the following ten years, and perhaps up to 250,000 (Renner, 2000). However, this growth was dependent on strong government support.
4.1.3.2 South African experience and energy potential
South Africa has currently 11.9 MWp installed capacity (DME, 2002), generating 20.9 GWh/annum, at an average capacity factor of 0.20. There is approximately 150 kW of installed grid-connected solar PV capacity (DME, 2003d). The annual levels of production in two manufacturing plants in South Africa are around 2.5 – 3 MWp, but with their combined production capacity being in the order of 15 – 16 MWp per annum (DME, 2002). This indicates a current manufacturing over-capacity of around 500%. Despite the available solar radiation being our greatest resource, other factors such as cost, financing and institutional capacity tend rather to limit its uptake. The current estimate of employment in this sector is 300 people, primarily in the DME’s non-grid electrification (NGE) program. This is supported by an electronic survey of the RE industry in 2002 (Holm, D. and Agert, C., 2002) in which it is noted that the RE sector is “strongly focussing on off-grid photovoltaic applications”. Total current employment in the sector is thus in the order of 25 people per MWp.
4.1.4 Landfill gas
Landfill sites were developed to solve the problems associated with open rubbish dumps. The advantages of landfill are: (1) pollution of surface water and underground water can be prevented in advance by seepage control; and (2) inflammable and explosive gas emitted from refuse can be collected by pipeline and used for power generation or chemical raw materials.
4.1.4.1 International experience
Landfills are popular in many countries because they are simple to operate, low cost, and suitable for various kinds of refuse and energy recovery. At present, 4,817 landfill plants have been built globally: 2,247 are in the USA and 175 in Europe. Worldwide, 5,142 billion cubic meters of landfill biogas is collected annually, equal to 2.4 million tons of crude oil or 60,000 TWh (New Energy, 2003). By 2000, India had installed 15.2 MW of electricity generation capacity out of an overall potential of 1,700 MW (TERIIN, 2003). The installed electricity generating capacity from landfill gas in Australia was about 72MW in 1997. Landfill gas projects are a recent development, with only 15 projects currently operating in Australia (ACRE 1998). Under the second Non-Fossil Fuel Obligation (NFFO-2) of the British government, 42 MW of landfill power plants were developed by 1995. Under NFFO-3, power generation from landfill sites is expected to be around an additional 39 to 52 MW (NFFO, 2003). The EPRI study cited in CALPIRG (2002) indicates 3.71 and 2.28 jobs/MW for construction and O&M activities, respectively.
Employment potential of Renewable Energy in South Africa SECCP
AGAMA Energy (Pty) Ltd 14 November 2003
19
4.1.4.2 South African experience and energy potential
The energy content of the total domestic and commercial waste sent to landfills in South Africa is estimated to be around 11,000 GWh/annum. Additionally, the net realisable energy from sewage waste is estimate to be in the order of 800 GWh/annum (DME, 2003d). A Clean Development Mechanism (CDM) proposal is currently being prepared for the development of the Bellville South landfill site (Thorne, 2003), which receives about 25% of Cape Town’s domestic refuse. The project activity will look at maximising the production of gas by actively extracting gas from deeper wells and the use of the gas as a fuel. Energy (thermal or electrical) will be marketed to selected members of the adjacent industrial area (Bellville Sacks Circle) including a glass manufacturer (Consol glass) or nylon spinner (South African Nylon Spinners (SANS)) and/or the City Council-owned Waste Water Treatment plant. The gas will be provided for a minimum of 15 years. The long term objective of this project activity is to gradually transform an “end of life” landfill into a “renewable energy/waste recovery park” which is not only environmentally rehabilitated but also provides socio-economic spin offs for the adjacent industrial and residential communities by creating jobs (through onsite recycling units) and provide renewable energy for a minimum of 15 years. Both activities would result in lower GHG emissions than in the business as usual cases. The proposal estimates total electrical generation capacity to be 46 MW (SSN, 2003). In a similar project, Ethekwini municipality has recently developed a landfill gas-to-energy plant proposal for South Africa, to be implemented at its Bisasar Road landfill site. The project is to be co-financed by the World Bank’s Prototype Carbon Fund, which negotiated for the purchase of Certified Emissions Reduction resulting from the gas recovery process. The plant capacity is expected to be greater than 40 MW, and have an electrical output of 67.8 GWh/annum (PCF, 2003).
4.1.5 Biomass Combined Heat and Power (CHP)
Employment creation is heralded as a major positive feature of biomass-based energy or bioenergy systems because of the many inherent multiplier effects, such as the stimulation of economic activity and strengthening of the local economy, particularly in rural areas. Bioenergy use is already a significant source of employment and income generation for many poor people in developing countries, and South Africa is no exception. However, this activity is mainly focussed on the collecting, preparation and marketing of woodfuels, the so-called traditional biomass. Agriculture and forestry, which incorporate many bioenergy-related activities, are the most intensive and largest source of employment worldwide according to the Food and Agriculture Organisation (FAO) of the UN. A rough estimate of employment in the forestry sector suggests that annually about 60 million person/years are employed in the forestry sector globally i.e. 48 million in developing countries and 12 million in industrialised countries. Some 20-25 million person/years annually are employed just in fuelwood collection and charcoal production in developing countries (FAO, 1996). Four fundamental forms of biomass energy use can be identified (see Appendix D: Forms of biomass utilisation for a description). The focus in this study will be on the so-called modern bioenergy sector in which biomass resources are converted into more convenient energy carriers such as electricity, gas and liquid fuels. Thus, for example, a biomass resource such as wood can be converted into electricity, charcoal or gas. This gas can in turn be converted into heat, electricity or even methanol. An important characteristic of many modern bioenergy conversion technologies is that they can often be deployed on a smaller scale than many fossil-fuelled energy systems, and thus
Employment potential of Renewable Energy in South Africa SECCP
AGAMA Energy (Pty) Ltd 14 November 2003
20
potentially allow for greater decentralisation and hence, the spreading of both the energy and employment benefits. An example of this can be seen in the deployment of biogas digesters in rural India, China and more recently Nepal, and the use of small gasifiers to produce process heat and electricity.
4.1.5.1 International experience
By 2000, India had installed 222 MW of bagasse CHP capacity, of a potential 3,500 MW (TERRIN, 2003). Bagasse currently represents about 2% of Australia’s total primary energy consumption. The steam produced is used to drive sugar cane mills, for process heating, and for grid-connected electricity production. The sugar mills in Queensland, NSW and WA have a combined capacity of about 300MW. Increasingly, bagasse is being utilised in cogeneration systems and using more efficient conversion systems and additional fuel inputs this could easily treble (ACRE, 1998).
4.1.5.2 South African experience and energy potential
Total energy supply figures for South Africa indicate that biomass accounts for 5.1% of the total primary energy supply (DME’s National Energy Balance 2001, cited in EDRC, 2003). The DME reported in its 2002 National Energy Balance that biomass was 8.7% of final consumption (cited in EDRC 2003), yet its contribution has been reported to vary by a factor of two. The EDRC goes on to describe the energy supply from biomass in 1999-2000 and 1993-1997 as 190 PJ and 370 PJ respectively. Thus, reported data for different years varies dramatically for no apparent reason. In addition, since the majority of this consumption is for rural domestic use, it is questionable whether its usage is sustainable, and therefore, renewable. The main sources of biomass that have been identified as viable for large-scale power production in the South African context are bagasse from the sugar industry and wastes in the wood and paper industries. In the South African context, cogeneration power plants range in size from 5 to 50 MW (DME, 2001). The current contribution of cogeneration plant using sugar cane bagasse is about 1% of the total electricity supply (NER 2000), with the DME reporting in 2003 that bagasse CHP generation accounts for 210 GWh/annum (DME, 2003d). The report goes on to estimate the total potential using existing bagasse feedstock 1,400 GWh/annum, with sawmills and pulp mills having a potential of 7,600 and 4,500 GWh/annum, respectively. We now discuss these two sources of CHP generation in greater detail below.
4.1.5.2.1 Sugar industry CHP Currently most sugar mills in South Africa are running their boilers and power generation plant to satisfy their own heat and power needs. In many cases, this may mean that they are running relatively inefficiently, so as to ensure that they consume all their fibrous bagasse by-product, which is bulky and difficult to store. However, if incentives existed for these plants to export their excess potential power they would be able to produce about 30 kWh/tonne of cane crushed - on average and with based on current technology. This excess electricity could then be exported and sold. With investment in higher-pressure boilers and condensing steam turbines, this output could be boosted to around 200 kWh/tonne of cane (Wienese 2003). At the current level of 23 million tonnes of cane crushed per year, this would represent around 4600 GWh/year. Importantly, however, there would be very few new jobs resulting for this increase in power production. A further source of biomass for power production in the sugar industry is the tops and leaves, also known as trash, which are currently left in the cane fields at harvest time. Investigations are being conducted to harvest the whole cane stalk, including the tops and
Employment potential of Renewable Energy in South Africa SECCP
AGAMA Energy (Pty) Ltd 14 November 2003
21
trash, and transport this to the mill. The tops and trash are then removed in a dry cane cleaning plant, prior to cane crushing, and sent directly to the boilers. If the incentives were there for IPP by the sugar industry, the addition of this extra biomass to the power generation potential would allow for the supplementation of the off-season fuel requirements, thereby potentially allowing the sugar industry to become a year-round biomass based power generator. In the case of those mills that require steam during the off-season, e.g. those with a sugar refinery, this would obviate the need for the use of coal. The major determining factor in the use of the whole cane harvesting and dry cane cleaning approach to using the tops and trash is the sloping terrain found in a major proportion of the cane growing areas in South Africa. This does not allow for the easy entry of mechanical balers to collect the tops and trash left in the fields at harvest time (Wienese 2003). In the flatter areas of the country, baling of the tops and trash could be an option. In the Brazilian northeast, this is the approach being taken, and there, the sugarcane industry presently employs labour at the rate of 19.8 jobs per square km for on-season work and only 2.7 jobs per square km for off-season (permanent) employment. If in the future labour was to be employed to collect and bale the tops and leaves during the off-season (an essential activity if enough energy is to be produced from sugarcane residues), then the in-season requirement for jobs would hardly change at 19.6 jobs per square kilometre. The off-season requirement would then rise to 23.7 jobs per square km (Carpentieri et al, 1993). By way of comparison, South African labour figures at a typical mill are around 5 permanent jobs per square km, with over 21 harvest-season casual jobs per square km (Tomlinson 2003). In other words, there is a high labour seasonality factor, which could potentially be addressed to some extent, if the tops and trash were to be manually collected and baled. Another option that could be explored, if the IPP regulatory frameworks and power purchase arrangements warranted it, would be the growing of high-fibre cane varieties that would increase the bagasse available for power generation.
4.1.5.2.2 Timber industry CHP There is apparently capacity within the pulp and paper industry to generate excess power for export to the grid, making use of the biomass residues from various processes. This potential capacity has been estimated to be in the region of 300 to 400 MW (DME 2001). Importantly, however, realisation of this potential would not result in significant, if any, increase in jobs, as only technical upgrading of plant is required in order to achieve this. In the timber and sawmilling industries, although significant wastes have been identified as being suitable for power generation (DME 2001) according to industry sources, most of these wastes are now being fully utilised, with many of them being fed through to the pulp and paper industry, where there are mills in close enough proximity. In the case of the trimmings and branches that are left behind in the plantation when trees are clear-felled, the plantation owners usually allow surrounding communities access to remove these, and they in turn either use them directly or market them as fuelwood (Godsmark 2003). In addition to the above, two companies have recently announced their intentions to erect large-scale biomass pelleting plants, to produce 8 mm pellets for export to Scandinavian countries, for use in CHP plants there (Engineering News 2003). The intention is to make use mainly of the sawdust wastes generated by large sawmills, and current plans will result in the export of 270,000 tonnes per year by the end of 2005. Although there will be quite a significant number of jobs created through this endeavour, mainly in the manual loading of the sawdust into trucks, this will not be adding to South Africa’s internal energy production. Discussions are apparently being held with Eskom to investigate possible co-firing of biomass pellets in coal-fired boilers (Williams, 2003).
Employment potential of Renewable Energy in South Africa SECCP
AGAMA Energy (Pty) Ltd 14 November 2003
22
4.1.6 Solar water heating
Residential and commercial hot water needs can be met by solar water heating (SWH), while industrial process heat can be supplied through a similar process. The use of SWHs directly offsets the consumption of electricity, and delays the need for increased electricity capacity development. Given the large-scale deployment in some countries, employment data for the solar water heating industry is surprisingly difficult to find. This situation was also encountered regarding sourcing local information: during an assessment of the current industry capacity and employment (DME, 2002a) few responses to a survey were obtained, with no resulting information being developed around the employment in the industry.
4.1.6.1 International experience
In Israel, which is far less endowed with sunshine than South Africa, it has been made obligatory for all buildings below three stories to install solar water heaters, while in Australia financial incentives are provided by the Government to promote its use (DME, 1995). By 2000, India had installed 500,000 m2 of solar water heaters, equivalent by South African insolation levels to 250 MWp (TERIIN, 2003). The Energy Information Administration of the Department of Energy in the USA reported 9.5 jobs/MWp and 6.1 jobs/MWp in 1994 and 2000 respectively (EIA, 2002a). They also report that company activities of manufacturing, installation and retailing/distributing comprise 47.5%, 22.5% and 30% of the total workforce.
4.1.6.2 South African experience and energy potential
South Africa currently has 300 people employed in the industry (SESSA, 2002) with nineteen companies directly involved in manufacture and installation. In South Africa, the SWHs are marketed through distributors in all the provinces. At present, there are 73 distributors listed in the DME list of manufacturers and distributors (DME, 2002b). The current SWH installed capacity is around 500,000 square metres (EDRC, 2003; DME, 2002b), which includes both the unglazed (pool heating/agriculture) and glazed (water heating) types. In 2001, approximately 55,000 m2 and 10,000 m2 of unglazed and glazed SWHs were installed. Glazed SWHs are used for primarily for residential hot water systems, while unglazed applications in South Africa are limited mainly to heating residential swimming pools (DME, 2002a). Since the latter is essentially a luxury energy use – where it could be argued that few people would install electric water heaters – the discussion is limited to the glazed SWHs. Details emerging from the industry indicated a current annual production of glazed SWHs by the larger manufacturers of between 600 m2 and 3,000 m2 per company. Assuming an average production, by the ten largest manufacturers, of 1,500 m2 per annum, total sales in 2003 can be expected to reach 15,000 m2, or 7.5 MWp. This is equivalent to about 10 MWp per annum. Consequently, 30 people are employed in South Africa per MWp manufactured. This figure has been confirmed in discussion with some the larger SWH manufacturers. For the purposes of this study, we have used the EIA information presented in Section 4.1.6.1 above to develop the proportional employment by activity in the sector. Thus, of the total of 30/MWp, 14.3, 6.8 and 9.0 jobs/ MWp are allocated to manufacturing, installation and retailing/distribution (allocated to ‘other’ activity) respectively.

Employment potential of Renewable Energy in South Africa SECCP
AGAMA Energy (Pty) Ltd 14 November 2003
23
4.1.7 Anaerobic biogas digestion
There are essentially two resource types for anaerobic digestion: a sewage treatment plant, and animal and biodegradable wastes. The latter is focussed upon in this study, and can be further classified into two groups: large-scale (often commercial) and small-scale (residential). The former would typically be found on piggeries, cattle feedlots, or centralised sites to which manure is transported. In this study, the focus is on the residential systems.
4.1.7.1 International experience
The leading implementers of residential biogas systems are China, India and Nepal, which already have installed around 8 million, 3 million and 100,000 digesters respectively. Each of these countries, as for other countries around the world, has also developed a large number of large-scale sites, both sewage- and animal-based. India, for example, has in the order of 2,000 large-scale biogas digesters installed and operational, and has potential for a further 9 million residential systems. Nepal provides the best information in terms of employment in the industry. As of July 2002, there were 89,649 residential systems, installed by 46 authorised biogas companies (ADBN, 2002).
4.1.7.2 South African experience and energy potential
South Africa has attempted pilot biogas demonstration plants on different occasions in the past. The two most recently installed are a 10 m3 residential system having run continuously in KwaZulu-Natal for three years to date. A 40-m3 system, installed at a rural school in KwaZulu-Natal and using the children’s faeces as resource, in currently in its second year of operation. Both systems have been used for thermal applications (cooking) while the school system was used to test electricity generation through a modified 2-kW diesel engine (Austin, 2002a). In the early 1990s, the DME funded a three-year study, to assess the technical, social and economic feasibility of low-cost biogas digesters. None of the four digesters installed worked for very long, highlighting some of the pitfalls associated with poor planning and implementation of an essentially off-grid technology (Thom, 1994). Other experiences include two 85 m3 digesters on a pig farm (1950s), a number of small digesters near Tugela Ferry (1970s), a 9 m3 near Hartebeespoortdam (1970s to current), and a 136 m3 digester near Barkly-East (1980s) (Thom, 1994). A conservative estimate of the potential number of residential systems in South Africa puts the figure at 400,000 (Austin, 2002b), with an average size of around 7.5 m3. These would be installed in the Eastern Cape, KwaZulu-Natal and Mpumalanga. An additional 16,000 digesters could be built at the schools currently without power (Austin, 2202b), while there are 15 registered feedlots, over 1,200 piggeries and over 9,000 large dairies (Thom, 1994). It is estimated that by 2012, 50,000 7.5 m3 residential systems could feasibly be installed – given a supportive enabling environment. This is equivalent (conservatively) to 205 GWh thermal energy per annum. An additional 5 large systems, in the order of 400 m3 could be installed by the same time, generating over 2 GWh per annum. Total capacity in 2012 would thus conservatively be 205 GWh/annum. By 2020, and additional 100,000 residential systems could be installed, generating an additional 410 GWh. With ten additional commercial systems, the total additional capacity in 2020 would be in the region of 415 GWh (Own analysis).
Employment potential of Renewable Energy in South Africa SECCP
AGAMA Energy (Pty) Ltd 14 November 2003
24
4.1.8 Biofuels
4.1.8.1 International experience
The large-scale application of modern bioenergy conversion technologies has already occurred in a number of countries, both in the industrialised and developing world. One of the examples most relevant to the South African context is that of Brazil, a country that has committed itself to the development of its modern bioenergy potential. Its sugarcane-based ethanol industry annually produces around 15 billion litres from about 350 distilleries, and satisfies over 33% of the country’s gasoline needs. The industry employs directly between 800,000 and one million people in sugarcane cultivation and ethanol production (and three or four times as many in indirect jobs). Direct jobs in Brazil’s bioethanol industry are estimated to be 4,000/TWh (Carvalho, LC and Szwark, A, 2001). Another important bioenergy source in Brazil is charcoal for the metallurgical industry, and this generated between 120,000 and 200,000 direct jobs in the 1990s. Further bioenergy projects in the power sector are also being developed in the country, in both the timber and sugar industries, and it is predicted that these could lead to further significant increases in job numbers. A further important characteristic of bioenergy-related jobs, which has surfaced in the Brazilian context, is their relative cost per job created. This has been found to be generally much lower when compared to costs in other energy and industrial sector activities. Thus, in Brazil, to create a job in the sugarcane-ethanol industry in the mid-1990s required an investment of about US$11,000, compared to US$220,000 in the oil sector, US$91,000 in the automobile industry, and US$419,400 in the metallurgical industry. Even in the agricultural sector, an investment of US$12,980 was found to be necessary while US$11,180 was needed in livestock rearing (Rosillo-Calle and Bezzon, 1999). Bioenergy is also fast becoming an important source of employment in industrialised countries. Scrase (1997) found that in the EU the labour required to produce biomass fuels is between 4 and 10 times greater than that needed for fossil fuels on an equivalent energy basis, and total direct employment (including the conversion of the fuel into a useful energy carrier) is 3 to 4 times greater than that for fossil-fuel based systems. Compared with nuclear energy, biomass for electricity requires approximately 15 times as much labour. These figures only consider direct employment, while many indirect jobs would potentially be created by a change in the energy mix. In the EU, policy makers have long recognised that there are added economic benefits to be gained from the use of renewable energy sources, and most particularly bioenergy. To identify this potential, a study was carried out in 1998-99 to evaluate and quantify the employment and economic benefits of renewable energy in the EU. The European Forum for Renewable Energy Sources initiated the study that was funded by the European Commission through the ALTENER Programme (EUFORES, 2000). “Will an investment in renewables lead to more jobs and economic growth?” was the central question challenging the commissioned study. In its attempt to answer this, it provided a complete analysis of employment impacts of renewable energy. It also considered jobs displaced in conventional (fossil or nuclear) energy plants, or jobs lost because of subsidies provided to renewables that could otherwise fund employment in other sectors of the economy. The study used the SAFIRE (Strategic Assessment Framework for Rational Use of Energy) model to predict RE market penetration levels, and then the RIOT (Renewables enhanced Input-Output Tables) model to predict the employment impacts up to 2020.

Employment potential of Renewable Energy in South Africa SECCP
AGAMA Energy (Pty) Ltd 14 November 2003
25
Key highlights of the results obtained from the modelling exercise are that the use of renewable energy technologies in the EU will more than double by 20206. This increase will in turn lead to the creation of about 900,500 new jobs in the renewable energy industry as a whole by 2020. However, of most significance is that the bulk of these new jobs will be in the bioenergy sector, with only about 62,000 of these in other sectors. By 2020, biomass use for power, heat or biofuels was predicted by SAFIRE to rise to a potential of 283 GW, and produce 876 TWh-equivalent/year of energy. This would have the effect of creating 323,000 jobs in the conversion activities, together with a further 515,000 jobs needed for the provision of the biomass feedstock in the form of energy crops, forestry or agricultural wastes. It is important to note that the analysis assumed that expansion of biological fuel sources occurs without displacing employment in conventional agriculture and forestry. Finally, unlike other renewable energy sources, the bioenergy sector creates by far the greatest proportion of its jobs in the operation and maintenance (O&M) as opposed to the construction and installation (C&I) phases of deployment.
4.1.8.2 South African experience and energy potential: bioethanol
Current feedstocks for bioethanol production are either sugar- or starch-rich, while in the not too distant future it is expected that the technology to use cellulose will become economically viable. The use of starch is often not favourable from an energy balance perspective, given that more energy generally goes into the crop cultivation and processing than is finally available in the ethanol product. The most suitable feedstocks in the South African context are currently felt to be those that are sugar-rich such as sugarcane, molasses (the residue from sugar production), sugar beet and sweet sorghum. South Africa currently consumes in the region of 10 billion litres of gasoline per year (SAPIA, 2003). If 15% of this were to be substituted with ethanol, thus giving a so-called E15 blend, such as that which is commonly used in the United States, this would require the production of 1,5 billion l/year of ethanol. Various scenarios could be envisaged to meet this potential ethanol demand.
4.1.8.2.1 Molasses based bioethanol production The current production of molasses in South Africa is of the order of 920,000 tonnes per year. If all of this were to be diverted from its current uses, the main one being as a cattle feed supplement, and it were to be used for fuel ethanol production, a total of only about 230 million litres per year (5,06 PJ/yr) could be produced. This would provide enough for a 2,3% ethanol blend into gasoline. This could be produced in about 6 distilleries of the size of the existing Illovo Merebank plant. The permanent employment potential from this scenario would only be in the distillery jobs created, and would result in the employment of about 1 400 people, based on figures provided by Illovo (Tomlinson, 2003). The above is the scenario that has been considered for the Target 1 in 2012 of this study, where 2,3% of the 2002 national gasoline consumption is substituted with ethanol. The remaining scenarios for the other targets in both 2012 and 2020 all include this 230 million litres of ethanol derived from molasses. The remainder of the ethanol in the other scenarios is assumed to be produced using sweet sorghum as the fermentation feedstock, as described below.
4.1.8.2.2 Sweet sorghum based bioethanol production From the above, it is clear that in order to achieve large-scale bioethanol production, dedicated fermentation feedstocks would have to be cultivated. Therefore, in building
6 The EU employment predictions are very much predicated on the basis of the need to maintain the agricultural sector, and as such are quite closely tied up with all the issues associated with the Common Agricultural Policy. Thus, many of the employment opportunities arise from the cultivation of dedicated energy crops primarily for power production.
Employment potential of Renewable Energy in South Africa SECCP
AGAMA Energy (Pty) Ltd 14 November 2003
26
scenarios to meet the remaining ethanol production targets, sweet sorghum has been used as the ethanol fermentation feedstock. This crop has been considered in the place of sugarcane as it is felt to be more robust and requires lower inputs than sugarcane in terms of water and fertilisers. Furthermore, it requires very similar cultivation techniques to those for grain sorghum, which is a more widely known crop in the African context. Extensive trials that have been conducted with sweet sorghum in Zimbabwe, at the Triangle sugar mill and distillery, have shown it to be a very suitable crop for ethanol production (Woods, 2000). Similar experience has been gained in other countries, the most relevant to our context being China. In the targets that have been generated for this study, we have assumed the cultivation of two crops per year, which is conservative as, according to Woods (2000) three crops of sweet sorghum are possible per annum. The achievable yield has also been conservatively estimated at 46 tonnes/ha7 per crop thus giving a total annual yield of 92 tonnes/ha. It has further been assumed that the sweet sorghum would be cultivated in 5 ha lots, thereby providing a cash crop opportunity for small farmers.
4.1.8.3 South African experience and energy potential: biodiesel
Biodiesel can be produced from various oil seeds e.g. sunflower, soy, cottonseed, jatropha etc. According to DST (2003), the potential exists in South Africa, without prejudicing food crop production, to produce sufficient of these crops to produce 1.4 billion litres of biodiesel per year (45 PJ/yr). This quantity would satisfy close to 20% of the current 7 billion litres of annual diesel demand in the country (SAPIA, 2003). An important characteristic of biodiesel production facilities is that they are relatively insensitive to economies of scale. The implication of this is that it is possible to erect a large number of economically viable small-scale decentralised plants rather than a few large-scale centralised facilities. In this way, it is possible to spread the employment and other economic benefits of production as widely as possible. However, the one caveat that should be added is that quality control of the biodiesel product would become more difficult with the large number of small plants. As bad quality biodiesel can have potentially damaging effects on engines, this is something that would have to be taken into consideration if the decentralised small-scale production route were to be taken.
7 hectare = 10,000 m2
Employment potential of Renewable Energy in South Africa SECCP
AGAMA Energy (Pty) Ltd 14 November 2003
27
5. Methodological issues and data analysis framework In this section, we discuss the key methodological issues and parameters relating to the analysis of the data presented in the previous section. Important concepts are defined and an explanation of the employment calculations made. The outcomes are presented in the following section.
5.1 Job definitions
Job creation can be specified in three ways: • Direct jobs - those jobs resulting directly from the renewable energy project or
installation, and includes the entire production cycle from fuel production and component manufacture to waste management.
• Indirect jobs - those jobs that arise in addition to the direct jobs referred to above, and includes services and inputs to the direct processes
• Induced jobs - those jobs generated through the increased cash flow in the broader society that arises from the wages of those employed in direct and indirect jobs.
Some employment studies make use of a ‘Full Time Equivalent” or FTE when expressing jobs: 1 FTE = 1 job. This latter varies by country according to the employment regime in the country, viz. the number of hours worked per week, and the numbers of days leave per year. For this study, we have assumed that a job in one country is directly equivalent with a job in another. Underlying that is the assumption that any difference in number of working hours or days would be offset by differences in labour productivity. In this study, we are only concerned with direct jobs, yet will extend the number of direct jobs created to assess possible indirect jobs, based on indicators sourced in the literature. Appendix E summarises some thoughts around the definition of the jobs provided in bioenergy systems – most notably in the fuel processing stage – and provides insight into the relevance of monetary versus in-kind remuneration for workers in this sector.
5.1.1 Direct jobs
Direct employment figures have been presented in the literature in two different ways. Some studies refer to the number of job-years for a particular RET, meaning that if a particular aspect of the technology requires four people for 1 year, then four job-years are required. Other studies simply refer to the number of employees, or jobs, for a particular RET. Whichever approach is taken, one is limited to the data that already exists as a basis from which to work. There is also uncertainty as to whether some studies, while referring to ‘jobs’, are not actually describing ‘job-years’, or whether the percentage breakdowns refers to the share of job-years rather than the share of jobs in a given year. Since the majority of reviewed data expresses employment as the more simple ‘jobs’, this study shall thus also refer simply to jobs throughout, while explicitly implying a number of people employed in a given year. While the data presented appears precise, this is primarily due to one set of appropriate data having been selected for further analysis. A range of data of course exists, which can be found in Appendix F.
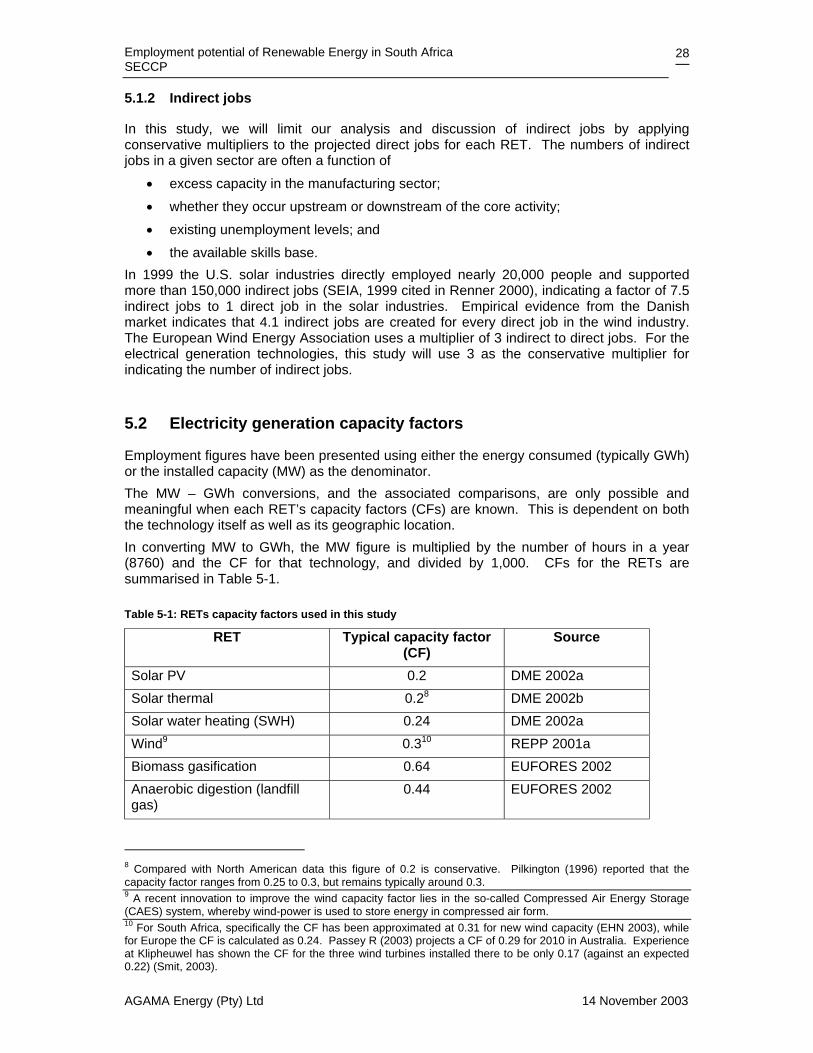
Employment potential of Renewable Energy in South Africa SECCP
AGAMA Energy (Pty) Ltd 14 November 2003
28
5.1.2 Indirect jobs
In this study, we will limit our analysis and discussion of indirect jobs by applying conservative multipliers to the projected direct jobs for each RET. The numbers of indirect jobs in a given sector are often a function of
• excess capacity in the manufacturing sector; • whether they occur upstream or downstream of the core activity; • existing unemployment levels; and • the available skills base.
In 1999 the U.S. solar industries directly employed nearly 20,000 people and supported more than 150,000 indirect jobs (SEIA, 1999 cited in Renner 2000), indicating a factor of 7.5 indirect jobs to 1 direct job in the solar industries. Empirical evidence from the Danish market indicates that 4.1 indirect jobs are created for every direct job in the wind industry. The European Wind Energy Association uses a multiplier of 3 indirect to direct jobs. For the electrical generation technologies, this study will use 3 as the conservative multiplier for indicating the number of indirect jobs.
5.2 Electricity generation capacity factors
Employment figures have been presented using either the energy consumed (typically GWh) or the installed capacity (MW) as the denominator. The MW – GWh conversions, and the associated comparisons, are only possible and meaningful when each RET’s capacity factors (CFs) are known. This is dependent on both the technology itself as well as its geographic location. In converting MW to GWh, the MW figure is multiplied by the number of hours in a year (8760) and the CF for that technology, and divided by 1,000. CFs for the RETs are summarised in Table 5-1.
Table 5-1: RETs capacity factors used in this study
RET Typical capacity factor (CF)
Source
Solar PV 0.2 DME 2002a Solar thermal 0.28 DME 2002b Solar water heating (SWH) 0.24 DME 2002a Wind9 0.310 REPP 2001a Biomass gasification 0.64 EUFORES 2002 Anaerobic digestion (landfill gas)
0.44 EUFORES 2002
8 Compared with North American data this figure of 0.2 is conservative. Pilkington (1996) reported that the capacity factor ranges from 0.25 to 0.3, but remains typically around 0.3. 9 A recent innovation to improve the wind capacity factor lies in the so-called Compressed Air Energy Storage (CAES) system, whereby wind-power is used to store energy in compressed air form. 10 For South Africa, specifically the CF has been approximated at 0.31 for new wind capacity (EHN 2003), while for Europe the CF is calculated as 0.24. Passey R (2003) projects a CF of 0.29 for 2010 in Australia. Experience at Klipheuwel has shown the CF for the three wind turbines installed there to be only 0.17 (against an expected 0.22) (Smit, 2003).

Employment potential of Renewable Energy in South Africa SECCP
AGAMA Energy (Pty) Ltd 14 November 2003
29
5.3 Labour productivity and technology learning curves
When analysing data compiled in developed countries, and attempting to ‘transfer’ the employment data to a developing country such as South Africa, one must take caution as to the data’s applicability. The primary reason for this issue arising has to do with labour productivity differences, which are particularly difficult to define. The cost capital/labour relation in developed countries can be quite different to that in South Africa, while the maturity of the RET manufacturing markets is very different. Asian, Latin American and East European countries currently have labour productivity rates in the wind power sector that are estimated to be at least 20 percent lower than in Western Europe. This means that domestically manufactured wind turbines create one-fifth more jobs than those imported from Western Europe do. However, Asian countries will likely continue to rely on imports for some 20 percent of their installations during the next decade; Latin American and East European nations are able to manufacture nearly all needed components within their own regions. The Middle East and Africa, by contrast, will mostly depend on imported technology and components (EWEA, 1999). Of course, the case can easily be argued that South Africa of all African countries has the capacity to develop a substantial wind industry. There is also the tendency for the number of jobs/MW to reduce over time from the initial industry start-up levels in a region or country, due to economies of scale and increasing experience of renewable energy companies (Heavner B and Churchill S, 2002). This is the so-called technology learning curve. Heavner and Churchill estimate that employment levels in construction in five different RETs will decline at 10% per year, and those in O&M at 5% per year, leading to “very conservative job growth estimates”, analogous to the technology learning curve concept. Our analysis shows that this is equivalent to an average decline of about 9.3% across all the RETs. Analysis of data presented in EUFORES 2002 indicates an average decline in wind industry jobs of 3.1% per year to 2012, and of 2.3% per year to 2020. Passey R. (2003) selected an annual decline of 5% and 9% for manufacture and installation, and O&M jobs, respectively. Renner (2000) indicates that 1 MW of installed wind power creates “perhaps double” the jobs for countries with lower labour productivity than Europe. The Spanish wind turbine manufacturer, EHN, have produced an industrial plan for the deployment of 1,000 MW of wind power in South Africa (EHN, 2003). Their local representative estimates a 30% greater number of jobs/MW in South Africa than in Europe, assuming a 95% local manufacture content of the finished product (De Beer, 2003). It is assumed that the same applies to other technologies. Thus, in presenting a conservative case, a labour multiplier of 1 has been selected when projecting jobs in South Africa into the future, viz. employment data from the developed countries have been adopted directly. The learning curve figures used in this analysis are taken as being constant at a 4% decline in jobs/annum. Thus, the number of jobs in 2012 and 2020 are 69% and 50% of those in 2003 respectively. Importantly, as the installed capacity of a technology grows, the number of jobs associated with the manufacturing, construction and installation declines, while at the same time the number of O&M jobs must increase in parallel with an ever-increasing installed capacity.
5.4 Investment and capacity thresholds
A few recurring themes run through the majority of detailed economic/investment assessments of RET deployment. Firstly, the growth of renewables and particularly wind power worldwide attests to the economic, financial and technical viability of the technologies.

Employment potential of Renewable Energy in South Africa SECCP
AGAMA Energy (Pty) Ltd 14 November 2003
30
Secondly, the role that government plays as legislator of strong and ambitious RET targets is also seen as driving the RET market. Without an appropriate enabling environment for increasing the uptake of RETs, the unit price of renewable energy will remain at an inflated level since the environmental and social benefits would remain externalised. More relevantly, though, there will never be the commitment, by the market, to invest in the manufacturing capacity in the country. Thus the industry will not attain the potential socio-economic benefits that each RET has to offer, with the result that those countries with strong policy instruments for RETs will attract this investment and business away from those that lack such an legislative environment. Already we are seeing strong competition between countries for the development of wind power manufacturing capability as the market increases globally at an average 33% per year (WWI, 2003). South Africa should view this market pull with great interest. Developing local manufacturing capacity is a critical aspect for the successful development of renewable energy technologies in South Africa (EDRC 2003), as well as aiming for their export locally and internationally. A greater demand for RE will result in more local manufacturing jobs, without which the local job opportunities of investment in RE will be missed. The larger the investment, the greater the number of jobs created. However, is not realistic to talk of massive, one-off investment in a RET, but rather to understand the issue as being that of a stepped deployment. Indeed, certain thresholds may be required to develop local manufacturing capacity (EDRC 2003). Large manufacturers are reluctant to develop manufacturing capacity for wind in a country installing capacity of less than 100MW per year (Oelsner, cited in EDRC 2003. Helimax Energie have also indicated that local investment would be certain given a commitment to deploy 500 MW over about 7 years (Benandallah, 2003). Increasing investment thresholds has the benefit of building capacity and developing experience to accept more significant investment and providing investor confidence, and should lead to increasing exports as the country is seen as a cheaper manufacturing source than, say, the investing country. European companies accounted for about 90 percent of worldwide wind turbine sales in 1997. Thus, for example, the European wind industry could look to increasing manufacturing capacity in South Africa, at lower unit production cost, while at the same time assisting in their climate mitigation targets11 and more easily meeting their supply contracts internationally. As regions with high wind power potential increasingly adopt wind technology, they will only realize significant job gains if they master the manufacturing technology. In principle, India and China can generate substantial wind power employment if they succeed in strengthening their indigenous production base. There are at least three examples in South Africa, as well as the African Wind Energy project in Zimbabwe, which demonstrate the manufacturing opportunities of local machines of relatively small capacity (Schaffler, cited in EDRC 2003). These are relatively small turbines, in the 6-10kW range, and viable operations might require annual markets of as little as a few hundred kW. A more differentiated approach, however, could consider local manufacture of specific components. For wind, promotion of local content could initially focus to towers, blades and assembly of the turbine, rather than complete machines (Martens, cited in EDRC 2003). The proposed African-Eolian joint venture aims to manufacture and export up to 8 MW of wind turbines per annum, with turbines in the range of 5 – 300 kW. Even for small installations such as these, the manufacture of towers, site infrastructure (building and
11 The climate mitigation targets refer only to those countries that have ratified the Kyoto Protocol, which allows industrialised countries to invest in emissions reduction projects in developing countries in exchange for credits to apply against the industrialised countries’ commitments. This project-based emissions trading system is called the Clean Development Mechanism (CDM).

Employment potential of Renewable Energy in South Africa SECCP
AGAMA Energy (Pty) Ltd 14 November 2003
31
electrical) and O&M can be done locally. The market planning around that capacity involves a large majority of wind turbines being exported, thus there will not be as large an impact on the O&M employment component as would otherwise be anticipated. For larger (1.5 or 1.75 MW wind turbines), manufacture of towers and blades would be a next logical step. Investment required to start a blade manufacturing facility, based on European experience, would be approximately R20 million. At a later stage of manufacturing capacity, the manufacturing of nacelle housing and complete assembly of turbine components could be undertaken. There is an already well-developed plan to develop 1,000 MW of wind power, using the greatest proportion (up to 95%) local manufactured content, for the Eastern Cape region. In particular, any firm commitment to develop wind capacity greater than 500 MW would justify serious significant investment in manufacturing capacity (De Beer 2003). Similarly, Helimax Energie would look for a commitment to develop 500 MW of capacity over seven years in order to justify investing in the local industry (Benandallah, 2003). The Australian Wind Energy Association, AusWEA, indicated the impact on local manufacturing – and thus employment levels – of remaining with the current Mandatory Renewable Energy Target (MRET) of 940 MW wind power installed by 2010, compared with their proposed 5,037 MW. A simplistic view to achieving the current MRET would required about 100 1.5 MW wind turbines per year for seven years. By contrast, the 5,037 MW target would see sufficient demand for several blade-manufacturing facilities and enhance competitiveness through supply diversity, which would encourage substantial manufacturing investment in turbine blades. Thus, the current target would not allow any manufacture, a 5% MRET would support 2 blade manufacturing facilities, and a 10% MRET, four. Only the latter target would support a fully competitive market with no manufacturer having more than a 30% market share (AusWEA, 2003).
5.5 Targets for renewable energy deployment
Increasingly, national governments and groupings are committing to targets to encourage the development of RETs. Typical levels of commitment are indicated in Table 5-2.
Table 5-2: Summary of some international renewable energy deployment targets
Country Renewable energy target level
Target date
Reference
European Union 12% 2010 EC, 1997 UK 10% 2010 UK 20% 2020 Australia (current, under review by government)
2% 2010 AusWEA 2003
Australia (proposed by AusWEA / Greenpeace)
10% 2010 AusWEA 2003, Greenpeace 2003.
Germany 12% 2010 Greenpeace 2003 Denmark 12 – 14% 2005 Odgaard 2000 Denmark 35% 2030 Odgaard 2000 India 10% 2012 Bhaktavatsalam 2001 Brazil 10% 2010 UKBCSE 2002 China 3.6% 2015 Zhou 2001
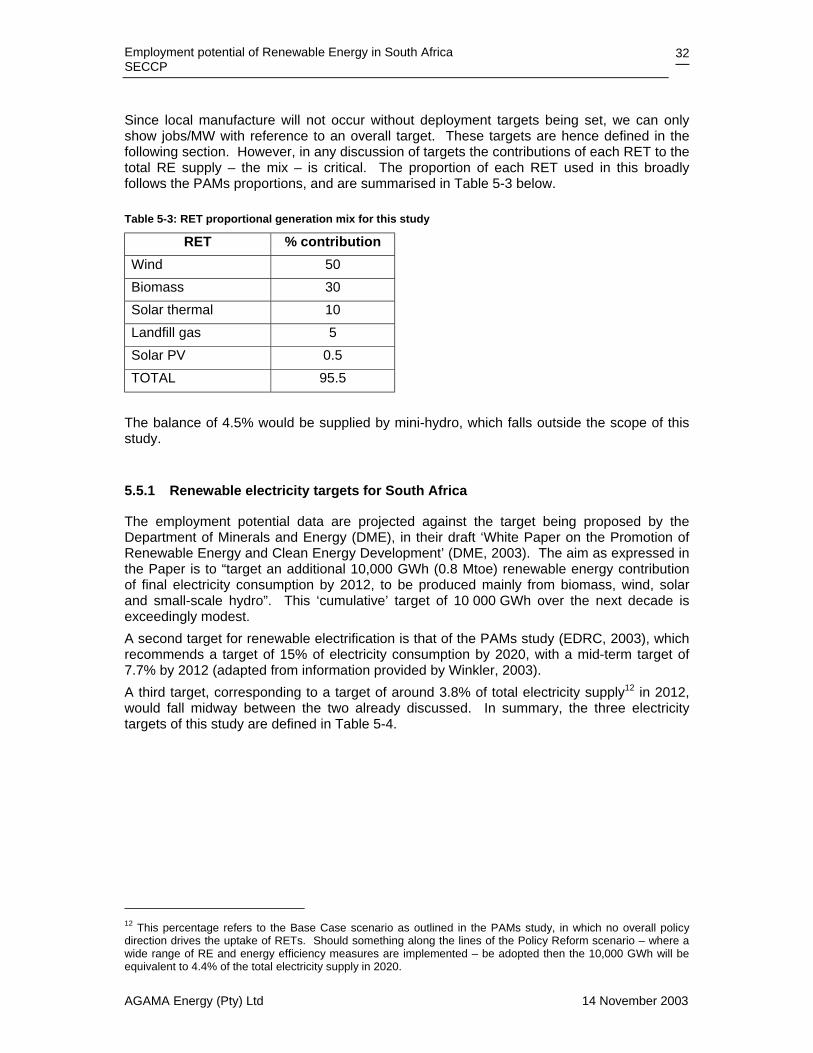
Employment potential of Renewable Energy in South Africa SECCP
AGAMA Energy (Pty) Ltd 14 November 2003
32
Since local manufacture will not occur without deployment targets being set, we can only show jobs/MW with reference to an overall target. These targets are hence defined in the following section. However, in any discussion of targets the contributions of each RET to the total RE supply – the mix – is critical. The proportion of each RET used in this broadly follows the PAMs proportions, and are summarised in Table 5-3 below.
Table 5-3: RET proportional generation mix for this study
RET % contribution Wind 50 Biomass 30 Solar thermal 10 Landfill gas 5 Solar PV 0.5 TOTAL 95.5
The balance of 4.5% would be supplied by mini-hydro, which falls outside the scope of this study.
5.5.1 Renewable electricity targets for South Africa
The employment potential data are projected against the target being proposed by the Department of Minerals and Energy (DME), in their draft ‘White Paper on the Promotion of Renewable Energy and Clean Energy Development’ (DME, 2003). The aim as expressed in the Paper is to “target an additional 10,000 GWh (0.8 Mtoe) renewable energy contribution of final electricity consumption by 2012, to be produced mainly from biomass, wind, solar and small-scale hydro”. This ‘cumulative’ target of 10 000 GWh over the next decade is exceedingly modest. A second target for renewable electrification is that of the PAMs study (EDRC, 2003), which recommends a target of 15% of electricity consumption by 2020, with a mid-term target of 7.7% by 2012 (adapted from information provided by Winkler, 2003). A third target, corresponding to a target of around 3.8% of total electricity supply12 in 2012, would fall midway between the two already discussed. In summary, the three electricity targets of this study are defined in Table 5-4.
12 This percentage refers to the Base Case scenario as outlined in the PAMs study, in which no overall policy direction drives the uptake of RETs. Should something along the lines of the Policy Reform scenario – where a wide range of RE and energy efficiency measures are implemented – be adopted then the 10,000 GWh will be equivalent to 4.4% of the total electricity supply in 2020.
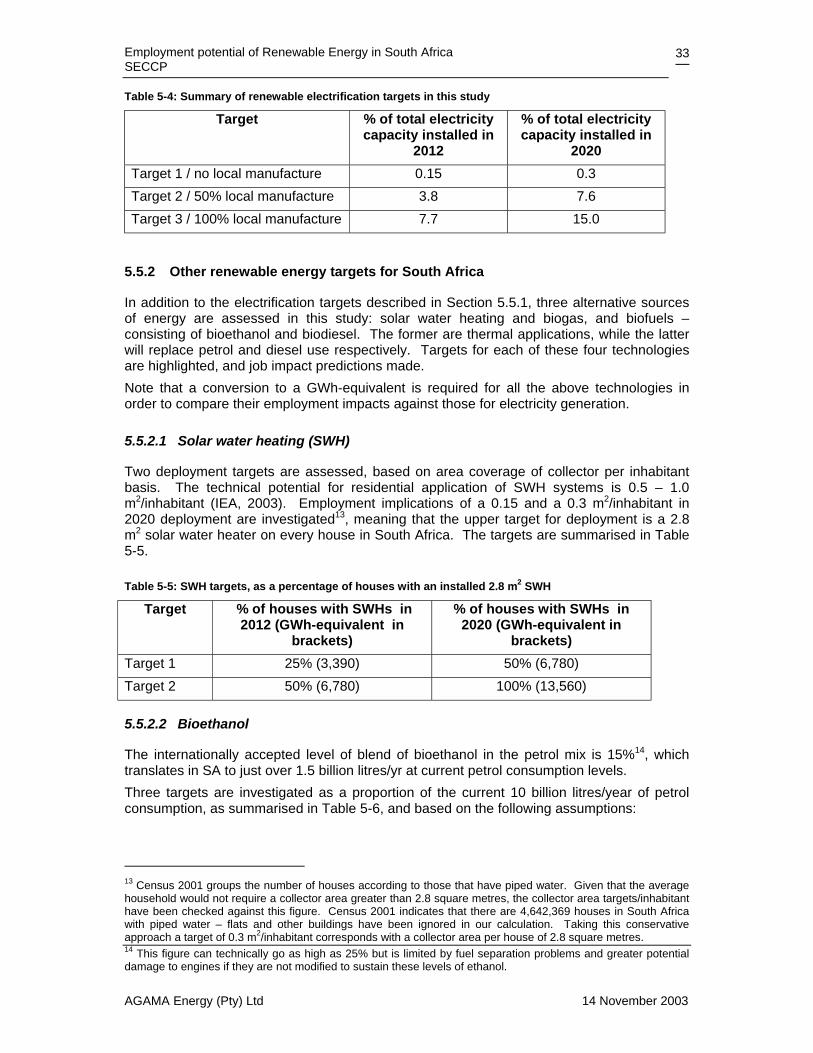
Employment potential of Renewable Energy in South Africa SECCP
AGAMA Energy (Pty) Ltd 14 November 2003
33
Table 5-4: Summary of renewable electrification targets in this study
Target % of total electricity capacity installed in
2012
% of total electricity capacity installed in
2020 Target 1 / no local manufacture 0.15 0.3 Target 2 / 50% local manufacture 3.8 7.6 Target 3 / 100% local manufacture 7.7 15.0
5.5.2 Other renewable energy targets for South Africa
In addition to the electrification targets described in Section 5.5.1, three alternative sources of energy are assessed in this study: solar water heating and biogas, and biofuels – consisting of bioethanol and biodiesel. The former are thermal applications, while the latter will replace petrol and diesel use respectively. Targets for each of these four technologies are highlighted, and job impact predictions made. Note that a conversion to a GWh-equivalent is required for all the above technologies in order to compare their employment impacts against those for electricity generation.
5.5.2.1 Solar water heating (SWH)
Two deployment targets are assessed, based on area coverage of collector per inhabitant basis. The technical potential for residential application of SWH systems is 0.5 – 1.0 m2/inhabitant (IEA, 2003). Employment implications of a 0.15 and a 0.3 m2/inhabitant in 2020 deployment are investigated13, meaning that the upper target for deployment is a 2.8 m2 solar water heater on every house in South Africa. The targets are summarised in Table 5-5.
Table 5-5: SWH targets, as a percentage of houses with an installed 2.8 m2 SWH
Target % of houses with SWHs in 2012 (GWh-equivalent in
brackets)
% of houses with SWHs in 2020 (GWh-equivalent in
brackets) Target 1 25% (3,390) 50% (6,780) Target 2 50% (6,780) 100% (13,560)
5.5.2.2 Bioethanol
The internationally accepted level of blend of bioethanol in the petrol mix is 15%14, which translates in SA to just over 1.5 billion litres/yr at current petrol consumption levels. Three targets are investigated as a proportion of the current 10 billion litres/year of petrol consumption, as summarised in Table 5-6, and based on the following assumptions:
13 Census 2001 groups the number of houses according to those that have piped water. Given that the average household would not require a collector area greater than 2.8 square metres, the collector area targets/inhabitant have been checked against this figure. Census 2001 indicates that there are 4,642,369 houses in South Africa with piped water – flats and other buildings have been ignored in our calculation. Taking this conservative approach a target of 0.3 m2/inhabitant corresponds with a collector area per house of 2.8 square metres. 14 This figure can technically go as high as 25% but is limited by fuel separation problems and greater potential damage to engines if they are not modified to sustain these levels of ethanol.
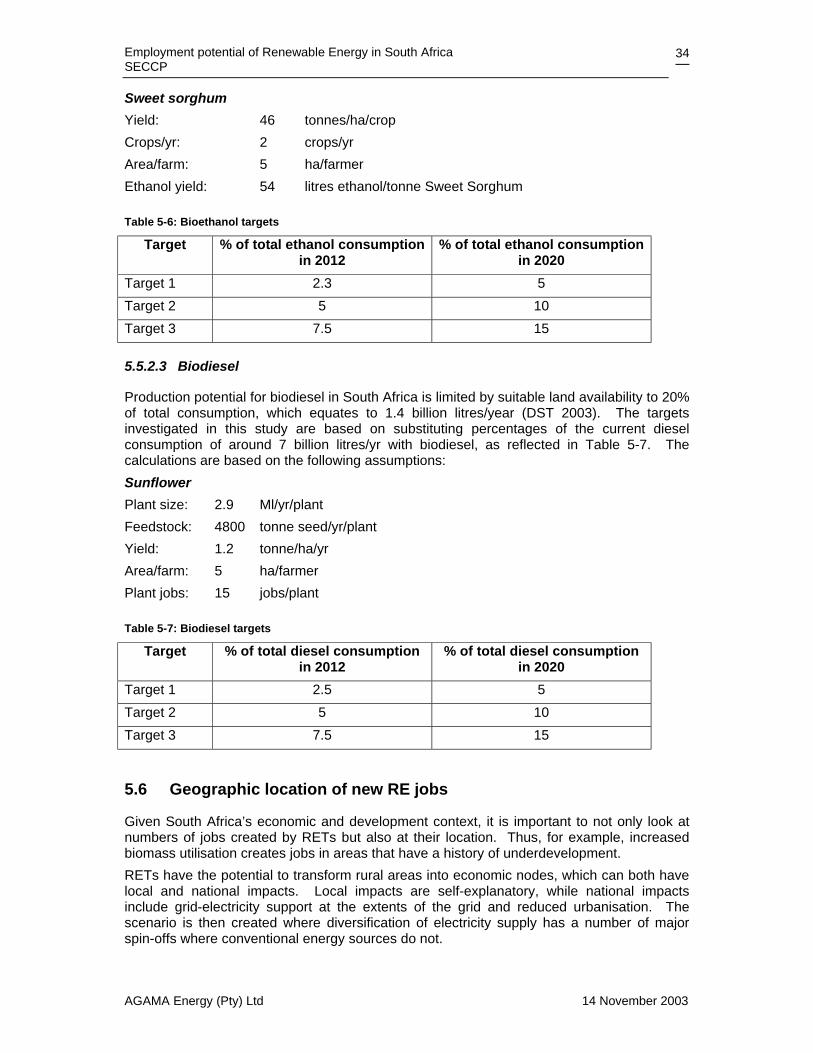
Employment potential of Renewable Energy in South Africa SECCP
AGAMA Energy (Pty) Ltd 14 November 2003
34
Sweet sorghum Yield: 46 tonnes/ha/crop Crops/yr: 2 crops/yr Area/farm: 5 ha/farmer Ethanol yield: 54 litres ethanol/tonne Sweet Sorghum
Table 5-6: Bioethanol targets
Target % of total ethanol consumption in 2012
% of total ethanol consumption in 2020
Target 1 2.3 5 Target 2 5 10 Target 3 7.5 15
5.5.2.3 Biodiesel
Production potential for biodiesel in South Africa is limited by suitable land availability to 20% of total consumption, which equates to 1.4 billion litres/year (DST 2003). The targets investigated in this study are based on substituting percentages of the current diesel consumption of around 7 billion litres/yr with biodiesel, as reflected in Table 5-7. The calculations are based on the following assumptions: Sunflower Plant size: 2.9 Ml/yr/plant Feedstock: 4800 tonne seed/yr/plant Yield: 1.2 tonne/ha/yr Area/farm: 5 ha/farmer Plant jobs: 15 jobs/plant
Table 5-7: Biodiesel targets
Target % of total diesel consumption in 2012
% of total diesel consumption in 2020
Target 1 2.5 5 Target 2 5 10 Target 3 7.5 15
5.6 Geographic location of new RE jobs
Given South Africa’s economic and development context, it is important to not only look at numbers of jobs created by RETs but also at their location. Thus, for example, increased biomass utilisation creates jobs in areas that have a history of underdevelopment. RETs have the potential to transform rural areas into economic nodes, which can both have local and national impacts. Local impacts are self-explanatory, while national impacts include grid-electricity support at the extents of the grid and reduced urbanisation. The scenario is then created where diversification of electricity supply has a number of major spin-offs where conventional energy sources do not.
Employment potential of Renewable Energy in South Africa SECCP
AGAMA Energy (Pty) Ltd 14 November 2003
35
There is additional support for assessing the RET development by region, namely energy security aspects, when one assesses local demand versus supply. The Western Cape stands out as having to import 100% of its energy, while at the same time having a large demand by national standards. Taking this example, this would motivate for the development of appropriate RETs in the Western Cape region before, say, in Gauteng. In 1995, 186,744 GWh of electricity was generated, with 14,593 GWh lost in distribution that same year (Statistics SA, 1996). This represents a total loss of 7.8% of the total generated, which could be substantially reduced were the transmission distances to be reduced. Thus, future generation capacity installed closer to the point of use would in effect be more efficient than otherwise stated, given the reduced transmission losses associated with its geographic position. There are essentially three levels of market opportunities for the RET manufacturing sector: in-country, the South African Development Community (SADC) and/or the Southern African Power Pool (SAPP) countries, and international. As we have seen, solar PV offers the most number of jobs per MW. Thus, the best employment opportunities under the current situation appear to be in the rural deployment of domestic energy, which to a large degree involves the manufacture and servicing of Solar Home Systems (SHS). Resulting from the DME’s Non-Grid Electrification (NGE) program, there is a planned deployment of 300,000 SHSs throughout rural South Africa. Assuming a 50 Wp solar panel per house, this is equivalent to a market potential of 15 MWp over a ten-year period, or an average of 1.5 MWp/annum. Using data presented in Sections 4.1.3, we can see that the manufacturing capacity already exists, and would provide 300 jobs in construction and installation, and O&M. Similarly, the rural-directed biogas digester deployment would assist in creating thousands of much-needed jobs in these areas. The third area of domestic use lies in solar water heating. As we have seen, there is enormous potential for the development of this market, with over 100,000 manufacturing and installation jobs associated with its deployment in the future. The third important area for the sector lies in grid-connected wind power systems. There is, for example, the plan by EHN to develop 1,000 MW of wind power in the Eastern Cape region (De Beer 2003). All three technologies (solar PV, SWH and wind) referred to above would be suitable for export to the African sub-region. Not only does South Africa have a competitive cost advantage, it more importantly has a relatively well-developed manufacturing and skills base.

Employment potential of Renewable Energy in South Africa SECCP
AGAMA Energy (Pty) Ltd 14 November 2003
36
6. Gross employment projections This section presents the results from analyses done to estimate the future gross employment potential of the RETs against the different deployment targets. The first section summarises the gross direct jobs based on three local manufactured content proportions, while the latter sections use this developed data to predict the future gross job implications.
6.1 Gross employment potential of the RETs
Table 6-1 summarises the data selected from the literature that is felt to reflect conservatively the direct jobs/MW for each of the RETs – referred to as the per-capacity data. At the same time, the table indicates the equivalent number of jobs on an electricity generation basis. This figure is the product of the capacity (MW), the number of hours in a year, and the capacity factor of the RET. These capacity factors are summarised in Table 5-1. This data then depicts the core inputs to the future employment projections.
Table 6-1: “Best estimate” current RET job creation potential from literature review (direct jobs/MW and /GWh)
Fuel Mnfr Inst O&M Other Total RET /MW /GWh /MW /GWh /MW /GWh /MW /GWh /MW /GWh /MW /GWh
Solar thermal 0.0 0.0 1.7 3.0 4.0 7.0 0.2 0.4 0.0 0.0 5.9 10.4 Solar PV 0.0 0.0 18.8 32.9 12.1 21.2 2.5 4.4 2.0 3.5 35.4 62.0 Wind 0.0 0.0 3.2 8.4 0.5 1.3 1.0 2.6 0.1 0.3 4.8 12.6 Biomass 0.0 0.0 0.0 0.0 0.0 0.0 1.0 5.6 0.0 0.0 1.0 5.6
Landfill 0.0 0.0 1.9 7.1 1.9 7.1 2.3 8.8 0.0 0.0 6.0 23.0
Table 6-2 below summarises the range of employment indices presented in Appendix F: Literature data for RETs employment. Note that the selected total jobs/MW is on the low end of the total range, and provides an indication of the conservative approach that has been adopted in the study. In the case of landfill generation, the only good index source from the literature was used directly.
Table 6-2: Range of employment data/MW for the RETs
RET Selected Total
jobs/MW Range of Total
jobs/MW Solar thermal 5.9 0.3 – 18.8 Solar PV 35.4 7.2 – 876.7 Wind 4.8 3.8 – 5.9 Biomass 1.0 1.0 – 4.4 Landfill 6.0 6.0
The projections for the electricity generating technologies are split into three categories, representing zero, 50% and 100% local manufacture of the RET in question. Note that the

Employment potential of Renewable Energy in South Africa SECCP
AGAMA Energy (Pty) Ltd 14 November 2003
37
data presented in the figures below is merely a ‘snapshot’ of what the employment figures would look like in the future, under different target scenarios and different levels of local manufacture, i.e. the data represents one chosen set of a number of possible sets of data. Data for Target 1, 2 and 3 assumes 0%, 50% and 100% local manufacture respectively, based on the assumption that different targeted levels of deployment will result in correspondingly different levels of local investment in manufacturing capacity. Figures representing the per-capacity and per-generation job multipliers for 2020 are presented in Table 6-3.
Table 6-3: Gross direct jobs/MW and /GWh by RET in 2020
Target 1 / 0% local manufacture Fuel Mnfr Inst O&M Other Total
RET /MW /GWh /MW /GWh /MW /GWh /MW /GWh /MW /GWh /MW /GWh Solar thermal 0.0 0.0 0.0 0.0 2.0 3.5 0.1 0.2 0.0 0.0 2.1 3.7 Solar PV 0.0 0.0 0.0 0.0 6.0 10.6 1.2 2.2 1.0 1.8 8.3 14.5 Wind 0.0 0.0 0.0 0.0 0.2 0.7 0.5 1.3 0.0 0.1 0.8 2.1 Biomass 0.0 0.0 0.0 0.0 0.0 0.0 0.5 2.8 0.0 0.0 0.5 2.8 Landfill 0.0 0.0 0.0 0.0 0.9 3.6 1.1 4.4 0.0 0.0 2.1 8.0
Target 2 / 50% local manufacture
Fuel Mnfr Inst O&M Other Total RET /MW /GWh /MW /GWh /MW /GWh /MW /GWh /MW /GWh /MW /GWh
Solar thermal 0.0 0.0 0.4 0.7 2.0 3.5 0.1 0.2 0.0 0.0 2.5 4.4
Solar PV 0.0 0.0 4.7 8.2 6.0 10.6 1.2 2.2 1.0 1.8 13.0 22.8 Wind 0.0 0.0 0.8 2.1 0.2 0.7 0.5 1.3 0.0 0.1 1.6 4.2 Biomass 0.0 0.0 0.0 0.0 0.0 0.0 0.5 2.8 0.0 0.0 0.5 2.8 Landfill 0.0 0.0 0.5 1.8 0.9 3.6 1.1 4.4 0.0 0.0 2.5 9.7
Target 3 / 100% local manufacture
Fuel Mnfr Inst O&M Other Total RET /MW /GWh /MW /GWh /MW /GWh /MW /GWh /MW /GWh /MW /GWh
Solar thermal 0.0 0.0 0.8 1.5 2.0 3.5 0.1 0.2 0.0 0.0 3.0 5.2 Solar PV 0.0 0.0 9.4 16.5 6.0 10.6 1.2 2.2 1.0 1.8 17.7 31.0 Wind 0.0 0.0 1.6 4.2 0.2 0.7 0.5 1.3 0.0 0.1 2.4 6.3 Biomass 0.0 0.0 0.0 0.0 0.0 0.0 0.5 2.8 0.0 0.0 0.5 2.8 Landfill 0.0 0.0 0.9 3.6 0.9 3.6 1.1 4.4 0.0 0.0 3.0 11.5
These per-capacity and per-generation indices provide a very useful insight into the relative performance of each in terms of job creation. Importantly, however, the proportion of the total ‘mix’ being provided by each RET needs to be factored in when assessing the total job implications. Therefore, while it is useful to compare the estimated future job impacts of each technology against the same capacity development or electrical output (and thus avoiding the inclusion of the proportional mix issue), it is more realistic to perform a complete analysis of the job implications based on their proportional generation.
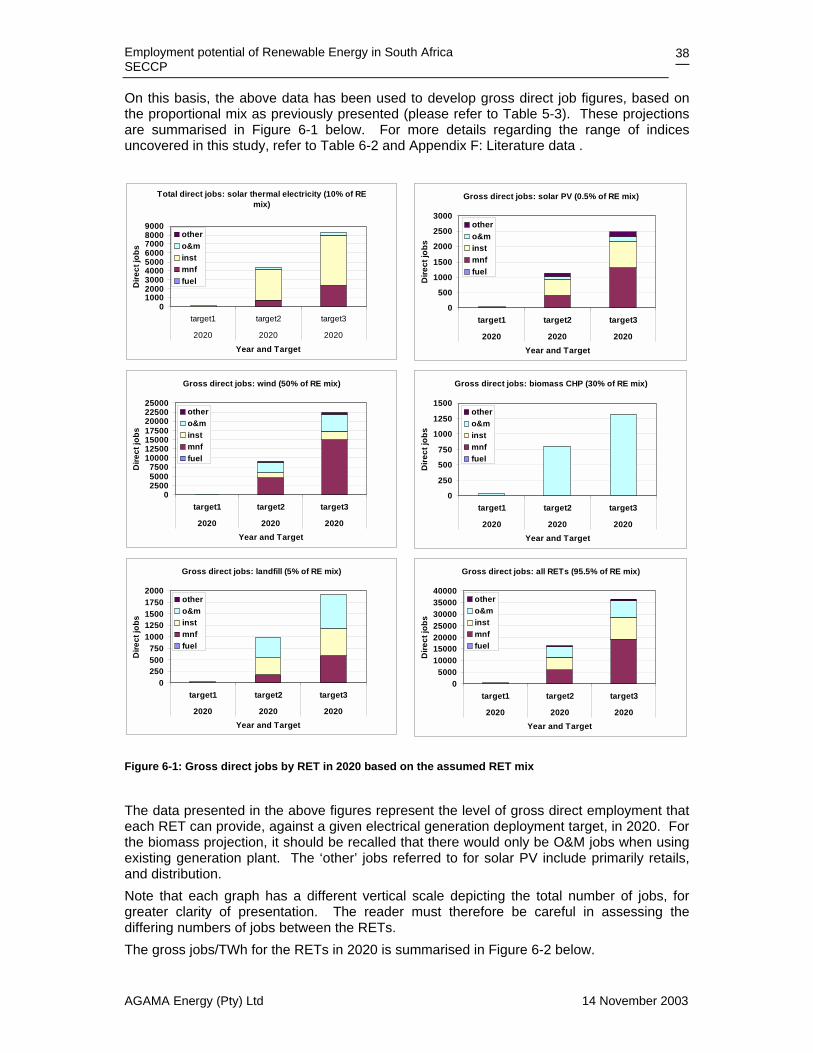
Employment potential of Renewable Energy in South Africa SECCP
AGAMA Energy (Pty) Ltd 14 November 2003
38
On this basis, the above data has been used to develop gross direct job figures, based on the proportional mix as previously presented (please refer to Table 5-3). These projections are summarised in Figure 6-1 below. For more details regarding the range of indices uncovered in this study, refer to Table 6-2 and Appendix F: Literature data .
Total direct jobs: solar thermal electricity (10% of RE mix)
0100020003000400050006000700080009000
target1 target2 target3
2020 2020 2020
Year and Target
Dire
ct jo
bs
othero&minstmnffuel
Gross direct jobs: solar PV (0.5% of RE mix)
0
500
1000
1500
2000
2500
3000
target1 target2 target3
2020 2020 2020Year and Target
Dire
ct jo
bs
othero&minstmnffuel
Gross direct jobs: wind (50% of RE mix)
0250050007500
10000125001500017500200002250025000
target1 target2 target3
2020 2020 2020Year and Target
Dire
ct jo
bs
othero&minstmnffuel
Gross direct jobs: biomass CHP (30% of RE mix)
0
250
500
750
1000
1250
1500
target1 target2 target3
2020 2020 2020Year and Target
Dire
ct jo
bsothero&minstmnffuel
Gross direct jobs: landfill (5% of RE mix)
0250500750
10001250150017502000
target1 target2 target3
2020 2020 2020Year and Target
Dire
ct jo
bs
othero&minstmnffuel
Gross direct jobs: all RETs (95.5% of RE mix)
05000
10000150002000025000300003500040000
target1 target2 target3
2020 2020 2020Year and Target
Dire
ct jo
bs
othero&minstmnffuel
Figure 6-1: Gross direct jobs by RET in 2020 based on the assumed RET mix
The data presented in the above figures represent the level of gross direct employment that each RET can provide, against a given electrical generation deployment target, in 2020. For the biomass projection, it should be recalled that there would only be O&M jobs when using existing generation plant. The ‘other’ jobs referred to for solar PV include primarily retails, and distribution. Note that each graph has a different vertical scale depicting the total number of jobs, for greater clarity of presentation. The reader must therefore be careful in assessing the differing numbers of jobs between the RETs. The gross jobs/TWh for the RETs in 2020 is summarised in Figure 6-2 below.
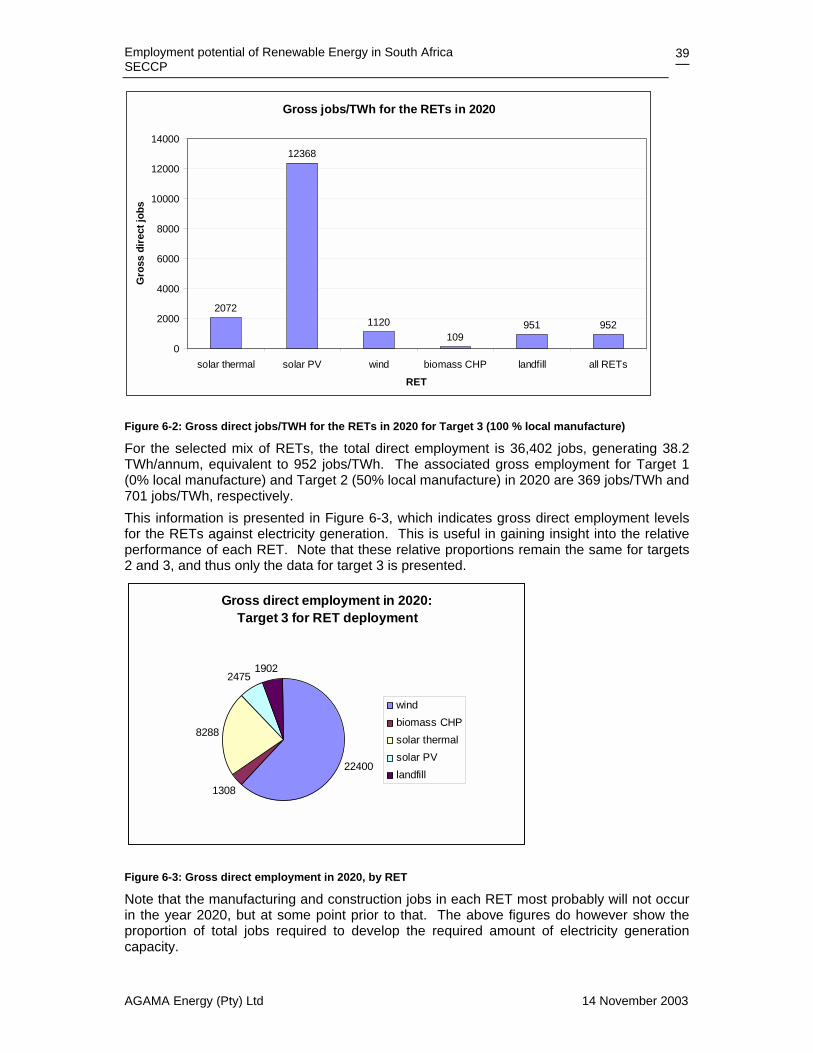
Employment potential of Renewable Energy in South Africa SECCP
AGAMA Energy (Pty) Ltd 14 November 2003
39
Gross jobs/TWh for the RETs in 2020
2072
12368
1120109
951 952
0
2000
4000
6000
8000
10000
12000
14000
solar thermal solar PV wind biomass CHP landfill all RETs
RET
Gro
ss d
irect
jobs
Figure 6-2: Gross direct jobs/TWH for the RETs in 2020 for Target 3 (100 % local manufacture)
For the selected mix of RETs, the total direct employment is 36,402 jobs, generating 38.2 TWh/annum, equivalent to 952 jobs/TWh. The associated gross employment for Target 1 (0% local manufacture) and Target 2 (50% local manufacture) in 2020 are 369 jobs/TWh and 701 jobs/TWh, respectively. This information is presented in Figure 6-3, which indicates gross direct employment levels for the RETs against electricity generation. This is useful in gaining insight into the relative performance of each RET. Note that these relative proportions remain the same for targets 2 and 3, and thus only the data for target 3 is presented.
Gross direct employment in 2020: Target 3 for RET deployment
22400
1308
8288
24751902
windbiomass CHPsolar thermalsolar PVlandfill
Figure 6-3: Gross direct employment in 2020, by RET
Note that the manufacturing and construction jobs in each RET most probably will not occur in the year 2020, but at some point prior to that. The above figures do however show the proportion of total jobs required to develop the required amount of electricity generation capacity.
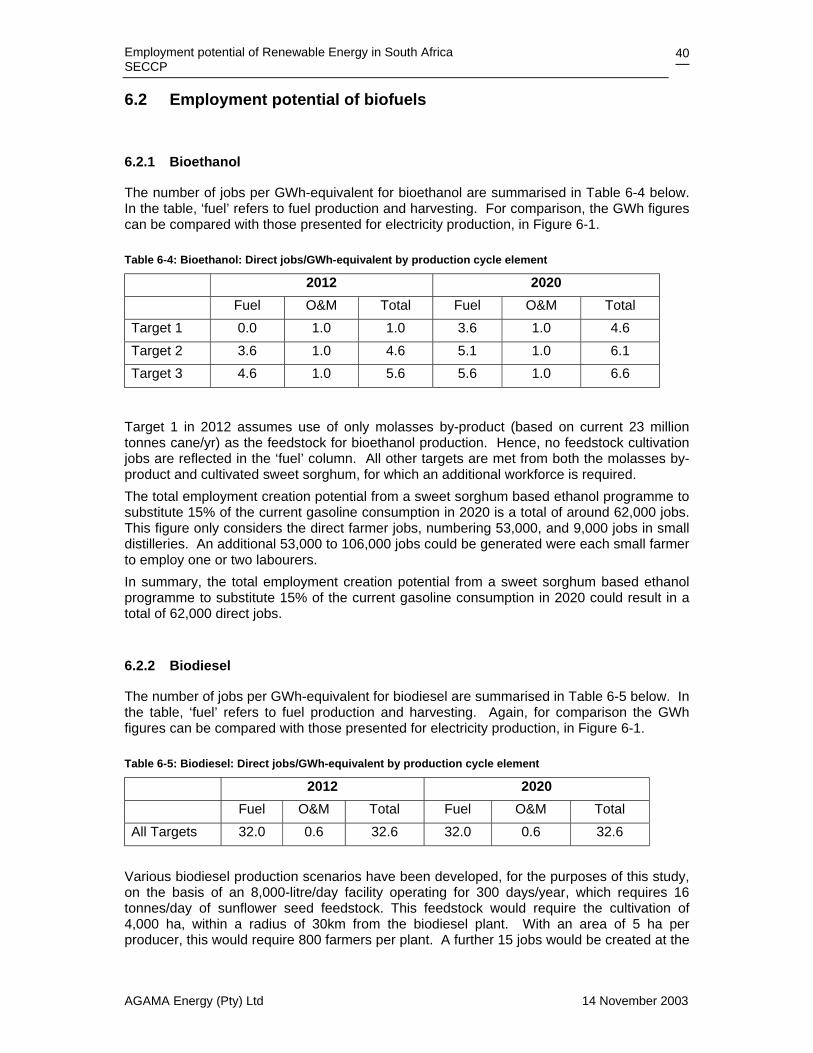
Employment potential of Renewable Energy in South Africa SECCP
AGAMA Energy (Pty) Ltd 14 November 2003
40
6.2 Employment potential of biofuels
6.2.1 Bioethanol
The number of jobs per GWh-equivalent for bioethanol are summarised in Table 6-4 below. In the table, ‘fuel’ refers to fuel production and harvesting. For comparison, the GWh figures can be compared with those presented for electricity production, in Figure 6-1.
Table 6-4: Bioethanol: Direct jobs/GWh-equivalent by production cycle element
2012 2020 Fuel O&M Total Fuel O&M Total
Target 1 0.0 1.0 1.0 3.6 1.0 4.6 Target 2 3.6 1.0 4.6 5.1 1.0 6.1 Target 3 4.6 1.0 5.6 5.6 1.0 6.6
Target 1 in 2012 assumes use of only molasses by-product (based on current 23 million tonnes cane/yr) as the feedstock for bioethanol production. Hence, no feedstock cultivation jobs are reflected in the ‘fuel’ column. All other targets are met from both the molasses by-product and cultivated sweet sorghum, for which an additional workforce is required. The total employment creation potential from a sweet sorghum based ethanol programme to substitute 15% of the current gasoline consumption in 2020 is a total of around 62,000 jobs. This figure only considers the direct farmer jobs, numbering 53,000, and 9,000 jobs in small distilleries. An additional 53,000 to 106,000 jobs could be generated were each small farmer to employ one or two labourers. In summary, the total employment creation potential from a sweet sorghum based ethanol programme to substitute 15% of the current gasoline consumption in 2020 could result in a total of 62,000 direct jobs.
6.2.2 Biodiesel
The number of jobs per GWh-equivalent for biodiesel are summarised in Table 6-5 below. In the table, ‘fuel’ refers to fuel production and harvesting. Again, for comparison the GWh figures can be compared with those presented for electricity production, in Figure 6-1.
Table 6-5: Biodiesel: Direct jobs/GWh-equivalent by production cycle element
2012 2020 Fuel O&M Total Fuel O&M Total
All Targets 32.0 0.6 32.6 32.0 0.6 32.6 Various biodiesel production scenarios have been developed, for the purposes of this study, on the basis of an 8,000-litre/day facility operating for 300 days/year, which requires 16 tonnes/day of sunflower seed feedstock. This feedstock would require the cultivation of 4,000 ha, within a radius of 30km from the biodiesel plant. With an area of 5 ha per producer, this would require 800 farmers per plant. A further 15 jobs would be created at the
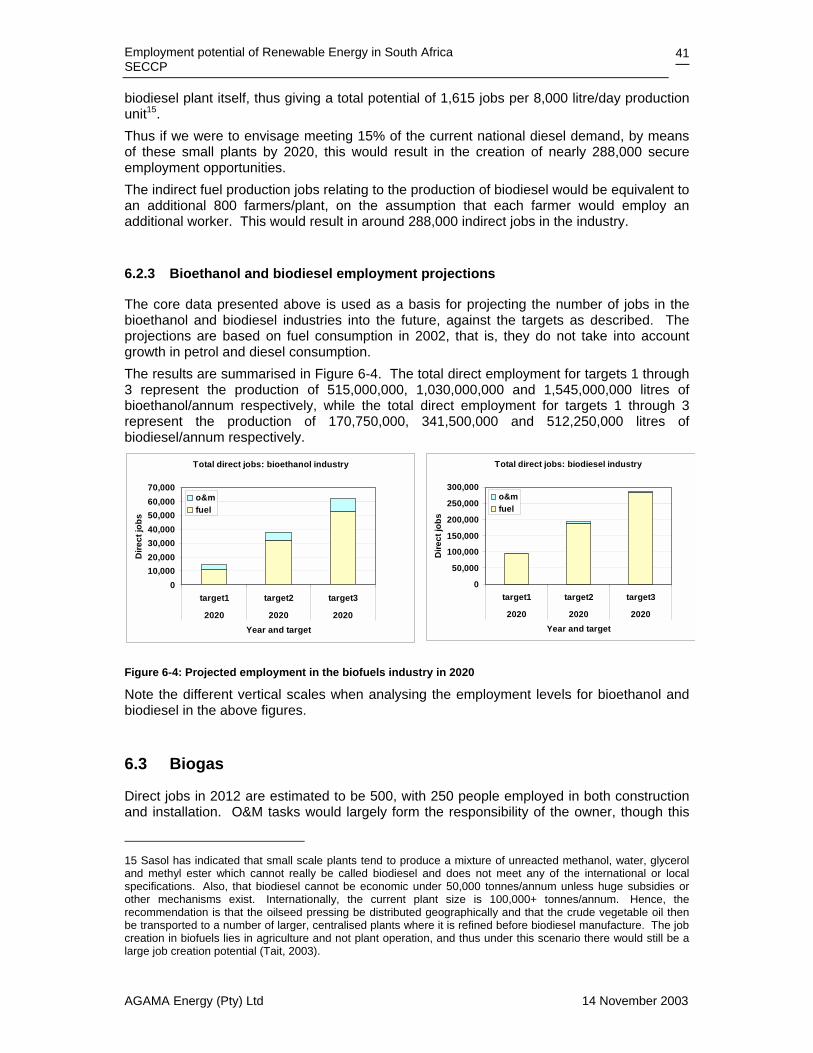
Employment potential of Renewable Energy in South Africa SECCP
AGAMA Energy (Pty) Ltd 14 November 2003
41
biodiesel plant itself, thus giving a total potential of 1,615 jobs per 8,000 litre/day production unit15. Thus if we were to envisage meeting 15% of the current national diesel demand, by means of these small plants by 2020, this would result in the creation of nearly 288,000 secure employment opportunities. The indirect fuel production jobs relating to the production of biodiesel would be equivalent to an additional 800 farmers/plant, on the assumption that each farmer would employ an additional worker. This would result in around 288,000 indirect jobs in the industry.
6.2.3 Bioethanol and biodiesel employment projections
The core data presented above is used as a basis for projecting the number of jobs in the bioethanol and biodiesel industries into the future, against the targets as described. The projections are based on fuel consumption in 2002, that is, they do not take into account growth in petrol and diesel consumption. The results are summarised in Figure 6-4. The total direct employment for targets 1 through 3 represent the production of 515,000,000, 1,030,000,000 and 1,545,000,000 litres of bioethanol/annum respectively, while the total direct employment for targets 1 through 3 represent the production of 170,750,000, 341,500,000 and 512,250,000 litres of biodiesel/annum respectively.
Total direct jobs: bioethanol industry
010,00020,00030,00040,00050,00060,00070,000
target1 target2 target3
2020 2020 2020Year and target
Dire
ct jo
bs
o&mfuel
Total direct jobs: biodiesel industry
0
50,000
100,000
150,000
200,000
250,000
300,000
target1 target2 target3
2020 2020 2020Year and target
Dire
ct jo
bs
o&mfuel
Figure 6-4: Projected employment in the biofuels industry in 2020
Note the different vertical scales when analysing the employment levels for bioethanol and biodiesel in the above figures.
6.3 Biogas
Direct jobs in 2012 are estimated to be 500, with 250 people employed in both construction and installation. O&M tasks would largely form the responsibility of the owner, though this
15 Sasol has indicated that small scale plants tend to produce a mixture of unreacted methanol, water, glycerol and methyl ester which cannot really be called biodiesel and does not meet any of the international or local specifications. Also, that biodiesel cannot be economic under 50,000 tonnes/annum unless huge subsidies or other mechanisms exist. Internationally, the current plant size is 100,000+ tonnes/annum. Hence, the recommendation is that the oilseed pressing be distributed geographically and that the crude vegetable oil then be transported to a number of larger, centralised plants where it is refined before biodiesel manufacture. The job creation in biofuels lies in agriculture and not plant operation, and thus under this scenario there would still be a large job creation potential (Tait, 2003).
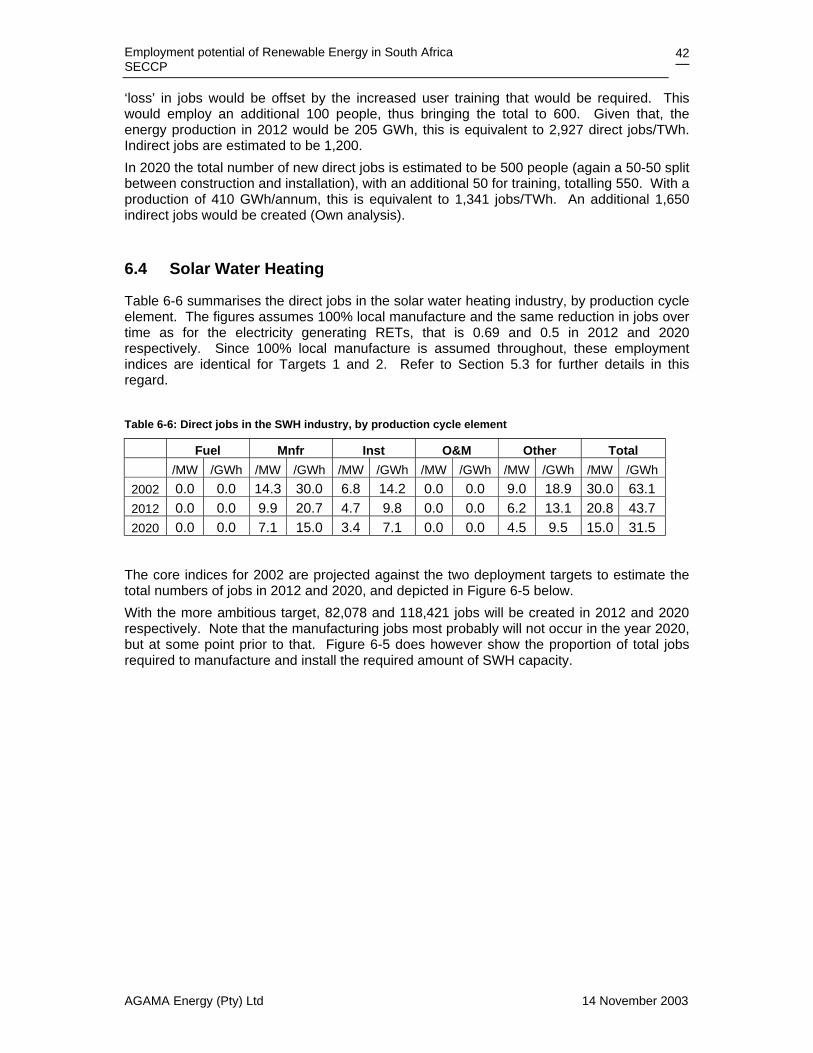
Employment potential of Renewable Energy in South Africa SECCP
AGAMA Energy (Pty) Ltd 14 November 2003
42
‘loss’ in jobs would be offset by the increased user training that would be required. This would employ an additional 100 people, thus bringing the total to 600. Given that, the energy production in 2012 would be 205 GWh, this is equivalent to 2,927 direct jobs/TWh. Indirect jobs are estimated to be 1,200. In 2020 the total number of new direct jobs is estimated to be 500 people (again a 50-50 split between construction and installation), with an additional 50 for training, totalling 550. With a production of 410 GWh/annum, this is equivalent to 1,341 jobs/TWh. An additional 1,650 indirect jobs would be created (Own analysis).
6.4 Solar Water Heating
Table 6-6 summarises the direct jobs in the solar water heating industry, by production cycle element. The figures assumes 100% local manufacture and the same reduction in jobs over time as for the electricity generating RETs, that is 0.69 and 0.5 in 2012 and 2020 respectively. Since 100% local manufacture is assumed throughout, these employment indices are identical for Targets 1 and 2. Refer to Section 5.3 for further details in this regard.
Table 6-6: Direct jobs in the SWH industry, by production cycle element
Fuel Mnfr Inst O&M Other Total /MW /GWh /MW /GWh /MW /GWh /MW /GWh /MW /GWh /MW /GWh
2002 0.0 0.0 14.3 30.0 6.8 14.2 0.0 0.0 9.0 18.9 30.0 63.1 2012 0.0 0.0 9.9 20.7 4.7 9.8 0.0 0.0 6.2 13.1 20.8 43.7 2020 0.0 0.0 7.1 15.0 3.4 7.1 0.0 0.0 4.5 9.5 15.0 31.5
The core indices for 2002 are projected against the two deployment targets to estimate the total numbers of jobs in 2012 and 2020, and depicted in Figure 6-5 below. With the more ambitious target, 82,078 and 118,421 jobs will be created in 2012 and 2020 respectively. Note that the manufacturing jobs most probably will not occur in the year 2020, but at some point prior to that. Figure 6-5 does however show the proportion of total jobs required to manufacture and install the required amount of SWH capacity.
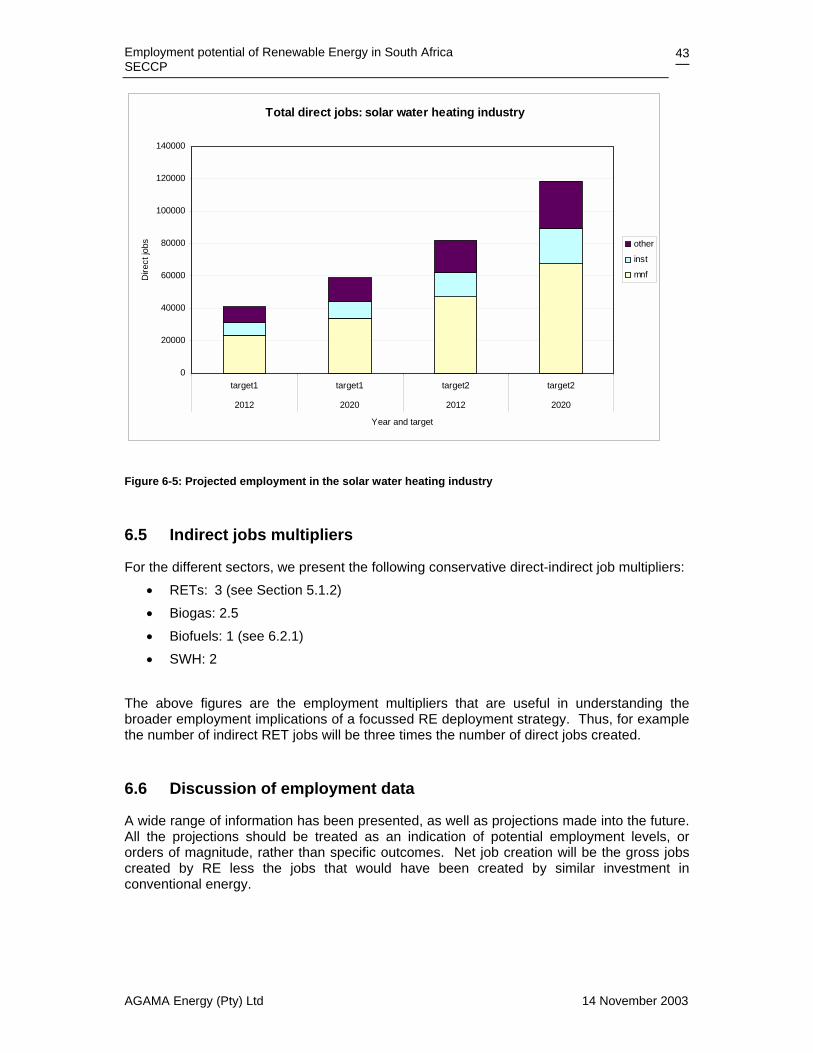
Employment potential of Renewable Energy in South Africa SECCP
AGAMA Energy (Pty) Ltd 14 November 2003
43
Total direct jobs: solar water heating industry
0
20000
40000
60000
80000
100000
120000
140000
target1 target1 target2 target2
2012 2020 2012 2020
Year and target
Dire
ct jo
bs other
inst
mnf
Figure 6-5: Projected employment in the solar water heating industry
6.5 Indirect jobs multipliers
For the different sectors, we present the following conservative direct-indirect job multipliers: • RETs: 3 (see Section 5.1.2) • Biogas: 2.5 • Biofuels: 1 (see 6.2.1) • SWH: 2
The above figures are the employment multipliers that are useful in understanding the broader employment implications of a focussed RE deployment strategy. Thus, for example the number of indirect RET jobs will be three times the number of direct jobs created.
6.6 Discussion of employment data
A wide range of information has been presented, as well as projections made into the future. All the projections should be treated as an indication of potential employment levels, or orders of magnitude, rather than specific outcomes. Net job creation will be the gross jobs created by RE less the jobs that would have been created by similar investment in conventional energy.
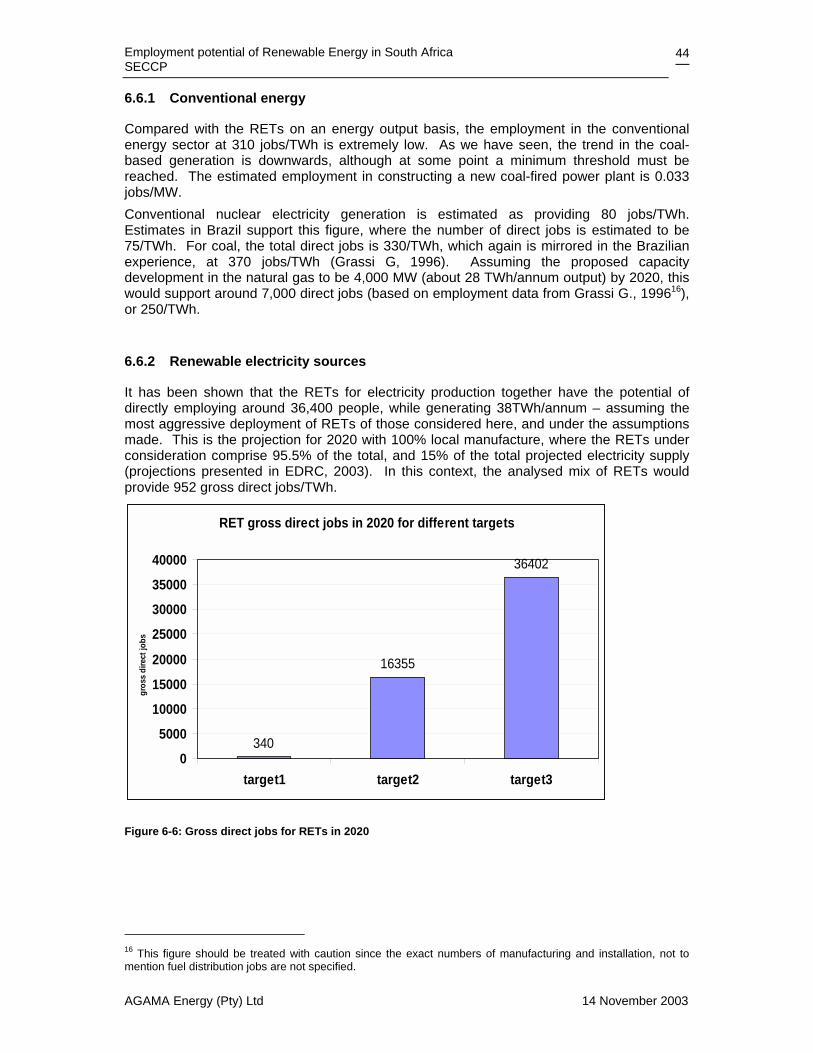
Employment potential of Renewable Energy in South Africa SECCP
AGAMA Energy (Pty) Ltd 14 November 2003
44
6.6.1 Conventional energy
Compared with the RETs on an energy output basis, the employment in the conventional energy sector at 310 jobs/TWh is extremely low. As we have seen, the trend in the coal-based generation is downwards, although at some point a minimum threshold must be reached. The estimated employment in constructing a new coal-fired power plant is 0.033 jobs/MW. Conventional nuclear electricity generation is estimated as providing 80 jobs/TWh. Estimates in Brazil support this figure, where the number of direct jobs is estimated to be 75/TWh. For coal, the total direct jobs is 330/TWh, which again is mirrored in the Brazilian experience, at 370 jobs/TWh (Grassi G, 1996). Assuming the proposed capacity development in the natural gas to be 4,000 MW (about 28 TWh/annum output) by 2020, this would support around 7,000 direct jobs (based on employment data from Grassi G., 199616), or 250/TWh.
6.6.2 Renewable electricity sources
It has been shown that the RETs for electricity production together have the potential of directly employing around 36,400 people, while generating 38TWh/annum – assuming the most aggressive deployment of RETs of those considered here, and under the assumptions made. This is the projection for 2020 with 100% local manufacture, where the RETs under consideration comprise 95.5% of the total, and 15% of the total projected electricity supply (projections presented in EDRC, 2003). In this context, the analysed mix of RETs would provide 952 gross direct jobs/TWh.
RET gross direct jobs in 2020 for different targets
340
16355
36402
0
5000
10000
15000
20000
25000
30000
35000
40000
target1 target2 target3
gros
s di
rect
jobs
Figure 6-6: Gross direct jobs for RETs in 2020
16 This figure should be treated with caution since the exact numbers of manufacturing and installation, not to mention fuel distribution jobs are not specified.
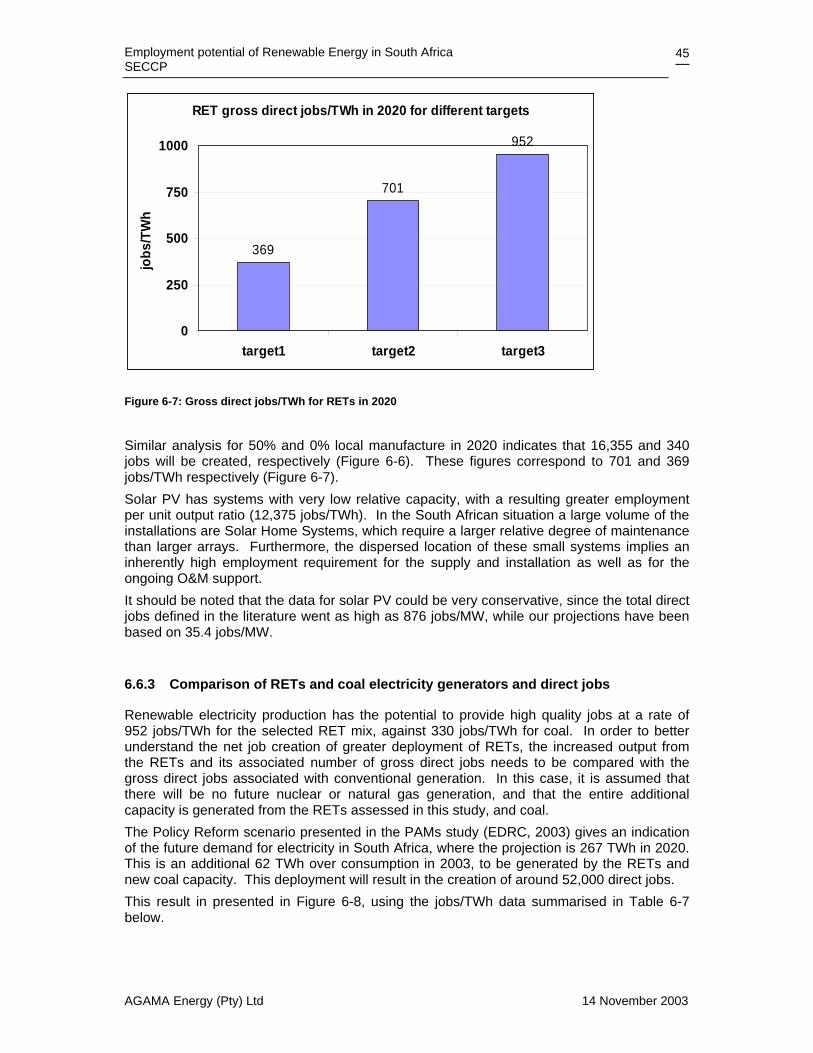
Employment potential of Renewable Energy in South Africa SECCP
AGAMA Energy (Pty) Ltd 14 November 2003
45
RET gross direct jobs/TWh in 2020 for different targets
369
701
952
0
250
500
750
1000
target1 target2 target3
jobs
/TW
h
Figure 6-7: Gross direct jobs/TWh for RETs in 2020
Similar analysis for 50% and 0% local manufacture in 2020 indicates that 16,355 and 340 jobs will be created, respectively (Figure 6-6). These figures correspond to 701 and 369 jobs/TWh respectively (Figure 6-7). Solar PV has systems with very low relative capacity, with a resulting greater employment per unit output ratio (12,375 jobs/TWh). In the South African situation a large volume of the installations are Solar Home Systems, which require a larger relative degree of maintenance than larger arrays. Furthermore, the dispersed location of these small systems implies an inherently high employment requirement for the supply and installation as well as for the ongoing O&M support. It should be noted that the data for solar PV could be very conservative, since the total direct jobs defined in the literature went as high as 876 jobs/MW, while our projections have been based on 35.4 jobs/MW.
6.6.3 Comparison of RETs and coal electricity generators and direct jobs
Renewable electricity production has the potential to provide high quality jobs at a rate of 952 jobs/TWh for the selected RET mix, against 330 jobs/TWh for coal. In order to better understand the net job creation of greater deployment of RETs, the increased output from the RETs and its associated number of gross direct jobs needs to be compared with the gross direct jobs associated with conventional generation. In this case, it is assumed that there will be no future nuclear or natural gas generation, and that the entire additional capacity is generated from the RETs assessed in this study, and coal. The Policy Reform scenario presented in the PAMs study (EDRC, 2003) gives an indication of the future demand for electricity in South Africa, where the projection is 267 TWh in 2020. This is an additional 62 TWh over consumption in 2003, to be generated by the RETs and new coal capacity. This deployment will result in the creation of around 52,000 direct jobs. This result in presented in Figure 6-8, using the jobs/TWh data summarised in Table 6-7 below.

Employment potential of Renewable Energy in South Africa SECCP
AGAMA Energy (Pty) Ltd 14 November 2003
46
Table 6-7: Job indices for future electricity generation
jobs/TWh 2003 jobs/TWh 2020 Coal 337 700 Wind 1120 1120 Biomass 109 109 Solar Thermal 2072 2072 solar PV 12368 12368 landfill 951 951
Gross direct jobs in 2020 by technology to meet projected generation requirement
0
5000
10000
15000
20000
25000
30000
Coal Wind Biomass SolarThermal
solar PV landfill
technology
additional generation in2020 (GWh)gross direct jobs
Figure 6-8: Gross direct jobs to meet additional generation requirements in 2020
Importantly, this projection is limited to the RETs contributing 15% of the total electricity supply in 2020. As is clear from Table 6-7, all the RETs except biomass CHP will provide a greater number of jobs than new coal. Thus, a greater number of overall jobs can be created by increasing this percentage generated by RETs, thus shifting new coal jobs to a greater number across the range of RETs. Should the total additional generation of 62 TWh be generated by new coal-fired plants, around 43,000 new jobs would be created. Alternatively, were this additional generation to be generated by the RETs alone, a total of around 57,000 new direct jobs would result. Note that none of the above projections take into account any future decline, as per the trend, in coal-related jobs. This trend is evident in Figure 3-1, and it should be noted that the job losses are due to normal attrition in the industry as opposed to displacement by alternative generation technologies. Importantly an additional minimum of 36,400 jobs are created through the use of RETs. Critically, these new jobs are created in a growing industry as opposed to a declining one, and thus will in turn lend infrastructural and capacity support to an increasing number of new jobs to follow. Three over-riding observations can be made:
• replacing coal-based generation with nuclear or natural gas will cause energy sector jobs to decline;
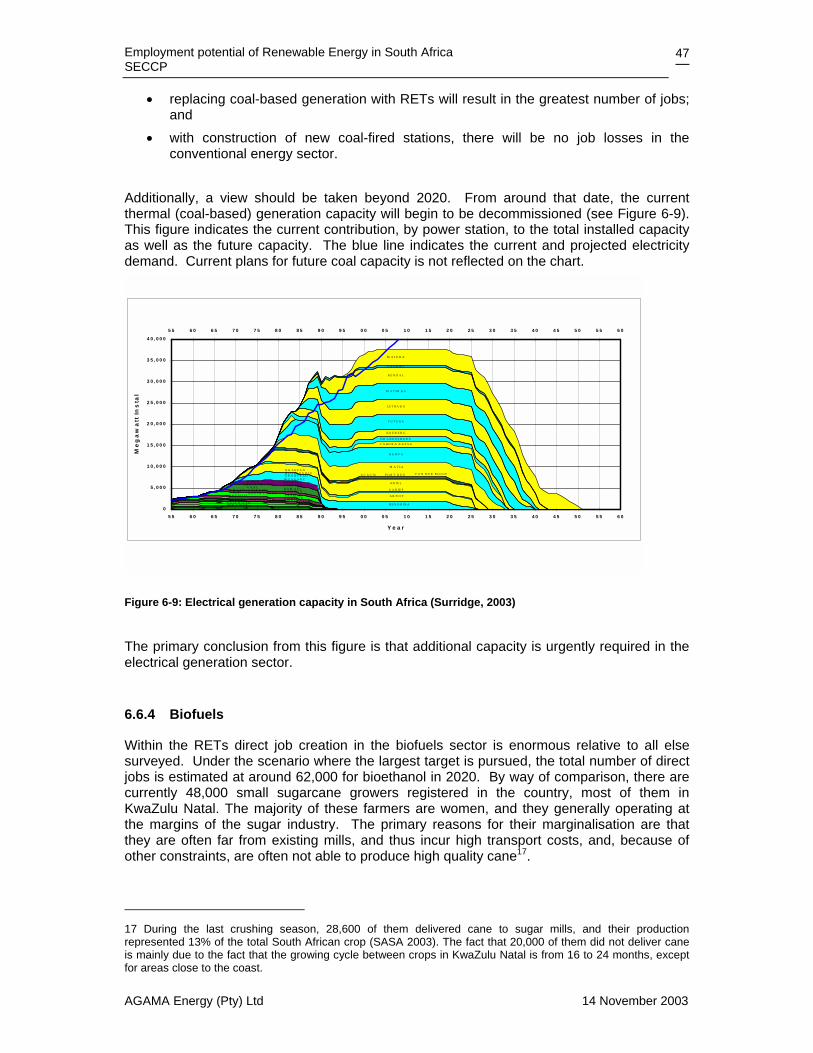
Employment potential of Renewable Energy in South Africa SECCP
AGAMA Energy (Pty) Ltd 14 November 2003
47
• replacing coal-based generation with RETs will result in the greatest number of jobs; and
• with construction of new coal-fired stations, there will be no job losses in the conventional energy sector.
Additionally, a view should be taken beyond 2020. From around that date, the current thermal (coal-based) generation capacity will begin to be decommissioned (see Figure 6-9). This figure indicates the current contribution, by power station, to the total installed capacity as well as the future capacity. The blue line indicates the current and projected electricity demand. Current plans for future coal capacity is not reflected on the chart.
H E X R IV E RS A LT R IV E R
C E N T R A L W E S T B A N K
C O LE N S O
C O N G E LLOS O U T H C O A S T
U M G E N I
B R A K P A N
K LIP
R O S H E R V ILLE
T A A IB O S
V A A LV E R E E N IN G IN G
W ILG EW IT B A N KG E O R G E
V IE R F O N T E INH IG HV E LD
K O M A T I
IN G A G A N E
C A M D E N
G R O O T V LE I
H E N D R IN A
A R N O T
G A R IE P
K R IE L
A C A C IA P O R T R E X V A N D E R KLO O F
M A T LA
D U HV A
C A HO R A B A S S A
D R A K E N S B E R G
K O E B E R G
T U T U K A
LE T H A B O
M A T IM B A
K E N D A L
P A LM IE T
M A J U B A
0
5 , 0 0 0
1 0 , 0 0 0
1 5 , 0 0 0
2 0 , 0 0 0
2 5 , 0 0 0
3 0 , 0 0 0
3 5 , 0 0 0
4 0 , 0 0 0
5 5 6 0 6 5 7 0 7 5 8 0 8 5 9 0 9 5 0 0 0 5 1 0 1 5 2 0 2 5 3 0 3 5 4 0 4 5 5 0 5 5 6 0
Y e a r
Me
ga
wa
tt In
sta
l
5 5 6 0 6 5 7 0 7 5 8 0 8 5 9 0 9 5 0 0 0 5 1 0 1 5 2 0 2 5 3 0 3 5 4 0 4 5 5 0 5 5 6 0
Figure 6-9: Electrical generation capacity in South Africa (Surridge, 2003)
The primary conclusion from this figure is that additional capacity is urgently required in the electrical generation sector.
6.6.4 Biofuels
Within the RETs direct job creation in the biofuels sector is enormous relative to all else surveyed. Under the scenario where the largest target is pursued, the total number of direct jobs is estimated at around 62,000 for bioethanol in 2020. By way of comparison, there are currently 48,000 small sugarcane growers registered in the country, most of them in KwaZulu Natal. The majority of these farmers are women, and they generally operating at the margins of the sugar industry. The primary reasons for their marginalisation are that they are often far from existing mills, and thus incur high transport costs, and, because of other constraints, are often not able to produce high quality cane17.
17 During the last crushing season, 28,600 of them delivered cane to sugar mills, and their production represented 13% of the total South African crop (SASA 2003). The fact that 20,000 of them did not deliver cane is mainly due to the fact that the growing cycle between crops in KwaZulu Natal is from 16 to 24 months, except for areas close to the coast.
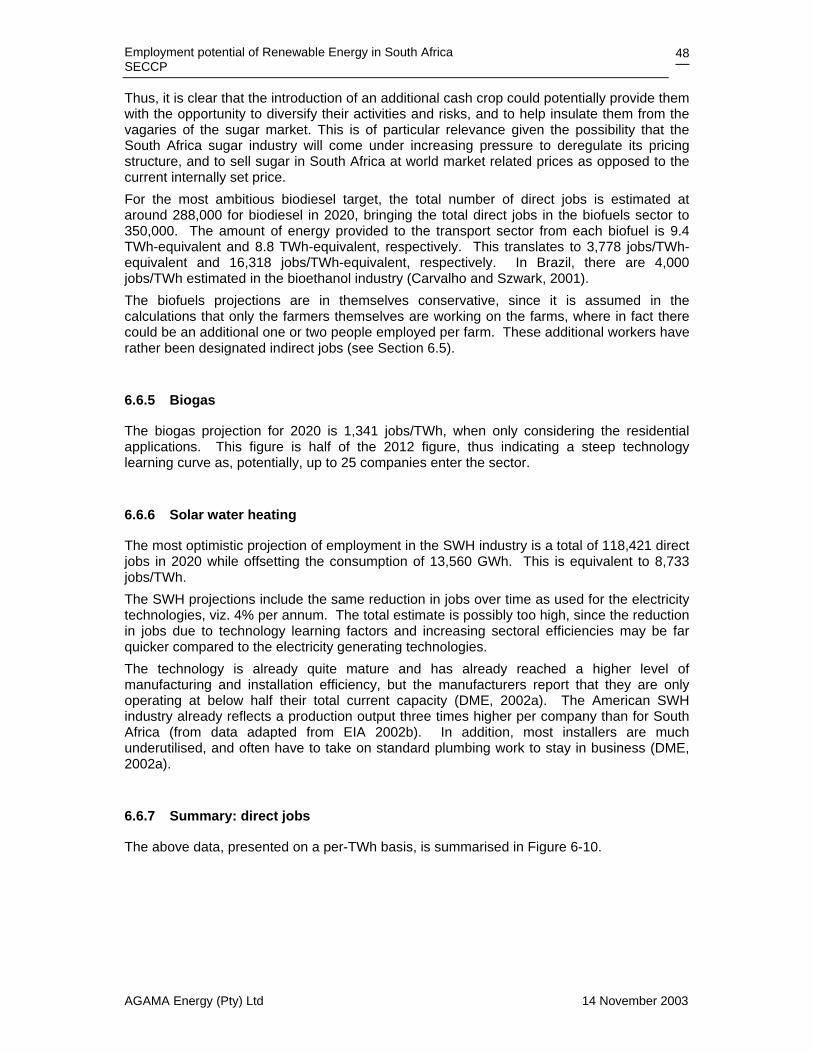
Employment potential of Renewable Energy in South Africa SECCP
AGAMA Energy (Pty) Ltd 14 November 2003
48
Thus, it is clear that the introduction of an additional cash crop could potentially provide them with the opportunity to diversify their activities and risks, and to help insulate them from the vagaries of the sugar market. This is of particular relevance given the possibility that the South Africa sugar industry will come under increasing pressure to deregulate its pricing structure, and to sell sugar in South Africa at world market related prices as opposed to the current internally set price. For the most ambitious biodiesel target, the total number of direct jobs is estimated at around 288,000 for biodiesel in 2020, bringing the total direct jobs in the biofuels sector to 350,000. The amount of energy provided to the transport sector from each biofuel is 9.4 TWh-equivalent and 8.8 TWh-equivalent, respectively. This translates to 3,778 jobs/TWh-equivalent and 16,318 jobs/TWh-equivalent, respectively. In Brazil, there are 4,000 jobs/TWh estimated in the bioethanol industry (Carvalho and Szwark, 2001). The biofuels projections are in themselves conservative, since it is assumed in the calculations that only the farmers themselves are working on the farms, where in fact there could be an additional one or two people employed per farm. These additional workers have rather been designated indirect jobs (see Section 6.5).
6.6.5 Biogas
The biogas projection for 2020 is 1,341 jobs/TWh, when only considering the residential applications. This figure is half of the 2012 figure, thus indicating a steep technology learning curve as, potentially, up to 25 companies enter the sector.
6.6.6 Solar water heating
The most optimistic projection of employment in the SWH industry is a total of 118,421 direct jobs in 2020 while offsetting the consumption of 13,560 GWh. This is equivalent to 8,733 jobs/TWh. The SWH projections include the same reduction in jobs over time as used for the electricity technologies, viz. 4% per annum. The total estimate is possibly too high, since the reduction in jobs due to technology learning factors and increasing sectoral efficiencies may be far quicker compared to the electricity generating technologies. The technology is already quite mature and has already reached a higher level of manufacturing and installation efficiency, but the manufacturers report that they are only operating at below half their total current capacity (DME, 2002a). The American SWH industry already reflects a production output three times higher per company than for South Africa (from data adapted from EIA 2002b). In addition, most installers are much underutilised, and often have to take on standard plumbing work to stay in business (DME, 2002a).
6.6.7 Summary: direct jobs
The above data, presented on a per-TWh basis, is summarised in Figure 6-10.
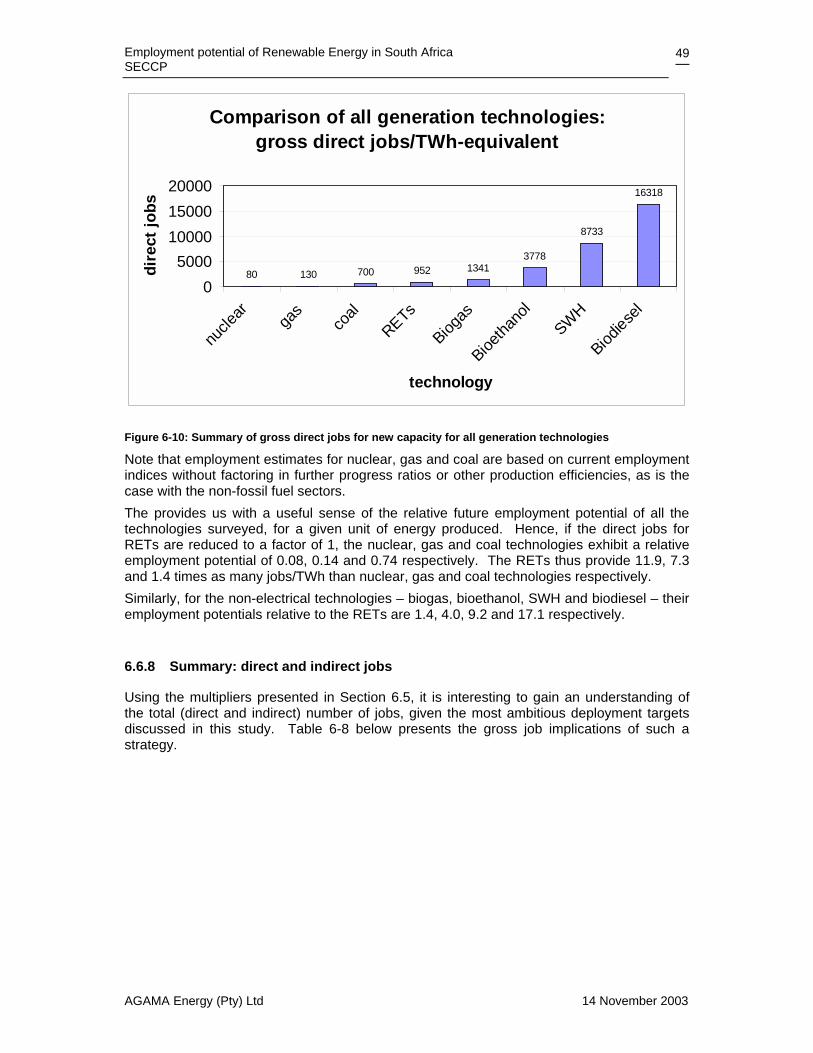
Employment potential of Renewable Energy in South Africa SECCP
AGAMA Energy (Pty) Ltd 14 November 2003
49
Comparison of all generation technologies: gross direct jobs/TWh-equivalent
80 130 700 952 13413778
8733
16318
05000
100001500020000
nucle
ar gas
coal
RETs
Biogas
Bioetha
nol
SWH
Biodiese
l
technology
dire
ct jo
bs
Figure 6-10: Summary of gross direct jobs for new capacity for all generation technologies
Note that employment estimates for nuclear, gas and coal are based on current employment indices without factoring in further progress ratios or other production efficiencies, as is the case with the non-fossil fuel sectors. The provides us with a useful sense of the relative future employment potential of all the technologies surveyed, for a given unit of energy produced. Hence, if the direct jobs for RETs are reduced to a factor of 1, the nuclear, gas and coal technologies exhibit a relative employment potential of 0.08, 0.14 and 0.74 respectively. The RETs thus provide 11.9, 7.3 and 1.4 times as many jobs/TWh than nuclear, gas and coal technologies respectively. Similarly, for the non-electrical technologies – biogas, bioethanol, SWH and biodiesel – their employment potentials relative to the RETs are 1.4, 4.0, 9.2 and 17.1 respectively.
6.6.8 Summary: direct and indirect jobs
Using the multipliers presented in Section 6.5, it is interesting to gain an understanding of the total (direct and indirect) number of jobs, given the most ambitious deployment targets discussed in this study. Table 6-8 below presents the gross job implications of such a strategy.
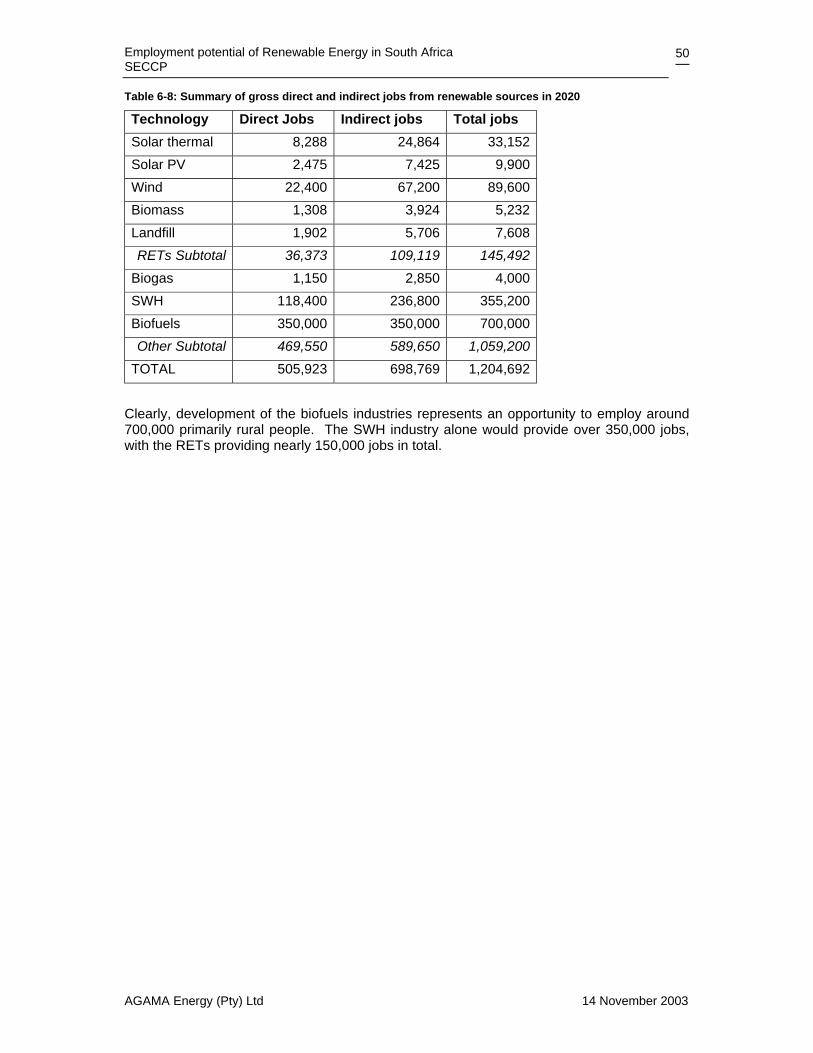
Employment potential of Renewable Energy in South Africa SECCP
AGAMA Energy (Pty) Ltd 14 November 2003
50
Table 6-8: Summary of gross direct and indirect jobs from renewable sources in 2020
Technology Direct Jobs Indirect jobs Total jobs Solar thermal 8,288 24,864 33,152 Solar PV 2,475 7,425 9,900 Wind 22,400 67,200 89,600 Biomass 1,308 3,924 5,232 Landfill 1,902 5,706 7,608 RETs Subtotal 36,373 109,119 145,492
Biogas 1,150 2,850 4,000 SWH 118,400 236,800 355,200 Biofuels 350,000 350,000 700,000 Other Subtotal 469,550 589,650 1,059,200
TOTAL 505,923 698,769 1,204,692 Clearly, development of the biofuels industries represents an opportunity to employ around 700,000 primarily rural people. The SWH industry alone would provide over 350,000 jobs, with the RETs providing nearly 150,000 jobs in total.
Employment potential of Renewable Energy in South Africa SECCP
AGAMA Energy (Pty) Ltd 14 November 2003
51
7. Gearing up: new jobs, new skills
7.1 Types of RET jobs
The quality of employment opportunities is an important consideration when investigating the impacts of industrial development as a consequence of RETs. Renewable energy jobs are superior, cleaner, and healthier, and located where workers do not have to migrate for months at a time – as is generally the situation in the coal-mining situation. Importantly, workers can live at home while being employed in “good” jobs. It was reported that for Southern Mediterranean (North African) countries solar PV and wind projects have a strong bias towards the industrial sector, creating around 60% of total jobs (IPTS, 1998). The service sector absorbs 18% to 26% of employment, while the balance is provided by the building sector, in the case of wind farms, and to the mining sector in the case of solar PV projects. For biomass plants, the industry, building and service sectors absorb similar proportions of total employment (27%, 33% and 28% respectively). Although it is self-evident, it is worth mentioning that the agricultural sector does not register any significant impact in job creation when the employment in the construction of RE plants is analysed (MEPC, 2003). In 2002, the United Kingdom (UK) based Electricity Training Association carried out an employment and skills survey of the UK renewable energy industry (ETA, 2003). The aim of this study was to provide data and analysis on the skills implications of the UK government’s renewable energy targets to 2020, as well as to anticipate the skills requirements and potential shortfalls. The study also aimed to assess whether skills shortages would present a barrier to the achievement of the government’s targets. It is worth considering some of the major findings of this report, which relies on information provided by forty-two industry organisations. Generally, in meeting the additional 10,000 MW of RE capacity required to meet the 10% target, demand is expected across most of the skills sectors. Requirements focus on engineering and project development skills, with a concentration of professional skills associated with the exploitation of new business opportunities, the development and application of technology, and consultancy services. Growth is expected across most categories of skills and is largely associated with growth in the wind industry. Key growth areas, to 2010, are expected to be in electrical, mechanical and civil engineering jobs, at both craft and technician level; engineering, environmental and planning jobs at professional level; and professional-level electrical power engineering and commercial jobs to cope with the demand for network connections.
7.1.1 Wind
Wind power development opens up employment opportunities in a variety of fields. It requires meteorologists and surveyors to select and rate appropriate sites, structural engineers to design the turbines and supervise their assembly, metalworkers to supply the rotors, and mechanics and computer operators to monitor the system and keep it in good working order. The manufacture of rotor blades and other components requires skilled labour input to ensure quality (Renner, 2000). In a survey of the labour requirements for constructing and operating a 37.5 MW wind farm it was found that the number of jobs created is 4.8/MW (REPP, 2001a. See Appendix F). This data was compiled from a survey of nineteen companies in the industry. The breakdown of these jobs by occupational category is depicted in Figure 7-1, with servicing being assessed over a ten-year period.
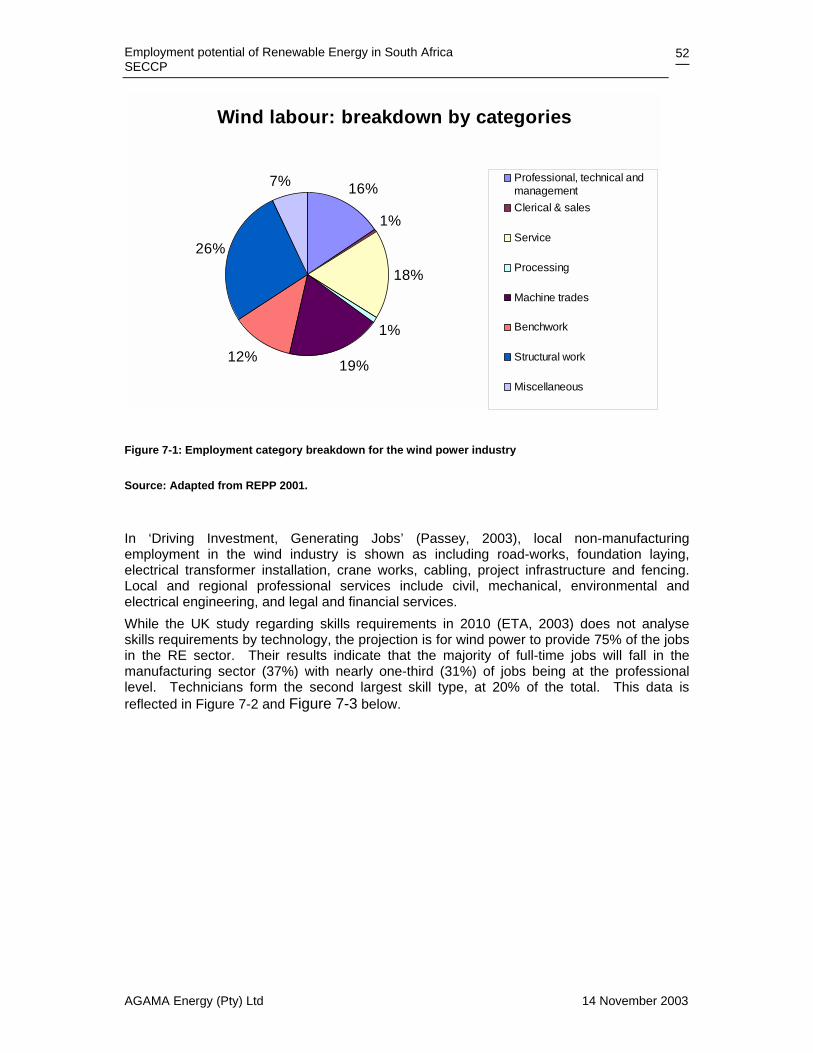
Employment potential of Renewable Energy in South Africa SECCP
AGAMA Energy (Pty) Ltd 14 November 2003
52
Wind labour: breakdown by categories
16%
1%
18%
1%
19%12%
26%
7% Professional, technical andmanagementClerical & sales
Service
Processing
Machine trades
Benchwork
Structural work
Miscellaneous
Figure 7-1: Employment category breakdown for the wind power industry
Source: Adapted from REPP 2001.
In ‘Driving Investment, Generating Jobs’ (Passey, 2003), local non-manufacturing employment in the wind industry is shown as including road-works, foundation laying, electrical transformer installation, crane works, cabling, project infrastructure and fencing. Local and regional professional services include civil, mechanical, environmental and electrical engineering, and legal and financial services. While the UK study regarding skills requirements in 2010 (ETA, 2003) does not analyse skills requirements by technology, the projection is for wind power to provide 75% of the jobs in the RE sector. Their results indicate that the majority of full-time jobs will fall in the manufacturing sector (37%) with nearly one-third (31%) of jobs being at the professional level. Technicians form the second largest skill type, at 20% of the total. This data is reflected in Figure 7-2 and Figure 7-3 below.

Employment potential of Renewable Energy in South Africa SECCP
AGAMA Energy (Pty) Ltd 14 November 2003
53
Jobs in 2010 by Sector
29%
5%
12%9%
37%
8%
Owners/operators/ProjectdevelopersEngineering - O&M
Engineering - C&I
Consultancy/R&D
Manufacturing
Other
Figure 7-2: Proportion of wind-related jobs in 2010, by Sector
Source: ETA 2003.
Jobs in 2010 by Occupation
15%
31%
20%
14%
10%
9% 1%
Managers
Professional
Technicians
Craftsmen
Semi-skilled
Commercial/admin
Trainees(graduates/apprentices)
Figure 7-3: Proportion of wind-related jobs in 2010, by Occupation
Source: ETA 2003
7.1.2 Solar PV
In a survey of the labour requirements for constructing, transporting, installing and servicing a 2-kWp solar PV array it was found that the number of job-years per installed megawatt is 35.5 (REPP, 2001a). This data was compiled from a survey of ten companies in the industry, and does not include economies of scale in the enlarged estimate. The breakdown of these jobs by occupational category is depicted in Figure 7-4, with servicing being assessed over a ten-year period.
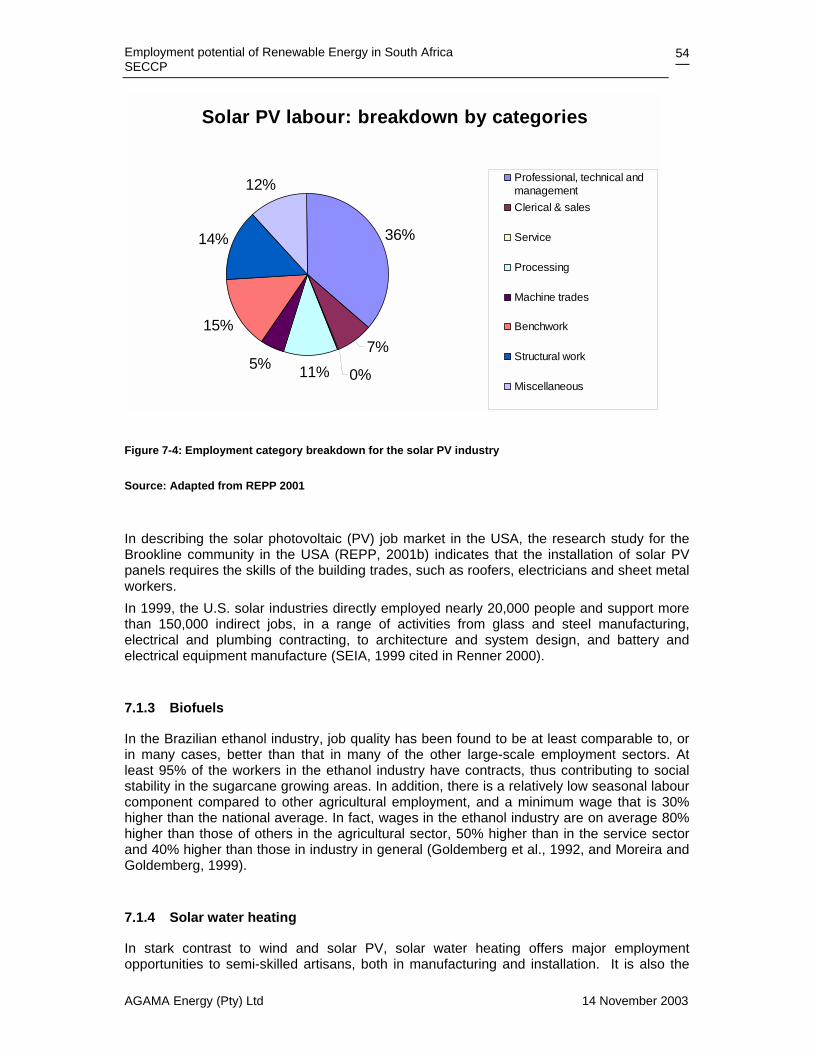
Employment potential of Renewable Energy in South Africa SECCP
AGAMA Energy (Pty) Ltd 14 November 2003
54
Solar PV labour: breakdown by categories
36%
7%
0%11%5%
15%
14%
12% Professional, technical andmanagementClerical & sales
Service
Processing
Machine trades
Benchwork
Structural work
Miscellaneous
Figure 7-4: Employment category breakdown for the solar PV industry
Source: Adapted from REPP 2001
In describing the solar photovoltaic (PV) job market in the USA, the research study for the Brookline community in the USA (REPP, 2001b) indicates that the installation of solar PV panels requires the skills of the building trades, such as roofers, electricians and sheet metal workers. In 1999, the U.S. solar industries directly employed nearly 20,000 people and support more than 150,000 indirect jobs, in a range of activities from glass and steel manufacturing, electrical and plumbing contracting, to architecture and system design, and battery and electrical equipment manufacture (SEIA, 1999 cited in Renner 2000).
7.1.3 Biofuels
In the Brazilian ethanol industry, job quality has been found to be at least comparable to, or in many cases, better than that in many of the other large-scale employment sectors. At least 95% of the workers in the ethanol industry have contracts, thus contributing to social stability in the sugarcane growing areas. In addition, there is a relatively low seasonal labour component compared to other agricultural employment, and a minimum wage that is 30% higher than the national average. In fact, wages in the ethanol industry are on average 80% higher than those of others in the agricultural sector, 50% higher than in the service sector and 40% higher than those in industry in general (Goldemberg et al., 1992, and Moreira and Goldemberg, 1999).
7.1.4 Solar water heating
In stark contrast to wind and solar PV, solar water heating offers major employment opportunities to semi-skilled artisans, both in manufacturing and installation. It is also the
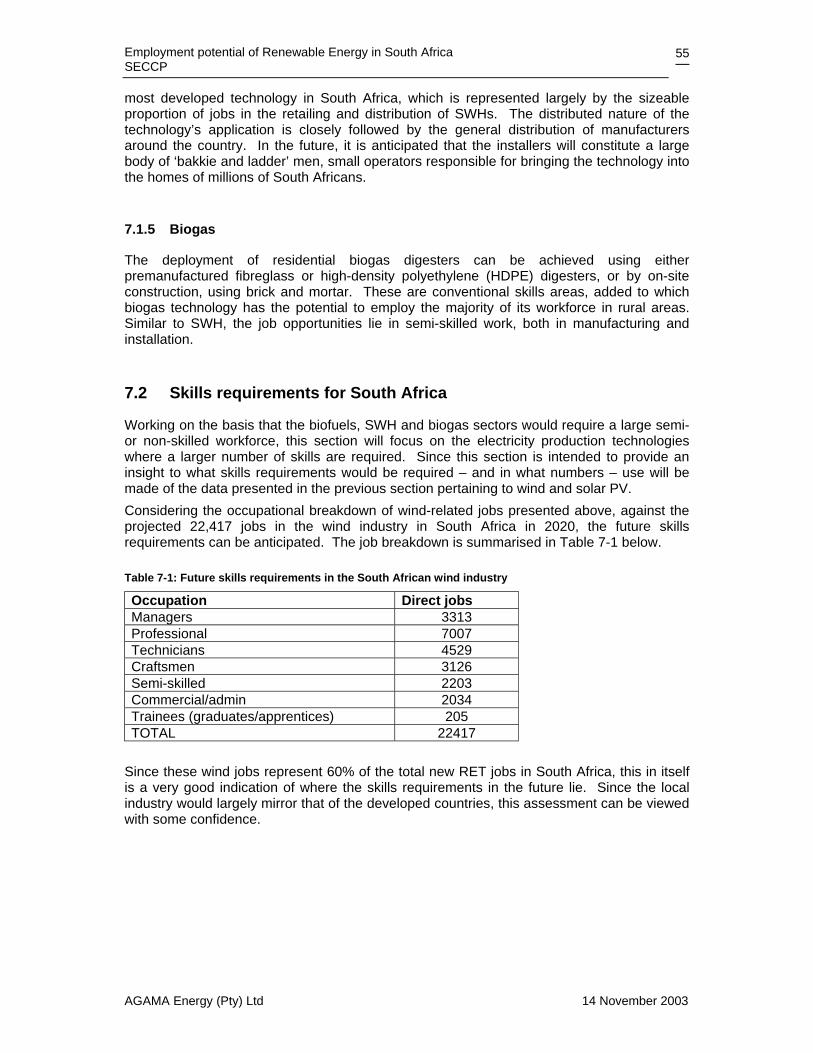
Employment potential of Renewable Energy in South Africa SECCP
AGAMA Energy (Pty) Ltd 14 November 2003
55
most developed technology in South Africa, which is represented largely by the sizeable proportion of jobs in the retailing and distribution of SWHs. The distributed nature of the technology’s application is closely followed by the general distribution of manufacturers around the country. In the future, it is anticipated that the installers will constitute a large body of ‘bakkie and ladder’ men, small operators responsible for bringing the technology into the homes of millions of South Africans.
7.1.5 Biogas
The deployment of residential biogas digesters can be achieved using either premanufactured fibreglass or high-density polyethylene (HDPE) digesters, or by on-site construction, using brick and mortar. These are conventional skills areas, added to which biogas technology has the potential to employ the majority of its workforce in rural areas. Similar to SWH, the job opportunities lie in semi-skilled work, both in manufacturing and installation.
7.2 Skills requirements for South Africa
Working on the basis that the biofuels, SWH and biogas sectors would require a large semi- or non-skilled workforce, this section will focus on the electricity production technologies where a larger number of skills are required. Since this section is intended to provide an insight to what skills requirements would be required – and in what numbers – use will be made of the data presented in the previous section pertaining to wind and solar PV. Considering the occupational breakdown of wind-related jobs presented above, against the projected 22,417 jobs in the wind industry in South Africa in 2020, the future skills requirements can be anticipated. The job breakdown is summarised in Table 7-1 below.
Table 7-1: Future skills requirements in the South African wind industry
Occupation Direct jobs Managers 3313 Professional 7007 Technicians 4529 Craftsmen 3126 Semi-skilled 2203 Commercial/admin 2034 Trainees (graduates/apprentices) 205 TOTAL 22417
Since these wind jobs represent 60% of the total new RET jobs in South Africa, this in itself is a very good indication of where the skills requirements in the future lie. Since the local industry would largely mirror that of the developed countries, this assessment can be viewed with some confidence.
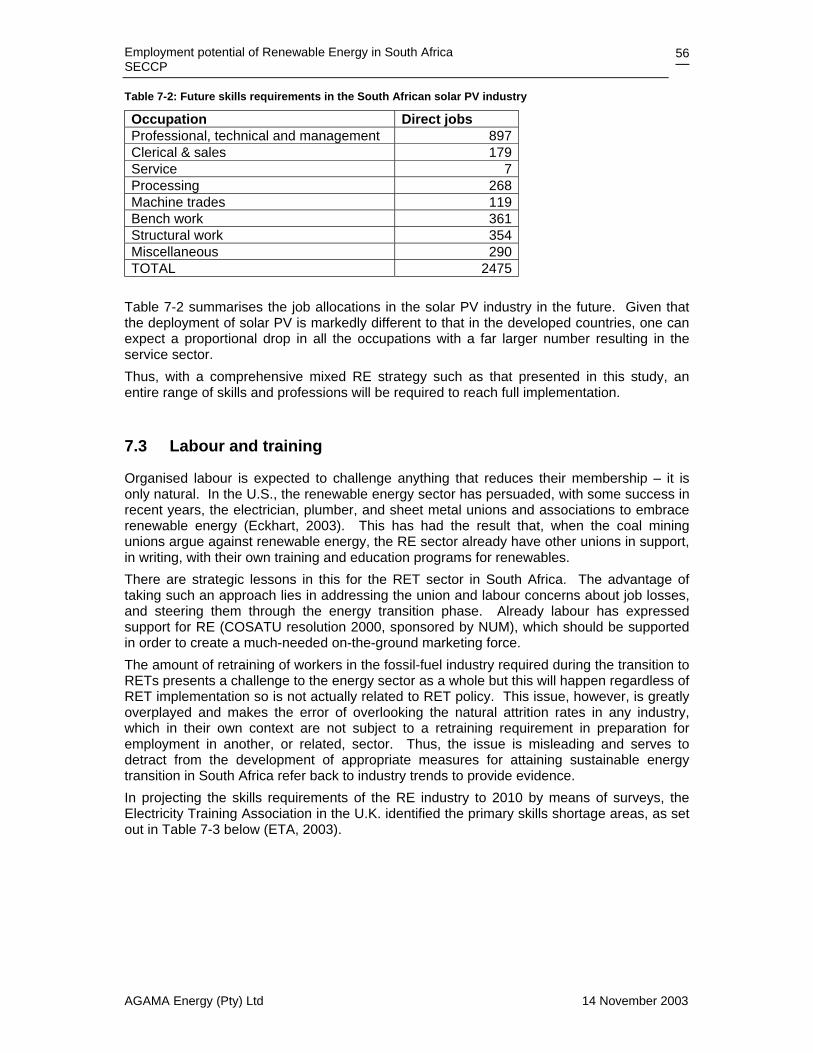
Employment potential of Renewable Energy in South Africa SECCP
AGAMA Energy (Pty) Ltd 14 November 2003
56
Table 7-2: Future skills requirements in the South African solar PV industry
Occupation Direct jobs Professional, technical and management 897 Clerical & sales 179 Service 7 Processing 268 Machine trades 119 Bench work 361 Structural work 354 Miscellaneous 290 TOTAL 2475
Table 7-2 summarises the job allocations in the solar PV industry in the future. Given that the deployment of solar PV is markedly different to that in the developed countries, one can expect a proportional drop in all the occupations with a far larger number resulting in the service sector. Thus, with a comprehensive mixed RE strategy such as that presented in this study, an entire range of skills and professions will be required to reach full implementation.
7.3 Labour and training
Organised labour is expected to challenge anything that reduces their membership – it is only natural. In the U.S., the renewable energy sector has persuaded, with some success in recent years, the electrician, plumber, and sheet metal unions and associations to embrace renewable energy (Eckhart, 2003). This has had the result that, when the coal mining unions argue against renewable energy, the RE sector already have other unions in support, in writing, with their own training and education programs for renewables. There are strategic lessons in this for the RET sector in South Africa. The advantage of taking such an approach lies in addressing the union and labour concerns about job losses, and steering them through the energy transition phase. Already labour has expressed support for RE (COSATU resolution 2000, sponsored by NUM), which should be supported in order to create a much-needed on-the-ground marketing force. The amount of retraining of workers in the fossil-fuel industry required during the transition to RETs presents a challenge to the energy sector as a whole but this will happen regardless of RET implementation so is not actually related to RET policy. This issue, however, is greatly overplayed and makes the error of overlooking the natural attrition rates in any industry, which in their own context are not subject to a retraining requirement in preparation for employment in another, or related, sector. Thus, the issue is misleading and serves to detract from the development of appropriate measures for attaining sustainable energy transition in South Africa refer back to industry trends to provide evidence. In projecting the skills requirements of the RE industry to 2010 by means of surveys, the Electricity Training Association in the U.K. identified the primary skills shortage areas, as set out in Table 7-3 below (ETA, 2003).
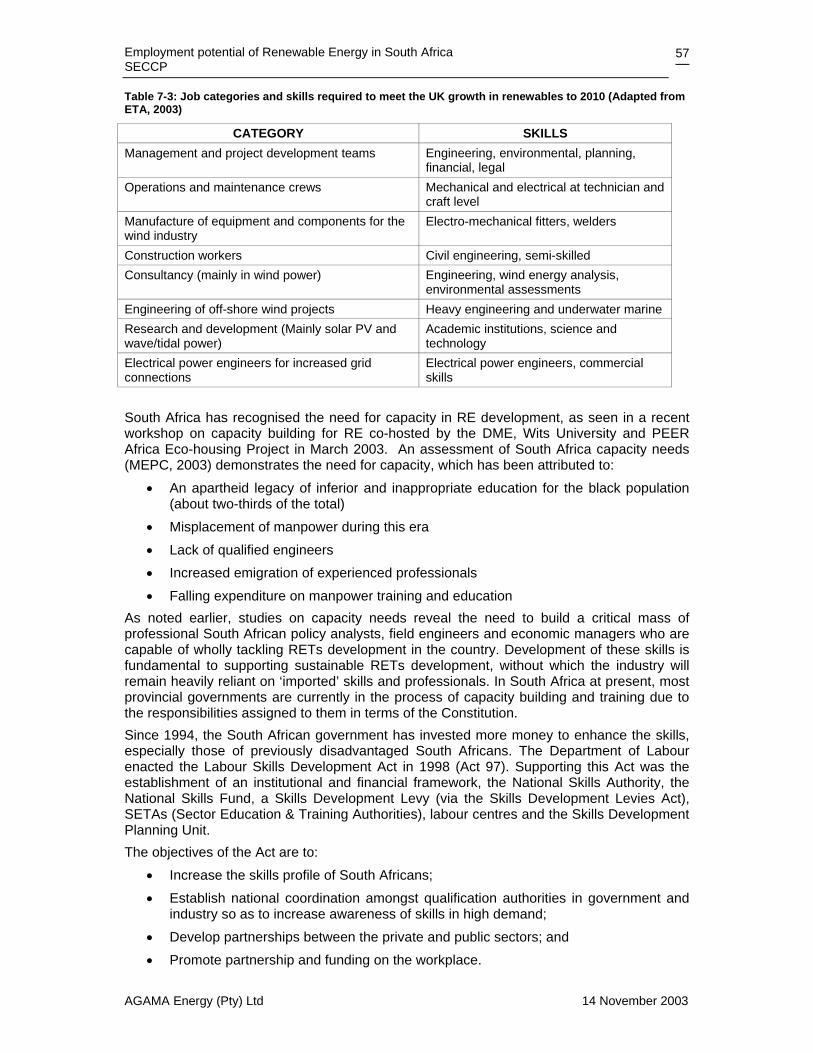
Employment potential of Renewable Energy in South Africa SECCP
AGAMA Energy (Pty) Ltd 14 November 2003
57
Table 7-3: Job categories and skills required to meet the UK growth in renewables to 2010 (Adapted from ETA, 2003)
CATEGORY SKILLS Management and project development teams Engineering, environmental, planning,
financial, legal Operations and maintenance crews Mechanical and electrical at technician and
craft level Manufacture of equipment and components for the wind industry
Electro-mechanical fitters, welders
Construction workers Civil engineering, semi-skilled Consultancy (mainly in wind power) Engineering, wind energy analysis,
environmental assessments Engineering of off-shore wind projects Heavy engineering and underwater marine Research and development (Mainly solar PV and wave/tidal power)
Academic institutions, science and technology
Electrical power engineers for increased grid connections
Electrical power engineers, commercial skills
South Africa has recognised the need for capacity in RE development, as seen in a recent workshop on capacity building for RE co-hosted by the DME, Wits University and PEER Africa Eco-housing Project in March 2003. An assessment of South Africa capacity needs (MEPC, 2003) demonstrates the need for capacity, which has been attributed to:
• An apartheid legacy of inferior and inappropriate education for the black population (about two-thirds of the total)
• Misplacement of manpower during this era • Lack of qualified engineers • Increased emigration of experienced professionals • Falling expenditure on manpower training and education
As noted earlier, studies on capacity needs reveal the need to build a critical mass of professional South African policy analysts, field engineers and economic managers who are capable of wholly tackling RETs development in the country. Development of these skills is fundamental to supporting sustainable RETs development, without which the industry will remain heavily reliant on ‘imported’ skills and professionals. In South Africa at present, most provincial governments are currently in the process of capacity building and training due to the responsibilities assigned to them in terms of the Constitution. Since 1994, the South African government has invested more money to enhance the skills, especially those of previously disadvantaged South Africans. The Department of Labour enacted the Labour Skills Development Act in 1998 (Act 97). Supporting this Act was the establishment of an institutional and financial framework, the National Skills Authority, the National Skills Fund, a Skills Development Levy (via the Skills Development Levies Act), SETAs (Sector Education & Training Authorities), labour centres and the Skills Development Planning Unit. The objectives of the Act are to:
• Increase the skills profile of South Africans; • Establish national coordination amongst qualification authorities in government and
industry so as to increase awareness of skills in high demand; • Develop partnerships between the private and public sectors; and • Promote partnership and funding on the workplace.

Employment potential of Renewable Energy in South Africa SECCP
AGAMA Energy (Pty) Ltd 14 November 2003
58
There are 25 SETAs in South Africa, with each classified according to economic sectors. The function and mandate of the SETAs is directly relevant to the needs in the RE sector, since they will
• Develop a sector skills plan to describe the trends in each sector, the skills that are in demand, and to identify priorities for skills development – and the information presented here will be invaluable;
• Implement the plan; • Develop and administer learnerships, similar to apprenticeships of the past; • Support the implementation of the National Qualifications Framework; and • Undertake quality assurance.
It is therefore imperative that the information in this report be carefully studied by the relevant SETAs, which includes the Construction Education and Training Authority (Ceta), the Energy SETA (Eseta) and the Manufacturing, Engineering and Related Seta (Merseta). These SETAs should develop a close involvement with the renewable energy sector. In the U.K., trade unions campaign for a clean and safe working environment for their members – but they also want to see a clean and healthy environment outside the place of work for their members and families. The unions are also strongly aware that employers that pollute the environment and waste resources risk prosecution and thus a loss of business that puts jobs at risk. As a result, trade unions in the U.K. have also pressed for better environmental standards and strategic thinking that integrates the need for job creation and environmental protection (ACE, 1998). Recognising the above issues and international trends, the labour and training sectors can provide two elements essential to the long-term health of the renewables industry: certified skills to meet manufacturing, installation and servicing needs, and incentivised on-the-ground workers who would then support increased retail sales of the products (REPP, 2001). In addition, they can press for increased monitoring of and support for environmentally supportive measures. In answering the question of retraining of ‘displaced’ workers in the fossil-fuel industry, it should be emphasized that there may be no net reduction in the numbers of total employees in the sector (see Section 6.6.3). A more pertinent question then is how do the new 36,400 jobs in the RET sector be filled? As has been shown, the majority of these jobs lie in the management and professional domains. It can be argued that South Africa is already graduating thousands of tertiary-level students every year, and the issue is of practical, experiential learning for these graduates. Within the context of South Africa’s education and skills environment, this need can only be met through highly active and involved SETAs.
Employment potential of Renewable Energy in South Africa SECCP
AGAMA Energy (Pty) Ltd 14 November 2003
59
8. Conclusions and recommendations • The study has clearly shown that the large-scale deployment of renewable energy
technologies will substantially increase the number of jobs in the energy sector. • Further, it has shown that job creation in renewable energy is only possible when
substantial national deployment targets are set, due to the attendant manufacturing, installation and O&M capacity that are initiated. The levels of employment also increase dramatically with the scale of the commitment to targets.
• Taken in isolation, the RE electricity generating technologies will create 36,400 new direct jobs when providing 15% of the total electricity mix in 2020, without taking jobs away from the coal-based electricity generation sector.
• Should the RE electricity generating technology deployment be of sufficient scale to replace any future coal-fired power requirements, further additional jobs will be created.
• In the transport sector, the development of a biodiesel and bioethanol program that replaces 15% of current ethanol (petrol) and diesel consumption would see the creation of 350,000 new, direct jobs.
• In the thermal energy sector, the targeted deployment of solar water heaters will result in the creation of at least 118,000 new, direct jobs.
• Each renewable energy sector will result in the creation of at least the same number of indirect jobs as direct jobs, with a total of around 700,000 indirect jobs across all the RE sectors.
• A deployment strategy is urgently required to meet the imminent over-demand situation. At the same time, the capacity development associated with this strategy will provide a much-needed foundation for the more ambitious targeting of deployment that will have to be developed to meet the closure, around 2020, of existing thermal power stations.
• A wide range of skills is required to implement all the renewable electricity technologies. The majority of jobs in wind generation will lie in the professional and management sector, while those for solar PV will lie in the service technician level. Manufacturing will require a large proportion of artisans.
• The large majority of jobs in the biofuels sector will be unskilled or semi-skilled, and will be based in rural areas with small-scale farmers being responsible for the planting and harvesting of appropriate energy crops. This sector presents an opportunity for the large-scale employment of marginalised communities and new farmers such as land claimants to be gainfully employed.
• The active support of SETAs will be required to develop the necessary capacity for increased deployment of the RETs. The focus of such training for RE technologies will ensure that the skills that are developed are more readily transferable across other sectors than the more unattractive mining jobs.
Based on the findings of this report, the following recommendations are made: • The cost of developing each of the technologies, and the human resources to
manufacture, install and service them, should be fully assessed if the full social benefits that are possible through R E deployment based on local manufacture are to be realised.
• A comprehensive implementation plan based on these results, and technology costs, should be developed.
• The appropriate SETAs should be fully appraised of these findings, in order to prepare their support for a nation-wide RET deployment strategy.
Employment potential of Renewable Energy in South Africa SECCP
AGAMA Energy (Pty) Ltd 14 November 2003
60
References ACE (Association for the Conservation of Energy) 1998. Green Job Creation in the U.K. Compiled by Association for the Conservation of Energy, Friends of the Earth, GMB and UNISON. ACRE (Australian CRC for Renewable Energy) 1998. http://acre.murdoch.edu.au/refiles/waste/text/potential.htm. View 24 October 2003. ADBN (Agricultural Development Bank of Nepal) 2002. Renewable Energy Program of ADBN. Head Office, Kathmandu, July 2002. Afrane-Okese Y, Mohlakoana N, Dos Santos RR (2001). Operational challenges of large scale off-grid PV rural electrification programme in South Africa. ISES 2001 Solar World Congress. Austin G (2002a). Development and application of a biogas (human excreta) digester/genset hybrid system and biogas application (school,household). DME, 2002. Contract EO0101. Austin G (2002b). Biogas Energy and Sanitation Provision in South Africa. ESI Africa, Issue 4, 2002. AusWEA (Australian Wind Energy Association) 2003. Submission to the Mandatory Renewable Energy Target Review, May 2003. Basson J (2003). AFRICON. Personal communication, 2003. Benandallah S (2003). Helimax Energie. Personal communication, 2003. Bhaktavatsalam V, 2001. Renewable Energy in the New Millenium: the Indian Scenario. Indian Renewable Energy Development Agency (IREDA), New Delhi. BP 2003. Statistical Review of World Energy. http://www.bp.com/centres/energy/renewables/solar.asp. Viewed 25 October 2003. CALPIRG Charitable Trust, 2002. Renewable Work: Job Growth from Renewable Energy Development in California. June 2002. Carpentieri A.E., Larson E.D., Woods J. (1993). Future biomass-based electricity supply in Brazil. Biomass and Bioenergy 4(3): 149-179 cited in FAO Environment and Energy Paper No. 13, “Bioenergy for development: Technical and environmental dimensions”. Food and Agriculture Organisation of the United Nations, Rome, Italy (1994). ISSN 1011-5374. Carvalho LC and Szwark A (2001). Understanding the Impact of Externalities, Case Studies. Brazil International Development Seminar on Fuel Ethanol. December 14, 2001. Washington, D.C, USA. De Beer, S 2003. Personal communication, 15 September 2003. DME (Department of Minerals and Energy) 1995. Energy for Development Business Plan. DME (Department of Minerals and Energy) 1998. White Paper on Energy Policy for the Republic of South Africa. DME (Department of Minerals and Energy) 2001. Bulk Renewable Energy Independent Power Producers in South Africa. Prepared for the DME and the Danish Cooperation for Environment and Development (DANCED), Denmark. DME (Department of Minerals and Energy) 2002a. Capacity Building in Energy Efficiency and Renewable Energy: Baseline Study on Solar Energy in South Africa. Final Report. DME (Department of Minerals and Energy) 2002b.Draft White Paper on Renewable Energy and Clean Energy Development. http://www.dme.gov.za/energy/pdf/ White_Paper_on_Renewable_Energy.pdf. Viewed on 22 September 2003Last updated August 2002.
Employment potential of Renewable Energy in South Africa SECCP
AGAMA Energy (Pty) Ltd 14 November 2003
61
DME (Department of Minerals and Energy) 2003a. Capacity Building in Energy Efficiency and Renewable Energy: Review of Wind Energy Resource Studies in South Africa. Final Report. DME (Department of Minerals and Energy) 2003b. Capacity Building in Energy Efficiency and Renewable Energy: Baseline Study on Wind Energy in South Africa. Final Report. DME (Department of Minerals and Energy) 2003c. www.dme.gov.za. Table 59: Labour statistics – main mining commodity – coal. Viewed 19 September 2003. DME (Department of Minerals and Energy) 2003d. Green Power: Business Opportunities in South Africa for Renewable Energy Independent Power Producers. 2003. DOE (US Department of Energy: Energy Efficiency and Renewable Energy) 2003. Dollars from Sense: The Economic Benefits of Renewable Energy. http://www.eere.energy.gov/power/dollarsfromsense.html. Viewed 18 August 2003. DST (Department of Science and Technology) 2003. Investigation into the Role of Biodiesel in South Africa. Prepared by Transportek of the CSIR for the DST. 2003. Eberhard AA & Williams A, 1988. Renewable energy resources and technology development in South Africa. Cape Town, Elan Press. EC (European Commission) 1997. Energy for the future: Renewable Sources of Energy. White Paper for a Community Strategy and Action Plan. Brussels, COM(97)599 final (November 1997). ECONorthwest 2001. The Economic Benefits of Renewable Energy and Cost-effective Energy Efficiency. Prepared for the Alaska Coalition, Oregon, 2001. ECONorthwest 2002. Economic Impacts of Wind Power in Kittikas County. Final Report. Prepared for the Phoenix Economic Development Group. October 2002. Eckhart, M 2003. Personal communication, 1 September 2003. See also www.AmericanRenewables.org. EDRC (Energy and Development Research Centre) 2003. Policies and measures for renewable energy and energy efficiency in South Africa. University of Cape Town. EHN 2003. Wind energy development and industrial plan for South Africa. Microsoft PowerPoint presentation, EHN. EIA (Energy Information Administration) 2002a. 2000 Annual Solar Thermal and Photovoltaic Manufacturing Activities, Table 20. www.eia.doe.gov/cneaf/ solar.renewables/page/solar/table20.html, viewed 9 September 2003. EIA (Energy Information Administration) 2002b. 2000 Annual Solar Thermal and Photovoltaic Manufacturing Activities, Table 10. www.eia.doe.gov/cneaf/ solar.renewables/page/solar/table10.html, viewed 9 September 2003. ELA (Earthlife Africa) 2003. Nuclear Energy Costs the Earth Campaign Briefing Paper: Investing in Renewable Energy – A Real Alternative to Pursuing Nuclear Energy. Cape Town. Engineering News (2003). SA is set to become a biomass-pellet exporter. http://www.engineeringnews.co.za/components/print.asp?id=40522 ESAA (Electricity Supply Association of Australia) 1999. Electricity Prices in Australia, 1999. Eskom 1989. Statistical Yearbook 1989. Johannesburg, 1989. Eskom 2002. Eskom Annual Report 2002. Eskom 2003a. Coal in SA Rev 1. Eskom Generation Communication, April 2003. Eskom 2003b. www.eskom.co.za. Viewed on 17 September 2003. Eskom 2003c. Restructuring of the ESI. Eskom Generation Communication, April 2003.
Employment potential of Renewable Energy in South Africa SECCP
AGAMA Energy (Pty) Ltd 14 November 2003
62
ETA (Electricity Training Association) Employment and Skills Survey 2003. Exploring the Skills Requirements of the UK Renewable Power Industry to 2010. Sector Skills Development Agency. EUFORES (2000) http://www.eufores.org/FinalRep.pdf. EWEA (European Wind Energy Association) 1999. Wind Force 10: A Blueprint to Achieve 10% of the World’s Electricity from Wind Power by 2020. EWEA. FAO (Food and Agriculture Organisation) 1996. World Agriculture: Towards 2010, ed. N. Alexandratos, FAO/John Wiley & Sons, UK. Forum for Energy and Development, and Greenpeace International. 1999. Godsmark R. (2003) Forestry South Africa. Personal communication. Goldemberg J., Monaco L.C., Macedo I.C., (1992) The Brazilian Fuel-Alcohol Program, in eds., Johansson B.J., Kelly H., Reddy A.K.N., Williams R.H., Renewables for Fuels and Electricity, Island Press, Washington, D.C. pp. 841-864. Grassi G (1996). Potential Employment Impacts of Bioenergy Activity on Employment. Proceedings of the 9th European Bioenergy Conference, Volume I, pp. 419 – 423. Eds Chartier, P. et al. Elsevier, Oxford (1996) Greenpeace Australia Pacific (2003). http://www.greenpeace.org.au/climate/government/mret.html, viewed 28 October 2003. Heavner B and Churchill S 2002. Renewables Work: Job Growth from Renewable Energy Development in California. CALPIRG Charitable Trust, June 2002. Hoffmann B 2003. Forest Oil. Partnerships in Energy Development in the Western Cape: Opportunities in a New Natural Gas Industry. Presented as part of the Public Participation Process, 2003. IEA (International Energy Agency) 2002. Renewable Energy … Into the Mainstream. The Netherlands, October 2002. IEA (International Energy Agency) 2003. Solar Heating and Cooling Program. Task 24: Active Solar Procurement. IPTS (Institute for Prospective Technological Studies) 1998. The Socio-Economic Impact of Renewable Energy Projects in Southern Mediterranean countries. Executive Summary, EC Joint Research Centre. IRRD (India Renewable Resources Development) Project 2001. http://www.pi.energy.gov/library/EWSLindia-rrd.pdf. Joffe H 2003. Clarity needed on what public works projects can do for jobs. Business Day, 30 September 2003. Lovins AB, Datta EK, Feiler T, Rabago KR, Swisher JN, Lehmann A, Wicker K 2002. Small is Profitable: The Hidden Economic Benefits of making Electrical Resources the Right Size. Rocky Mountain Institute. 2002. Mackenzie-Hoy, 2003. Engineering News. Personal Communication, 2003. Martinez JCC, 1998, Quantification of the Socio-Economic Effects of Renewable Energy Projects in Southern Mediterranean countries: and Input-Output Evaluation. Prepared for IPTS (Institute for Prospective Technological Studies) European Commission. March 1998. Moreira, J.R. and Goldemberg, J. (1999). The Alcohol Program, Energy Policy, Vol. 27, 1999, pp. 229-245. Elsevier. NER (National Electricity Regulator) 2000. Electricity supply statistics for South Africa 2000. Pretoria, NER.
Employment potential of Renewable Energy in South Africa SECCP
AGAMA Energy (Pty) Ltd 14 November 2003
63
New Energy 2003. China New Energy: Landfill Technology. http://www.newenergy.org.cn/english/biomass/science/landfill.htm. Viewed 18 October 2003. NFFO (Non-Fossil Fuel Obligation) 2003. http://www.british-energy.com/environment/factfiles/nonffobligation.html. Viewed 23 October 2003. Odgaard O. (2002). Renewable Energy in Denmark. Danish Energy Agency. 2002. Passey R. (2003). Driving Investment, Generating Jobs: Wind Energy as a Powerhouse for Rural and Regional Development in Australia. A report for the Australian Wind Energy Association. March 2003. Perez EM (2001). Energias Renovables, Sustentabilidad y Creacion de Enpleo: Una Economia Impulssionada por el Sol. ISBN: 84-8319 – 115 – 6. 2001. Pilkington Solar International GmbH (1996). Status Report on Solar Trough Power Plants. Sponsored by the German Federal Minister for Education, Science, Research and Technology. Contract No. 0329660. Cologne, Germany. January 1996. PBMR (Pebble Bed Modular Reactor) 2002. Draft EIA for the PBMR. AfroSearch on behalf of PBMR Consortium, 2002. PCF (Prototype Carbon Fund) 2003. Durban, South Africa Landfill Gas to Electricity. Project Design Document. Revised Draft, July 2003. Renner, M 2000. Working for the environment: A growing source of jobs. WORLDWATCH PAPER 152, September 2000. Renner, M 2001. Going to Work for Wind Power. WORLD WATCH, January/February 2001, 22 – 30. REPP (Renewable Energy Policy Project) 2001a. The work that goes into Renewable Energy. Singh V with BBC Research & Consulting and Fehrs J. REPP, 2001 REPP (Renewable Energy Policy Project) 2001b. Job creation from Solar Energy in Brookline. Based on the report “The work that goes into Renewable Energy” by Singh V. REPP, 2001 REPP (Renewable Energy Policy Project) 2002. Comments submitted to the Nevada Public Service Commission: Revised Regulations of the Public Utilities Commission of Nevada. LCB file: No. R144-01. Submitted by the Nevada AFL-CIO, with the assistance of the Renewable Energy Policy Project. April 29, 2002. Rosillo-Calle, F., Bezzon G., (1999). Production and Use of Industrial Charcoal, in: Industrial Uses of Biomass Energy - The Example of Brazil, F. Rosillo-Calle, S. Bajay & H Rothman (eds). Taylor & Francis, London. SAEPDD (South African Energy Policy Discussion Document) 1995. Viewed at http://www.polity.org.za/html/govdocs/green_papers/energy1.html on 13 September 2003. SAPIA (2003) South Africa Petroleum Industry Association www.mbendi.co.za/sapia/rsacons.htm SASA (2003). South African Sugar Industry Directory. SASA. www.sasa.org.za SESSA (Sustainable Energy Society of South Africa) 2002. Job creation (direct & indirect) in renewable energy technologies in South Africa. Received electronically from Earthlife Africa. By the time of publication SESSA had not indicated what the basis for the estimates is. Shutt J, Henderson R and Kumi-Ampofo F 2003. Responding to a regional economic crisis: An impact and Regeneration assessment of the Selby Coalfield closure on the Yorkshire and Humber region. Paper delivered in “Reinventing Regions in a Global Context”, 12 – 15 April 2003. Pisa, Italy. Scrase, J. I., (1997). Biomass Energy and Employment in the European Union, Biomass Users Network, Kings College London (Unpublished document).
Employment potential of Renewable Energy in South Africa SECCP
AGAMA Energy (Pty) Ltd 14 November 2003
64
Smit I (2003). Case Study: Eskom’s First Experiences with Wind Energy in the Western Cape. Presented at the Sustainable Energy in Africa conference, 15 – 17 October 2003. Somerset West, South Africa. SDI (Solar Development International) 2003. Solar Energy: Local Manufacturing and Sustainable Development. http://www.sustdev.org/energy/articles/energy/edition1/01.097.pdf. Viewed 5 September 2003. SSN (SouthSouthNorth) 2003. The recovery and use of landfill gas at Bellville South landfill site. Draft Version 7, 2 June 2003. Statistics SA (1995). Census of electricity, gas and steam. 20 December 1996. Statistics SA (2002). Generation and consumption of electricity. December 2003. Stinnes WW. Personal communication, 22 September 2003. See also www.greentower.net. Surridge AD (2003). South Africa Energy-Economy. Presented at the Sustainable Energy in Africa conference, 15 – 17 October 2003. Somerset West. Tait B (2003). Manager, Alternative Energy, Sasol Technology. Personal communication. TERIIN (Tata Energy Research Institute of India) 2003. Estimated potential and installed capacity of major renewable energy technologies in India. http://www.teriin.org/renew/estpot.htm. Viewed 29 October 2003. Thom, C. (1994) A socio-technical study to develop biogas as an energy source for rural South Africa. DME, March 1994. Thorne, S. (2003). Technical Director, SouthSouthNorth Trust. Personal communication. Tomlinson, D. (2003) Illovo Sugar. Personal communication. UKBCSE (United Kingdom Business Council for Sustainable Energy) 2002. http://www.reeep.org/media/downloadable_documents/BCSE - WSSD Energy review.pdf. Viewed 28 October 2003. Van Heerden L. Personal communication, 22 September 2003. See also http://www.sabregen.co.za/STE/proj_ste.htm. Western Power (2003). Fact Sheet #5: Collie Power Station Expansion Concept. Australia. Wienese A. (2003) Sugar Milling Research Institute. Personal communication. Williams A (2003). Personal communication, 2003. Winkler H. Additional information from the EDRC (2003) supplied via personal communication. September 2003. Woods, J. (2000). Integrating Sweet Sorghum and Sugarcane for Bioenergy: Modelling the Potential for Electricity and Ethanol Production in SE Zimbabwe. King's College London. PhD thesis. WWI (Worldwatch Institute) 2003. Vital signs fact of the week. 29 October 2003. Zhou, JP (2001). China‘s new and renewable energy situation. Chongqing Energy Conservation Technical Service Centre, China.

Employment potential of Renewable Energy in South Africa SECCP
AGAMA Energy (Pty) Ltd 14 November 2003
65
Appendix A: Data template for electricity technologies FUEL MANUFACTURE INSTALLATION O&M OTHER TOTAL
WIND
SOLAR PV
SOLAR THERMAL
BIOMASS
LANDFILL
COAL
GAS
NUCLEAR
PBMR
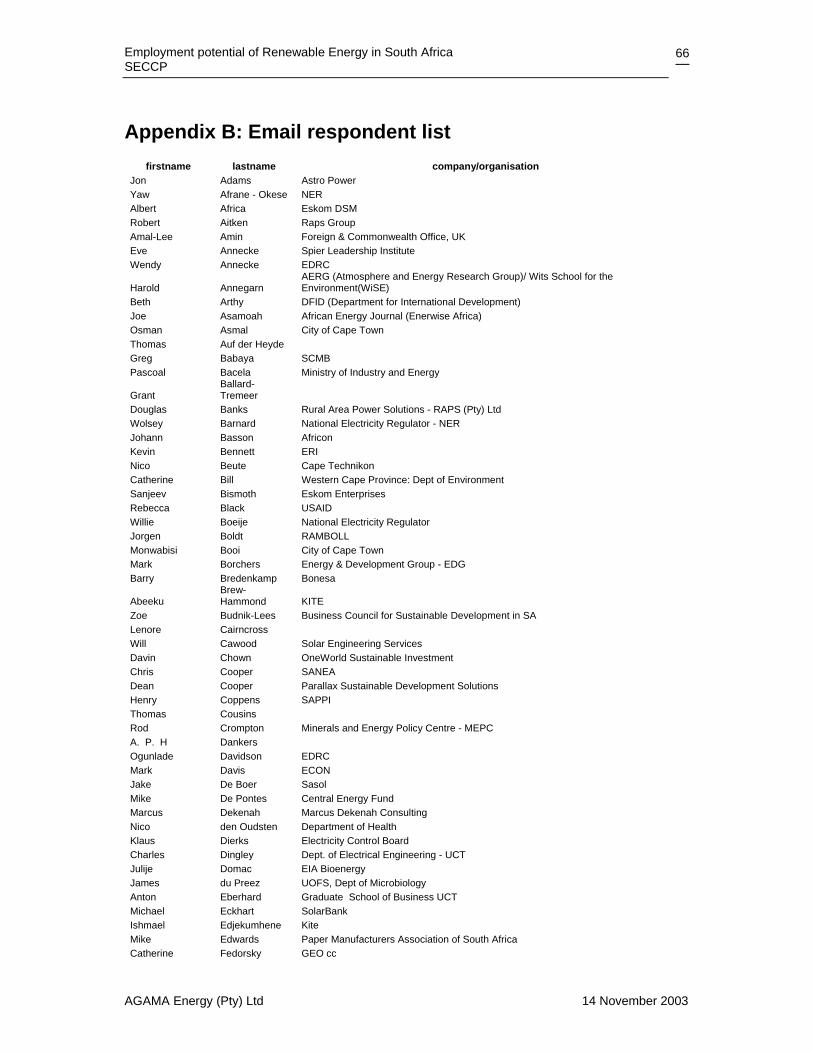
Employment potential of Renewable Energy in South Africa SECCP
AGAMA Energy (Pty) Ltd 14 November 2003
66
Appendix B: Email respondent list firstname lastname company/organisation
Jon Adams Astro Power Yaw Afrane - Okese NER Albert Africa Eskom DSM Robert Aitken Raps Group Amal-Lee Amin Foreign & Commonwealth Office, UK Eve Annecke Spier Leadership Institute Wendy Annecke EDRC
Harold Annegarn AERG (Atmosphere and Energy Research Group)/ Wits School for the Environment(WiSE)
Beth Arthy DFID (Department for International Development) Joe Asamoah African Energy Journal (Enerwise Africa) Osman Asmal City of Cape Town Thomas Auf der Heyde Greg Babaya SCMB Pascoal Bacela Ministry of Industry and Energy
Grant Ballard-Tremeer
Douglas Banks Rural Area Power Solutions - RAPS (Pty) Ltd Wolsey Barnard National Electricity Regulator - NER Johann Basson Africon Kevin Bennett ERI Nico Beute Cape Technikon Catherine Bill Western Cape Province: Dept of Environment Sanjeev Bismoth Eskom Enterprises Rebecca Black USAID Willie Boeije National Electricity Regulator Jorgen Boldt RAMBOLL Monwabisi Booi City of Cape Town Mark Borchers Energy & Development Group - EDG Barry Bredenkamp Bonesa
Abeeku Brew-Hammond KITE
Zoe Budnik-Lees Business Council for Sustainable Development in SA Lenore Cairncross Will Cawood Solar Engineering Services Davin Chown OneWorld Sustainable Investment Chris Cooper SANEA Dean Cooper Parallax Sustainable Development Solutions Henry Coppens SAPPI Thomas Cousins Rod Crompton Minerals and Energy Policy Centre - MEPC A. P. H Dankers Ogunlade Davidson EDRC Mark Davis ECON Jake De Boer Sasol Mike De Pontes Central Energy Fund Marcus Dekenah Marcus Dekenah Consulting Nico den Oudsten Department of Health Klaus Dierks Electricity Control Board Charles Dingley Dept. of Electrical Engineering - UCT Julije Domac EIA Bioenergy James du Preez UOFS, Dept of Microbiology Anton Eberhard Graduate School of Business UCT Michael Eckhart SolarBank Ishmael Edjekumhene Kite Mike Edwards Paper Manufacturers Association of South Africa Catherine Fedorsky GEO cc
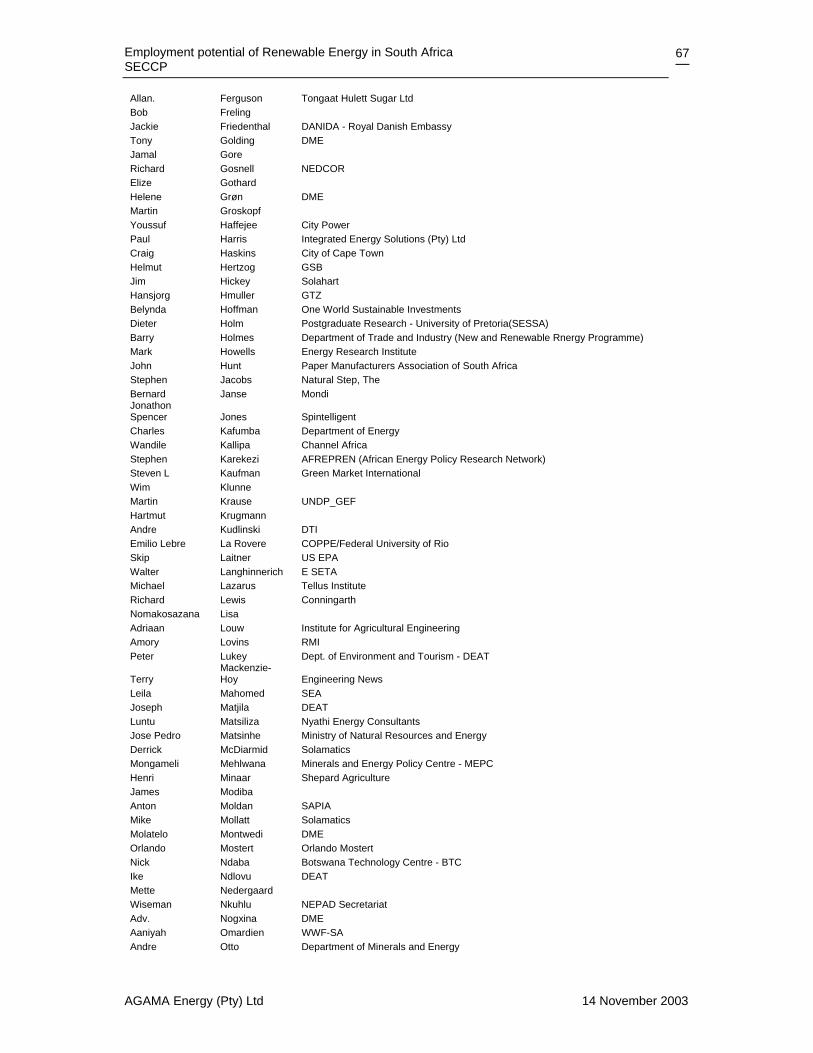
Employment potential of Renewable Energy in South Africa SECCP
AGAMA Energy (Pty) Ltd 14 November 2003
67
Allan. Ferguson Tongaat Hulett Sugar Ltd Bob Freling Jackie Friedenthal DANIDA - Royal Danish Embassy Tony Golding DME Jamal Gore Richard Gosnell NEDCOR Elize Gothard Helene Grøn DME Martin Groskopf Youssuf Haffejee City Power Paul Harris Integrated Energy Solutions (Pty) Ltd Craig Haskins City of Cape Town Helmut Hertzog GSB Jim Hickey Solahart Hansjorg Hmuller GTZ Belynda Hoffman One World Sustainable Investments Dieter Holm Postgraduate Research - University of Pretoria(SESSA) Barry Holmes Department of Trade and Industry (New and Renewable Rnergy Programme) Mark Howells Energy Research Institute John Hunt Paper Manufacturers Association of South Africa Stephen Jacobs Natural Step, The Bernard Janse Mondi Jonathon Spencer Jones Spintelligent Charles Kafumba Department of Energy Wandile Kallipa Channel Africa Stephen Karekezi AFREPREN (African Energy Policy Research Network) Steven L Kaufman Green Market International Wim Klunne Martin Krause UNDP_GEF Hartmut Krugmann Andre Kudlinski DTI Emilio Lebre La Rovere COPPE/Federal University of Rio Skip Laitner US EPA Walter Langhinnerich E SETA Michael Lazarus Tellus Institute Richard Lewis Conningarth Nomakosazana Lisa Adriaan Louw Institute for Agricultural Engineering Amory Lovins RMI Peter Lukey Dept. of Environment and Tourism - DEAT
Terry Mackenzie-Hoy Engineering News
Leila Mahomed SEA Joseph Matjila DEAT Luntu Matsiliza Nyathi Energy Consultants Jose Pedro Matsinhe Ministry of Natural Resources and Energy Derrick McDiarmid Solamatics Mongameli Mehlwana Minerals and Energy Policy Centre - MEPC Henri Minaar Shepard Agriculture James Modiba Anton Moldan SAPIA Mike Mollatt Solamatics Molatelo Montwedi DME Orlando Mostert Orlando Mostert Nick Ndaba Botswana Technology Centre - BTC Ike Ndlovu DEAT Mette Nedergaard Wiseman Nkuhlu NEPAD Secretariat Adv. Nogxina DME Aaniyah Omardien WWF-SA Andre Otto Department of Minerals and Energy
Employment potential of Renewable Energy in South Africa SECCP
AGAMA Energy (Pty) Ltd 14 November 2003
68
Niels Pedersen COWI Laurine Platzky Guy Preston National Water Conservation Campaign - NWCC Peter Prince Tongaat Hulett Sugar Ltd BA Prior Stellenbosch University, Dept of Microbiology Noma Qase Rural Area Power Solution(RAPS) John Richards SAFM SABC Radio Station Wouter Roggen City of Cape Town Hesphina Rukato NEPAD Secretariat Jason Schaffler IIEC Africa Lee Schipper Sustainable Transport Centre Axel Scholle Emcon Bernard Scott Eskom Enterprise Richard Sherman SA Climate Change Network Rob Short Development Bank of SA - DBSA King Sibande Department of Agriculture
Randall Spalding-Fecher Energy & Development Research Centre - EDRC
Jonathan Spencer Jones Scarborough Publications International (Pty) Ltd (ESI Africa) Grove Steyn The Knowledge Bridge Geoff Stiles CBLA Project Office Mark Swilling Spier Institute Steve Szewczuk CSIR Arthur Tassel African Energy Wolfgang Thomas WESGRO Steve Thorne South South North Ralf Tobich Emcon Denis Tomlinson Illovo (LAMNET, CARENSA) Hilton Trollip DHT Sandile Tyatya Department of Minerals and Energy Trevor Van der Vyver SESSA WH van Zyl Stellenbosch University. Dept of Microbiology Reinhold Viljoen GAIATEK Claire Volkwyn ESI Africa Harro von Blottnitz Department of Chemical Engineering Detlof von Oertzen VO Consulting Marlett Wentzel SESSA Marius Willemse Raps Group Jurie Willemse Rural Area Power Solutions - RAPS (Pty) Ltd Antony Williams UCT Harald Winkler Energy & Development Research Centre - EDRC Grzegorz Wisnieswski Richard Worthington Earthlife Brett Dawson GSB Nthabi Mohlakoana RAPS Glynn Morris AGAMA Energy (Pty) Ltd Sibusiso Mimi Earthlife Africa Herman Oelsner Oelsner Group Rangan Banerjee Indian Institute of Technology Gary Harper Windspeed Africa Clive Harms Charles Marais Windspeed Africa Andries Van Der Linde Louis de Lange Ruth Modipa Green Network Ntseki Ntseki Setjhaba Environmental Trust Busisiwe Mbokazi EJNF Paul Warmeant Sustainable Development Strategy Karen Jordi Permacore
Charmaine Van Den Heever NAMREC
Annie Sugrue EcoCity Trust

Employment potential of Renewable Energy in South Africa SECCP
AGAMA Energy (Pty) Ltd 14 November 2003
69
Jeffrey Ndumo NUMSA Elias Mkhwanzi EJNF Paris Mashego NUM Sibusiso Mimi Earthlife Africa Cape Town Ebrahim Hassen NALEDI Ivan Groenhof SAWEA Leon Johannes SAMWU Erika Schutze African Wind Energy Association
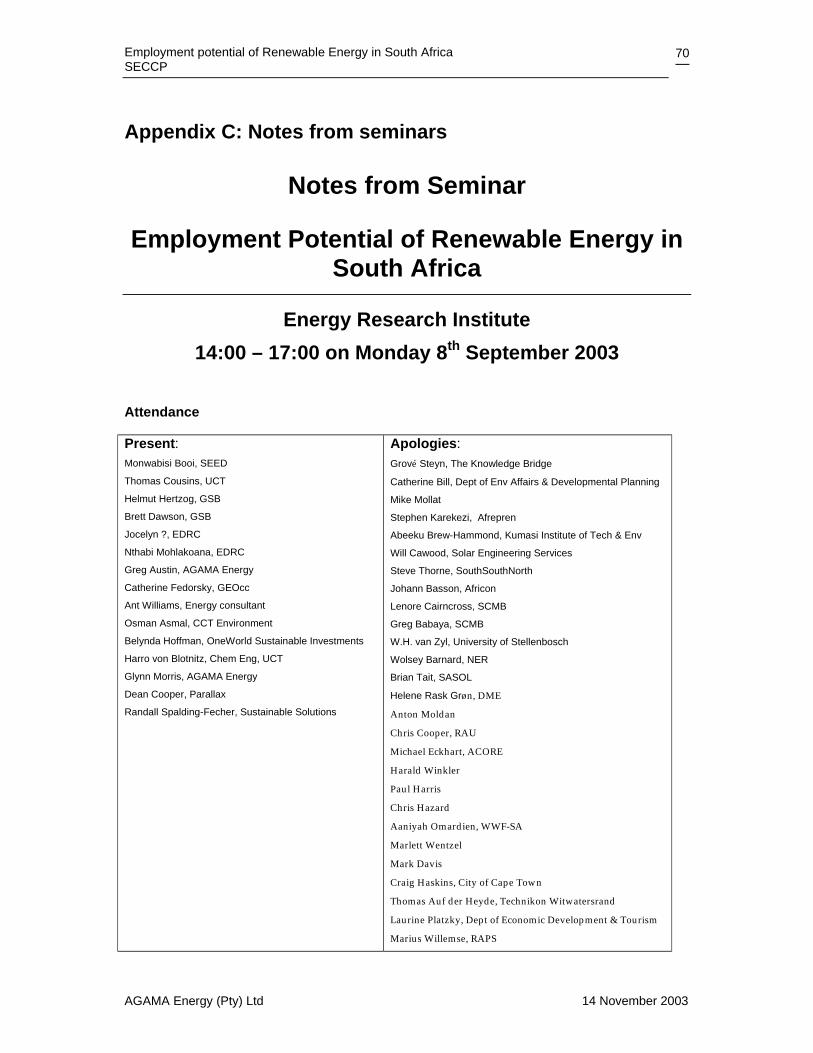
Employment potential of Renewable Energy in South Africa SECCP
AGAMA Energy (Pty) Ltd 14 November 2003
70
Appendix C: Notes from seminars
Notes from Seminar
Employment Potential of Renewable Energy in South Africa
Energy Research Institute 14:00 – 17:00 on Monday 8th September 2003
Attendance
Present: Monwabisi Booi, SEED
Thomas Cousins, UCT
Helmut Hertzog, GSB
Brett Dawson, GSB
Jocelyn ?, EDRC
Nthabi Mohlakoana, EDRC
Greg Austin, AGAMA Energy
Catherine Fedorsky, GEOcc
Ant Williams, Energy consultant
Osman Asmal, CCT Environment
Belynda Hoffman, OneWorld Sustainable Investments
Harro von Blotnitz, Chem Eng, UCT
Glynn Morris, AGAMA Energy
Dean Cooper, Parallax
Randall Spalding-Fecher, Sustainable Solutions
Apologies: Grové Steyn, The Knowledge Bridge
Catherine Bill, Dept of Env Affairs & Developmental Planning
Mike Mollat
Stephen Karekezi, Afrepren
Abeeku Brew-Hammond, Kumasi Institute of Tech & Env
Will Cawood, Solar Engineering Services
Steve Thorne, SouthSouthNorth
Johann Basson, Africon
Lenore Cairncross, SCMB
Greg Babaya, SCMB
W.H. van Zyl, University of Stellenbosch
Wolsey Barnard, NER
Brian Tait, SASOL
Helene Rask Grøn, DME
Anton Moldan
Chris Cooper, RAU
Michael Eckhart, ACORE
Harald Winkler
Paul Harris
Chris Hazard
Aaniyah Omardien, WWF-SA
Marlett Wentzel
Mark Davis
Craig Haskins, City of Cape Town
Thomas Auf der Heyde, Technikon Witwatersrand
Laurine Platzky, Dept of Economic Development & Tourism
Marius Willemse, RAPS
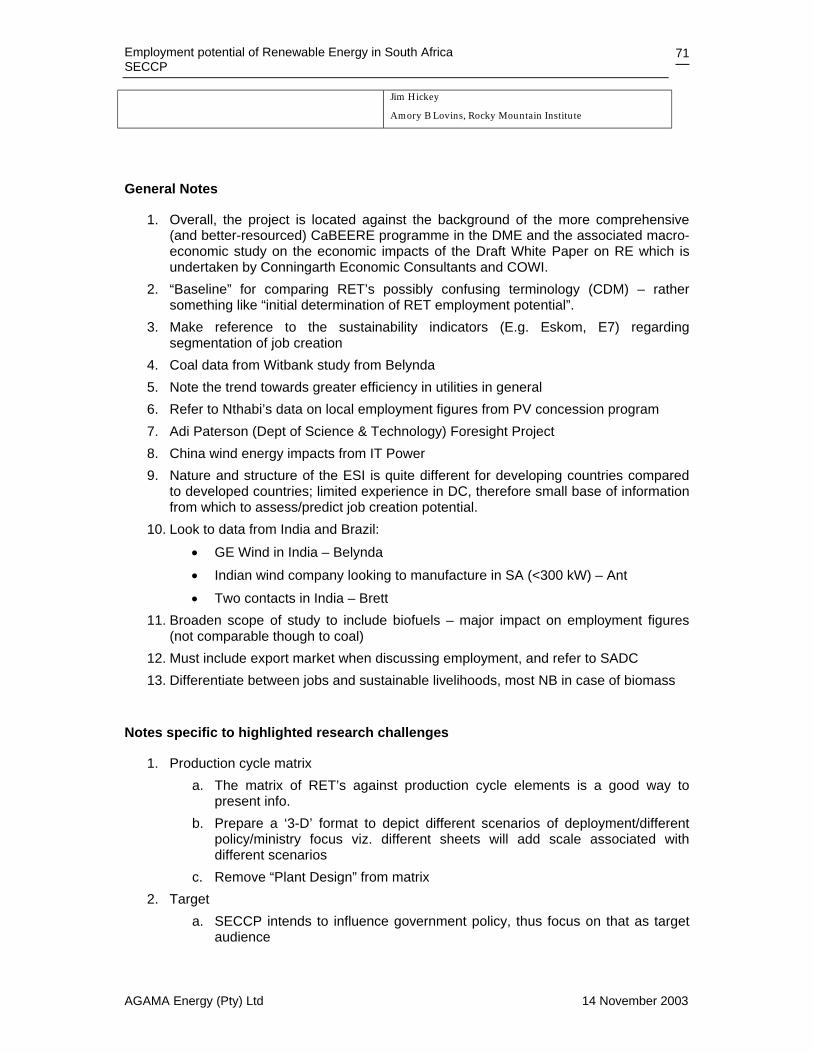
Employment potential of Renewable Energy in South Africa SECCP
AGAMA Energy (Pty) Ltd 14 November 2003
71
Jim Hickey
Amory B Lovins, Rocky Mountain Institute
General Notes
1. Overall, the project is located against the background of the more comprehensive (and better-resourced) CaBEERE programme in the DME and the associated macro-economic study on the economic impacts of the Draft White Paper on RE which is undertaken by Conningarth Economic Consultants and COWI.
2. “Baseline” for comparing RET’s possibly confusing terminology (CDM) – rather something like “initial determination of RET employment potential”.
3. Make reference to the sustainability indicators (E.g. Eskom, E7) regarding segmentation of job creation
4. Coal data from Witbank study from Belynda 5. Note the trend towards greater efficiency in utilities in general 6. Refer to Nthabi’s data on local employment figures from PV concession program 7. Adi Paterson (Dept of Science & Technology) Foresight Project 8. China wind energy impacts from IT Power 9. Nature and structure of the ESI is quite different for developing countries compared
to developed countries; limited experience in DC, therefore small base of information from which to assess/predict job creation potential.
10. Look to data from India and Brazil: • GE Wind in India – Belynda • Indian wind company looking to manufacture in SA (<300 kW) – Ant • Two contacts in India – Brett
11. Broaden scope of study to include biofuels – major impact on employment figures (not comparable though to coal)
12. Must include export market when discussing employment, and refer to SADC 13. Differentiate between jobs and sustainable livelihoods, most NB in case of biomass
Notes specific to highlighted research challenges
1. Production cycle matrix a. The matrix of RET’s against production cycle elements is a good way to
present info. b. Prepare a ‘3-D’ format to depict different scenarios of deployment/different
policy/ministry focus viz. different sheets will add scale associated with different scenarios
c. Remove “Plant Design” from matrix 2. Target
a. SECCP intends to influence government policy, thus focus on that as target audience

Employment potential of Renewable Energy in South Africa SECCP
AGAMA Energy (Pty) Ltd 14 November 2003
72
b. Refer to the City of Cape Town City Energy Strategy report, for ideas on presenting similar data but for different sectors e.g. policy makers, commercial interests, training authorities
c. Similarly, reporting should bear in mind that different ministries are impacted by the transition to RET’s thus focus reporting on Labour, Science & Tech, Minerals & Energy, Education, Trade & Industry, Finance
d. Preference towards reporting on a /MW rather than a /MWh basis e. Refer to Tony Lehman’s motor vehicle study for reporting format around
employment – Belynda to make introductions 3. Scenarios/macro- vs. engineering-economic approach
a. Macro: input-output (social accounting matrix), highly complex – top down approach
b. Engineering: simpler, easier to distil information – bottom up approach c. Preference for engineering-economic approach d. If possible include impacts of, say, a subsidy measure for RET’s on
employment potential. 4. Scope
a. Important to highlight data/info that is outside scope, and attempt to define what further attention will be required in stated areas
b. This study is one piece of a puzzle, it helps to outline the ‘why’ but not the ‘how’ of a move towards RET’s
Next steps
The timeline on the project requires a draft report by 7th October 2003.
Based on the indications of support from the meeting, another meeting of stakeholders is scheduled in three weeks time, at 14:00 on Monday 29th September 2003 at the same venue.
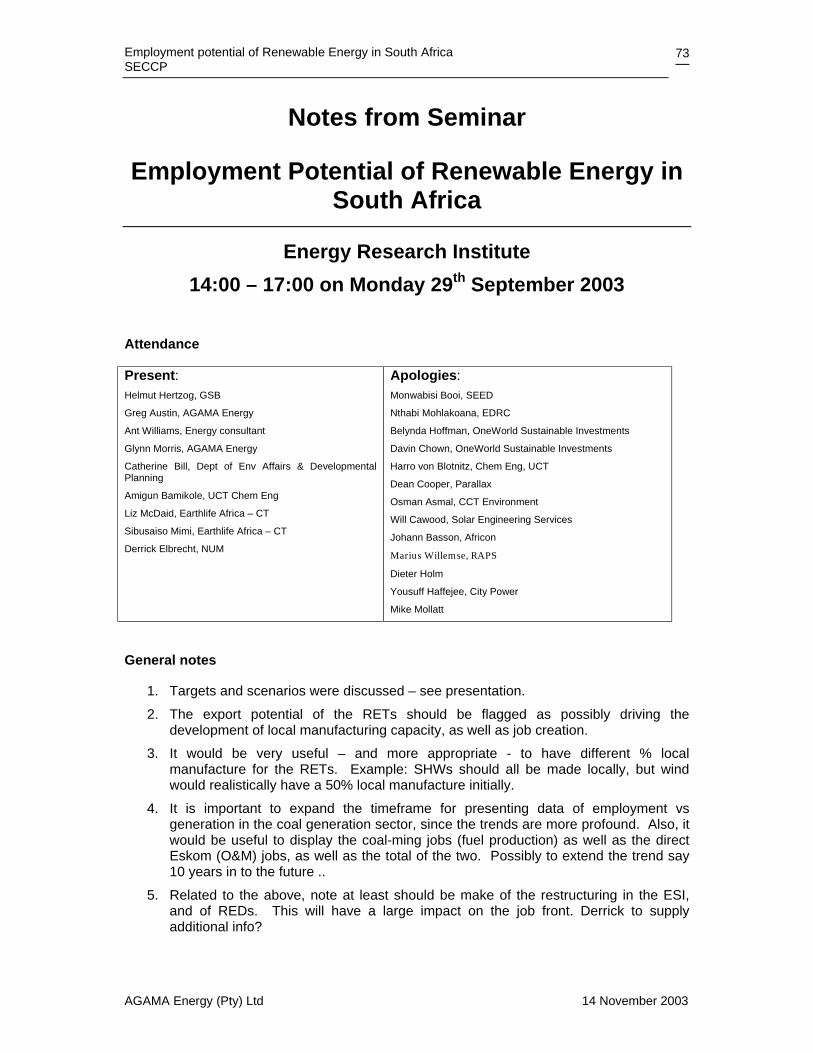
Employment potential of Renewable Energy in South Africa SECCP
AGAMA Energy (Pty) Ltd 14 November 2003
73
Notes from Seminar
Employment Potential of Renewable Energy in South Africa
Energy Research Institute 14:00 – 17:00 on Monday 29th September 2003
Attendance
Present: Helmut Hertzog, GSB
Greg Austin, AGAMA Energy
Ant Williams, Energy consultant
Glynn Morris, AGAMA Energy
Catherine Bill, Dept of Env Affairs & Developmental Planning
Amigun Bamikole, UCT Chem Eng
Liz McDaid, Earthlife Africa – CT
Sibusaiso Mimi, Earthlife Africa – CT
Derrick Elbrecht, NUM
Apologies: Monwabisi Booi, SEED
Nthabi Mohlakoana, EDRC
Belynda Hoffman, OneWorld Sustainable Investments
Davin Chown, OneWorld Sustainable Investments
Harro von Blotnitz, Chem Eng, UCT
Dean Cooper, Parallax
Osman Asmal, CCT Environment
Will Cawood, Solar Engineering Services
Johann Basson, Africon
Marius Willemse, RAPS
Dieter Holm
Yousuff Haffejee, City Power
Mike Mollatt
General notes
1. Targets and scenarios were discussed – see presentation.
2. The export potential of the RETs should be flagged as possibly driving the development of local manufacturing capacity, as well as job creation.
3. It would be very useful – and more appropriate - to have different % local manufacture for the RETs. Example: SHWs should all be made locally, but wind would realistically have a 50% local manufacture initially.
4. It is important to expand the timeframe for presenting data of employment vs generation in the coal generation sector, since the trends are more profound. Also, it would be useful to display the coal-ming jobs (fuel production) as well as the direct Eskom (O&M) jobs, as well as the total of the two. Possibly to extend the trend say 10 years in to the future ..
5. Related to the above, note at least should be make of the restructuring in the ESI, and of REDs. This will have a large impact on the job front. Derrick to supply additional info?
Employment potential of Renewable Energy in South Africa SECCP
AGAMA Energy (Pty) Ltd 14 November 2003
74
6. Note should be made of the user-training implications, particularly within the context of the emphasis of extending the access to electricity. Thus solar PV beneficiaries need additional inputs to organise their use of the technology.
7. Mention should be made that where re-training of currently unemployed, skill people has to take place that this would be significantly cheaper than training from ‘scratch’.
8. It would be ideal to be able to present stepped projected employment data, reflecting the step-change resulting from manufacturing & capacity development. This does generally require an I-O model to predict, though, so this would by definition be more of a stab at what it might look like.
9. Helmut will forward a basic economic sector model which will assist in developing this stepped model.
10. Derrick could provide more detail on the number of jobs at Koeberg; Liz thought that the IEA for the PBMR stated 40 direct jobs/PBMR.
Matrix
1. Perhaps an indication of lifecycle lengths per RET would be useful – since a shorter
life could imply greater jobs associated with decommissioning/re-installation. There is however no indication in the literature of what numbers of jobs are involved in this element, of the total production cycle.
2. The fact that ‘waste costs’ are not indicated on the matrix was raised. Again, no reference in the literature. Concern was raised specifically as to the environmental impacts of various technologies, and how do they get compared on an environmental cost basis?
3. Biofuels to be separated into bioethanol and biodiesel, and the grouping of technologies to be re-arranged. Suggestion was to group solar PV and SWH apart from the other RETs since they fall naturally into decentralised energy production as opposed to grid-connected sources.
4. Remove the energy figures on the right side of the matrix. The proposal is to prepare a complementary pair of matrix tables for a given target and scenario: one that denominates the job figures against final energy produced e.g job/PJ or job/GWh, and another that presents actual jobs figures. The proportion of energy production by technology could possibly be presented separately by means of a pie chart?
Bio-energy
Bioethanol
1. Internationally accepted level is 15% blend in ethylene, which translates in SA to 1.5 billion litres/yr.
2. From molasses (sugar industry) the annual production potential is 230 million litres/yr, therefore an agro-industry is required.
3. Focussing on sweet sorghum, this has the potential to ‘employ’ 120,000 people, conservatively, with an energy output of about 43 PJ/yr.

Employment potential of Renewable Energy in South Africa SECCP
AGAMA Energy (Pty) Ltd 14 November 2003
75
Biodiesel
1. Enjoys the benefit of very small economies of scale viz. still very cost-effective at a very small scale.
2. Potential production in SA of 1.4 billion l/yr = 20% of current diesel consumption 3. Assuming half this production/yr, there is potential for about 385,000 jobs assuming
the small grower/decentralised model, to produce a total energy of about 22.5 PJ/yr. 4. Sasol is currently scoping out centralised biodiesel using soya – it would be
interesting to see these figures.
Biomass CHP
Three options are viable in SA:
1. Converting low-pressure turbines to operate at higher pressures
2. Collecting the +/- 10% cane trash left on the fields in the sugar industry harvest – this would have the potential of provide annual employment (against 8-month) for the 3,700 workers in the industry at the moment.
3. Gasification of wood chips/waste. The difference between the European studies and the SA situation was made – Europe has a highly developed agroforestry program that plants trees as an energy crop.
Targets
It was noted that biofuels do not fit into the scenarios and targets as defined. Appropriate targets were defined as 2%, 5% and 10% of potential production, by the year 2012.
Next steps
The timeline on the project requires a draft report by 7th October 2003.
The draft report will be distributed to all stakeholders for comment prior to final reporting.

Employment potential of Renewable Energy in South Africa SECCP
AGAMA Energy (Pty) Ltd 14 November 2003
76
Appendix D: Forms of biomass utilisation Four fundamental forms of biomass utilisation:
1. The “traditional domestic” use of biomass in developing countries, fuelwood, charcoal and agricultural residues, for meeting household energy needs e.g. cooking with a “three stone fire”, lighting and space heating. In this role, the efficiency of conversion of the biomass to useful energy generally lies between 5% and 15%.
2. The “traditional industrial” use of biomass for the processing of tobacco, tea, pig iron,
bricks and other ceramics, etc, where the biomass feedstock is often regarded as a “free” energy source. There is generally little incentive to use the biomass efficiently so conversion of the feedstock to useful energy commonly occurs at an efficiency of 15% or less.
3. The “modern industrial” use of bioenergy. These include advanced thermochemical
conversion technologies such as pyrolysis and carbonisation, gasification and catalytic liquefaction, and the production of biodiesel from vegetable oils.
4. The “biochemical conversion” techniques, including anaerobic digestion for biogas
production and fermentation of sugars and starches to ethanol.
Employment potential of Renewable Energy in South Africa SECCP
AGAMA Energy (Pty) Ltd 14 November 2003
77
Appendix E: Discussion on jobs and revenue
Sustainable livelihoods as opposed to employment
An emerging theme in development policy is that of “sustainable livelihoods”. Many development agencies recognise the concept of promoting sustainable livelihoods as a means to combat food insecurity and rural poverty. A livelihoods approach focuses on the means, activities, entitlements and assets by which people make a living. For poor rural people to escape from poverty, they must be able to improve their livelihoods in ways that allow them to cope with, and recover, from stresses and shocks, while maintaining and enhancing their material and social assets and opportunities, while at the same time conserving the natural resource base. One element of this sustainable rural livelihoods approach is to improve access of the rural poor to basic and facilitating infrastructure, with energy being a key component. Improved energy services can assist more broadly in rural development as well as in ensuring food security. By appropriate investment in physical and human capital, the development of rural enterprises can be stimulated by improved access to modern energy services e.g. for lighting, powering tools and other productivity-enhancing appliances. Bioenergy projects can thus directly help to alleviate poverty by satisfying basic needs, creating opportunities for improved productivity and better livelihoods, and preserving the natural environment on which the rural poor depend. The production of biomass feedstocks can occur in conjunction, and indeed synergistically with that of other necessities such as food, fodder, fuelwood, construction materials, artisanal materials, and other agricultural cash crops. Biomass feedstock cultivation can also help to restore the environment on which the poor depend for their livelihoods through revegetating barren land, protecting watersheds and harvesting rainwater, providing habitat for animals and birds, stabilising slopes or river banks, or reclaiming waterlogged and salinated soils. They can also serve as an efficient use for agricultural residues, avoiding the pest, waste, and pollution problems often found with residue disposal. If designed with the involvement of local communities, a sensitivity toward local environmental constraints, and a clear objective of meeting the identified needs of the poor, bioenergy activities could thus greatly contribute to the sustainable livelihoods of rural populations.
Direct revenue or employment?
As pointed out above, bioenergy projects can offer income-generating opportunities directly. Many farmers would welcome the opportunity to sell residues or purpose-grown crops to long-term, steady consumers. Producing biomass can therefore provide a new source of stable revenue and help farmers diversify their activities. This can reduce their vulnerability to crop failures or declining crop prices. Bioenergy projects could benefit rural wage labourers as well, by offering employment in biomass cultivation or at a bioenergy facility itself.
In addition, rural communities participating in bioenergy activities can benefit from the acquisition of new skills that can often be transferred to other profitable activities. An example of this would be improvement in farming practices that would result from the extension activities provided by the biomass consumer e.g. the bioethanol plant operator.

Employment potential of Renewable Energy in South Africa SECCP
AGAMA Energy (Pty) Ltd 14 November 2003
78
Their interest would obviously be in securing the quality and supply of the feedstock for their plant, but these could just as easily be expanded to impart generally applicable agricultural skills that would, for example, boost food crop production
At the same time, it should be made clear that the rural poor will not automatically benefit from income-generating opportunities. Farmers need to be able to negotiate fair terms of trade, and workers need to have basic protections as wage labourers. Typically, poor rural farmers operate in a buyer’s market. With imperfect information about market prices, poor access to transport, and complete reliance on a single regional buyer, local farmers are rarely able to command the market price that their product deserves. Small farmers invariably earn lower profit margins than medium and large farmers, primarily because of unequal exchange relations. Appropriate management models need to be explored. A strategy that could go a long way toward remedying this is to promote farmers co-operatives. Co-operatives exploit the economies of scale that are otherwise available only to larger farmers. They inform small farmers about market conditions and technical advances. They enable large investments of capital and labour that would not otherwise be feasible for individual farmers, and they spread risk. Perhaps most importantly, co-operatives endow small farmers with greater bargaining power. For rural labourers, a job’s attractiveness depends on a variety of factors: wage rates, seasonal variability, job security, length of work day, workplace safety, availability of medical care, ability to air grievances, etc. Sometimes, but by no means always, there are laws to ensure minimum job standards, but rarely are these laws consistently enforced. Indeed, it is generally accepted that agricultural and forestry enterprises have a poor track record of respecting basic labour rights. Bioenergy projects, if they are to contribute to truly equitable rural development, should only offer employment that honours basic labour rights. Ensuring that employers respect these is not an easy task, but it is unquestionably easier when workers are allowed to organise and to collectively bargain, thus better equipping them to identify, articulate, negotiate, and secure acceptable labour conditions.
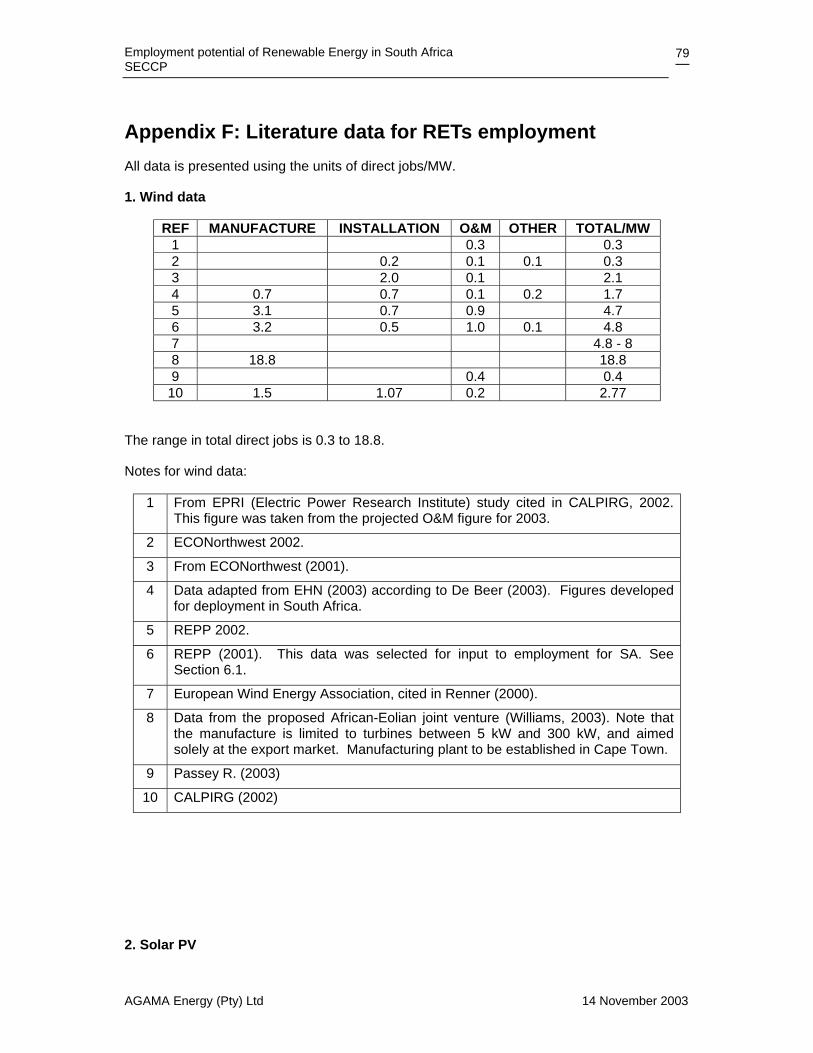
Employment potential of Renewable Energy in South Africa SECCP
AGAMA Energy (Pty) Ltd 14 November 2003
79
Appendix F: Literature data for RETs employment All data is presented using the units of direct jobs/MW.
1. Wind data
REF MANUFACTURE INSTALLATION O&M OTHER TOTAL/MW 1 0.3 0.3 2 0.2 0.1 0.1 0.3 3 2.0 0.1 2.1 4 0.7 0.7 0.1 0.2 1.7 5 3.1 0.7 0.9 4.7 6 3.2 0.5 1.0 0.1 4.8 7 4.8 - 8 8 18.8 18.8 9 0.4 0.4
10 1.5 1.07 0.2 2.77
The range in total direct jobs is 0.3 to 18.8.
Notes for wind data:
1 From EPRI (Electric Power Research Institute) study cited in CALPIRG, 2002. This figure was taken from the projected O&M figure for 2003.
2 ECONorthwest 2002.
3 From ECONorthwest (2001).
4 Data adapted from EHN (2003) according to De Beer (2003). Figures developed for deployment in South Africa.
5 REPP 2002.
6 REPP (2001). This data was selected for input to employment for SA. See Section 6.1.
7 European Wind Energy Association, cited in Renner (2000).
8 Data from the proposed African-Eolian joint venture (Williams, 2003). Note that the manufacture is limited to turbines between 5 kW and 300 kW, and aimed solely at the export market. Manufacturing plant to be established in Cape Town.
9 Passey R. (2003)
10 CALPIRG (2002)
2. Solar PV
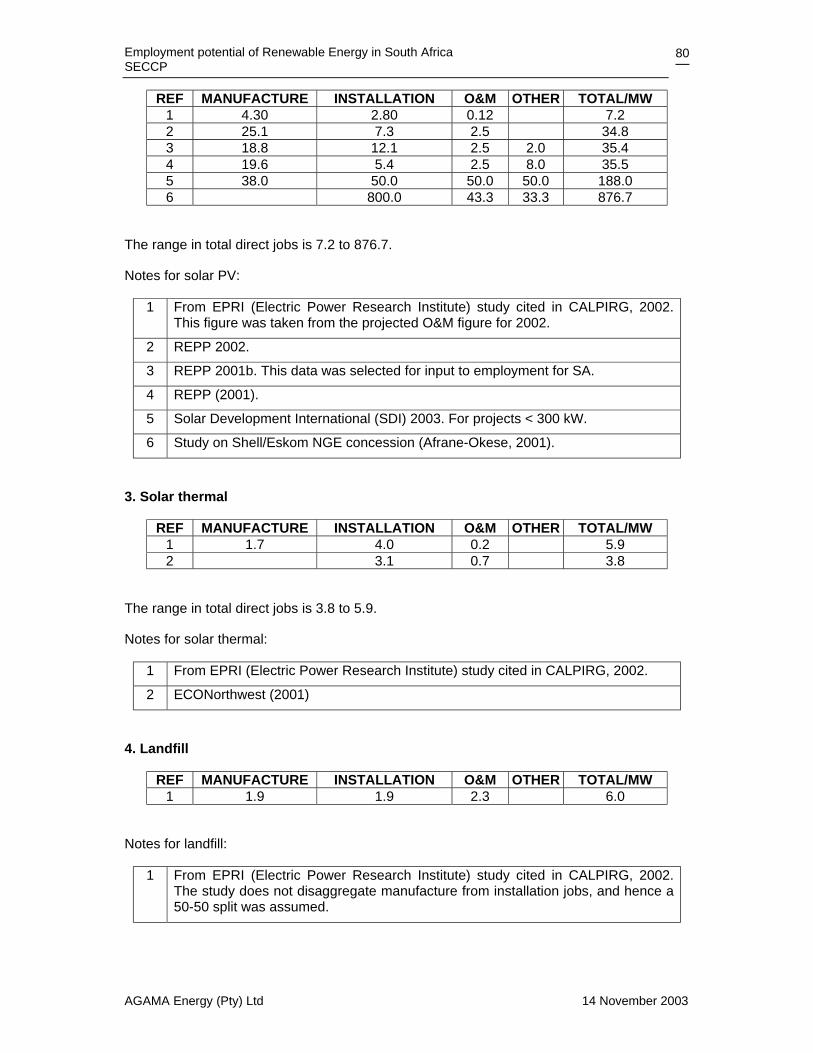
Employment potential of Renewable Energy in South Africa SECCP
AGAMA Energy (Pty) Ltd 14 November 2003
80
REF MANUFACTURE INSTALLATION O&M OTHER TOTAL/MW 1 4.30 2.80 0.12 7.2 2 25.1 7.3 2.5 34.8 3 18.8 12.1 2.5 2.0 35.4 4 19.6 5.4 2.5 8.0 35.5 5 38.0 50.0 50.0 50.0 188.0 6 800.0 43.3 33.3 876.7
The range in total direct jobs is 7.2 to 876.7.
Notes for solar PV:
1 From EPRI (Electric Power Research Institute) study cited in CALPIRG, 2002. This figure was taken from the projected O&M figure for 2002.
2 REPP 2002.
3 REPP 2001b. This data was selected for input to employment for SA.
4 REPP (2001).
5 Solar Development International (SDI) 2003. For projects < 300 kW.
6 Study on Shell/Eskom NGE concession (Afrane-Okese, 2001).
3. Solar thermal
REF MANUFACTURE INSTALLATION O&M OTHER TOTAL/MW 1 1.7 4.0 0.2 5.9 2 3.1 0.7 3.8
The range in total direct jobs is 3.8 to 5.9.
Notes for solar thermal:
1 From EPRI (Electric Power Research Institute) study cited in CALPIRG, 2002.
2 ECONorthwest (2001)
4. Landfill
REF MANUFACTURE INSTALLATION O&M OTHER TOTAL/MW 1 1.9 1.9 2.3 6.0
Notes for landfill:
1 From EPRI (Electric Power Research Institute) study cited in CALPIRG, 2002. The study does not disaggregate manufacture from installation jobs, and hence a 50-50 split was assumed.
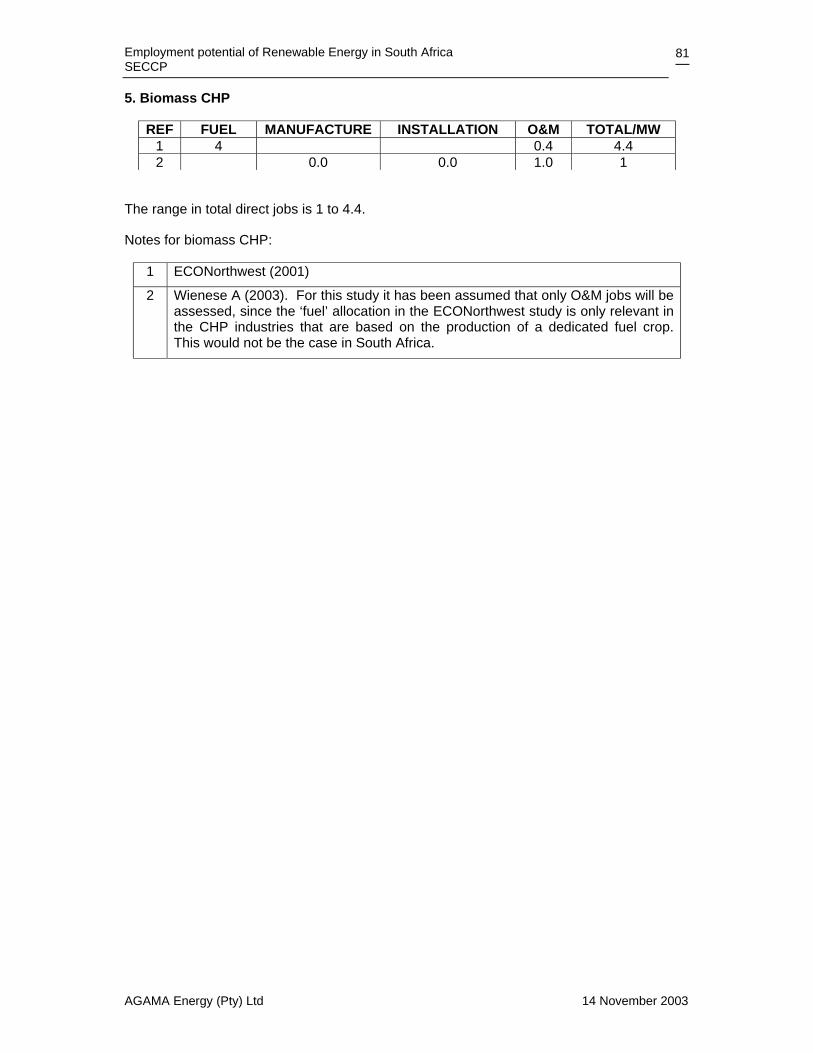
Employment potential of Renewable Energy in South Africa SECCP
AGAMA Energy (Pty) Ltd 14 November 2003
81
5. Biomass CHP
REF FUEL MANUFACTURE INSTALLATION O&M TOTAL/MW 1 4 0.4 4.4 2 0.0 0.0 1.0 1
The range in total direct jobs is 1 to 4.4.
Notes for biomass CHP:
1 ECONorthwest (2001)
2 Wienese A (2003). For this study it has been assumed that only O&M jobs will be assessed, since the ‘fuel’ allocation in the ECONorthwest study is only relevant in the CHP industries that are based on the production of a dedicated fuel crop. This would not be the case in South Africa.