employees in slovenia and their psychological well-being based on ryff’s model of psychological...
TRANSCRIPT

Employees in Slovenia and Their PsychologicalWell-Being Based on Ryff’s Model ofPsychological Well-Being
Simona Sarotar Zizek • Sonja Treven • Vesna Cancer
Accepted: 27 April 2014� Springer Science+Business Media Dordrecht 2014
Abstract The aim of this article is to provide information about using Ryff’s Scales of
Psychological Well-Being in Slovenia. Based on the initial presentation of the concept of
psychological well-being (PWB), this article subsequently presents the results of empirical
research in the PWB of employees in organizations in Slovenia. The main goal of this
research is to present the procedure of building a PWB model based on the Ryff and Keyes
multidimensional model of well-being, which was adapted to the studied population. By
using factor analysis, both the exploratory and the confirmatory one, we confirmed that the
PWB model is multidimensional. We made a selection of constructs and indicators that
best describe PWB. The results of the final PWB model can let us report that the rela-
tionship between PWB and ‘‘autonomy’’ is stronger than the relationship between PWB
and ‘‘positive relations with others’’, and between PWB and ‘‘self-acceptance’’. For the
human resource management activities in Slovenian organizations it is also important that
employees want to learn and grow. The results provide the basis for the future actions,
necessary to raise awareness of stakeholders.
Keywords Well-being � Psychological well-being � Organizational behaviour �Organization � Employees
1 Introduction
Psychological well-being (PWB) is and it always was an important part of every human
life and consequently of an organization, too. Nowadays PWB became the most common
S. Sarotar Zizek (&) � S. Treven � V. CancerFaculty of Economics and Business, University of Maribor, Razlagova 14, Maribor 2000, Sloveniae-mail: [email protected]
S. Trevene-mail: [email protected]
V. Cancere-mail: [email protected]
123
Soc Indic ResDOI 10.1007/s11205-014-0645-3

impact, which effects employees work (quality, quantity) and consequently the organiza-
tional results.
The existing literature on defining positive psychological functioning, with which well-
being is strongly connected, includes many perspectives. The first is Maslow’s (1968)
conception of self-actualization, Rogers’s (1961) view of the fully functioning person,
Jung’s (1933) formulation of individuation, and Allport’s (1961) conception of maturity
(Ryff 1989). ‘‘A further domain of theory for defining PWB follows from life span
developmental perspectives, which emphasize the differing challenges confronted at var-
ious phases of the life cycle.’’ Included here are Erikson’s (1959) psychological stage
model, Buhler’s basic life tendencies that work toward the fulfilment of life (Buhler 1935;
Buhler and Marschak 1968) and Neugarten’s (1968) descriptions of personality changes in
adulthood and old age’’ (Ryff 1989). Musek (2005) states that Jahoda (1958) was probably
the first author who, through researching positive psychic health, analysed existing sci-
entific literature on variables related to normal, optimal psychic activity on one side and
pathologic psychic activity and emotional functioning on the other. Jahoda was particularly
interested in optimal and successful functioning with respect to content, rather than only an
absence of negative behaviour.
In this paper, we will first present a theoretical point of view for PWB and then describe
the research methodology as well as empirical research in PWB in Slovenian organiza-
tions. We will also discuss future research possibilities.
1.1 Theoretical Background
Since a human being is also a spiritual being, the psychologists Jung, Goldstein, Maslow
and Rogers have emphasized the concept of self-actualization, and Frankl, who explored
the meaning of life, developed a new positive psychological form of eudaimonic direction,
and linked it with the concept of PWB (Musek 2008). This means that the eudaimonic
tradition was begun by authors that speak about self-actualization and the meaning of life
(existential, phenomenological and humanistic psychologists). PWB covers several cate-
gories, such as the subjective evaluation of emotional and cognitive satisfaction.
Jahoda (1958) focused her research on positive psychic health. She analysed the existing
scientific literature for previously known variables that are associated with normal psychic
function on the one hand, and pathological psychic and emotional functioning on the other.
It is worth noting that all research before this primarily considered pathological and normal
functioning as the absence of the pathological. Therefore, Jahoda decided to explore the
field of optimal or successful functioning in terms of content, instead of as the absence of a
negative.
Ryff (1989) and Ryff and Keyes (1995) developed a questionnaire with six elements on
the basis of existing literature about psychic health: (1) ‘‘self-acceptance’’, (2) ‘‘positive
relations with others’’, (3) ‘‘autonomy’’, (4) ‘‘environmental management’’, (5) ‘‘meaning
of life’’ and (6) ‘‘personal growth’’. These six elements determined emotional and psychic
health (Ryff and Keyes 1995). They provided evidence that the eudaimonic life, as shown
in PWB, can affect some psychological characteristics, which are related to immunological
functioning and health.
All of these form the basis of a multidimensional model of well-being. Ryff and Keyes
(1995) mentioned that the model of well-being includes six distinct components of positive
psychological functioning. ‘‘In combination, these dimensions encompass a breadth of
wellness that includes positive evaluations of oneself and one’s past (self-acceptance), a
sense of continued growth and development as a person (personal growth), the belief that
S. Sarotar Zizek et al.
123

one’s life is purposeful and meaningful (purpose in life), quality relationships with others
(positive relations with others), the capacity to effectively manage one’s life and sur-
rounding world (environmental mastery), and a sense of self-determination (autonomy).’’
Following Ryff (1989), the dimensions of PWB can be described as follows:
• ‘‘Self-acceptance’’—a positive attitude towards our-selves constitutes a central
characteristic of positive psychological functioning. This aspect also includes other
aspects of the individual as a person and positive feelings about one’s past experiences.
• ‘‘Personal growth’’—reflects a sense for further development and potential, as well as
openness to new experiences and a sense of increased knowledge.
• ‘‘Purpose in life’’—as a dimension, this indicates whether a person has clear goals and
directions in life, and whether they get a sense of importance regarding their past and
present experiences, which combine to provide a sense of purpose in life.
• ‘‘Environmental mastery’’—this dimension reflects the ability to manage a complex
environment and at the same time the ability to choose or design a personal framework
of living.
• ‘‘Autonomy’’—this dimension includes the dimension of attributes such as self-
determination, independence, inner control, individualization and internal regulation of
behaviour. The basis for these attributes is the fact that our thoughts and actions are our
own –they should not be set by others, which would place them beyond our control.
• ‘‘Positive relations with others’’—this dimension is determined by warm, rewarding
and trustworthy relationships with other people, concerns about the well-being (WB)
others, the ability to feel empathy, affection and intimacy and understanding the giving
and receiving component of human relationships.
In our paper we particularly focused on the Ryff’s and Keyes’s multidimensional model
of well-being (Ryff and Keyes 1995), which has strongly influenced our own model. The
methods and the results of our empirical research in the PWB of employees in Slovenian
organizations are also presented in the following sections.
1.2 Benefits of Psychological Well-Being for Employees
Employees with an appropriate level of PWB, experience: freedom on a personal level (for
acceptance of ethics and valuing decisions), purposefulness of lifestyle and developing
skills for external goals (e.g., concern for money, status and professional growth) as well as
internal goals (greater commitment to their organizations). Strengthened and extended
social networks in private life have an impact on professional life. People with these
characteristics are more professional, accepted, trustworthy and socially healthy, and also
more loyal to their organization, by sharing their behavioural repertoire (Garg and Rastogi
2009).
Therefore, it is not surprising that those employees who are enthusiastic and committed
to their lives (with regard to ‘‘autonomy’’, ‘‘environmental mastery’’, ‘‘personal growth’’,
‘‘positive relations with others’’, ‘‘the purpose in life’’ and ‘‘self-acceptance’’), demonstrate
happiness in their personal life. In addition, they transpose the impact of these effects to
their professional area. The satisfying of psychological needs therefore provides greater
availability and self-determination than the control and pressure on the promotion of PWB
in the sense of commitment at the workplace. This is important, not only because people
spend a lot of time at work, but also because of the fact that happy people are more
productive in different ways (Garg and Rastogi 2009).
It is interesting that a higher level of PWB:
Employees in Slovenia
123
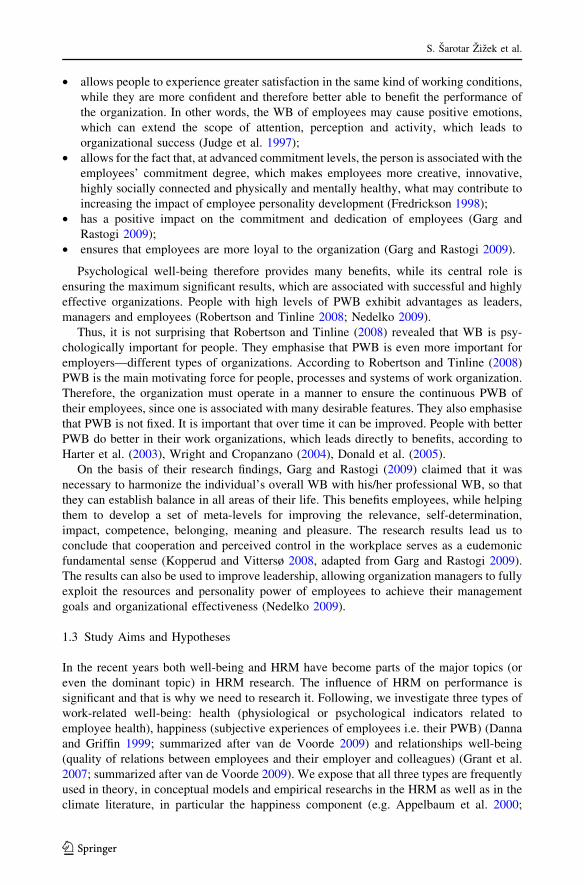
• allows people to experience greater satisfaction in the same kind of working conditions,
while they are more confident and therefore better able to benefit the performance of
the organization. In other words, the WB of employees may cause positive emotions,
which can extend the scope of attention, perception and activity, which leads to
organizational success (Judge et al. 1997);
• allows for the fact that, at advanced commitment levels, the person is associated with the
employees’ commitment degree, which makes employees more creative, innovative,
highly socially connected and physically and mentally healthy, what may contribute to
increasing the impact of employee personality development (Fredrickson 1998);
• has a positive impact on the commitment and dedication of employees (Garg and
Rastogi 2009);
• ensures that employees are more loyal to the organization (Garg and Rastogi 2009).
Psychological well-being therefore provides many benefits, while its central role is
ensuring the maximum significant results, which are associated with successful and highly
effective organizations. People with high levels of PWB exhibit advantages as leaders,
managers and employees (Robertson and Tinline 2008; Nedelko 2009).
Thus, it is not surprising that Robertson and Tinline (2008) revealed that WB is psy-
chologically important for people. They emphasise that PWB is even more important for
employers—different types of organizations. According to Robertson and Tinline (2008)
PWB is the main motivating force for people, processes and systems of work organization.
Therefore, the organization must operate in a manner to ensure the continuous PWB of
their employees, since one is associated with many desirable features. They also emphasise
that PWB is not fixed. It is important that over time it can be improved. People with better
PWB do better in their work organizations, which leads directly to benefits, according to
Harter et al. (2003), Wright and Cropanzano (2004), Donald et al. (2005).
On the basis of their research findings, Garg and Rastogi (2009) claimed that it was
necessary to harmonize the individual’s overall WB with his/her professional WB, so that
they can establish balance in all areas of their life. This benefits employees, while helping
them to develop a set of meta-levels for improving the relevance, self-determination,
impact, competence, belonging, meaning and pleasure. The research results lead us to
conclude that cooperation and perceived control in the workplace serves as a eudemonic
fundamental sense (Kopperud and Vittersø 2008, adapted from Garg and Rastogi 2009).
The results can also be used to improve leadership, allowing organization managers to fully
exploit the resources and personality power of employees to achieve their management
goals and organizational effectiveness (Nedelko 2009).
1.3 Study Aims and Hypotheses
In the recent years both well-being and HRM have become parts of the major topics (or
even the dominant topic) in HRM research. The influence of HRM on performance is
significant and that is why we need to research it. Following, we investigate three types of
work-related well-being: health (physiological or psychological indicators related to
employee health), happiness (subjective experiences of employees i.e. their PWB) (Danna
and Griffin 1999; summarized after van de Voorde 2009) and relationships well-being
(quality of relations between employees and their employer and colleagues) (Grant et al.
2007; summarized after van de Voorde 2009). We expose that all three types are frequently
used in theory, in conceptual models and empirical researchs in the HRM as well as in the
climate literature, in particular the happiness component (e.g. Appelbaum et al. 2000;
S. Sarotar Zizek et al.
123
Boxall and Purcell 2008; Kopelman et al. 1990; Nishii and Wright 2008; Ostroff et al.
2003; Purcell and Kinnie 2007a, b; Ramsay et al. 2000; Sparrow 2001; Tesluk et al. 2002).
For every organization it is important to achieve the balance of managerial (organizational
performance) and employee interests (employee well-being). We must mention that in the
HRM and climate literature two different views on employee well-being exist including the
HRM/climate—performance relationship (Appelbaum et al. 2000; Boselie et al. 2009; Boxall
and Macky 2009; Kopelman et al. 1990; Paauwe 2009; Peccei 2004; summarized after van de
Voorde 2009). The optimistic approach integrated that HRM/climate enhances employee well-
being and organizational performance (mutual gains), whereas the pessimistic or sceptical
approach assumes that HRM/climate pays off in terms of organizational performance, but at the
same time has no or even a negative effect on employee well-being (conflicting outcomes)
(Peccei 2004; summarized after van de Voorde 2009).Employee well-being (mainly happiness/
work satisfaction) function is intermediary between organizational climate and organizational
performance (Kopelman et al. 1990; Ostroff and Bowen 2000; Ostroff et al. 2003; Tesluk et al.
2002; summarized after van de Voorde 2009). It is possible that an organization may not be able
to achieve both employee well-being and organizational performance to the same extent, and
needs to make a trade-off in terms of which outcome to achieve.
In our research, we verified the following hypotheses:
H1: Employees in Slovenia want to grow personally.
H2: The PWB model is multidimensional.
H3: ‘‘Positive relations with others’’ are the most important construct of PWB in
Slovenia.
2 Methodology
As part of the basic research project ‘‘A requisitely holistic model of measuring
employees’ well-being in transitional organizations as compared to both innovative and
less innovative ones’’, we surveyed organizations in Slovenia. During the period from the
1st of April 2011 until the 20th of June 2011, we collected data about employees in
Slovenia.1 In this project, we measured the requisitely holistic well-being (subjective
emotional well-being, PWB and self-determination) and also observed the social respon-
sibility (SR) and performance of organizations. In this article we will only discuss PWB as
one important issue for the well-being of employees.
2.1 Measuring Instrument
We measured PWB via Ryff and Keyes (1995) who developed a questionnaire with six
elements on the basis of existing literature on psychic health: (1) ‘‘self-acceptance’’, (2)
‘‘positive relations with others’’, (3) ‘‘autonomy’’, (4) ‘‘environmental management’’, (5)
‘‘meaning of life’’ and (6) ‘‘personal growth’’. For each construct we used nine items. We
used a five-step Likert-type scale (from 1—I do not agree to 5—I agree), where we
indicated statements and then our respondents had to indicate the level of agreement with
the statements. One of the research results was the questionnaire, adapted to Slovenian
1 Paper is based on the basic research project ‘‘A requisitely holistic model of measuring employees’ well-being in transitional organizations as compared to both innovative and less innovative ones’’, sponsored byThe Public Agency of the Republic of Slovenia for Research Activity, basic research project, contractnumber: 1000-09 – 212173. The team was chaired by Prof. DDr. Matjaz Mulej in 2010–2012.
Employees in Slovenia
123

circumstances. The research instrument—the adapted questionnaire used in the empirical
survey in Slovenia in 2011, was previously tested and validated: 150 students participated
in the trial phase performed in May and June 2010. Final instrument for PWB was a design
consisted of three items for each element of PWB, except for purpose in life. This was used
in the main study, which was carried out in June 2011.
2.2 Procedure
2.2.1 Preliminary Research
Content validity (sometimes called face validity) of the measurement instrument is very
important for every research. Content validity means the systematic evaluation of the
measurements scale, and shows the extent to which the scale truly represents concepts that
we want to measure (Malhotra and Birks 2003). It must be pointed out that the substantive
validity refers to the features that have to have units of measurement and the measurement
tools, to ensure that the measurement result is really what the researcher wants to measure
(Aaker et al. 2001).
In order to research the PWB of employees in Slovenia we conducted preliminary
research. Preliminary qualitative study is important, but it is not sufficient. In order to
achieve the concept of quality in this area, we have to work with an exploratory part of the
study. Because we need the actual data we also carried out a preliminary qualitative
research. The mentioned part of the research was identified as an exploratory work, which
aimed to check and deepen the knowledge gained from technical and scientific literature.
Milfelner (2012) notes that researcher could confirm the most substantive validity with
demonstrating to the potential respondents and experts in the field that we want to measure.
Therefore, we checked the content validity of the questionnaire in several stages.
For research we used Ryff and Keyes questionnaire. In the context of qualitative
research, which is based on a questionnaire for employees and executives, we selected the
method of individual in-depth interviews. The reason for the in-depth interviews (and not
focusing on groups) is there in their benefits. These are the following (Churchill 1999):
• a better understanding of the topic (this was important for the design of measurement
scales of those constructs that have not been properly established and validated),
• more honest answers (for managers, it was important to express their views without the
pressures of the remaining respondents),
• elimination of the negative effects of group (passive participants—mostly students) and
• implementation of interviews of competing groups and individuals.
The implementation of an interview was following:
1. the interviewer explained at first the purpose of the interview to respondents, and
2. expressed to respondent incentive to freely consider PWB; interviewer promotes a
discussion on pre-defined topics and issues,
3. in the final phase of the interview the interviewer asks additional questions to clarify
any ambiguities or to check individual opinions.
In the frame of qualitative analysis, which relies on employee questionnaire, we were
dealing with PWB and its constructs. With this purpose we conducted in-depth interviews
with students in May 2010. We interviewed 20 students of postgraduate study for about
35 min. Firstly, we wanted to find out how they understood the word and meanings of
PWB. In-depth interviews revealed that we had well defined PWB.
S. Sarotar Zizek et al.
123
Following, we are presenting the findings of our preliminary quantitative research,
conducted on the basis of questionnaire for employees and for managers. The questionnaire
for measurement of PWB consists of the following constructs and number of items:
• ‘‘autonomy’’ (number of items was reduced from 6 to 3),
• ‘‘the control of the environment’’ (number of items was reduced from 8 to 3),
• ‘‘ personality growth’’ (number of items was reduced from 6 to 3),
• ‘‘ a positive relationship’’ (number of items was reduced from 8 to 3),
• ‘‘ purpose in life’’ (number of items was reduced from 7 to 0) and
• ‘‘ self-esteem’’ (number of items was reduced from 7 to 3).
2.2.2 Data Collecting and Participants
As mentioned, we collected data about PWB from employees in Slovenia during the period
from the 1st of April 2011 until the 20th of June 2011.
Our surveys sampled 320 organizations in Slovenia with the following characteristics:
• The sample included organizations from all over Slovenia; this provided for a relatively
representative regional coverage.
• We chose those organizations that employed more than 15 employees (we assumed that
organizations with fewer employees had not yet developed a requisitely holistic Human
Resource Management).
• The survey included employees who were employed by the organization for at least a
year and came from different backgrounds or various fields.
• Each organization involved in the study got a special code, which ensured traceability
between companies and their definition of claim in the questionnaire.
• By using the computer program Excel, we established a random selection of
organizations in the survey.
• Whereas, in the worst-case scenario, the response rate of firms is 10 %, there was a
tenfold difference between the target and the final sample.
• We received 470 completed responses from our respondents. Of all the respondents,
39.87 % were male and 60.13 % were female.
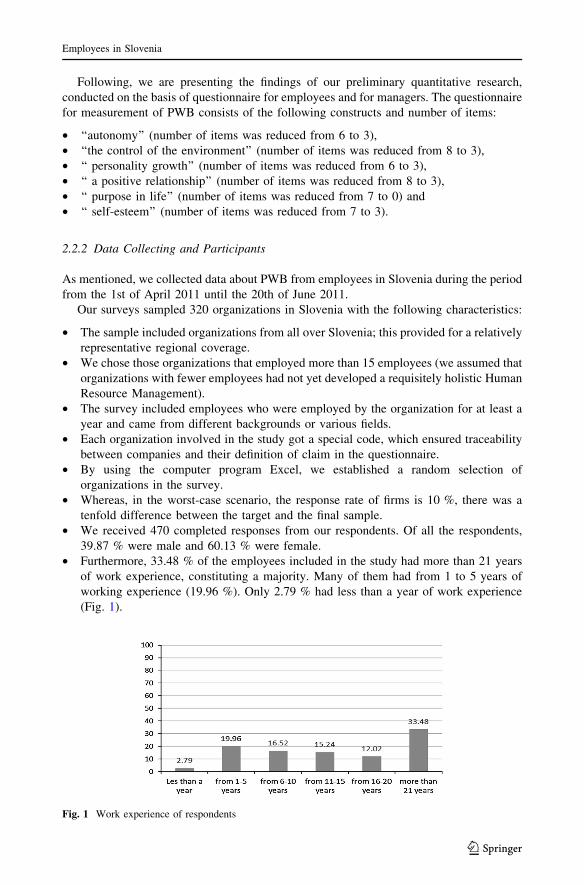
• Furthermore, 33.48 % of the employees included in the study had more than 21 years
of work experience, constituting a majority. Many of them had from 1 to 5 years of
working experience (19.96 %). Only 2.79 % had less than a year of work experience
(Fig. 1).
Fig. 1 Work experience of respondents
Employees in Slovenia
123
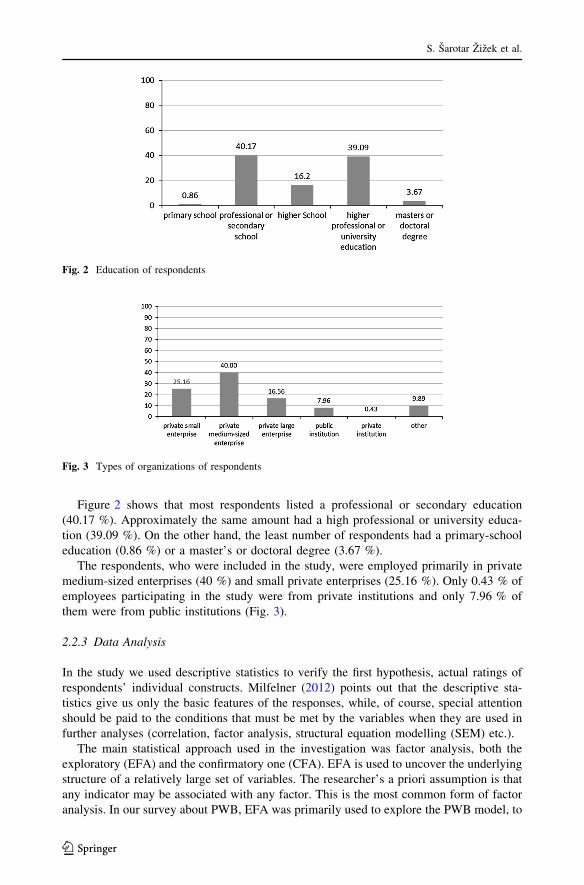
Figure 2 shows that most respondents listed a professional or secondary education
(40.17 %). Approximately the same amount had a high professional or university educa-
tion (39.09 %). On the other hand, the least number of respondents had a primary-school
education (0.86 %) or a master’s or doctoral degree (3.67 %).
The respondents, who were included in the study, were employed primarily in private
medium-sized enterprises (40 %) and small private enterprises (25.16 %). Only 0.43 % of
employees participating in the study were from private institutions and only 7.96 % of
them were from public institutions (Fig. 3).
2.2.3 Data Analysis
In the study we used descriptive statistics to verify the first hypothesis, actual ratings of
respondents’ individual constructs. Milfelner (2012) points out that the descriptive sta-
tistics give us only the basic features of the responses, while, of course, special attention
should be paid to the conditions that must be met by the variables when they are used in
further analyses (correlation, factor analysis, structural equation modelling (SEM) etc.).
The main statistical approach used in the investigation was factor analysis, both the
exploratory (EFA) and the confirmatory one (CFA). EFA is used to uncover the underlying
structure of a relatively large set of variables. The researcher’s a priori assumption is that
any indicator may be associated with any factor. This is the most common form of factor
analysis. In our survey about PWB, EFA was primarily used to explore the PWB model, to
Fig. 2 Education of respondents
Fig. 3 Types of organizations of respondents
S. Sarotar Zizek et al.
123

determine the number of common factors influencing the set of measures, i.e. the number
of constructs and indicators of PWB, and to determine the strength of the relationship
between each factor and each observed measure (DeCoster 1998). On the other hand, CFA
may be used to confirm that the indicators sort themselves into factors corresponding to
how the researcher has linked the indicators to the latent variables. The primary objective
of CFA is to determine the ability of a predefined factor model to fit an observed set of data
(DeCoster 1998). In our survey about PWB, CFA was primarily used to monitor the
dimensionality, reliability and validity of the measurement scales. It was also used to test
the hypothesis.
To test the second and the third hypothesis, SEM was used. SEM (Milfelner 2012) is:
• one of the statistical techniques that include and combine path analysis and factor
analysis;
• a method that is very similar to multiple regression, but differs from it in that it has a
greater strength of evaluation, while it includes measurements such as indirect
connections, the connection of independent variables, residual (measurement errors)
and the link of residuals and latent variables that are measured by several indicators;
• the extension of the general linear model (GLM) which includes multiple regression.
This method formed the basis for the design of an applied model of well-being for
Slovenian conditions.
3 Results
3.1 Descriptive Statistics
In the next table (Table 1) we present our results for the indicators of PWB by Ryff and
Keyes (1995).
From the table of descriptive statistics (Table 1) we can see that the highest mean value
is achieved by the indicator ‘‘For me life is a continuous process of learning, changing and
growing.’’ Thus, for the respondents, life is an on-going process of learning, change and
growth. The highest dispersion of responses, measured by standard deviation, is achieved
by the indicator ‘‘About myself, compared with others, I often do not think positively
enough.’’ This means that the answers of respondents under this factor were the most
variable. The lowest values were achieved by the next indicators: ‘‘Others have more from
life than I do’’ and ‘‘About myself, compared with others, I often do not think positively
enough.’’ Notwithstanding the previous sentence, it can be concluded that the respondents
are satisfied with their lives and with themselves.
We also analysed the data in terms of skewness. The negative and positive values of
skewness show that the distributions of the empirical data are asymmetric to the left and to
the right. We can also see that there are six indicators with a negative skew lower than one
(‘‘I am ready to share my time with others,’’ ‘‘I am loving and friendly,’’ ‘‘For me life is a
continuous process of learning, changing and growing,’’ ‘‘My own view of myself and the
world changes with new experiences,’’ ‘‘I offer others: food, time, neighbourhood and
friendly assistance,’’ ‘‘I am confident and positive about myself’’) showing a strong con-
centration of the respondents agreement with the statements on PWB written in paren-
theses and thus showing high levels of PWB expressed within these statements.
Table 1 shows that respondents, on average, partially agree with the following state-
ments: ‘‘For me life is a continuous process of learning, changing and growing’’ (mean
Employees in Slovenia
123
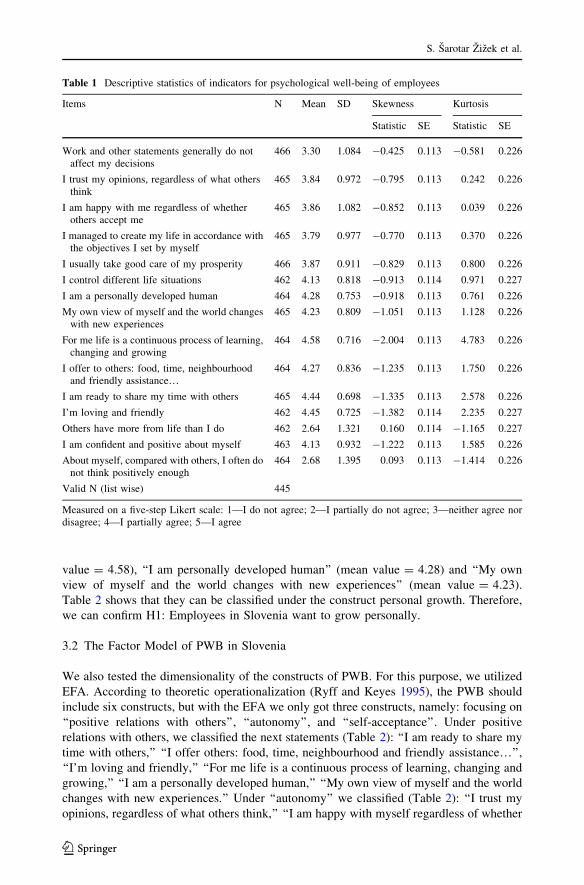
value = 4.58), ‘‘I am personally developed human’’ (mean value = 4.28) and ‘‘My own
view of myself and the world changes with new experiences’’ (mean value = 4.23).
Table 2 shows that they can be classified under the construct personal growth. Therefore,
we can confirm H1: Employees in Slovenia want to grow personally.
3.2 The Factor Model of PWB in Slovenia
We also tested the dimensionality of the constructs of PWB. For this purpose, we utilized
EFA. According to theoretic operationalization (Ryff and Keyes 1995), the PWB should
include six constructs, but with the EFA we only got three constructs, namely: focusing on
‘‘positive relations with others’’, ‘‘autonomy’’, and ‘‘self-acceptance’’. Under positive
relations with others, we classified the next statements (Table 2): ‘‘I am ready to share my
time with others,’’ ‘‘I offer others: food, time, neighbourhood and friendly assistance…’’,
‘‘I’m loving and friendly,’’ ‘‘For me life is a continuous process of learning, changing and
growing,’’ ‘‘I am a personally developed human,’’ ‘‘My own view of myself and the world
changes with new experiences.’’ Under ‘‘autonomy’’ we classified (Table 2): ‘‘I trust my
opinions, regardless of what others think,’’ ‘‘I am happy with myself regardless of whether
Table 1 Descriptive statistics of indicators for psychological well-being of employees
Items N Mean SD Skewness Kurtosis
Statistic SE Statistic SE
Work and other statements generally do notaffect my decisions
466 3.30 1.084 -0.425 0.113 -0.581 0.226
I trust my opinions, regardless of what othersthink
465 3.84 0.972 -0.795 0.113 0.242 0.226
I am happy with me regardless of whetherothers accept me
465 3.86 1.082 -0.852 0.113 0.039 0.226
I managed to create my life in accordance withthe objectives I set by myself
465 3.79 0.977 -0.770 0.113 0.370 0.226
I usually take good care of my prosperity 466 3.87 0.911 -0.829 0.113 0.800 0.226
I control different life situations 462 4.13 0.818 -0.913 0.114 0.971 0.227
I am a personally developed human 464 4.28 0.753 -0.918 0.113 0.761 0.226
My own view of myself and the world changeswith new experiences
465 4.23 0.809 -1.051 0.113 1.128 0.226
For me life is a continuous process of learning,changing and growing
464 4.58 0.716 -2.004 0.113 4.783 0.226
I offer to others: food, time, neighbourhoodand friendly assistance…
464 4.27 0.836 -1.235 0.113 1.750 0.226
I am ready to share my time with others 465 4.44 0.698 -1.335 0.113 2.578 0.226
I’m loving and friendly 462 4.45 0.725 -1.382 0.114 2.235 0.227
Others have more from life than I do 462 2.64 1.321 0.160 0.114 -1.165 0.227
I am confident and positive about myself 463 4.13 0.932 -1.222 0.113 1.585 0.226
About myself, compared with others, I often donot think positively enough
464 2.68 1.395 0.093 0.113 -1.414 0.226
Valid N (list wise) 445
Measured on a five-step Likert scale: 1—I do not agree; 2—I partially do not agree; 3—neither agree nordisagree; 4—I partially agree; 5—I agree
S. Sarotar Zizek et al.
123
others accept me,’’ and ‘‘Work and other statements generally do not affect my decisions.’’
Under ‘‘self-acceptance’’ we listed the next two statements (Table 2): ‘‘Others have more
from life than I do,’’ and ‘‘About myself, compared with others, I often do not think
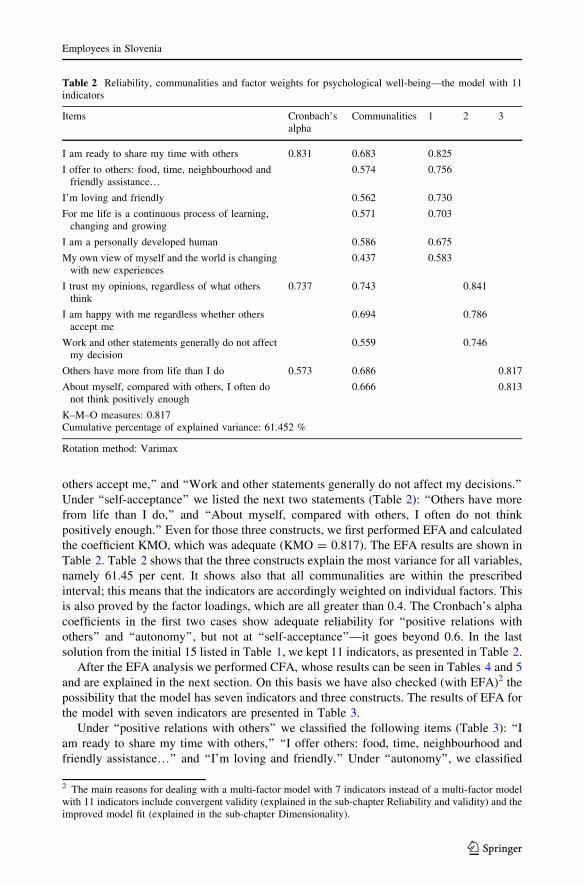
positively enough.’’ Even for those three constructs, we first performed EFA and calculated
the coefficient KMO, which was adequate (KMO = 0.817). The EFA results are shown in
Table 2. Table 2 shows that the three constructs explain the most variance for all variables,
namely 61.45 per cent. It shows also that all communalities are within the prescribed
interval; this means that the indicators are accordingly weighted on individual factors. This
is also proved by the factor loadings, which are all greater than 0.4. The Cronbach’s alpha
coefficients in the first two cases show adequate reliability for ‘‘positive relations with
others’’ and ‘‘autonomy’’, but not at ‘‘self-acceptance’’—it goes beyond 0.6. In the last
solution from the initial 15 listed in Table 1, we kept 11 indicators, as presented in Table 2.
After the EFA analysis we performed CFA, whose results can be seen in Tables 4 and 5
and are explained in the next section. On this basis we have also checked (with EFA)2 the
possibility that the model has seven indicators and three constructs. The results of EFA for
the model with seven indicators are presented in Table 3.
Under ‘‘positive relations with others’’ we classified the following items (Table 3): ‘‘I
am ready to share my time with others,’’ ‘‘I offer others: food, time, neighbourhood and
friendly assistance…’’ and ‘‘I’m loving and friendly.’’ Under ‘‘autonomy’’, we classified
Table 2 Reliability, communalities and factor weights for psychological well-being—the model with 11indicators
Items Cronbach’salpha
Communalities 1 2 3
I am ready to share my time with others 0.831 0.683 0.825
I offer to others: food, time, neighbourhood andfriendly assistance…
0.574 0.756
I’m loving and friendly 0.562 0.730
For me life is a continuous process of learning,changing and growing
0.571 0.703
I am a personally developed human 0.586 0.675
My own view of myself and the world is changingwith new experiences
0.437 0.583
I trust my opinions, regardless of what othersthink
0.737 0.743 0.841
I am happy with me regardless whether othersaccept me
0.694 0.786
Work and other statements generally do not affectmy decision
0.559 0.746
Others have more from life than I do 0.573 0.686 0.817
About myself, compared with others, I often donot think positively enough
0.666 0.813
K–M–O measures: 0.817Cumulative percentage of explained variance: 61.452 %
Rotation method: Varimax
2 The main reasons for dealing with a multi-factor model with 7 indicators instead of a multi-factor modelwith 11 indicators include convergent validity (explained in the sub-chapter Reliability and validity) and theimproved model fit (explained in the sub-chapter Dimensionality).
Employees in Slovenia
123
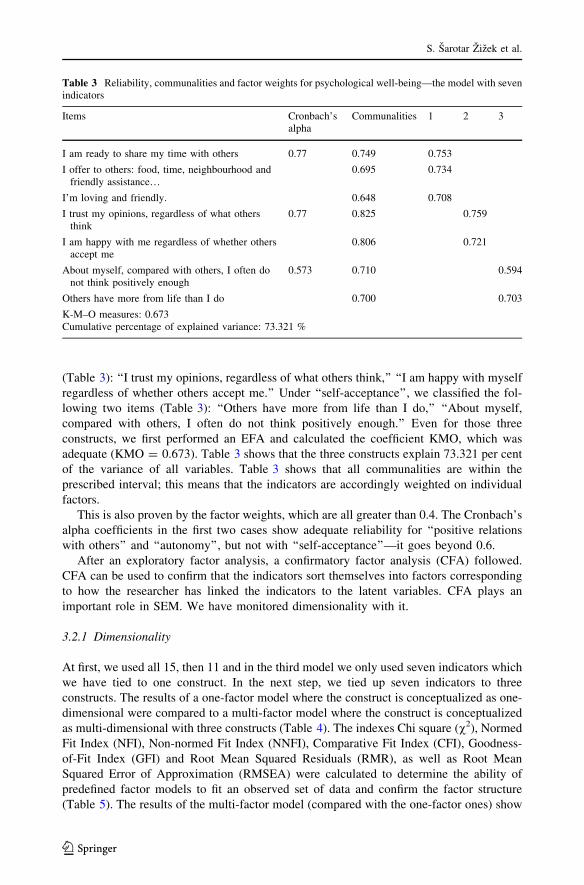
(Table 3): ‘‘I trust my opinions, regardless of what others think,’’ ‘‘I am happy with myself
regardless of whether others accept me.’’ Under ‘‘self-acceptance’’, we classified the fol-
lowing two items (Table 3): ‘‘Others have more from life than I do,’’ ‘‘About myself,
compared with others, I often do not think positively enough.’’ Even for those three
constructs, we first performed an EFA and calculated the coefficient KMO, which was
adequate (KMO = 0.673). Table 3 shows that the three constructs explain 73.321 per cent
of the variance of all variables. Table 3 shows that all communalities are within the
prescribed interval; this means that the indicators are accordingly weighted on individual
factors.
This is also proven by the factor weights, which are all greater than 0.4. The Cronbach’s
alpha coefficients in the first two cases show adequate reliability for ‘‘positive relations
with others’’ and ‘‘autonomy’’, but not with ‘‘self-acceptance’’—it goes beyond 0.6.
After an exploratory factor analysis, a confirmatory factor analysis (CFA) followed.
CFA can be used to confirm that the indicators sort themselves into factors corresponding
to how the researcher has linked the indicators to the latent variables. CFA plays an
important role in SEM. We have monitored dimensionality with it.
3.2.1 Dimensionality
At first, we used all 15, then 11 and in the third model we only used seven indicators which
we have tied to one construct. In the next step, we tied up seven indicators to three
constructs. The results of a one-factor model where the construct is conceptualized as one-
dimensional were compared to a multi-factor model where the construct is conceptualized
as multi-dimensional with three constructs (Table 4). The indexes Chi square (v2), Normed
Fit Index (NFI), Non-normed Fit Index (NNFI), Comparative Fit Index (CFI), Goodness-
of-Fit Index (GFI) and Root Mean Squared Residuals (RMR), as well as Root Mean
Squared Error of Approximation (RMSEA) were calculated to determine the ability of
predefined factor models to fit an observed set of data and confirm the factor structure
(Table 5). The results of the multi-factor model (compared with the one-factor ones) show
Table 3 Reliability, communalities and factor weights for psychological well-being—the model with sevenindicators
Items Cronbach’salpha
Communalities 1 2 3
I am ready to share my time with others 0.77 0.749 0.753
I offer to others: food, time, neighbourhood andfriendly assistance…
0.695 0.734
I’m loving and friendly. 0.648 0.708
I trust my opinions, regardless of what othersthink
0.77 0.825 0.759
I am happy with me regardless of whether othersaccept me
0.806 0.721
About myself, compared with others, I often donot think positively enough
0.573 0.710 0.594
Others have more from life than I do 0.700 0.703
K-M–O measures: 0.673Cumulative percentage of explained variance: 73.321 %
S. Sarotar Zizek et al.
123
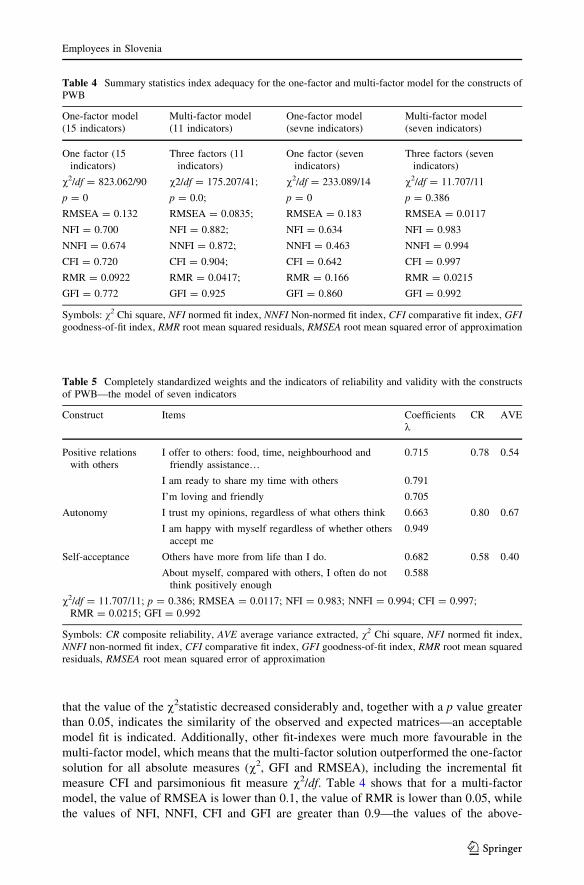
that the value of the v2statistic decreased considerably and, together with a p value greater
than 0.05, indicates the similarity of the observed and expected matrices—an acceptable
model fit is indicated. Additionally, other fit-indexes were much more favourable in the
multi-factor model, which means that the multi-factor solution outperformed the one-factor
solution for all absolute measures (v2, GFI and RMSEA), including the incremental fit
measure CFI and parsimonious fit measure v2/df. Table 4 shows that for a multi-factor
model, the value of RMSEA is lower than 0.1, the value of RMR is lower than 0.05, while
the values of NFI, NNFI, CFI and GFI are greater than 0.9—the values of the above-
Table 4 Summary statistics index adequacy for the one-factor and multi-factor model for the constructs ofPWB
One-factor model(15 indicators)
Multi-factor model(11 indicators)
One-factor model(sevne indicators)
Multi-factor model(seven indicators)
One factor (15indicators)
Three factors (11indicators)
One factor (sevenindicators)
Three factors (sevenindicators)
v2/df = 823.062/90 v2/df = 175.207/41; v2/df = 233.089/14 v2/df = 11.707/11
p = 0 p = 0.0; p = 0 p = 0.386
RMSEA = 0.132 RMSEA = 0.0835; RMSEA = 0.183 RMSEA = 0.0117
NFI = 0.700 NFI = 0.882; NFI = 0.634 NFI = 0.983
NNFI = 0.674 NNFI = 0.872; NNFI = 0.463 NNFI = 0.994
CFI = 0.720 CFI = 0.904; CFI = 0.642 CFI = 0.997
RMR = 0.0922 RMR = 0.0417; RMR = 0.166 RMR = 0.0215
GFI = 0.772 GFI = 0.925 GFI = 0.860 GFI = 0.992
Symbols: v2 Chi square, NFI normed fit index, NNFI Non-normed fit index, CFI comparative fit index, GFIgoodness-of-fit index, RMR root mean squared residuals, RMSEA root mean squared error of approximation
Table 5 Completely standardized weights and the indicators of reliability and validity with the constructsof PWB—the model of seven indicators
Construct Items Coefficientsk
CR AVE
Positive relationswith others
I offer to others: food, time, neighbourhood andfriendly assistance…
0.715 0.78 0.54
I am ready to share my time with others 0.791
I’m loving and friendly 0.705
Autonomy I trust my opinions, regardless of what others think 0.663 0.80 0.67
I am happy with myself regardless of whether othersaccept me
0.949
Self-acceptance Others have more from life than I do. 0.682 0.58 0.40
About myself, compared with others, I often do notthink positively enough
0.588
v2/df = 11.707/11; p = 0.386; RMSEA = 0.0117; NFI = 0.983; NNFI = 0.994; CFI = 0.997;RMR = 0.0215; GFI = 0.992
Symbols: CR composite reliability, AVE average variance extracted, v2 Chi square, NFI normed fit index,NNFI non-normed fit index, CFI comparative fit index, GFI goodness-of-fit index, RMR root mean squaredresiduals, RMSEA root mean squared error of approximation
Employees in Slovenia
123
mentioned indices show that among the four models (the one-factor with 15 indicators, the
multi-factor with 11 indicators, the one-factor with seven indicators and the multi-factor
with seven indicators), the multi-factor model with seven indicators is the most appropriate
one.
In that model, we used only 7 out of 11 indicators for the three-factor model, which
were the results of the EFA (15 indicators) that were included in the questionnaire in
accordance with the theoretical basis (Ryff and Keyes, 1995). Indices v2, NFI, NNFI, CFI,
GFI and RMR, as well as RMSEA, are also more appropriate for a multi-factor model with
seven indicators than for a multi-factor model with 11 indicators. This fact is presented in
Table 4.
The hypothesis that the PWB model is multidimensional (H2: The PWB model is
multidimensional can be confirmed on the basis of the model fit indices, which are pre-
sented in Table 4.
3.2.2 Reliability and Validity
Further on we examined the reliability and validity of scales. The reliability for the three
constructs shown in Table 4 was assessed with composite reliability (CR) measures, while
convergent validity was measured by the indicator Average Variance Extracted (AVE).
The primary reason for using seven indicators and three constructs was the inadequate
values of the AVE for two important constructs in the model with 11 indicators: for the
construct ‘‘positive relations with others’’ it was AVE 0.45 and for ‘‘self-acceptance’’ it
was 0.43 (AVE \ 0.5).
For the multi-factor model with seven indicators, Table 5 shows that in two constructs,
AVE values were greater than 0.5 (at ‘‘positive relations with others’’ and ‘‘autonomy’’)
and therefore those two constructs were convergent valid. For the construct ‘‘self-accep-
tance’’ the AVE value was lower than 0.5. However, CR was greater than AVE for all
constructs. Moreover, factor loadings for all the indicators are statistically significant and
greater then 0.5, which also means that convergent validity was established. We must
mention that Hair et al. (1998) suggest a minimal level for loadings ±0.30; loadings,
greater than ±0.40 are labelled as important, while loadings greater than ±0.50 are
labelled as significant.
We also made a simulation by excluding the construct that does not meet the convergent
validity criterion. If we would excluded the construct ‘‘self-acceptance’’ there would not be
any significant improvement in model fitting (v2/df = 1.188/3; p = 0.756;
RMSEA = 0.0; NFI = 0.986; NNFI = 0.967; CFI = 0.990; RMR = 0.02221;
GFI = 0.992).
For the multi-factor model with seven indicators, the values of CR indices for ‘‘positive
relations with others’’ and ‘‘autonomy’’ were greater than 0.7, which means that these two
constructs are reliable, while the value of CR for ‘‘self-acceptance’’ was 0.58—lower than,
but very close to, 0.6. As noted by Hair et al. (2006), CR values should be greater than 0.6.
We have assessed discriminant validity via the Fornell–Larcker test, which suggests that
the square root of the AVE for a given construct must be greater than the standardized
correlation of the given construct with each of the other construct.
The Fornell–Larcker criterion is met in all cases, since the squared roots of AVE are
0.735, 0.819 and 0.632 (obtained by the root extraction of the values in the last column in
Table 5), while the completely standardized correlations between constructs are equal to
S. Sarotar Zizek et al.
123
0.375, 0.208 and 0.220 (Table 6) and are therefore smaller than the average of the elim-
inated variances between pairs of constructs (Table 6).
4 Discussion
The above-described procedure thus results in seven indicators and three constructs of
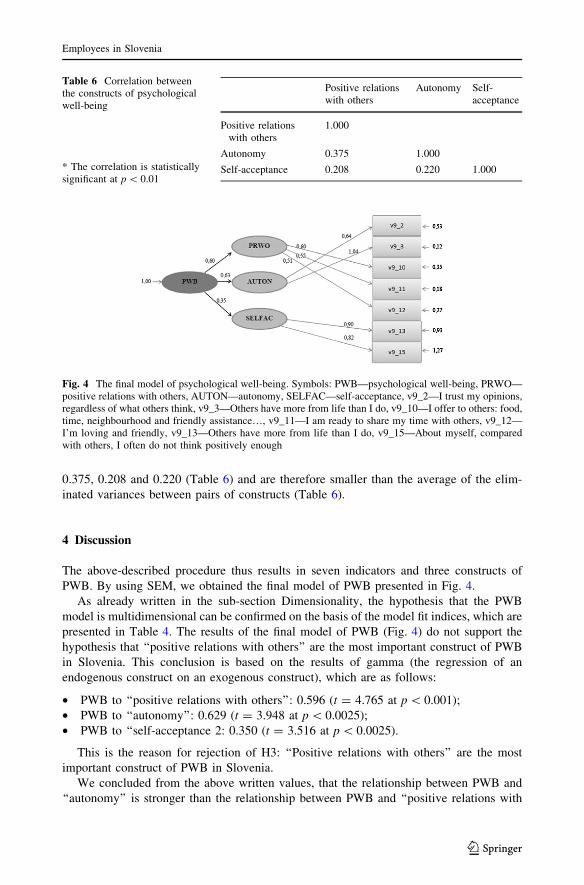
PWB. By using SEM, we obtained the final model of PWB presented in Fig. 4.
As already written in the sub-section Dimensionality, the hypothesis that the PWB
model is multidimensional can be confirmed on the basis of the model fit indices, which are
presented in Table 4. The results of the final model of PWB (Fig. 4) do not support the
hypothesis that ‘‘positive relations with others’’ are the most important construct of PWB
in Slovenia. This conclusion is based on the results of gamma (the regression of an
endogenous construct on an exogenous construct), which are as follows:
• PWB to ‘‘positive relations with others’’: 0.596 (t = 4.765 at p \ 0.001);
• PWB to ‘‘autonomy’’: 0.629 (t = 3.948 at p \ 0.0025);
• PWB to ‘‘self-acceptance 2: 0.350 (t = 3.516 at p \ 0.0025).
This is the reason for rejection of H3: ‘‘Positive relations with others’’ are the most
important construct of PWB in Slovenia.
We concluded from the above written values, that the relationship between PWB and
‘‘autonomy’’ is stronger than the relationship between PWB and ‘‘positive relations with
Table 6 Correlation betweenthe constructs of psychologicalwell-being
* The correlation is statisticallysignificant at p \ 0.01
Positive relationswith others
Autonomy Self-acceptance
Positive relationswith others
1.000
Autonomy 0.375 1.000
Self-acceptance 0.208 0.220 1.000
Fig. 4 The final model of psychological well-being. Symbols: PWB—psychological well-being, PRWO—positive relations with others, AUTON—autonomy, SELFAC—self-acceptance, v9_2—I trust my opinions,regardless of what others think, v9_3—Others have more from life than I do, v9_10—I offer to others: food,time, neighbourhood and friendly assistance…, v9_11—I am ready to share my time with others, v9_12—I’m loving and friendly, v9_13—Others have more from life than I do, v9_15—About myself, comparedwith others, I often do not think positively enough
Employees in Slovenia
123
others.’’ The results of the corresponding t test (testing the hypothesis that the structural
coefficient is equal to zero) allow us to report that the relationship between PWB and
constructs are statistically significant.
Further, we found that the ‘‘autonomy’’ is based on items, which speak about a person’s
dependence/independence, internal/external control position, individualization, self-
determination etc. The last dimension—a positive relationship with others—is expressed
with statements about the family lives of an individual and their relationships with the local
and wider environment, as well as the quality of relationships etc.
This is underlined by the following consideration that individuals may, for example,
prefer ‘‘autonomy’’ and participation in decision-making at the workplace, the market and
also in politics. These are preferences that go beyond the expected results. People within
institutions may experience a higher level well-being, if they believe that they are being
considered in a fair and equitable manner (Frey and Stutzer 2005), that is why we can
identify the procedural benefits, such as the well-being of people, obtained with the life and
functioning under the institutional processes, which contributing to the positive feeling of
their own, focused on the innate needs for ‘‘autonomy’’, relatedness, and competence (Frey
et al. 2004).
In the context of the first dimension—‘‘self-acceptance’’—we have merged items with
which we try to assess the individual and his relationship with himself from different
perspectives (in terms of the past, benchmarks, etc.). In Slovenia, ‘‘self-acceptance’’
determines the minimum of employees’ PWB.
5 Conclusion
A number of researchers, including van Dierendonck et al. (2008), Kafka and Kozma
(2002), Springer and Hauser (2006), Springer et al. (2006), have tested Ryff’s Scales of
PWB. For example, van Dierendonck et al. (2008) carried out their research in Spain and
Columbia. The result of their survey showed that four out the six dimensions indeed
overlapped considerably and that the model which fit the data best was the six factor model
with one underlying second order well-being factor, hereby confirming Ryff’s model in a
non-Anglo-Saxon culture.
By applying Ryff’s Scales of PWB as a research instrument, this article presents the
results of an empirical research regarding the PWB of employees in organizations in
Slovenia. In order to obtain relevant results, the questionnaire for PWB was developed and
adapted to fit the specifics of Slovenian circumstances. The final measurement instrument
used in Slovenia for PWB was thus a design that consisted of three items for each element
of PWB; the ‘purpose in life’ element was not included (i.e. ‘self-acceptance’—3 items,
‘personal growth’—3 items, ‘environmental mastery’—3 items, ‘autonomy’—3 items,
‘positive relations with others’—3 items and ‘purpose in life’—0 items).
The results of data analysis let us confirm that employees in Slovenia want to grow
personally. This means that in crises employees want to be competitive based on their:
• Professional development, which includes the acquired level of both formal and
informal education, i.e. one’s formation by education, occupation choice, training and
vocational training, ensuring promotion at work;
• Personality development, which includes the development of personality features in a
wider sense, intertwining one’s personality characteristics, values, predispositions,
S. Sarotar Zizek et al.
123

motives, viewpoints, interests, the formation of an integral personality together with
one’s skills, knowledge and working results, environment and self-will; and
• Working development (also known as working career), which means the acceptance and
success in the chosen activity. It is bound to a certain working environment in which
one works. It reflects one’s success at work within a smaller group one belongs to.
Working development thus applies to one’s position or function and is affirmed by an
individual’s working results (Sarotar Zizek et al. 2012).
In addition, the article shows the procedure of building a PWB model based on the Ryff
and Keyes multidimensional model of well-being, which was adapted to the studied
population. By using factor analysis, we confirmed that this PWB model is indeed mul-
tidimensional. The final model of PWB of employees in organizations in Slovenia thus
consists of three constructs, i.e. ‘positive relations with others’, ‘autonomy’, and ‘self-
acceptance’. The results show that ‘autonomy’ is the most important construct of PWB in
Slovenia.
5.1 Contributions to Theory
The present study has investigated the PWB of employees in times of the economic crisis,
which in Slovenia started in 2008 and still had an impact in 2011 when our survey was
conducted.
This study of PWB focuses on employees because this is economically beneficial for
individuals, organizations and society (Diener and Seligman 2004). We must admit that
this current crisis is not only financial and economic one, but it is predominantly a social
one. This means that its causes lie in a too poor and too un-holistic responsibility of those
who have the influence (Sarotar Zizek and Mulej 2010). The foundations of each society
consist of individuals and their PWB. This also represents an essential part of the concept
of SR, which is based on personal responsibility. SR can be a way to solve the current crisis
and to prevent the occurrence of similar ones in the future. In order to deal with this task
effectively, the concept of SR should be upgraded in a way to be based upon: (1) increasing
objective welfare, (2) PWB, (3) prevention of its negative and strengthening of its positive
influences on natural and social environment, including its positive influence on more
holistic subjective starting points of people, and (4) requisite wholeness of people’
behavior (Sarotar Zizek and Mulej 2010 and 2013). Therefore, PWB is important for
organizations because of the interrelatedness of PWB and SR, i.e. SR supports PWB and
vice versa and therefore the innovative synergy between PWB and SR leads to a solution of
crises (Sarotar Zizek and Mulej 2013).
5.2 Contributions to Practice
Employees’ well-being, including autonomy, positive relations with others and self-
acceptance, has important implications for many positive psychological interventions and
areas. These areas are life-coaching, well-being therapy, mentoring, leadership, fulfillment,
personal and personality development, personal and SR. All these then impact the
employee productivity and efficiency since autonomy, positive relations with others and
self-acceptance lead to health and happiness of people (Frederickson 2000) and, hence,
also of employees.
Employees in Slovenia
123
5.3 Limitations and Further Research
The limitations of our study are related to the respondents. Namely, we studied employees
in various organizations that operate in the times of crisis. Further research should be
directed to the study of employees in favorable economic conditions. Well-being of the
unemployed individuals remains completely open to further research.
References
Aaker, D. A., Kumar, V., & Day, G. S. (2001). Marketing research (7th ed.). New York: Wiley.Allport, G. W. (1961). Pattern and growth in personality. New York: Holt, Rinehart & Winston.Appelbaum, E., Bailey, T., Berg, P., & Kalleberg, A. (2000). Manufacturing advantage: Why high per-
formance work systems pay off. New York: Cornell University Press.Boselie, P., Brewster, C., & Paauwe, J. (2009). In search of balance-managing the dualities of HRM: An
overview of the issues. Personnel Review, 38(5), 461–471.Boxall, P., & Macky, K. (2009). Research and theory on high-performance work systems: Progressing the
high-involvement stream. Human Resource Management Journal, 19(1), 3–23.Boxall, P., & Purcell, J. (2008). Strategy and human resource management (2nd ed.). Basingstoke: Palgrave
Macmillan.Buhler, C. (1935). The curve of life as studies in biographies. Journal of Applied Psychology, 43, 653–673.Buhler, C., & Marschak, M. (1968). Basic tendencies of human life. In C. Buhler & F. Massarik (Eds.), The
course of human life: a study of goals in the humanistic perspective. New York: Springer.Churchill, G. A, Jr. (1999). Marketing research: Methodological foundations. Orlando: The Dryden Press.Danna, K., & Griffin, R. W. (1999). Health and well-being in the workplace: A review and synthesis of the
literature. Journal of Management, 25(3), 357–384.DeCoster, J. (1998). Overview of Factor Analysis, http://www.stat-help.com/factor.pdf. Accessed 4 June
2012.Diener, E. & Seligman, E. P. M.(2004). Beyond money; Tovard an economy of well being. Psyhological
Science in the Public Interest, 5(1), 1–31.Donald, I., Taylor, P., & Johnson, S. (2005). Work environments, stress and productivity: An examination
using ASSET. International Journal of Stress Management, 12, 409–423.Erikson, E. H. (1959). Identity and the life cycle. New York: International Universities Press.Frederickson, B. L. (2000). Cultivating positive emotions to optimize health and well-being. Prevention &
Treatment, 3, 1–25.Fredrickson, B. L. (1998). What good are positive emotions? Review of General Psychology, 3, 300–319.Frey, B. S., Benz, M., & Stutzer, A. (2004). Introducing procedural utility: Not only what, but also how
matters. Journal of Institutional and Theoretical Economics, 160, 377–401.Frey, B. S., & Stutzer, A. (2005). Beyond outcomes: Measuring procedural utility. Oxford Economic Papers,
57, 90–111.Garg, P., & Rastogi, R. (2009). Effect of psychological wellbeing on organizational commitment of
employees. The Icfai University Journal of Organizational Behaviour, 8(2), 42–51.Grant, A. M., Christianson, M. K., & Price, R. H. (2007). Happiness, health, or relationships? Managerial
practices and employee well-being tradeoffs. Academy of Management Perspectives, 21, 51–63.Hair, J. F., Anderson, R. E., Tatham, R. L., & Black, W. C. (1998). Multivariate data analysis (5th ed.). New
Jersey: Prentice-Hall International.Hair, J. F., Black, W. C., Babin, B. J., Anderson, R. E., & Tatham, R. L. (2006). Multivariate data analysis
(6th ed.). Uppersaddle River: Pearson Prentice Hall.Harter, J. K., Schmidt, F. L., & Keyes, C. L. M. (2003). Well-being in the workplace and its relationship to
business outcomes: A review of the Gallup studies. In C. L. M. Keyes & J. Haidt (Eds.), Flourishing:the positive person and the life well lived. Washington: American Psychological Association.
Jahoda, M. (1958). Current concepts of positive mental health. New York: Basic Books.Judge, T. A., Locke, E. A., & Durham, C. C. (1997). The dispositional causes of job satisfaction: A core
evaluations approach. Research in Organizational Behavior, 19, 151–188.Jung, C. G. (1933). Modern man in search of a soul. New York: Harcourt.
S. Sarotar Zizek et al.
123
Kafka, G. J., & Kozma, A. (2002). The construct validity of Ryff’s scales of psychological well-being(SPWB) and their relationship to measures of subjective well-being. Social Indicators Research, 57(2),171–190.
Kopelman, R. E., Brief, A. P., & Guzzo, R. A. (1990). The role of climate and culture in productivity. In B.Schneider (Ed.), Organizational climate and culture (pp. 282–318). San Francisco, CA: Jossey-Bass.
Kopperud, K. H., & Vittersø, J. (2008). Distinctions between Hedonic and Eudaimonic Well-Being: Resultsfrom a Day Reconstruction Study Among Norwegian Job Holders. Journal of Positive Psychology, 3,174–181.
Malhotra, N. & Birks D. (2003). Marketing research—An applied approach—FT Prentice Hall MonthlyDigest of Statistic—No. 697, January 2004, Oxford Bulletin of Economic and Statistics, Vol. 66,February 2004, 1.
Maslow, A. H. (1968). Toward a psychology of being (2nd ed.). New York: Van Nostrand.Milfelner, B. (2012). Empiricni model vpliva marketinskih virov na uspesnost podjetij v Sloveniji:
znanstvena monografija. Maribor: Ekonomsko-poslovna fakulteta.Musek, J. (2005). Psiholoske in kognitivne studije osebnosti. Ljubljana: Znanstveni institut Filozofske
fakultete.Musek, J. (2008). Dimenzije psihicnega blagostanja. Anthropos, 1(2), 139–160.Nedelko, Z. (2009). The impact of personal values on leadership style. Research in Social Change, 1(3),
41–66.Neugarten, B. L. (1968). The awareness of middle age. In B. L. Neugarten (Ed.), Middle age and aging (pp.
93–98). Chicago: University of Chicago Press.Nishii, L., & Wright, P. (2008). Variability within organizations: Implications for strategic human resource
management. In D. B. Smith (Ed.), The people make the place: Dynamic linkages between individualsand organizations (pp. 225–248). New York: Taylor and Francis Group.
Ostroff, C., & Bowen, D. E. (2000). Moving HR to a higher level: HR practices and organizationaleffectiveness. In K. J. Klein & S. Kozlowski (Eds.), Multilevel theory, research, and methods inorganizations (pp. 211–257). San Francisco: Jossey-Bass.
Ostroff, C., Kinicki, A. J., & Tamkins, M. M. (2003). Organizational culture and climate. In W. C. Borman,D. R. Ilgen, & R. J. Klimoski (Eds.), Handbook of psychology (Vol. 12, pp. 565–593). Hoboken, NJ:Wiley.
Paauwe, J. (2009). HRM and performance: Achievements, methodological issues and prospects. Journal ofManagement Studies, 46(1), 129–155.
Peccei, R. (2004). Human resource management and the search for the happy workplace. Inaugural address,Rotterdam: Erasmus Research Institute of Management (ERIM).
Purcell, J. & Kinnie, N. (2007). HRM and business performance. In: The oxford handbook Danna, K. &Griffin, R.W., Health and well-being in the workplace: A review and synthesis of the literature. Journalof Management 25(3), 357–384.
Purcell, J., & Kinnie, N. (2007b). HRM and business performance. In P. Boxall, J. Purcell, & P. Wright(Eds.), The oxford handbook of human resource management (pp. 533–551). New York: OxfordUniversity Press.
Ramsay, H., Scholarios, D., & Harley, B. (2000). Employees of high-performance work systems: Testinginside the black box. British Journal of Industrial Relations, 38(4), 501–531.
Robertson, I., & Tinline, G. (2008). Understanding and improving psychological well-being for individualand organizational effectiveness. In A. Kinder, R. Hughes, & C. L. Cooper (Eds.), Employee well-being support: A workingplace resource. West Sussex: Wiley.
Rogers, C. D. (1961). On becoming a person. Boston: Houghton Mifflin.Ryff, C. D. (1989). Happiness is everything, or is it? Explorations on the meaning of psychological well-
being. Journal of Personality and Social Psychology, 57, 1069–1081.Ryff, C. D., & Keyes, C. L. M. (1995). The structure of psychological well-being revisited. Journal of
Personality and Social Psychology, 69, 719–727.Sarotar Zizek, S., & Mulej, M. (2010). Druzbena odgovornost na temelju zadostne in potrebne celovitosti
posameznikov ter njihovega blagostanja—mozen odgovor na financno, gospodarsko in druzbeno krizoiz leta 2008 (social responsibility based on requisite holism of individuals and their prosperity: Possibleanswer to the financial, economic, and social crisis of 2008). Nase gospodarstvo, 56(3/4), 19–32.
Sarotar Zizek, S., & Mulej, M. (2013). Social responsibility: A way of requisite holism of humans and theirwell-being. Kybernetes: The International Journal of Systems and Cybernetics, 42(2), 318–335.
Sarotar Zizek, S., Mulej, M., Potocnik, A., & Kalamar, M. (2012). Personal and personality development asbasis of succesful employee diversity and well-being management. USA-China business review, 11(1),114–130.
Employees in Slovenia
123
Sparrow, P. R. (2001). Developing diagnostics for high performance organization cultures. In: The inter-national handbook of organizational culture and climate (pp. 85–106). Chichester: John Wiley andSons Ltd.
Springer, K. W., & Hauser, R. M. (2006). An assessment of the construct validity of Ryff’s scales ofpsychological well-being: Method, mode, and measurement effects. Social Science Research, 35(4),1080–1102.
Springer, K. W., Hauser, R. M., & Freese, J. (2006). Bad news indeed for Ryff’s six-factor model of well-being. Social Science Research, 35(4), 1120–1131.
Tesluk, P., Hofmann, D., & Quigley, N. (2002). Integrating the linkages between organizational culture andindividual outcomes at work. In S. Sonnentag (Ed.), Psychological management of individual per-formance (pp. 441–469). Chichester: Wiley.
van de Voorde, K. (2009). HRM, employee well-being and organizational performance: A balanced per-spective. Middelburg: Karina van de Voorde.
van Dierendonck, D., Dıaz, D., Rodrıguez-Carvajal, R., Blanco, A., & Moreno-Jimenez, B. (2008). Ryff’ssix-factor model of psychological well-being: A Spanish exploration. Social indicators resarch, 87,473–479.
Wright, T. A., & Cropanzano, R. (2004). Psychological well-being and job satisfaction as predictors of jobperformance. Journal of Occupational Health Psychology, 5, 84–94.
S. Sarotar Zizek et al.
123