(empirically) understanding financial regulation amit seru
TRANSCRIPT

(Empirically) Understanding Financial Regulation
Amit Seru

Financial Regulation?
• Start with the view that regulation sometimes useful– Fragility, under-representation hypothesis…
• In my view the area with least empirical work– Compared to say empirical papers on capital structure
• Yet, after financial crisis, an area where inputs of economists needed the most
• Dodd Frank (US)• Ring Fencing (Everywhere)• Bank super-regulator (ECB)• Bank capital• …
What are the “facts” on financial regulation?
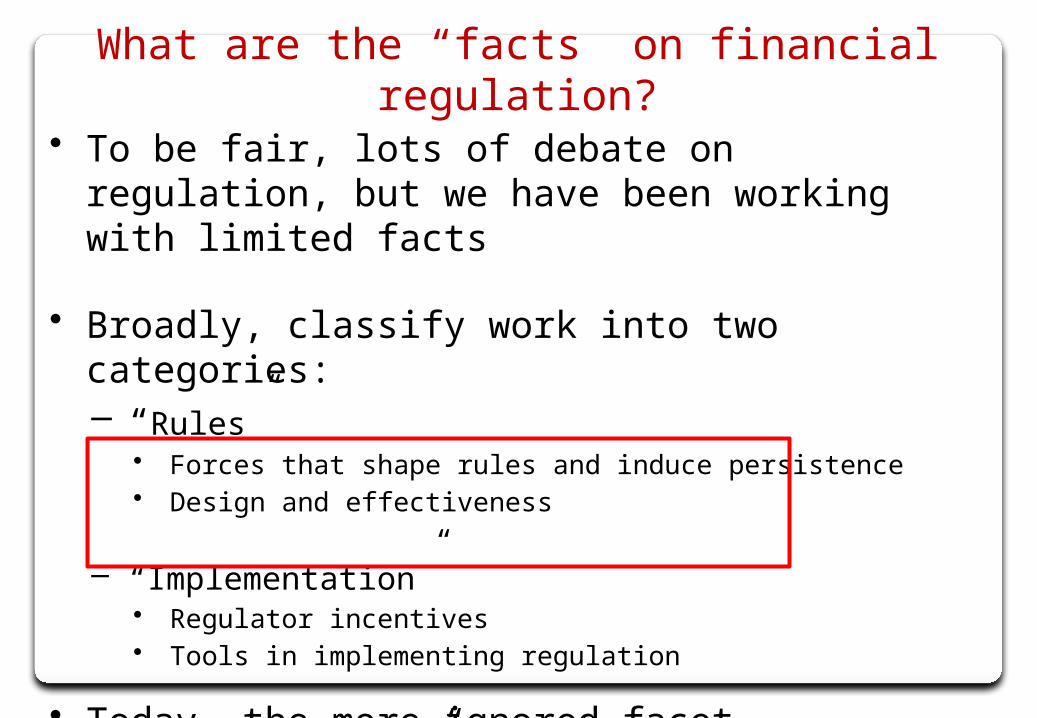
• To be fair, lots of debate on regulation, but we have been working with limited facts
• Broadly, classify work into two categories:– “Rules”
• Forces that shape rules and induce persistence• Design and effectiveness
– “Implementation”• Regulator incentives• Tools in implementing regulation
• Today, the more ignored facet -- “implementation”

• Discussion today– What factors impact effectiveness of Implementation?
• Regulator incentives and conflicts– Paper: Inconsistent Regulators
• Tools employed by regulators– Paper: The Failure of Models that predict failure
Broad Agenda

Inconsistent Regulators: Evidence from Banking
The views expressed are those of the authors and are not necessarily those of the Federal Reserve Bank of New York or the Federal Reserve System
Amit Seru
Chicago and NBER
Francesco Trebbi
UBC, CIFAR, and NBER
Sumit Agarwal
NUS
David Lucca
New York Fed

• Fixing US banking regulatory structure at center of post-crisis debate− Dodd–Frank Wall Street Reform and Consumer Protection
Act passed to address potential failures− Most impetus on activities to regulate
• The “null”: once rules in place, all regulators the same
Motivation

• But effectiveness of regulation depends also on agents who implement it− Regulators have different incentives and institutional
design (“will of the regulator” is different)• Some paid through Fees, some paid through insurance premium…
Motivation
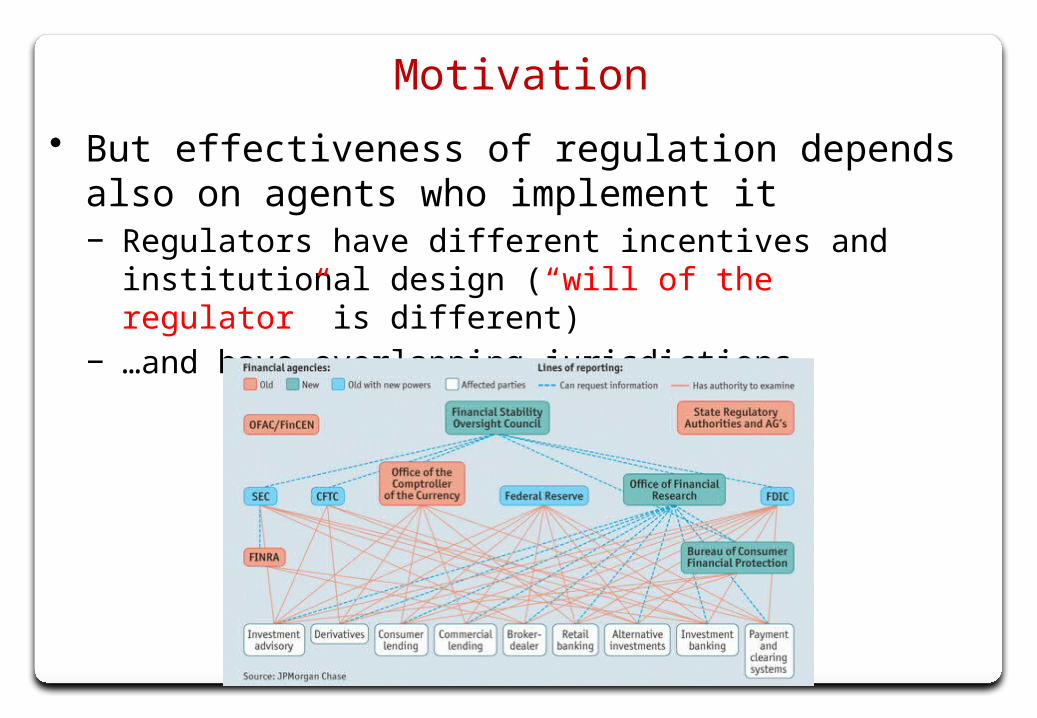
• But effectiveness of regulation depends also on agents who implement it− Regulators have different incentives and institutional
design (“will of the regulator” is different)− …and have overlapping jurisdictions…
Motivation
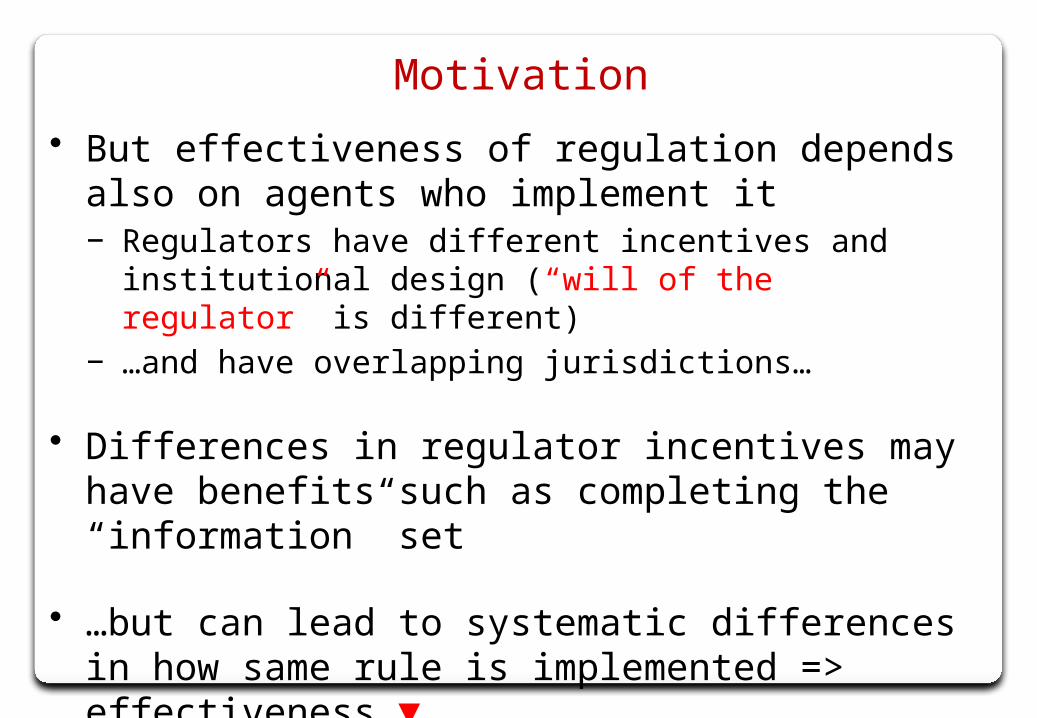
• But effectiveness of regulation depends also on agents who implement it− Regulators have different incentives and institutional
design (“will of the regulator” is different)− …and have overlapping jurisdictions…
• Differences in regulator incentives may have benefits such as completing the “information” set
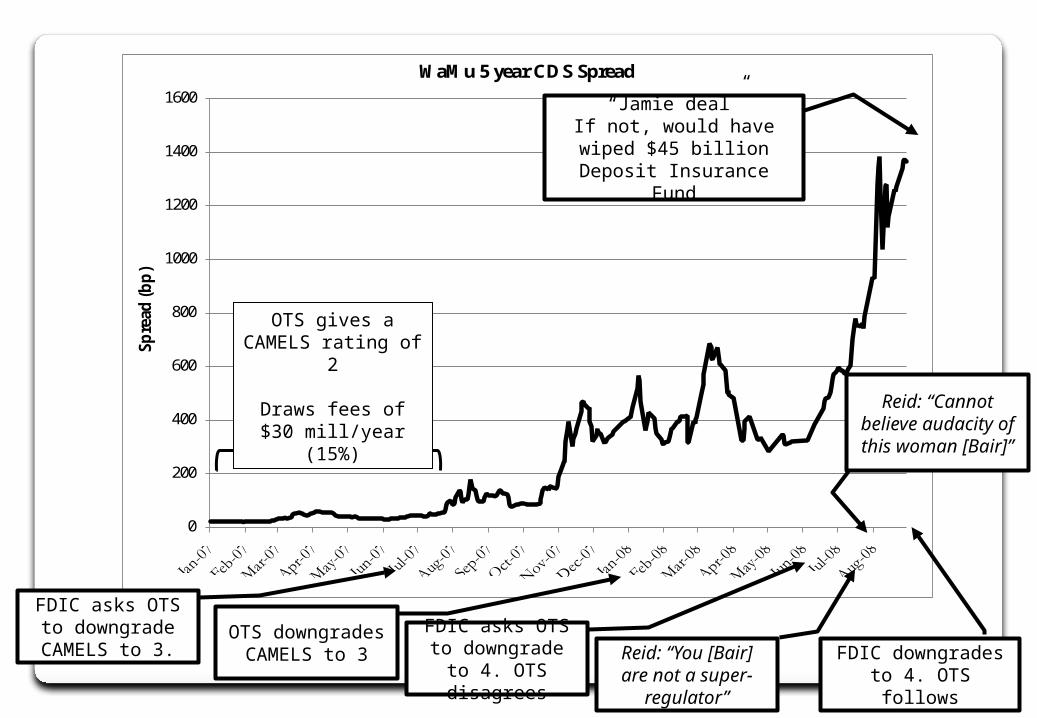
• …but can lead to systematic differences in how same rule is implemented => effectiveness ▼− Plenty of anecdotes: OTS /FDIC & Washington Mutual
Motivation
0
200
400
600
800
1000
1200
1400
1600
Spre
ad (b
p)
WaMu 5 year CDS Spread
FDIC asks OTS to downgrade
CAMELS to 3.OTS downgrades
CAMELS to 3FDIC asks OTS to downgrade to 4. OTS disagrees
Reid: “You [Bair] are not a super-
regulator”
FDIC downgrades to 4. OTS follows
“Jamie deal”If not, would have wiped $45
billion Deposit Insurance Fund
Reid: “Cannot believe audacity of this woman [Bair]”
OTS gives a CAMELS rating of 2
Draws fees of $30 mill/year (15%)

• This is an anecdote…is this behavior systematic?
• Within the context of US banking, we ask:− Do different regulators implement same rules differently?− What are the consequences of inconsistent oversight?
Motivation
• Heterogeneity of regulator actions and responsibilities makes comparisons difficult
• Heterogeneity of financial firms that are regulated, who can “select” a regulator
Empirical Challenges?
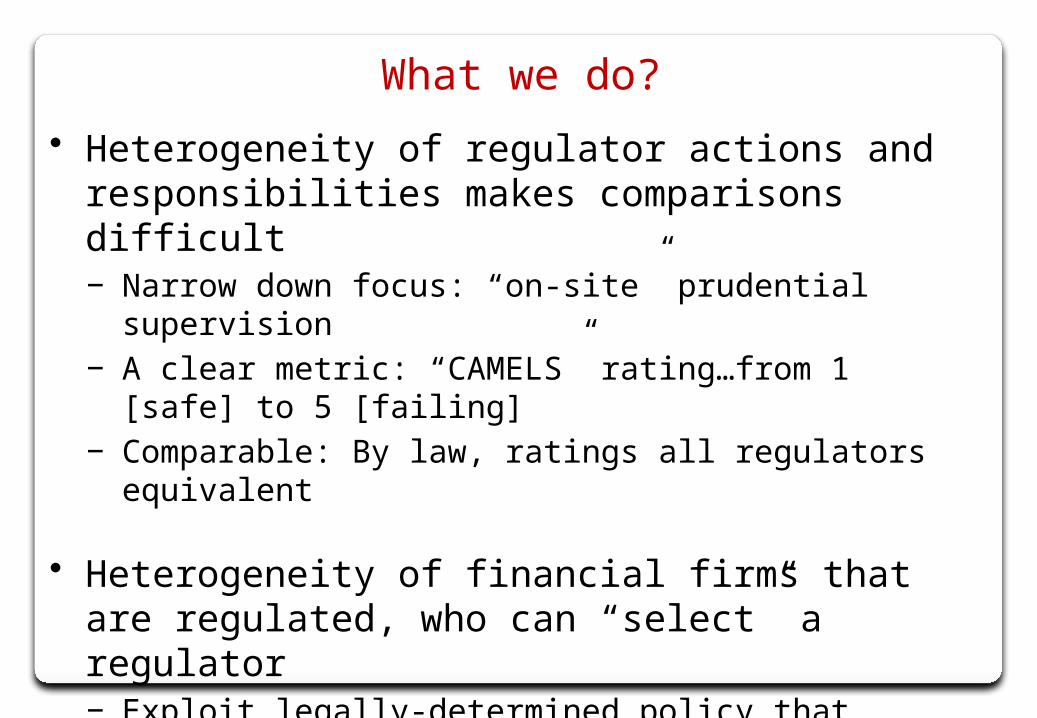
• Heterogeneity of regulator actions and responsibilities makes comparisons difficult− Narrow down focus: “on-site” prudential supervision− A clear metric: “CAMELS” rating…from 1 [safe] to 5 [failing]− Comparable: By law, ratings all regulators equivalent
• Heterogeneity of financial firms that are regulated, who can “select” a regulator− Exploit legally-determined policy that assigns federal and
state regulators to a bank at “exogenous” time intervals• Rotations pre-determined => Track differences in regulators’
behavior when dealing with same bank
What we do?
What we do?

Timing
Federal Regulator cycle
Federal=1
State Regulator cycle
Federal=0
... …
• CAMELS rating given when exam cycle starts− Typically 2-3 weeks onsite; total of more than 50 men/
women workday − Report prepared/discussed within a quarter

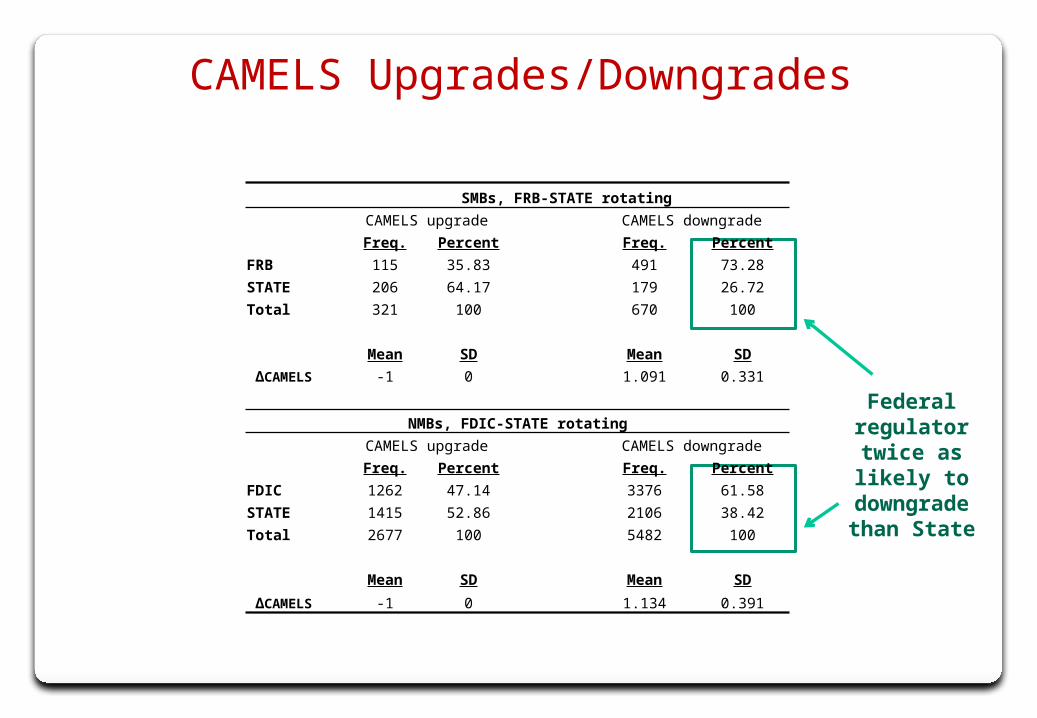
CAMELS Upgrades/Downgrades
SMBs, FRB-STATE rotating
CAMELS upgrade CAMELS downgrade
Freq. Percent Freq. Percent
FRB 115 35.83 491 73.28
STATE 206 64.17 179 26.72
Total 321 100 670 100
Mean SD Mean SD
∆CAMELS -1 0 1.091 0.331
NMBs, FDIC-STATE rotating
CAMELS upgrade CAMELS downgrade
Freq. Percent Freq. Percent
FDIC 1262 47.14 3376 61.58
STATE 1415 52.86 2106 38.42
Total 2677 100 5482 100
Mean SD Mean SD
∆CAMELS -1 0 1.134 0.391
CAMELS Upgrades/Downgrades
Federal regulator twice
as likely to downgradethan State
SMBs, FRB-STATE rotating
CAMELS upgrade CAMELS downgrade
Freq. Percent Freq. Percent
FRB 115 35.83 491 73.28
STATE 206 64.17 179 26.72
Total 321 100 670 100
Mean SD Mean SD
∆CAMELS -1 0 1.091 0.331
NMBs, FDIC-STATE rotating
CAMELS upgrade CAMELS downgrade
Freq. Percent Freq. Percent
FDIC 1262 47.14 3376 61.58
STATE 1415 52.86 2106 38.42
Total 2677 100 5482 100
Mean SD Mean SD
∆CAMELS -1 0 1.134 0.391

CAMELS Upgrades/Downgrades
Counter-balanced by
upgradesby State
SMBs, FRB-STATE rotating
CAMELS upgrade CAMELS downgrade
Freq. Percent Freq. Percent
FRB 115 35.83 491 73.28
STATE 206 64.17 179 26.72
Total 321 100 670 100
Mean SD Mean SD
∆CAMELS -1 0 1.091 0.331
NMBs, FDIC-STATE rotating
CAMELS upgrade CAMELS downgrade
Freq. Percent Freq. Percent
FDIC 1262 47.14 3376 61.58
STATE 1415 52.86 2106 38.42
Total 2677 100 5482 100
Mean SD Mean SD
∆CAMELS -1 0 1.134 0.391
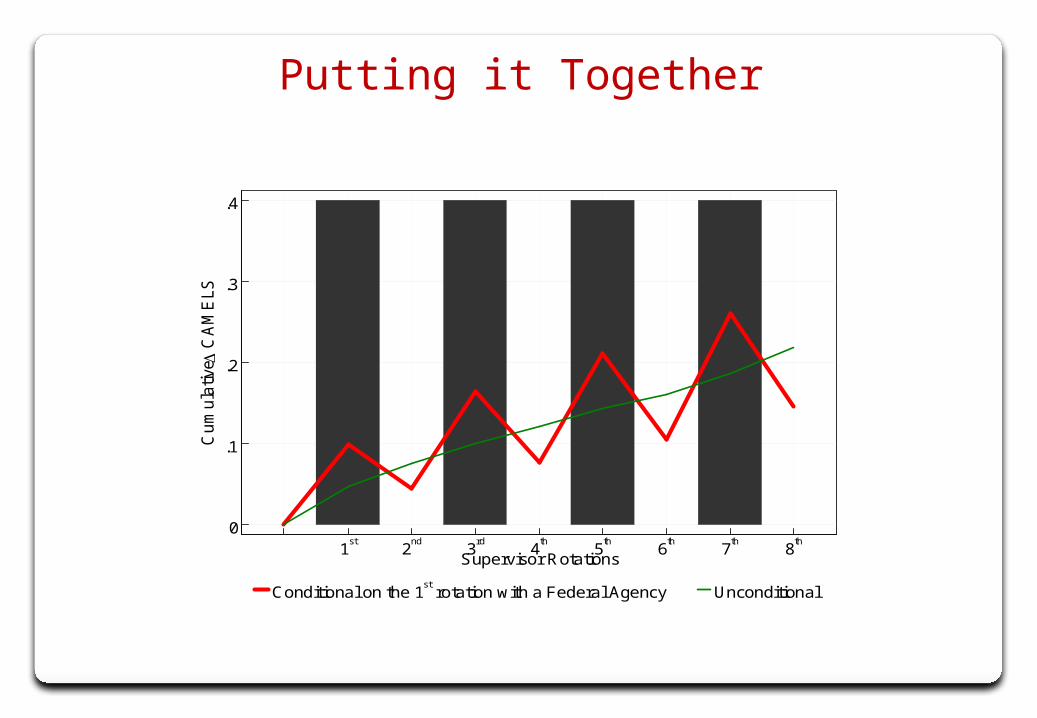
Putting it Together
0
.1
.2
.3
.4C
um
ula
tive
CA
ME
LS
1st
2nd
3rd
4th
5th
6th
7th
8th
Supervisor Rotations
Conditional on the 1st rotation with a Federal Agency Unconditional
• Higher capital, more reported losses under tougher regulator
• Present across regions: “State-Fed” spread
Additional Results

• Higher capital, more reported losses under tougher regulator
• Present across regions: “State-Fed” spread
Additional Results
0.1
.2.3
Coe
ffic
ien
t, s
tate
-age
ncy
inte
ract
ion
ALAR
AZCA
COCT
DEFL
GAIA
IDIL
INKS
KYLA
MAMD
MEMI
MNMO
MSMT
NCND
NENH
NJNM
NYOH
OKOR
PASC
SDTN
TXUT
VAWA
WIWV
WY
State
SMBs and NMBs
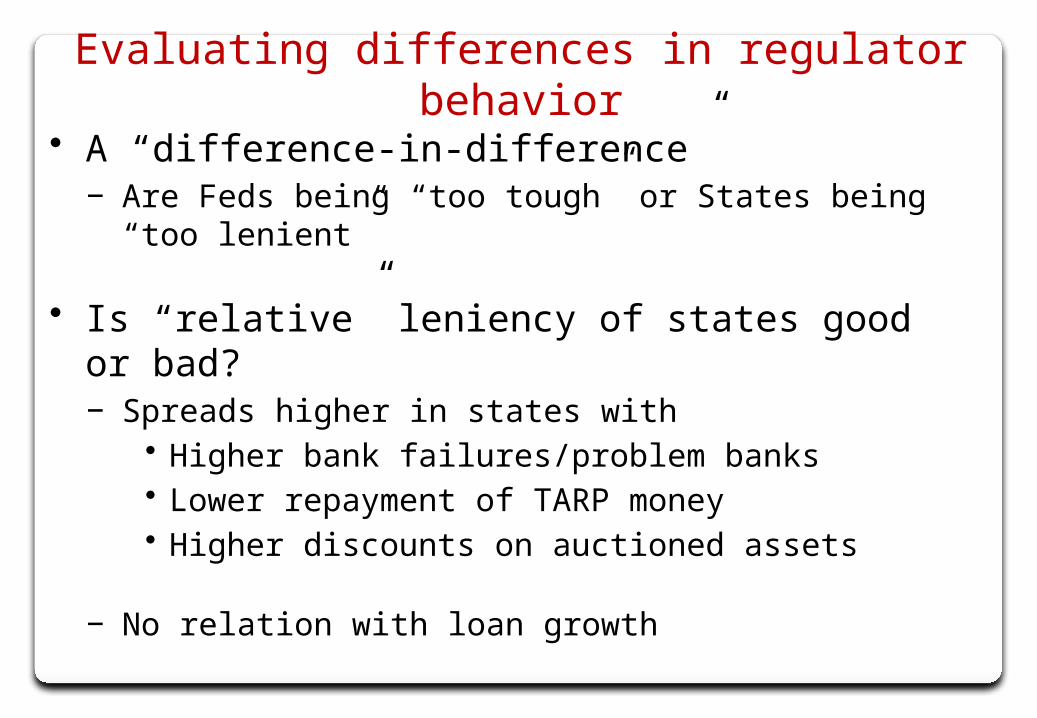
• A “difference-in-difference”− Are Feds being “too tough” or States being “too lenient”
• Is “relative” leniency of states good or bad?− Spreads higher in states with
• Higher bank failures/problem banks• Lower repayment of TARP money• Higher discounts on auctioned assets
− No relation with loan growth
Evaluating differences in regulator behavior
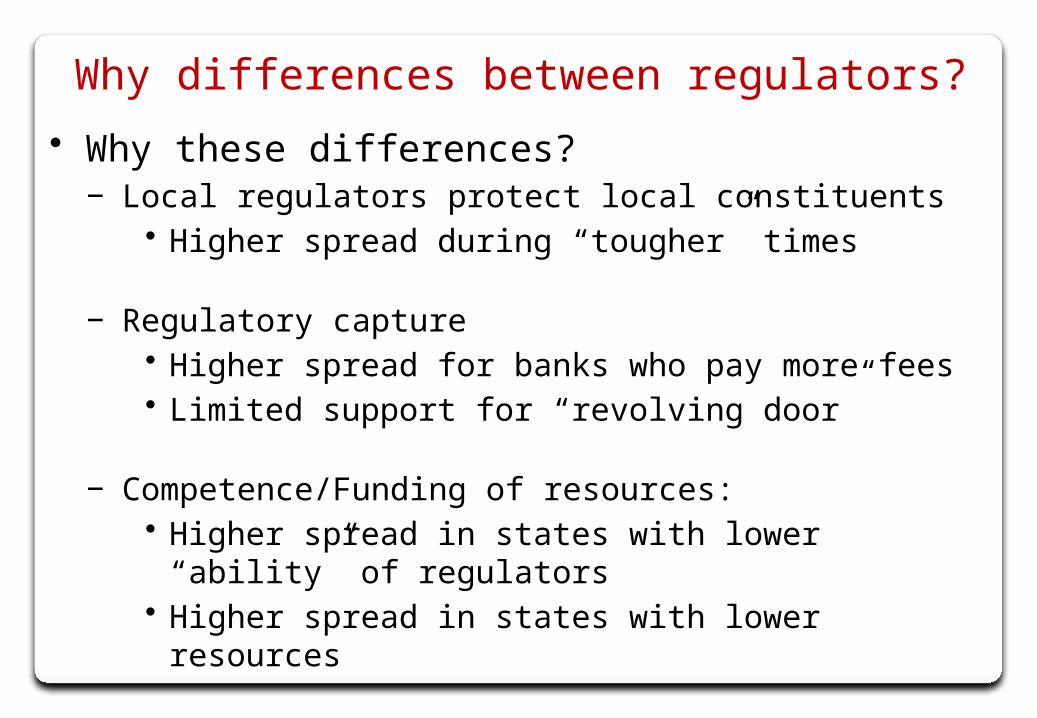
• Why these differences?− Local regulators protect local constituents
• Higher spread during “tougher” times
− Regulatory capture• Higher spread for banks who pay more fees• Limited support for “revolving door”
− Competence/Funding of resources: • Higher spread in states with lower “ability” of regulators• Higher spread in states with lower resources
Why differences between regulators?

• Are regulators consistent in implement same rules? − Theoretically ambiguous: Expertise versus bias− Empirically: Systematic differences driven by incentives
and differences related to delayed implementation
• Speak to regulatory design with multiple regulators − During tough times local regulator biased (soft sup.)
Bake in tripwires to allow for intervention by “non-local”− What are “bad times”? And, how do control rights change?
Implications: “Incentives”
• Discussion today– What factors impact effectiveness of Implementation?
• Regulator incentives and conflicts– Paper: Inconsistent Regulators
• Tools employed by regulators– Paper: The Failure of Models that predict failure
Broad Agenda
The Failure of Models that Predict Failure
Uday Rajan
Michigan
Amit Seru
Chicago and NBER
Vikrant Vig
LBS
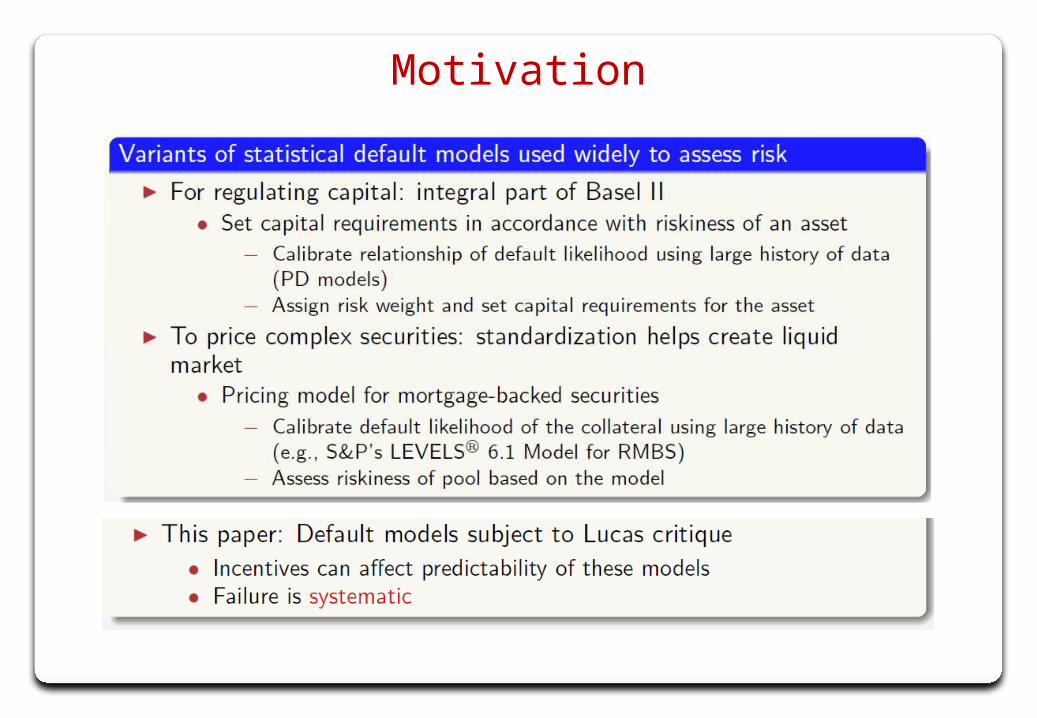
Motivation

Motivation

Motivation
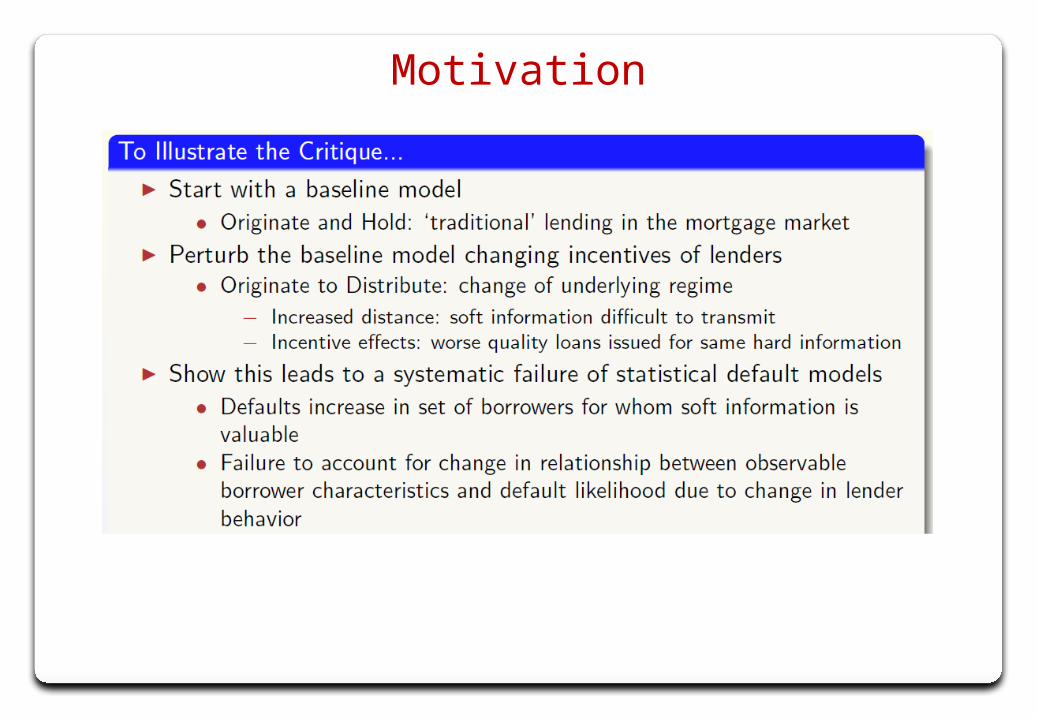
Motivation
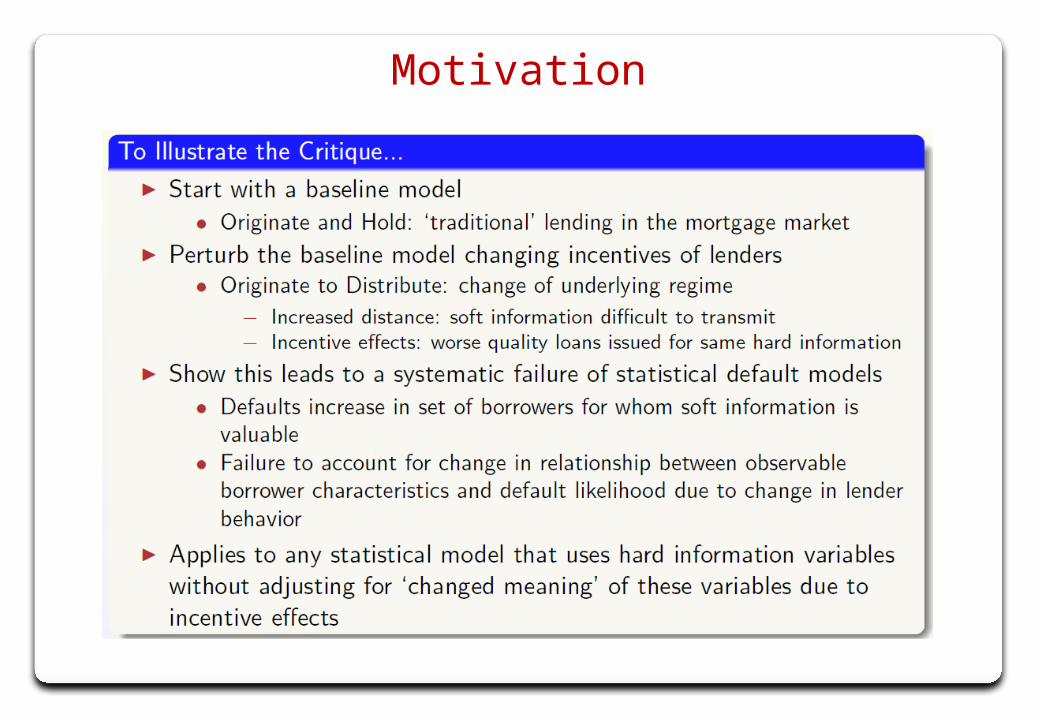
Motivation
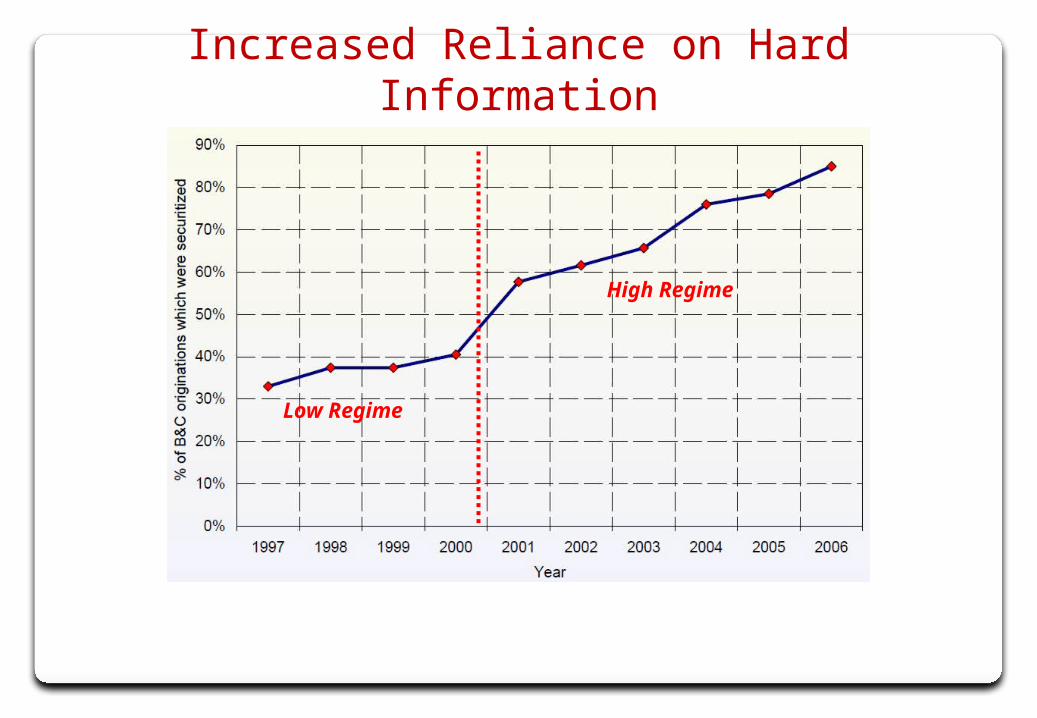
Increased Reliance on Hard Information
Low Regime
High Regime

Increased Reliance on Hard Information
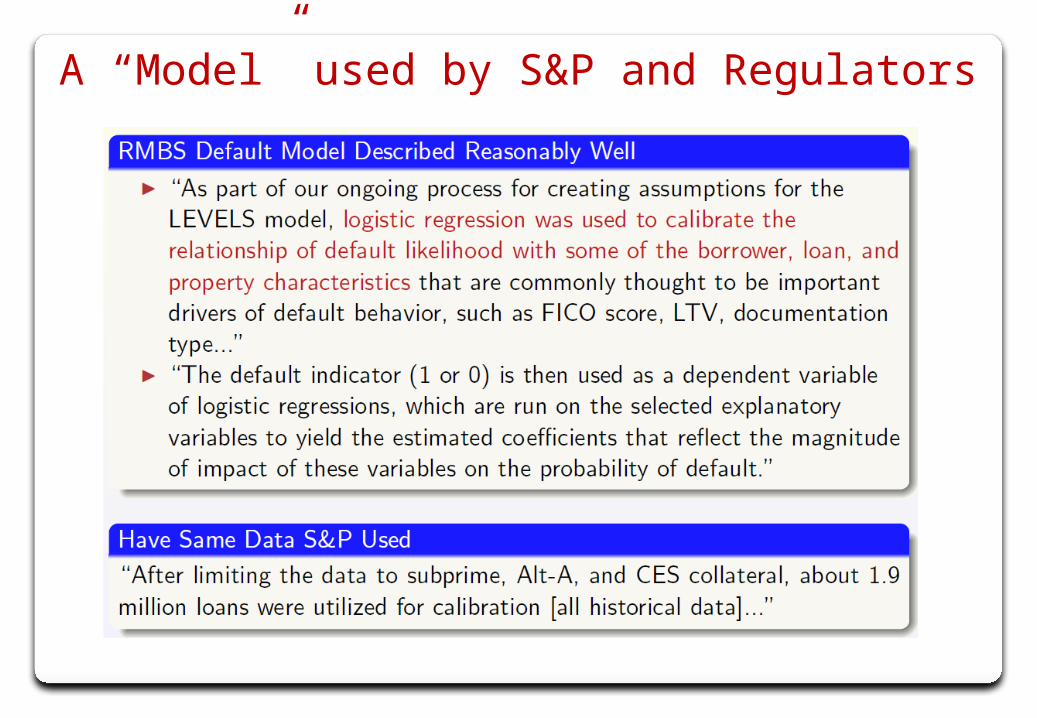
A “Model” used by S&P and Regulators

Baseline “Model”
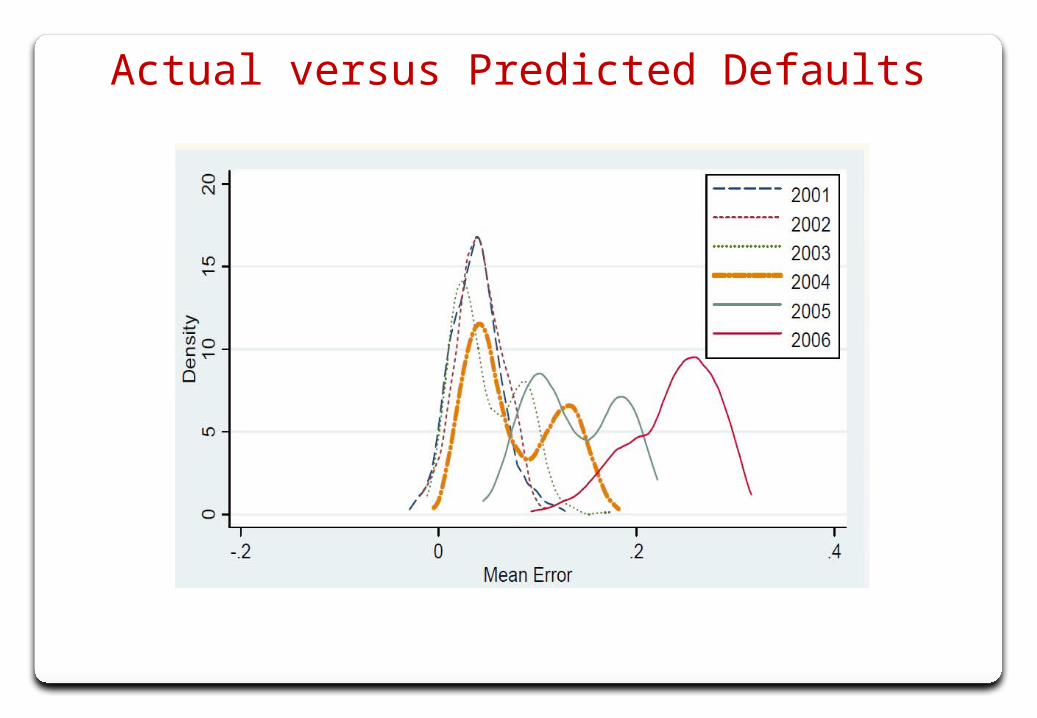
Actual versus Predicted Defaults
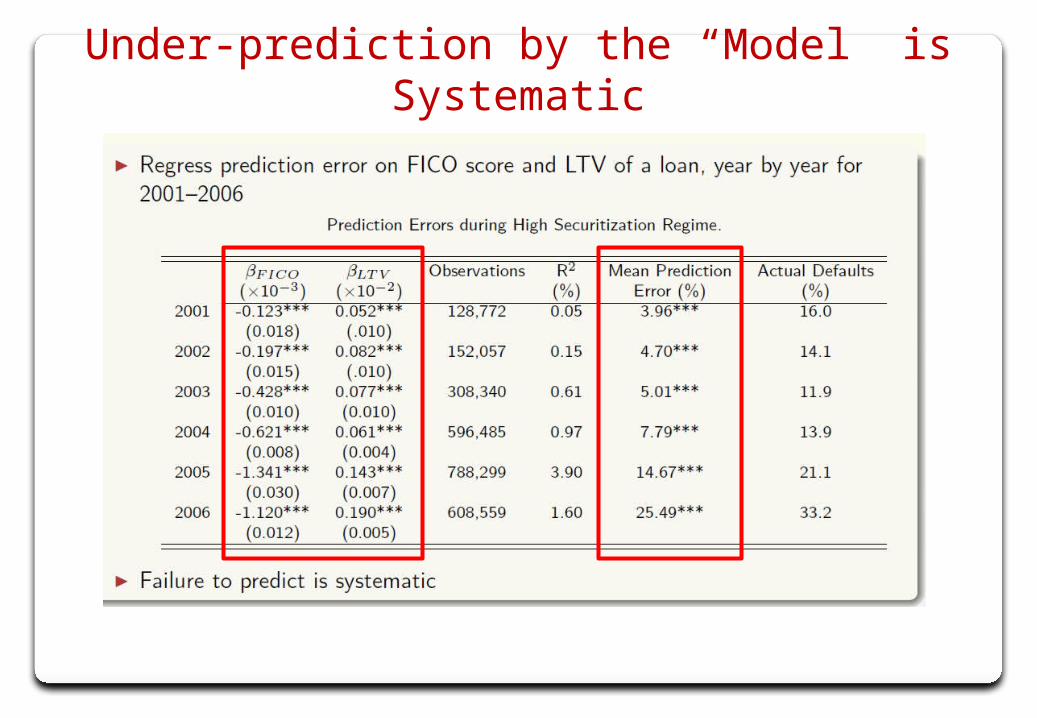
Under-prediction by the “Model” is Systematic
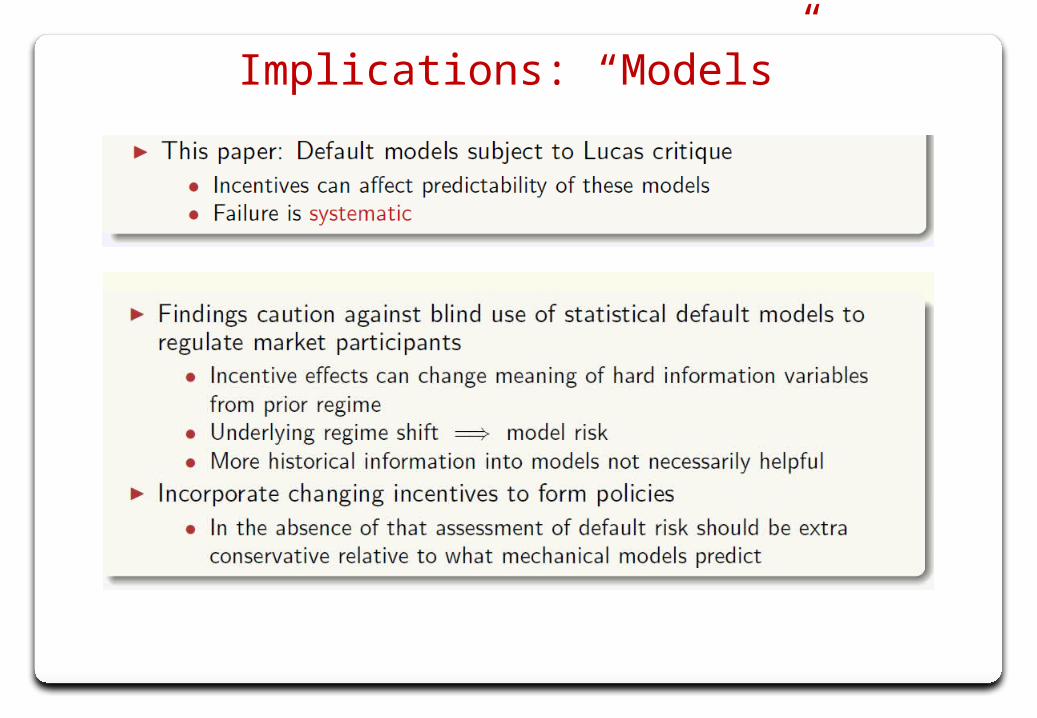
Implications: “Models”
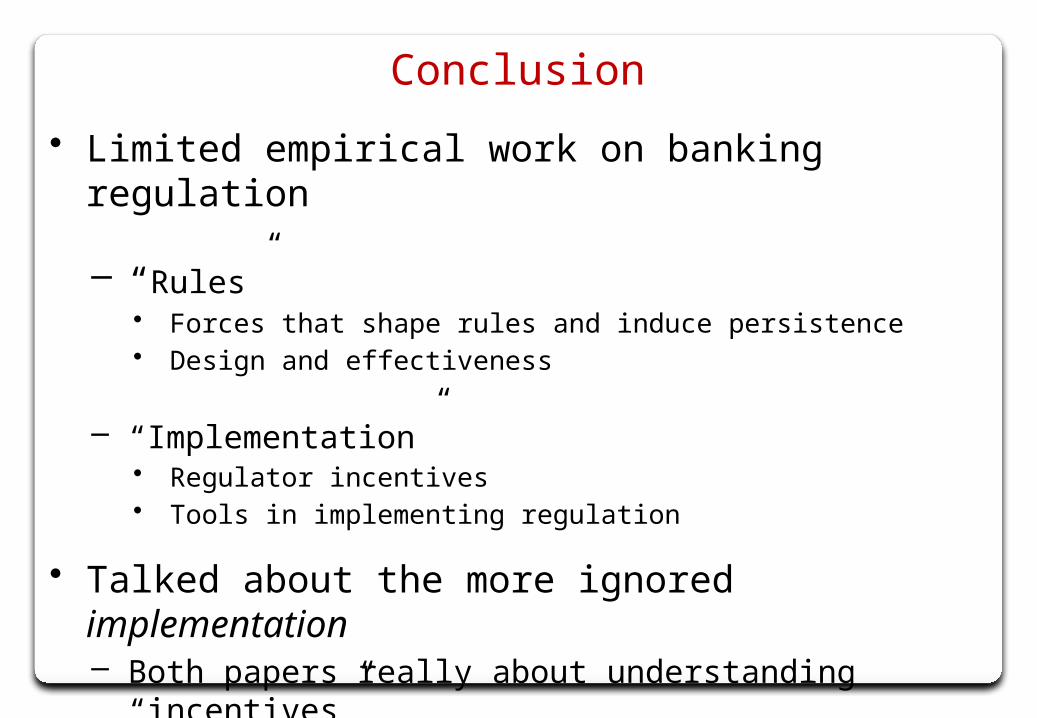
Conclusion
• Limited empirical work on banking regulation
– “Rules”• Forces that shape rules and induce persistence• Design and effectiveness
– “Implementation”• Regulator incentives• Tools in implementing regulation
• Talked about the more ignored implementation– Both papers really about understanding “incentives”
• More needs to be done to extend our understanding
BACK UP: REGULATORS
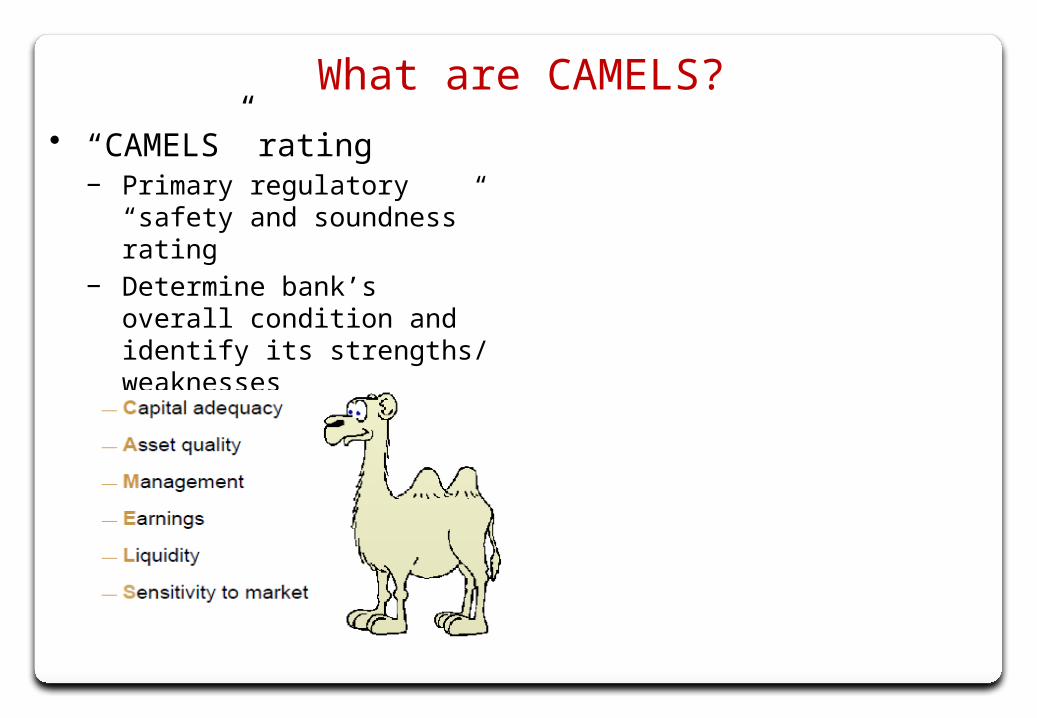
What are CAMELS?
• “CAMELS” rating− Primary regulatory “safety and
soundness” rating− Determine bank’s overall
condition and identify its strengths/ weaknesses
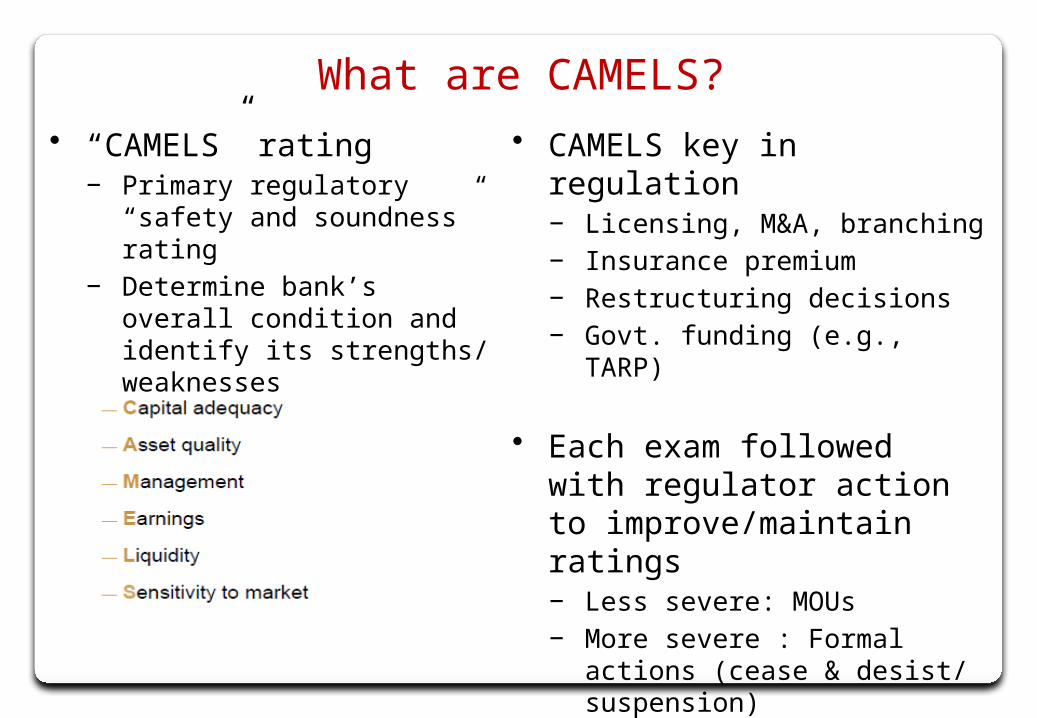
What are CAMELS?
• CAMELS key in regulation− Licensing, M&A, branching− Insurance premium− Restructuring decisions− Govt. funding (e.g., TARP)
• Each exam followed with regulator action to improve/maintain ratings− Less severe: MOUs− More severe : Formal actions
(cease & desist/ suspension)− Confidential to regulators and
bank
• “CAMELS” rating− Primary regulatory “safety and
soundness” rating− Determine bank’s overall
condition and identify its strengths/ weaknesses

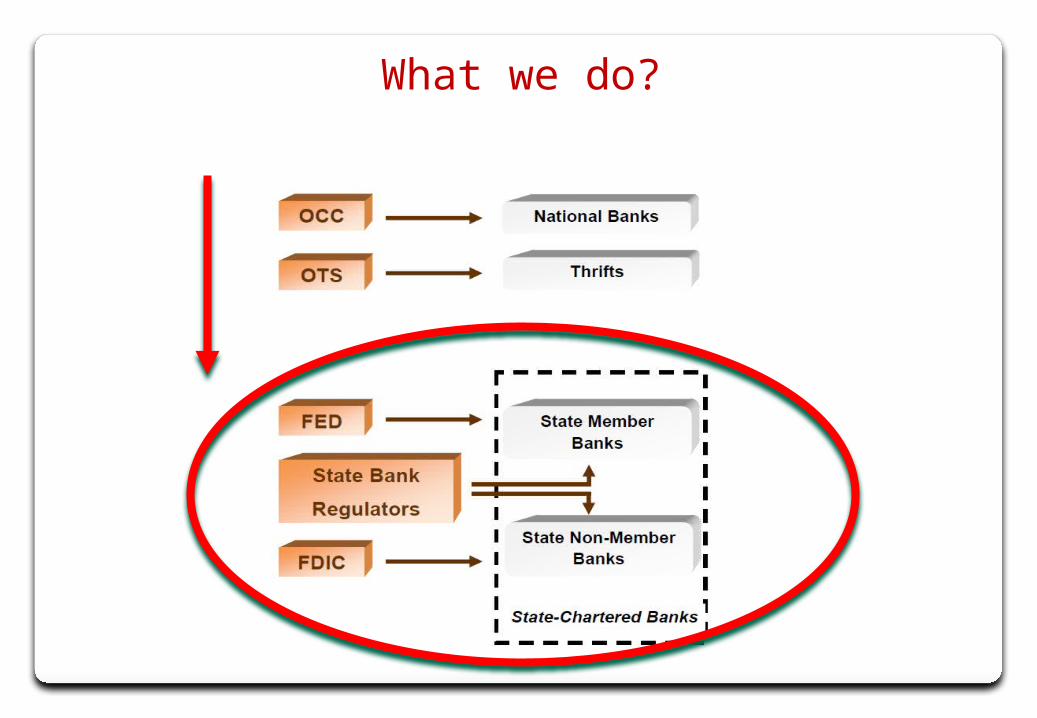
• Legally-determined rotation policy circumvents bank self-selection− Riegle Act of 1994: federal agencies required to use state
reports as substitute in alternate 12-month cycles (18-month for small banks) to reduce regulatory duplication• Rotation between State Regulator and FRB for SMBs• Rotation between State Regulator and FDIC for NMBs
− ~80% US commercial Banks covered (38% by assets)
What we do

Riegle Act of 1994
• The aim of these rules:− “[to] Foster coordination in order to reduce the dual
regulatory burden on state chartered banks, by substituting a federal examination with a state examination”.
− Before 1994 both Fed and State visited every period.
• Was not a deliberate “optimal mix” of more-less lenient regulators: “Good cop/Bad cop”− No such channel discussed in the legislative debate− Federal regulators don’t know of extra information
conceded by the bank to State regulators that is shared with them
• Prudential supervisory assessments and lead agency information from National Examination Database of the Federal Reserve System
• All commercial bank-specific variables including total assets, Tier1 capital, leverage, delinquency, nonperforming loans ratios, return on assets from Call Reports
• State supervisory budget and resource allocation data from Profile of State Bank Supervisor by the Conference of State Bank Supervisors
• Sample Period: 1996:Q1 to 2011:Q1; about 6500 banks and 55000 exams
Data

• Regulatory design (Stigler, 1971 and Peltzman, 1976)− Regulatory wedges and capture: Stigler (1971) and Peltzman (1976) to
Djankov, LaPorta, Lopez-de-Silanes, Shleifer (2002)− Theory of regulatory design in presence of informational asymmetries:
Laffont and Tirole (1993); Dewatripont and Tirole (1994); Boot and Thakor (1993); Hellman, Murdock and Stiglitz (2000)
• Banking regulation: Jayaratne and Strahan (1996); Berger and Hannan (1998); Kroszner and Strahan, (1999)
• Regulatory arbitrage in banking: Rosen (2003); Rosen (2005); Kane (2000); Calomiris (2006); Rezende (2011).
• Implementation of rules by auditors, standards in accounting literature: Gunther-Moore (2002)
Related Literature
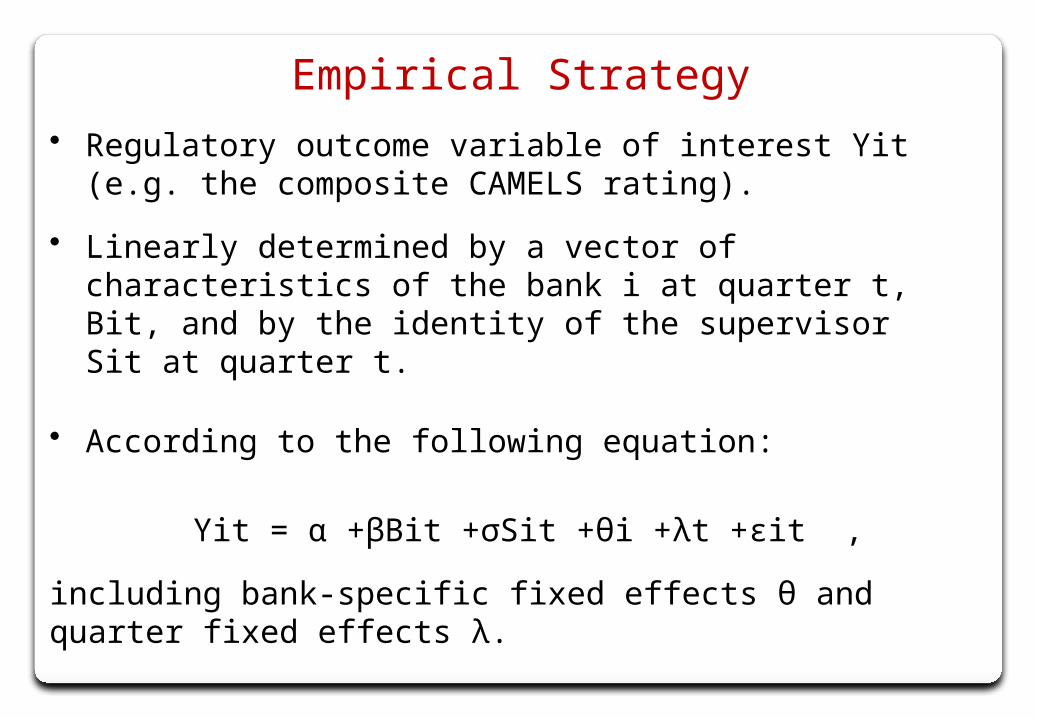
• Regulatory outcome variable of interest Yit (e.g. the composite CAMELS rating).
• Linearly determined by a vector of characteristics of the bank i at quarter t, Bit, and by the identity of the supervisor Sit at quarter t.
• According to the following equation:
Yit = α +βBit +σSit +θi +λt +ϵit ,
including bank-specific fixed effects θ and quarter fixed effects λ.
Empirical Strategy
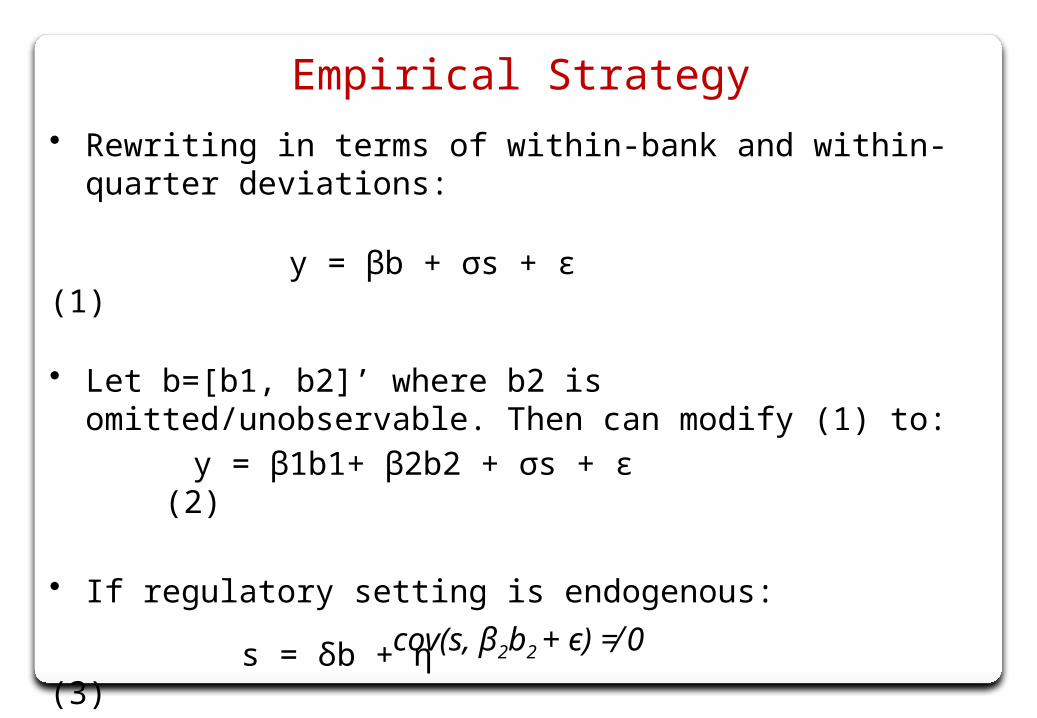
• Rewriting in terms of within-bank and within-quarter deviations:
y = βb + σs + ϵ (1)
• Let b=[b1, b2]’ where b2 is omitted/unobservable. Then can modify (1) to:
y = β1b1+ β2b2 + σs + ϵ (2)
• If regulatory setting is endogenous:
s = δb + η (3)
Empirical Strategy
cov(s, β2b2 + ϵ) ≠ 0

• The predetermined policy rule (Riegle Act) allows to replace:
s = δb + η (3)
with the predetermined policy p:
s = p + n,
where the following orthogonality condition holds:
p b2 | i SMB or i NMB.⊥ ∈ ∈
− Conditional on the bank being an SMB or NMB subject to rotation p, we can consistently estimate effect of supervisor on y
Empirical Strategy
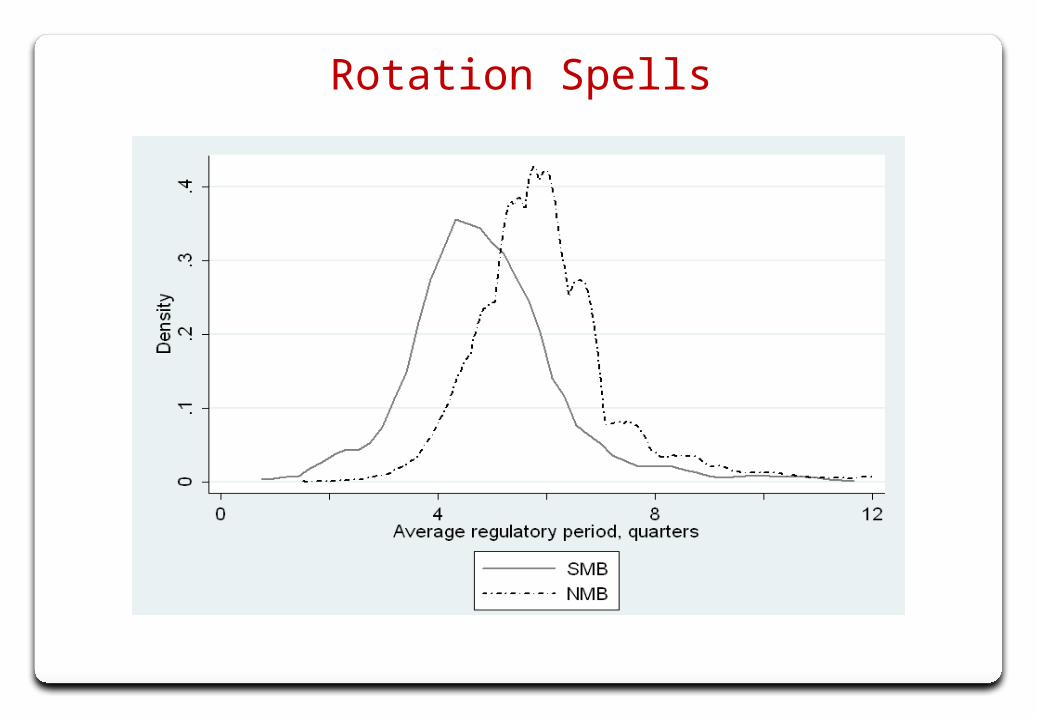
Rotation Spells
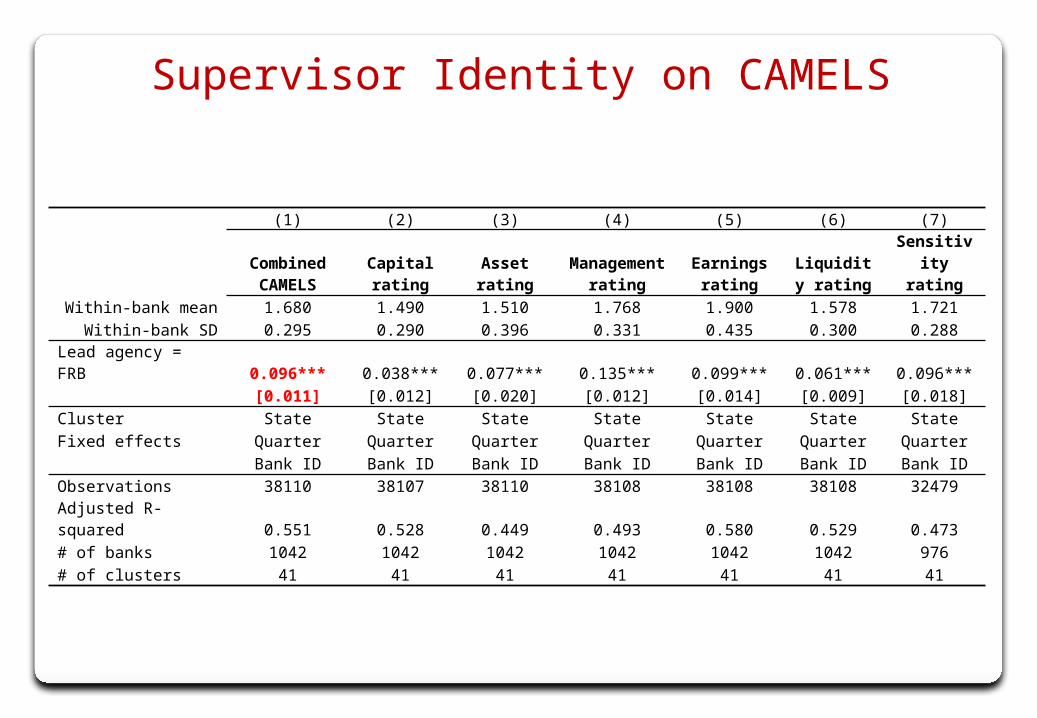
Supervisor Identity on CAMELS
(1) (2) (3) (4) (5) (6) (7)Combined CAMELS
Capital rating Asset rating
Management rating
Earnings rating
Liquidity rating
Sensitivity rating
Within-bank mean 1.680 1.490 1.510 1.768 1.900 1.578 1.721
Within-bank SD 0.295 0.290 0.396 0.331 0.435 0.300 0.288
Lead agency = FRB 0.096*** 0.038*** 0.077*** 0.135*** 0.099*** 0.061*** 0.096***
[0.011] [0.012] [0.020] [0.012] [0.014] [0.009] [0.018]
Cluster State State State State State State State
Fixed effects Quarter Quarter Quarter Quarter Quarter Quarter Quarter
Bank ID Bank ID Bank ID Bank ID Bank ID Bank ID Bank ID
Observations 38110 38107 38110 38108 38108 38108 32479
Adjusted R-squared 0.551 0.528 0.449 0.493 0.580 0.529 0.473
# of banks 1042 1042 1042 1042 1042 1042 976
# of clusters 41 41 41 41 41 41 41

Supervisor identity on CAMELS
(1) (2) (3) (4) (5) (6) (7)Combined CAMELS
Capital rating
Asset rating
Management rating
Earnings rating
Liquidity rating
Sensitivity rating
Within-bank mean 1.686 1.508 1.587 1.784 1.862 1.547 1.640
Within-bank SD 0.389 0.363 0.500 0.426 0.490 0.347 0.319
Lead agency = FDIC 0.072*** 0.059*** 0.072*** 0.088*** 0.063*** 0.037*** 0.051***
[0.007] [0.010] [0.012] [0.009] [0.011] [0.008] [0.007]
Cluster State State State State State State State
Fixed effects Quarter Quarter Quarter Quarter Quarter Quarter Quarter
Bank ID Bank ID Bank ID Bank ID Bank ID Bank ID Bank ID
Observations 240576 240572 240572 240572 240572 240572 211836
Adjusted R-squared 0.496 0.489 0.427 0.466 0.485 0.505 0.474
# of banks 5329 5329 5329 5329 5329 5329 5310
# of clusters 48 48 48 48 48 48 48
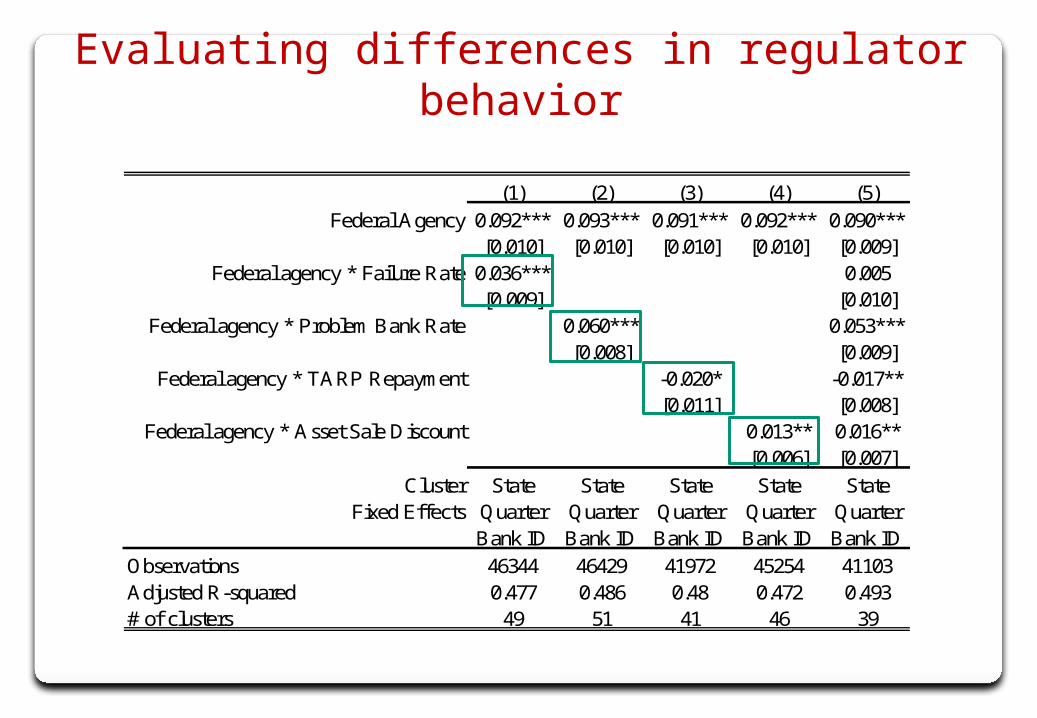
Evaluating differences in regulator behavior
(1) (2) (3) (4) (5)
Federal Agency 0.092*** 0.093*** 0.091*** 0.092*** 0.090***[0.010] [0.010] [0.010] [0.010] [0.009]
Federal agency * Failure Rate 0.036*** 0.005[0.009] [0.010]
Federal agency * Problem Bank Rate 0.060*** 0.053***[0.008] [0.009]
Federal agency * TARP Repayment -0.020* -0.017**[0.011] [0.008]
Federal agency * Asset Sale Discount 0.013** 0.016**[0.006] [0.007]
Cluster State State State State StateFixed Effects Quarter Quarter Quarter Quarter Quarter
Bank ID Bank ID Bank ID Bank ID Bank ID
Observations 46344 46429 41972 45254 41103Adjusted R-squared 0.477 0.486 0.48 0.472 0.493# of clusters 49 51 41 46 39
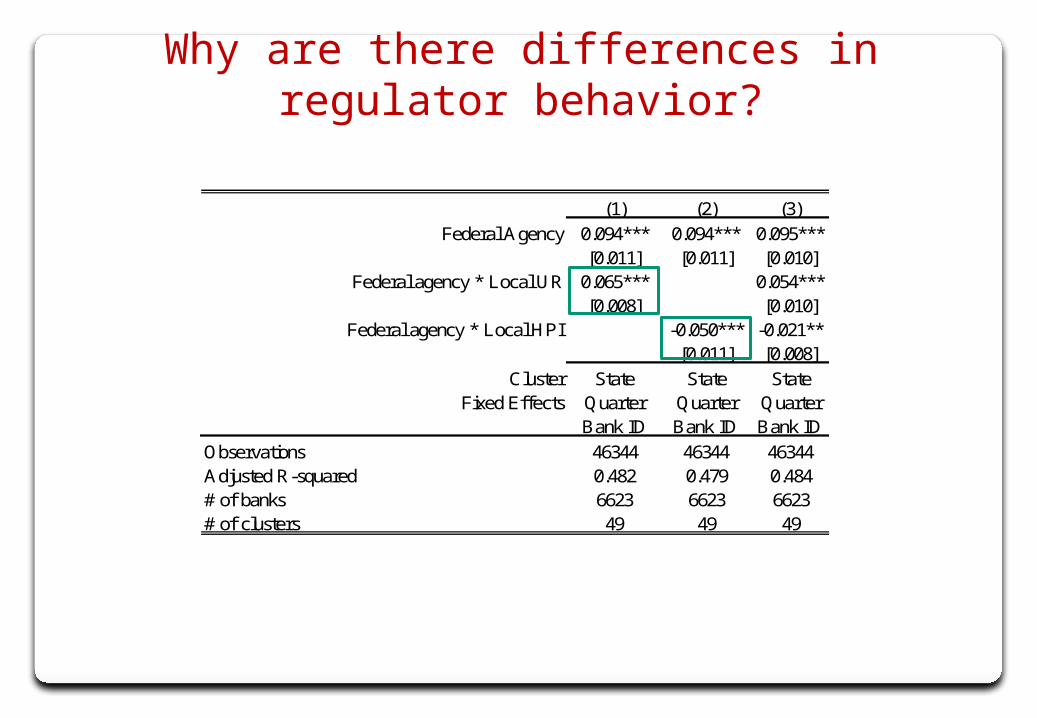
Why are there differences in regulator behavior?
(1) (2) (3)
Federal Agency 0.094*** 0.094*** 0.095***[0.011] [0.011] [0.010]
Federal agency * Local UR 0.065*** 0.054***[0.008] [0.010]
Federal agency * Local HPI -0.050*** -0.021**[0.011] [0.008]
Cluster State State StateFixed Effects Quarter Quarter Quarter
Bank ID Bank ID Bank ID
Observations 46344 46344 46344Adjusted R-squared 0.482 0.479 0.484# of banks 6623 6623 6623# of clusters 49 49 49

Two additional analysis
• Assess changes in supervisory standards for the same bank around the passage of the Act− Allows for comparison of a regime change from “tougher
regulator present all the time” to “tougher regulator present only half the time”
• Include all depository institutions and regulators (OCC, OTS, Fed, FDIC, State).− Allows comparison of results when we allow for movement
into and out of the state system
BACK UP: DEFAULT MODELS

Placebo Test
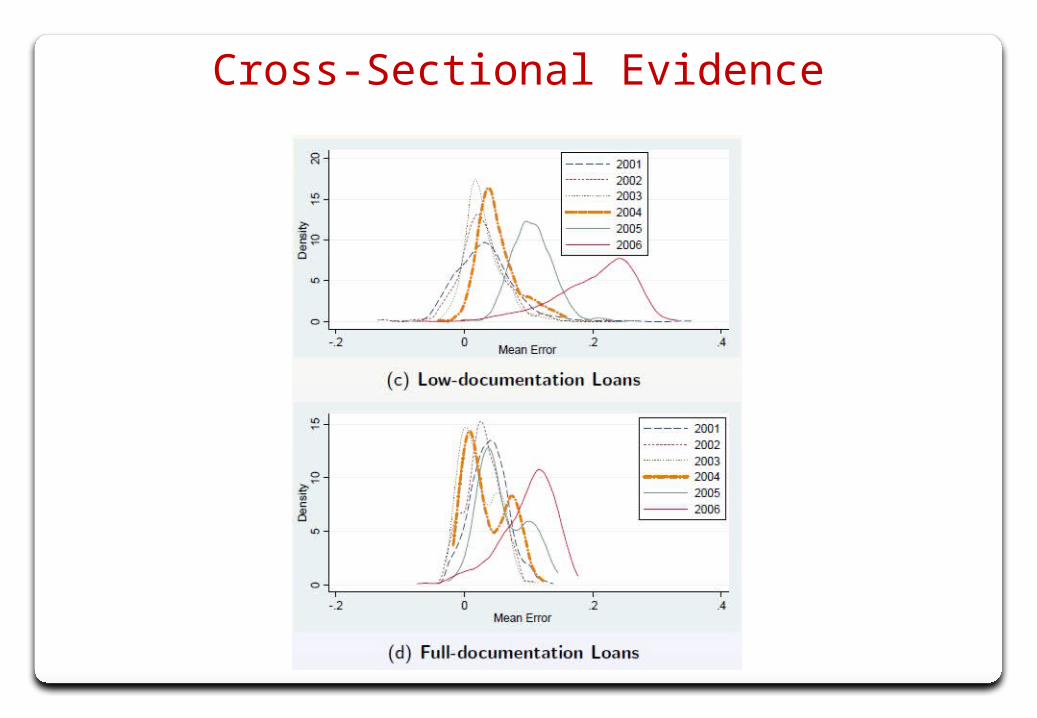
Cross-Sectional Evidence
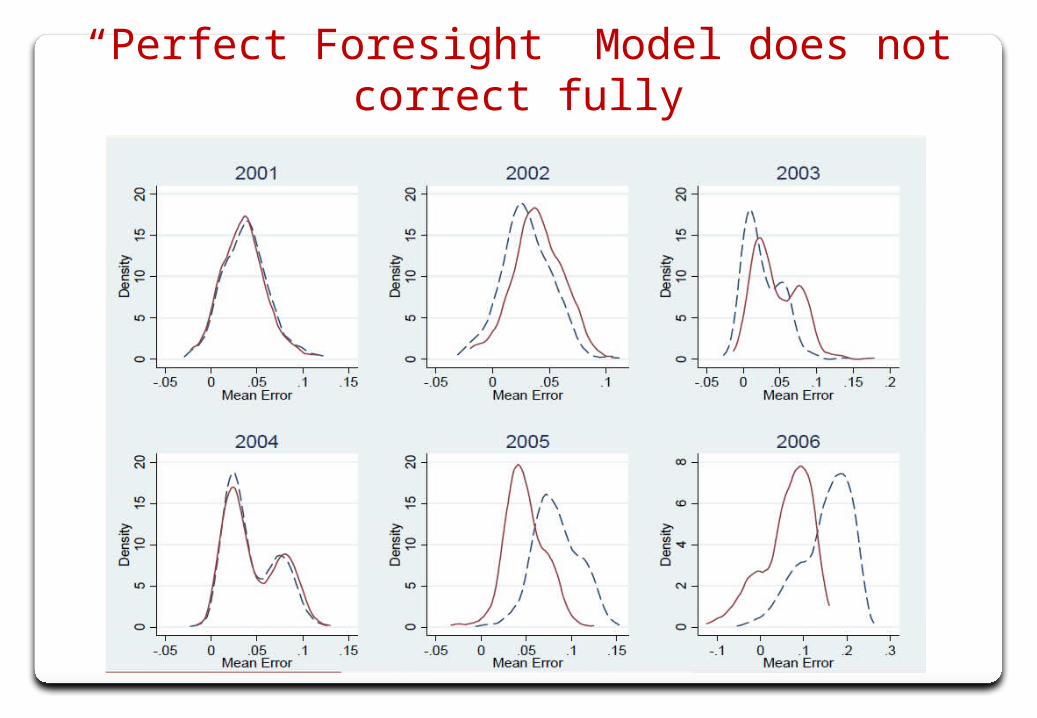
“Perfect Foresight” Model does not correct fully