empirical studies on reducing developers’ effort spent on
TRANSCRIPT

Empirical Studies on Reducing Developers’
Effort Spent on Resolving Software Issues
by
Yonghui Huang
A thesis submitted to the
Department of Electrical and Computer Engineering
in conformity with the requirements for
the degree of Master of Applied Science
Queen’s University
Kingston, Ontario, Canada
August 2017
Copyright c© Yonghui Huang, 2017

Abstract
Software issue resolving process is one of the most frequent maintenance activities
during the software development process. An issue tracking system (ITS) is often
used to better manage the software issues. However, previous research work has
shown that the issue resolving process needs development teams to put a large amount
of effort to address the reported issues. When developers raise questions to clarify
the description of issue reports during the issue resolving process, it takes time for
developers to receive the response for the questions. Hence, the raised questions
may negatively affect the efficiency of the issue resolving process. Moreover, a large
proportion (e.g., 80% in Firefox) of the reported issues are rejected (e.g., the issue
is not reproducible). The issue reports might exist in the ITS for a long time before
they are rejected (e.g., over 50% of rejected issue reports are rejected after 6.73 days
in Firefox). Even though these reports are rejected eventually, developers must have
wasted valuable resources on triaging, inspecting and rejecting such reports.
In this thesis, we conduct two empirical studies to reduce the effort spent on the
software issue resolving process. In the first study, we investigate how the process
of resolving issues is impacted by the questions raised from the issue reports in the
resolving process and apply machine learning techniques to predict if developers will
raise questions from a new issue report. Our prediction result can give developers
i

an early warning whether questions will be raised when the issue report is created.
Developers can take proper actions to handle the issue reports that are likely to have
questions raised, in order to improve the effectiveness of the issue resolving process.
In the second study, we investigate the characteristics of issue reports that can be
rejected by developers in the resolving process. We propose to prioritize the valid
issue reports at higher positions and the predicted rejected issue reports at lower
positions, so that developers can put more effort on the valid issue reports.
ii

Acknowledgments
First of all, I truly appreciate for my supervisor, Dr. Ying Zou. She gives me in-
structive advice and useful suggestions on my research thesis. I also want to thank
her for giving me a great opportunity to finish my master degree in the Software
Re-engineering Lab. It is a pleasure and honor to be one of her students.
I also want to appreciate the help from other members in our lab. I would like
to acknowledge Dr. Feng Zhang, who makes a large contribution and provide insight
thoughts to my research studies. Meanwhile, I would like to thank Dr. Cor-Paul
Bezemer, who assists me to polish Chapter 4. I also would like to appreciate the
suggestions from Dr. Daniel Alencar on the Introduction of the thesis. I want to
acknowledge Yu Zhao, Pradeep Venkatesh, Yongjian Yang, Mariam El Mezouar and
Ehsan Noei who help me on the manual analysis work. I also want to appreciate the
help from my dear friends Wenhui Ji (from Beihang University), Yingying Lin (from
Jimei University) and Xian Guo (Beijing Jiaotong University) who make a large
contribution to the manual work and consistently support to my life and research
studies.
Moreover, I appreciate the hard work from my committee members: Dr. Thomas
R. Dean, Dr. Farhana H. Zulkernine, and Dr. Ying Zou.
Last but not least, I want to thank my parents and grandparents who consistently
iii

support everything to me during my lifetime.
iv
Contents
Abstract i
Acknowledgments iii
Contents v
List of Tables vii
List of Figures viii
Chapter 1: Introduction 11.1 Background . . . . . . . . . . . . . . . . . . . . . . . . . . . . . . . . 11.2 Research Problems . . . . . . . . . . . . . . . . . . . . . . . . . . . . 21.3 Research Statement . . . . . . . . . . . . . . . . . . . . . . . . . . . . 41.4 Thesis Objectives . . . . . . . . . . . . . . . . . . . . . . . . . . . . . 51.5 Organization of Thesis . . . . . . . . . . . . . . . . . . . . . . . . . . 7
Chapter 2: Background and Related Work 82.1 Studies on the Issue Triaging Process . . . . . . . . . . . . . . . . . . 82.2 Studies on the Issue Resolving Process . . . . . . . . . . . . . . . . . 92.3 Studies on Factors that Impact on the Issue Resolving Process . . . . 10
2.3.1 Studies on the Quality of Issue Reports . . . . . . . . . . . . . 102.3.2 Studies on the Cooperation between Developers during the Is-
sue Resolving Process . . . . . . . . . . . . . . . . . . . . . . . 112.4 Studies on the Rejected Issue Reports . . . . . . . . . . . . . . . . . . 122.5 Machine Learning Techniques . . . . . . . . . . . . . . . . . . . . . . 132.6 Latent Dirichlet Allocation (LDA) . . . . . . . . . . . . . . . . . . . . 152.7 Summary . . . . . . . . . . . . . . . . . . . . . . . . . . . . . . . . . 15
Chapter 3: An Empirical Study on the Questions Raised in theIssue Resolving Process 16
3.1 Introduction . . . . . . . . . . . . . . . . . . . . . . . . . . . . . . . . 16
v

3.2 Experimental Setup . . . . . . . . . . . . . . . . . . . . . . . . . . . . 193.2.1 Datasets . . . . . . . . . . . . . . . . . . . . . . . . . . . . . . 193.2.2 Question Extraction . . . . . . . . . . . . . . . . . . . . . . . 233.2.3 Question Processing . . . . . . . . . . . . . . . . . . . . . . . 25
3.3 Experimental Results . . . . . . . . . . . . . . . . . . . . . . . . . . . 253.3.1 RQ3.1: What questions are asked by developers? . . . . . . . 253.3.2 RQ3.2: What is the impact of raising questions? . . . . . . . . 313.3.3 RQ3.3: Is the occurrence of questions predictable? . . . . . . . 36
3.4 Threats to validity . . . . . . . . . . . . . . . . . . . . . . . . . . . . 463.5 Summary . . . . . . . . . . . . . . . . . . . . . . . . . . . . . . . . . 47
Chapter 4: Towards Reducing the Effort Spent on Rejected IssueReports 49
4.1 Introduction . . . . . . . . . . . . . . . . . . . . . . . . . . . . . . . . 494.2 Experimental Setup . . . . . . . . . . . . . . . . . . . . . . . . . . . . 50
4.2.1 Studied ITSs . . . . . . . . . . . . . . . . . . . . . . . . . . . 514.2.2 Extracting Effort Risk Metrics . . . . . . . . . . . . . . . . . . 514.2.3 Extracting Issue Report Metrics . . . . . . . . . . . . . . . . . 52
4.3 Experimental Results . . . . . . . . . . . . . . . . . . . . . . . . . . . 564.3.1 RQ4.1: How much effort is spent on rejecting issue reports? . 564.3.2 RQ4.2: Is it feasible to predict whether an issue report will be
rejected? . . . . . . . . . . . . . . . . . . . . . . . . . . . . . . 604.3.3 RQ4.3: How accurately can we rank issue reports based on their
validity likelihood? . . . . . . . . . . . . . . . . . . . . . . . . 664.4 Threats to validity . . . . . . . . . . . . . . . . . . . . . . . . . . . . 734.5 Summary . . . . . . . . . . . . . . . . . . . . . . . . . . . . . . . . . 74
Chapter 5: Conclusions 765.1 Contributions and Findings . . . . . . . . . . . . . . . . . . . . . . . 765.2 Future Work . . . . . . . . . . . . . . . . . . . . . . . . . . . . . . . . 78
5.2.1 Combining with Texual Metrics . . . . . . . . . . . . . . . . . 785.2.2 Generalization of Our Approaches in Othe Projects . . . . . . 785.2.3 Exploring the Generalization of Other Techniques . . . . . . . 785.2.4 Integrating Our Approaches in the Practices . . . . . . . . . . 79
Bibliography 80
vi

List of Tables
3.1 Description of resolution types, and the numbers and percentages of
the number of issue reports of a resolution type in the studied projects. 20
3.2 The number of issue reports in each studied ITS . . . . . . . . . . . . 21
3.3 The distribution of topics in the issue reports for three subject systems 26
3.4 The five important metrics in the random forest models. . . . . . . . 44
3.5 The median value of performance measures of our models in three
studied systems . . . . . . . . . . . . . . . . . . . . . . . . . . . . . . 44
4.1 The number of issue reports in each studied ITS. . . . . . . . . . . . 51
4.2 Summary of the effort metrics of the rejected issue reports in the stud-
ied ITSs. . . . . . . . . . . . . . . . . . . . . . . . . . . . . . . . . . . 59
4.3 The average performance measures and the standard deviation of our
model and the baseline model in the three studied ITSs. . . . . . . . 65
4.4 The five important metrics in the random forest models. . . . . . . . 65
4.5 The average number of issue reports that are opened, fixed and assigned
each day in the studied ITSs. . . . . . . . . . . . . . . . . . . . . . . 67
4.6 Example ranking result of three Firefox issue reports for q = valid issue
reports. . . . . . . . . . . . . . . . . . . . . . . . . . . . . . . . . . . . 70
vii

List of Figures
1.1 The typical life cycle of an issue report within an ITS. . . . . . . . . 2
3.1 An example from Linux-53 . . . . . . . . . . . . . . . . . . . . . . . . 17
3.2 Overview of our approach . . . . . . . . . . . . . . . . . . . . . . . . 19
3.3 An illustrative example of a url link containing “?” . . . . . . . . . . 21
3.4 An illustrative example of call trace message containing “?” . . . . . 22
3.5 An illustrative example of a code snippet containing “?” . . . . . . . 22
3.6 An example of the enriched comment . . . . . . . . . . . . . . . . . . 24
3.7 An illustrative example of a replying comment . . . . . . . . . . . . . 24
3.8 Examples of raised questions . . . . . . . . . . . . . . . . . . . . . . . 34
3.9 The distribution of the impact metrics for issue reports without and
with questions . . . . . . . . . . . . . . . . . . . . . . . . . . . . . . . 35
3.10 The Spearman correlation analysis for Linux. . . . . . . . . . . . . . . 40
4.1 Overview of our approach . . . . . . . . . . . . . . . . . . . . . . . . 50
4.2 The distribution of the elapsed time metric for all types of resolved
issue reports in the studied ITSs. . . . . . . . . . . . . . . . . . . . . 58
4.3 The Spearman correlation analysis for Firefox. . . . . . . . . . . . . . 61
4.4 An overview of our ranking approach. . . . . . . . . . . . . . . . . . . 68
viii

4.5 The mean values of P@k and NDCG@k that are achieved by our
approach and the baseline ranking model. . . . . . . . . . . . . . . . 71
ix

1
Chapter 1
Introduction
1.1 Background
Software issues can be errors of code snippets (called bugs), enhancements, and new
feature requests [4]. For example, software issues can arise from mistakes made in
either source code or software requirement, which lead software products to present
an incorrect behavior. To allow developers to better manage the reported issues of a
software project, Issue Tracking Systems (ITSs), like JIRA and Bugzilla are widely
used by software development teams to report, process and track reported issues.
Moreover, ITSs provide a platform for developers to comment on issue reports, so
they can cooperate and resolve these issues [59].
Figure 1.1 shows the typical life cycle of an issue report [86]. Note that the life
cycle shown in Figure 1.1 may vary slightly depending on the project and the used
ITS. When an issue is newly reported by a developer or user, the report gets the NEW
status. The issue report remains in the NEW status, until a triager either assigns the
issue report to himself or another developer, or rejects the issue report immediately.
The assignee resolves, i.e., fixes or rejects the issue report, and labels it with a

1.2. RESEARCH PROBLEMS 2
NEW
ASSIGNED
RESOLVED
VERIFIED
CLOSED
REOPENEDDOCUMENTED
WORKSFORME
INCOMPLETE
WONTFIX
Possible ResolutionValidRejected
PATCH_ALREADY_AVAILABLE
INVALID
MOVED
DUPLICATE
EXPIRED
FIXED
Figure 1.1: The typical life cycle of an issue report within an ITS.
resolution value. After the issue report is resolved, the issue report changes to the
state RESOLVED with a resolution type.
After the issue report is resolved, the resolution type and the solution are to be
verified by other developers. If the other developers are satisfied with the resolution,
the issue report is closed. Otherwise, the issue report is reopened and (re)assigned.
Different projects might use different labels for the same reason of resolving an
issue report. For example, fixed issue reports are labeled as FIXED in Firefox and
Eclipse, while Linux uses the CODE FIX label. The MOVED label is only used in
the Linux and the Eclipse projects. The detailed descriptions of different types of
resolution are explained in the Table 3.1.
1.2 Research Problems
Fixing issues that are reported in ITSs is an important activity in the software devel-
opment, because software issues may negatively affect the quality of software prod-
ucts. However, resolving issues is expensive [16, 85]. A survey by the National
Institute of Standards and Technology estimated that the annual cost of software

1.2. RESEARCH PROBLEMS 3
issues is about $59.5 billion [85]. Moreover, the ITS of a popular project usually
receives a large number of issue reports. For example, there were more than 157,000
issue reports in the Firefox ITS by the end of 2015 (according to our studies in Chap-
ter 3 and Chapter 4). Once receiving issue reports, developers need to investigate
the reported issues and assign issue reports to appropriate developers who will be
able to fix it, which is known as triaging. Developers can become overwhelmed with
a large number of issue reports if each report is manually triaged [59, 2, 43]. If an
issue report is triaged and determined as a valid problem, the assignee of the issue
report needs to handle the issue. A development team usually has limited resources
and tight schedules to fix a large amount of issue reports. Hence, it is desirable to
investigate the existing threats to the efficiency of software issue resolving process and
propose approaches to reduce the effort that is spent on the issue resolving process.
Numerous approaches have been proposed to improve the effectiveness of issue
resolving process [59, 2, 43]. Murphy et al. [59] apply the text categorization based
on the description of issue reports to predict which developer should work on an issue
report. Jeong et al. [43] propose a graph model to reduce the reassignments of issue
reports by using Markov chains based on an issue tossing history. Ahsan et al. [2]
use Latent Semantic Indexing and Support Vector Machine to obtain an automatic
issue triage system. All these studies try to improve the effectiveness of the triaging
process. However, even the issue reports can be accurately assigned to appropriate
developers, the resources can be wasted on rejecting invalid issue reports after the
triaging process (e.g., developers spent the effort to determine whether an issue is
duplicated with existing issue reports).

1.3. RESEARCH STATEMENT 4
To help development teams better estimate software maintenance efforts and bet-
ter manage software projects, empirical studies about the issue-fixing time (i.e., [29,
97, 99]) are conducted. In order to accelerate the issue resolving process, the study
by Arcuri and Yao [9] propose an evolutionary approach to automating the task of
fixing issues based on the Automatic Programming techniques [8]. Nevertheless, to
our best of knowledge, the limited empirical evidence is provided to show how to
help developers handle reported issues to improve the efficiency of the issue resolving
process.
1.3 Research Statement
There exist limitations of the efficiency of the issue resolving process. Zhang et al. [97]
report that the threats to the efficiency of resolving issues can happen in any phase
of the issue resolving process (e.g., reporting an issue, triaging the issue and verifying
the resolution of issue reports).
An important factor that affects the efficiency of the resolving process is the
interaction among developers to discuss how to address a reported issue during the
issue resolving process [20, 28]. Questions can be raised by developers from the issue
reports during the discussion for addressing the issues. We observe that there is a
considerable proportion (24.89% to 47.04%) of issue reports in the subject systems
(i.e., Linux, Firefox and Eclipse) that have questions raised by developers during the
issue resolving process. Dealing with the raised questions in such a lot of issue reports
does have a serious threat to the efficiency of the issue resolving process.
Another threat to the efficiency of the issue resolving process is the rejected issue
reports. It is very normal that developers decide to reject an issue report due to

1.4. THESIS OBJECTIVES 5
many reasons (i.e., invalid description, unreproducible for developers and duplicate
with previous issues). Our study shows that there is a large proportion of issue reports
rejected by developers, such as 64% in Linux, 80% in Firefox, and 49% in Eclipse.
Developers should focus more resources on the issue reports that are more likely to
describe real problems and need to be fixed.
To help improve the efficiency of the issue resolving process, we believe that in-
depth empirical studies on the limitations of resolving process are highly demanded.
In this thesis, we aim to give developers an early warning whether questions can
be raised from an issue report when the issue report is created, so that developers
can take proper actions (e.g., adding detailed hardware or software configurations
for Linux issues) to handle the issue reports that are likely to have questions raised.
Then, we strive for helping developers reduce the amount of the effort wasted on the
rejected issue reports during the issue resolving process. We apply machine learning
techniques (i.e., random forest and learning-to-rank) to predict the rejected issue
reports. As a consequence, developers can focus the limited resources on the valid
issue reports and improve the effectiveness of the issue resolving process.
1.4 Thesis Objectives
The objectives of the thesis are as follows:
• Studying on the questions raised in the issue resolving process (Chap-
ter 3).
When resolving issues, developers might raise questions in order to clarify the
described issue [20, 50, 56]. Once a question is raised, developers need to wait for
the response before taking further actions. The extra waiting period can delay

1.4. THESIS OBJECTIVES 6
the issue being resolved. We first investigate the frequently concerned topics
in the questions raised from issue reports by developers, and then we inspect
how the raised questions impact on the efficiency of issue resolving process. We
also apply prediction models to predict if questions are likely to be raised by a
developer from an issue report during the issue resolving process. The target of
this study aims to give the developers an instant warning whether questions can
be raised from an issue report by developers when the issue report is created.
Therefore, developers can take proper actions to handle such issue reports that
are likely to have questions raised, in order to reduce unnecessary questions.
• Reducing the effort spent on the rejected issue reports during the
fixing process (Chapter 4).
Not all of the assigned issue reports will be addressed in the end [94]. A triager
or developer may choose to reject an issue report. As long as an invalid or useless
issue report is not rejected, developers could be wasting valuable resources (e.g.,
time) on the report. In this study, we examine the risks of wasting effort on
rejecting issue reports during the resolving process, and build the random forest
model to predict whether a new issue report will be rejected. As the prediction
results might miss important valid issue reports, we further apply the learning-
to-rank technique to rank the valid issue reports at higher positions, and the
triager can give a higher priority to the issue reports that are more likely to
describe a valid problem. The development teams can apply our approach to
reduce the effort spent on rejecting issue reports.

1.5. ORGANIZATION OF THESIS 7
1.5 Organization of Thesis
The remaining chapters of this thesis are organized as follows:
• Chapter 2: We give an overview of the existing studies on the issue triaging and
the resolving process, the factors that impact on the issue resolving process, the
rejected issue reports and the application of machine learning to the software
engineering.
• Chapter 3: We examine the issue reports that contain the raised questions by
developers during the resolving process and propose an approach to predict
whether questions can be raised from an issue report when the issue report is
created.
• Chapter 4: We propose an approach to automatically detect the rejected issue
reports. Therefore, developers could reduce effort spent on the rejected issue
reports during the resolving process.
• Chapter 5: We conclude our contribution of the thesis and outlines the future
work.

8
Chapter 2
Background and Related Work
In this chapter, we discuss the existing work on the issue triaging process, the resolving
process, the factors that can impact the efficiency of the issue resolving process, the
studies of rejected issue reports and the application of machine learning techniques
and Latent Dirichlet Allocation (LDA).
2.1 Studies on the Issue Triaging Process
The issue resolving process begins with the issue triaging. To improve the effectiveness
of the triaging process, previous studies proposed a plenty of approaches to reduce
the effort spent on the triaging process [59, 2, 43]. For instance, Murphy et al. [59]
apply the text categorization based on the description of issue reports to predict the
developer who should work on the issue report. Jeong et al. [43] notice the overhead
generated by the reassignment of issue reports during the issue resolving process and
propose a graph model using Markov chains based on the tossing history of issue
reports to reduce the tossing events of issue reports. Ahsan et al. [2] develop an
automatic issue triaging system using Latent Semantic Indexing and Support Vector
Machine techniques.

2.2. STUDIES ON THE ISSUE RESOLVING PROCESS 9
Different from their work, we observe that developers waste limited resources
on the rejected issue reports after the issue triaging. We apply the Learning-to-rank
model to automatically prioritize the issue reports by the likelihood of validity of issue
reports. The triager can assign issue reports that are more likely valid to developers
to reduce the waste of resources on rejected issue reports during the issue resolving
process.
2.2 Studies on the Issue Resolving Process
After an issue is discovered, the issue resolving process starts until the issue is resolved.
Many studies have attempted to empirically study the issue resolving process. Kim
and Whitehead Jr [49] report the statistics of the issue resolving time, such as the
time that developers take to fix reported issues. Weiss et al. [90] have proposed
an automatic technique to predict the time needed to fix a particular bug. Their
proposed approach could be applied to new bug reports. Zhang et al. [97] investigate
the delays in each step of the bug fixing process, such as the delay in assigning a
bug report to the right developer, the delay for developers to start the fix after the
assignment, and the delay for testers to start the verification after the bug is fixed.
Hosseini et al. [41] propose an auction-based multi-agent mechanism for assigning
software issues to developers in order to minimize backlogs and the overall issue
report lifetime. Pan et al. [66] study various bug fixing patterns in a number of open
source software systems. Khomh et al. [48] conduct research on the effect of the
release cycle on bugs. Their results show that the amount of crashes is similar to the
traditional release model, and bugs are fixed faster under the rapid release models,
but proportionally fewer bugs are fixed compared to the traditional release model.

2.3. STUDIES ON FACTORS THAT IMPACT ON THE ISSUERESOLVING PROCESS 10
In this thesis, we aim to improve the efficiency of the issue resolving process
from two perspectives. For instance, the negative impact of raising questions (i.e., in
Chapter 3) during the issue resolving process and the resource wasted on the rejected
issue reports (i.e., in Chapter 4).
2.3 Studies on Factors that Impact on the Issue Resolving Process
The factors that impact the efficiency of the issue resolving process have attracted
both academia and industry [29, 30, 65, 12, 62].
2.3.1 Studies on the Quality of Issue Reports
The quality of issue reports can affect the efficiency of the issue resolving process [40,
102, 13, 35, 76]. Hence, Hoomieijer and Weimer [40] propose a linear regression model
to predict the quality of issue reports. They determine the quality of issue reports by
measuring whether the report is addressed within a given amount of time. Different
from their work, the raised questions in Chapter 3 is considered as another indicator
of issue report quality in our thesis.
Zimmermann et al. [102] point out that the issue reports widely differ in the
quality, and BettenBurg et al. [14] conduct a survey among developers to figure out
what factors make a good issue report, and provide a tool to measure the quality of
a new issue report. BettenBurg et al. [13] also deliver a survey to Eclipse developers
to figure out what kind of information is widely needed by developers. Insufficient
information in an issue report is considered as a bad quality of issue reports. Moreover,
the results show that steps to reproduce and the testing case can determine the quality
of the issue reports and inaccurate reproduce guide in the issue reports can make an

2.3. STUDIES ON FACTORS THAT IMPACT ON THE ISSUERESOLVING PROCESS 11
issue report with bad quality. The insufficient and incorrect information can be
confusing to the developers, and then developers might raise questions. Different
from previous work, in Chapter 3 of this thesis, we conduct a further empirical study
on how the raised questions influence the efficiency of handling an issue report, and
apply machine learning techniques to predict the occurrence of the raised questions
from an issue report.
Guo et al. [35] point out that the bad quality of an issue report is one of the
reasons of the tosses of issue reports during the software development. Poor issue
report quality can result in multiple assignments in the development process, which
prove our result in RQ3.2 of Chapter 3 (i.e., the issue report with raised questions
has a higher rate to experience the reassignment during the addressing process).
Schugerl et al. [76] reveal that the quality of the description in the issue report
can determine the time consumed in the evaluation and fixing issues. A bad quality
of description in an issue report can take a longer time to be addressed. Hence, we
considered the elapsed time as one of the factors to measure the effort spent on an
issue report in Chapter 3 and Chapter 4.
2.3.2 Studies on the Cooperation between Developers during the Issue
Resolving Process
Another important factor that affects the efficiency of resolving process is the inter-
action among developers to discuss how to address a reported issue during the issue
resolving process [20, 28]. Breu et al. [20] study the raised questions by developers
during the issue resolving process. They find that if a reporter is not active in the
discussion of the software issue, the efficiency of the resolving process can be affected.

2.4. STUDIES ON THE REJECTED ISSUE REPORTS 12
Hence, Breu et al. [20] provide techniques to elicit the right information and facilitate
the communication between developers and users. Breu et al. [20] focus on enhancing
the ITS at the system level, but our work in Chapter 3 aims to improve the quality
of issue reports at the file level.
Moreover, Breu et al. [19] highlight the concerns on the frequently raised questions
from the issue reports and categorize these raised questions. They find out that the
constant involvement of developers is important for handling the reported issues.
Different from our work in Chapter 3, they focus more on the interaction between
developers but ignore the impact of these raised questions on the whole resolving
process.
2.4 Studies on the Rejected Issue Reports
The effort spent on the rejected issue reports (i.e., duplicated issue reports) is con-
sidered as a waste of resources on the development team [23, 15, 24, 72, 75, 89, 82].
Most of the previous work on rejected issue reports focuses on duplicated issue re-
ports. Anvik et al. [5] find that around 20%-30% of the issue reports of Eclipse and
Firefox are duplicated reports. Cavalcanti et al. [23] report that there are 32%, 43%
and 8% duplicated issue reports in Epiphany, Evolution and Tomcat respectively.
Bettenburg et al. [14, 15] find that merging the information that is available across
duplicated reports produces additional useful information. Davidson et al. [24] and
Cavalcanti et al. [22, 23] study the effort spent on closing duplicated issues. Rakha
et al. [72] investigate the needed effort for identifying duplicated issues.
Several approaches address the challenges of automatically detecting duplicated
issue reports. These approaches use the textual [75, 89, 82] (e.g., the description),

2.5. MACHINE LEARNING TECHNIQUES 13
categorical [42, 47, 80] (e.g., the component field) and topical [3, 1, 53, 63] (e.g.,
using LDA) information available in issue reports to decide if a new issue report is
duplicated with existing reports in the ITS.
Joorabchi et al. [28] notice the harm on the issue resolving process from the reports
that can not be reproduced. Hence, they conduct an empirical study on those bug
reports that developers are not able to reproduce. Their results highlight that the
non-reproducible bugs remain active in a longer time, which means there are a lot of
effort can be consumed on such bugs.
However, duplicated and non-reproducible issue reports are a subset of our studied
subjects of rejected issue reports. An issue report that is rejected by developers may
be due to the invalid description and even the expiration of issue reports. The effort
spent on determining to reject an issue report wastes the resources of development
teams and negatively influence the efficiency of issue resolving process. Hence, our
work in Chapter 4 extends the existing work on the rejected issue reports by focusing
on all types of rejected issue reports, rather than only duplicated reports.
2.5 Machine Learning Techniques
There are several approaches that apply machine learning (ML) techniques to the
empirical studies of software engineering. To minimize the cost and improve the
effectiveness of the software testing process, Gondra et al. [32] apply the Artificial
Neural Network (ANN) model to predict the fault-proneness (i.e., a module can either
contain errors or be error-free) and use Support Vector Machines (SVM) as a state-of-
the-art classification method. The results show that SVM performs better than ANN
in the fault-proneness prediction. Hall et al.[36] apply Naive Bayes, logistic regression

2.5. MACHINE LEARNING TECHNIQUES 14
and SVM to predict defects in the source code, as the accurate prediction of where
faults are likely to occur in code can help direct test effort, reduce costs and improve
the quality of software. Different from their work, our proposed prediction model aims
to improve the effectiveness of the issue resolving process. In particular, we apply the
random forest model both in Chapter 3 and Chapter 4. Random forest is an ensemble
learning method. It constructs multitude of decision trees at the training time but
correct for decision trees’ habit of overfitting to their training set. We choose to use
a random forest model because it is robust to data noise and generally achieves good
performance in software engineering studies [72, 46, 74, 44, 54, 31].
Learning-to-rank is known as a machine learning ranking approach. It is widely
applied in the application of information retrieval. The training data consists of
lists of items with some partial order specified between items in each list. This or-
der is typically induced by giving a numerical or ordinal score or a binary judgment
(e.g.“relevant” or “not relevant”) for each item. Ye et al. [32] apply learning-to-rank
techniques to locate a bug by leveraging domain knowledge ( i.e., functional decom-
positions of source code files into methods, API descriptions of library components
used in the code, the bug-fixing history, and the code change history). Zhou et
al. [101] propose an approach to automatically retrieve duplicated bug reports using
learning-to-rank techniques based on textual and statistical features of bug reports
and propose a similarity function for bug reports based on the features. In our the-
sis, we apply the learning-to-rank techniques to automatically retrieve the valid issue
reports, which can avoid wasting effort on the invalid issue reports.

2.6. LATENT DIRICHLET ALLOCATION (LDA) 15
2.6 Latent Dirichlet Allocation (LDA)
Latent Dirichlet Allocation (LDA) is an example of a topic model for topic discovery
in natural language processing. It expresses documents as the probability distribution
of topics, where each topic is a probability distribution of words referred to as a topic
model. In LDA, each document may be viewed as a mixture of various topics where
each document is considered to have a set of topics that are assigned to it via LDA.
Hindle et al. [39] report that the topics generalized from LDA match the perception of
developers and managers. Zhao et al. [100] apply LDA to find out what is the reason
for bug reworking in Linux, Firefox, PDE, Ant and HTTP. Venkatesh et al. [88]
conduct a research on what concerns do developers have when they use the Web
APIs. Different with their goals, we use LDA to extract the concerned topics of the
raised questions by developers during the resolving process to figure out what kind
of questions are more frequently asked by developers when they address a reported
issue.
2.7 Summary
In this chapter, we introduce the existing studies on improving the efficiency of issue
triaging and handling process, the relevant studies on the possible threats to the effi-
ciency of handling issue reports, the existing research on the rejected issue reports and
the applications of machine learning techniques in empirical studies of the software
engineering.

16
Chapter 3
An Empirical Study on the Questions Raised in
the Issue Resolving Process
In this chapter, we perform an empirical study on the questions raised from issue
reports during the issue resolving process, and aim to reduce the negative impact
of the raised questions on the issue resolving process. We examine the raised ques-
tions from 174,233 issue reports in three large-scale systems (i.e., Linux, Firefox and
Eclipse). First, we apply the Latent Dirichlet Allocation (LDA) technique to explore
the frequent topics of the raised questions. Then we investigate how the process of
resolving issues is impacted by the questions raised from the issue reports. Finally,
we build prediction models (i.e., random forest, logistic regression and naive bayes)
to predict if questions are likely to be raised by a developer from an issue report.
3.1 Introduction
The delay in resolving issues can affect the satisfaction of users [19]. Investigating
the factors that impact the efficiency of the issue resolving process has attracted both
academia and industry [29, 30, 65, 12, 62]. An important factor that affects the

3.1. INTRODUCTION 17
Figure 3.1: An example from Linux-53
efficiency of resolving process is the interaction among developers to discuss how to
address a reported issue during the issue resolving process. For example, Breu et
al. [20] find that the active and ongoing participation of developers in the discussion
of an issue report can affect the efficiency of resolving issue reports. When resolving
issues, developers might raise questions in order to clarify the described issue [20, 50,
56] or the requested feature [50]. Once a question is raised, developers need to wait
for the response before taking further actions. The extra waiting period can delay
the issue being resolved. If developers raise unnecessary questions on issue reports,

3.1. INTRODUCTION 18
the efficiency of resolving process could be affected. For example, in the issue report
Linux-53 1 (shown in Figure 3.1), a developer raises questions due to missing steps
to reproduce, and he can not reproduce the issue anymore in Comment-7. Hence, he
asks if there is an explicit way to reproduce the reported issue in a raised question.
In the Comment-9 (after more than two years), another developer figures out how
to reproduce the issue in a specific hardware and software environment, under a
particular configuration. If the issue reporter could provide the detailed steps to
reproduce the issue when creating the issue report, such questions would be avoided
and the issue report would be addressed sooner.
Sillito et al. [78] investigate what information developers generally need and how
developers usually obtain such information. However, it is unclear how raising ques-
tions impacts the issue resolving process. We investigate 174,233 issue reports of three
well known and long-lived systems (i.e., Linux, Firefox and Eclipse). We observe that
there is a considerable proportion (24.89% to 47.04%) of issue reports in each system
that have questions raised by developers during the issue resolving process. Dealing
with the raised questions in such a large amount of issue reports does have a serious
threat to the efficiency of the issue resolving process. Hence, we are interested in
understanding what questions are raised and how the raised questions impact the
issue resolving process, and further identify the possibilities to reduce the negative
impact of the raised questions.
In this chapter, we conduct an in-depth analysis on the questions raised during
the entire issue resolving process. First, we investigate what questions are asked, in
order to understand the reason why developers raise questions and what information
is sought by developers to answer the questions. Second, we investigate the impact
1https://bugzilla.kernel.org/show bug.cgi?id=53

3.2. EXPERIMENTAL SETUP 19
Issue repositories
Issue Tracking Systems
Data extraction
Issue reports
Extract issue
reports
Extract questions in comments
Extract metrics
Data processingTextual
Preprocess
Metrics
Questions LDA RQ2
RQ1
RQ3
Impact metrics
Report metrics
2
3
1
Figure 3.2: Overview of our approach
that raising questions has on the issue resolving process. Finally, we examine the
feasibility of predicting if questions will be raised from a given issue report at the
time when the report is created.
3.2 Experimental Setup
In this section, we present the dataset, and the steps to extract and process questions
from issue reports. Figure 3.2 depicts the overview of our experiment.
3.2.1 Datasets
We choose to study issue reports from three popular ultra-large-scale and open-source
systems, i.e., Linux2, Firefox3 and Eclipse4. Linux is known as a popular operating
system. Firefox is a well-known web-browser. Eclipse has over 250 different open
source projects, like the widely used integrated development environment (IDE) for
software development, modeling tools, reporting tools, and much more. As the three
systems are representative open source systems, studying issue reports in the three
systems can reflect the practice in the open source community.
2https://bugzilla.kernel.org (accessed in Jul. 2016)3https://bugzilla.mozilla.org (accessed in Jul. 2016)4https://bugs.eclipse.org/bugs (accessed in Jul. 2016)

3.2. EXPERIMENTAL SETUP 20
Table 3.1: Description of resolution types, and the numbers and percentages of thenumber of issue reports of a resolution type in the studied projects.
A “-” denotes that the project does not use this resolution type.
Type Description Linux6 Firefox Eclipse
(T0) FIXED1 8,409 36.35% 27,085 19.52% 41,449 50.77%The reported issue is fixed by the assignee.
(T1) PATCH ALREADY AVAILABLE 2,182 9.43% - -A patch already exists for the reported issue.
(T2) INVALID 3,468 15.00% 19,635 14.15% 6,734 8.25%The issue report cannot be addressed.
(T3) WONTFIX2 976 4.22% 6,224 4.49% 8,175 10.01%The issue will not be addressed.
(T4) DUPLICATE 1,555 6.72% 40,733 29.35% 16,132 19.76%The report is a duplicate of another report.
(T5) WORKSFORME3 1,378 5.96% 23,472 16.91% 8,312 10.18%The issue cannot be reproduced.
(T6) DOCUMENTED 623 2.69% - -The reported issue describes intended behaviour.
(T7) INCOMPLETE4 2,238 9.67% 19,467 14.03% -The report is incomplete.
(T8) MOVED 73 0.32% - 5 0.01%The issue report was moved to a different ITS.
(T9) EXPIRED5 2,232 9.65% 2,151 1.55% -The issue no longer exists in the latest version.
(T10) NOT ECLIPSE - - 870 1.03%The reported issue is not related to Eclipse.
Total number of resolved issue reports 23,134 100% 138,767 100% 81,647 100%
1CODE FIX, 2WILL NOT FIX, 3UNREPRODUCIBLE, 4INSUFFICIENT DATA and 5OBSOLETE in Linux.6The percentage given is the percentage of all resolved issue reports.
For each system, we collect all its issue reports from the first issue report until
February 2016. For each issue report, we download all the properties and comments,
as well as the changes made to the attributes (e.g., severity, priority, #CC) in the
entire history. As we aim to predict if questions can be raised from a newly created
issue report (RQ 3.3), we retrieve the initial value of the attributes of issue reports
and issue reporters (details are discussed in Section 3.3.3) that are provided at the
creation time of the issue reports.
To examine the impact of raising questions on the issue addressing process, we
exclude the issue reports that are not resolved (i.e., issue reports still with the status
of NEW, ASSIGNED and REOPENED). As the life cycle of issue reports is described

3.2. EXPERIMENTAL SETUP 21
Table 3.2: The number of issue reports in each studied ITS
ITS Collection # of # of resolved # of reports # of reportsperiod reports reports with questions without questions
Linux 2002 to 2016 27,100 23,134 10,882(47.04%) 12,252(52.96%)Firefox 1999 to 2016 157,340 138,767 54,644(39.38%) 84,123(60.62%)Eclipse 2001 to 2016 406,303 357,744 88,967(24.87%) 268,777(75.13%)
Total 590,743 519,645 154,493(29.73%) 365,152(70.27%)
Figure 3.3: An illustrative example of a url link containing “?”
in Section 1.1, after the issue report is resolved, the issue report changes to the state
RESOLVED with a resolution type as shown in Table 3.1. There are eleven resolution
types in our studied projects, as listed as “T0-T1”” in Table 3.1. Different projects
might use different labels for the same reason of rejecting an issue report. For example,
fixed issue reports are labeled as FIXED in Firefox and Eclipse, but Linux uses the
CODE FIX label. The MOVED label is only used in the Linux and the Eclipse
projects.
Table 3.2 shows the descriptive statistics of the issue reports that we collected
from the issue tracking systems (ITSs) of the three subject systems.
To investigate all raised questions occurred across the issue resolving process,
we go through all the comments of issue reports and extract the raised questions
from the comments using regular expressions. Specifically, we consider a sentence
ending with the question symbol “?” as a question. We only extract questions from
comments which is posted by developers before the issue report is resolved However,
our extracted questions might contain noises.
In summary, there might be three kinds of noise in our extracted questions:

3.2. EXPERIMENTAL SETUP 22
Figure 3.4: An illustrative example of call trace message containing “?”
Figure 3.5: An illustrative example of a code snippet containing “?”
1) URL links (e.g., https://www.***./?). It is common that developers use a
URL link in a comment to refer other issue reports or external pages to help address
the issues. It is possible that a URL link contains the symbol of “?”. For example,
Figure 3.3 shows a URL link appears in the comments of the report Linux-135. In
this example, there exists the symbol of “?” in the URL link, and it is identified as

3.2. EXPERIMENTAL SETUP 23
a question. To exclude such kind of noise, we use a regular expression to identify all
URL links (i.e., strings that start with ”http://” or ”ftp://”) and exclude them.
2) Execution logs. It is common that developers paste execution logs in the
comments to help discuss and investigate the reported issues. Figure 3.4 shows an
example of a call trace embedded in a comment (i.e., in Comment-5 Linux-12595).
We use a regular expression to identify the embedded call trace from the comments.
The format of the call traces usually starts with a date and contains “address format”
(e.g., [<ffffffffa002789f>]) before the symbol of “?”.
3) Code snippet. Code snippet embedded in a comment allows developers to
discuss and investigate the potential reason for generating the corresponding issue in
the code snippet. However, the code snippets can contain noises that are identified as
questions. For example, Figure 3.5 displays an example of noise that is identified as a
question in the code snippet embedded in Eclipse-29779 Comment-103. The symbol
of “? :” is an operator in programming languages (i.e., C, C++, Java and so forth),
and the symbol of “?” can exist in a code snippet. In this case, “?” is followed by an
identifier and a symbol of “:” (e.g., return num>max?num:max). Hence, we exclude
such noise using the regular expression to identify code snippets.
3.2.2 Question Extraction
An issue reporter may submit additional comments that provide extra information
to enrich the description of the issue report. As shown in Figure 3.6, the reporter
posts a new comment (i.e., in Comment1) to enrich the content of the description.
Therefore, we start the questions extraction from the first comments which is not
posted by the issue reporter.

3.2. EXPERIMENTAL SETUP 24
Eclipse-Bug 250:Jean-Michel Lemieux [2001-10-10 21:38:55 EDT]:DestriptionWe need to support ’ext’ connection method for CVS. This will allowany external transport clients for handling authentication and connec-tion with any tool the user want’s to use. ...Jean-Michel Lemieux [2001-10-23 12:58:11 EDT]:Comment1EXT connection method is supported, however configuration is donevia the plugin.xml. ...DJ Houghton [2001-10-23 23:48:51 EDT]:Comment2PRODUCT VERSION: 0.135James Moody [2001-10-25 10:49:36 EDT]:Comment3Fixed in v206
Figure 3.6: An example of the enriched comment
Figure 3.7: An illustrative example of a replying comment
During the resolving process, developers might raise questions from the previous
comments instead of the description of issue reports. To ensure the extracted ques-
tions are more related to the issue reports, we choose to use a conservative approach
to filter out questions raised from the replying comments. The subject issue tracking
systems support the feature of replying comments (i.e., start with the symbol of “>”),
so we can identify the replying comments by the feature. As illustrated in Fig 3.7, a
question (i.e., Why should there be different icons for the personal toolbar folders? )
is raised in a comment due to an early comment (i.e., As it has (slightly) different
functionality, should it not look a little different? ). Hence, we exclude the extracted

3.3. EXPERIMENTAL RESULTS 25
questions from the replying comment.
3.2.3 Question Processing
After collecting the raised questions from the comments, we apply general textual
preprocessing steps, such as tokenizing text, removing stop words and stemming
words. Tokenizing text is to obtain a sequence of strings that do not contain delimiters
(e.g., white space and punctuation symbols). Stop words are the non-descriptive
words like “a”, “is”, “was”, and “the” [88]. The stemming step aims to normalize
the words to their ground forms [87]. For instance, the stemmed version of “working”
and “worked” is the same with “work”. We apply the Porter stemming algorithm as
previous studies [88, 87, 45].
3.3 Experimental Results
3.3.1 RQ3.1: What questions are asked by developers?
Motivation. Developers may raise questions when they encounter issue reports with
insufficient information. Finding out what questions are frequently asked can help
us better understand the information that developers need when resolving issues.
Moreover, if we obtain the information frequently asked by developers during the
issue resolving process, issue reporters can provide such details at the creation time
of issue reports. As a result, we can help developers avoid raising question during the
issue resolving process. In this research question, we aim to investigate the concerned
topics in the raised questions by developers during the issue resolving process.

3.3. EXPERIMENTAL RESULTS 26
Tab
le3.
3:T
he
dis
trib
uti
onof
topic
sin
the
issu
ere
por
tsfo
rth
ree
sub
ject
syst
ems
Lin
ux
Fir
efo
xE
cli
pse
Ind
ex
Lab
ele
dT
op
ics
Frequ
en
cy
Ind
ex
Lab
ele
dT
op
ics
Frequ
en
cy
Ind
ex
Lab
ele
dT
op
ics
Frequ
en
cy
1C
on
figu
rati
on
2,4
52(2
0.5
8%
)1
Safe
mod
e8,7
76(1
4.4
1%
)1
Cu
rrent
statu
s4,7
50(4
.68%
)2
Dri
ver
2,4
43(2
0.5
1%
)2
Cu
rrent
statu
s4,0
05(6
.58%
)2
Com
pon
ent
3,2
99(3
.25%
)3
Com
mit
s1,8
67(1
5.6
7%
)3
Rep
rod
uce
step
s2,6
52(4
.36%
)3
Rep
rod
uce
step
s3,1
09(3
.07%
)4
Cu
rrent
statu
s800(6
.72%
)4
Cra
sh1,4
57(2
.39%
)4
Fin
al
reso
luti
on
2,7
27(2
.69%
)5
Fin
al
reso
luti
on
266(2
.23%
)5
Exte
nsi
on
1,2
46(2
.05%
)5
Plu
gin
2,6
48(2
.61%
)6
Sou
nd
&S
pea
ker
159(1
.33%
)6
Image
featu
re1,0
87(1
.79%
)6
Pack
age
dep
end
enci
es1,7
83(1
.76%
)7
Exp
ired
rep
ort
156(1
.31%
)7
Fin
al
reso
luti
on
1,0
55(1
.73%
)7
Op
erati
ng
syst
em
1,6
99(1
.68%
)8
Op
erati
ng
syst
em
123(1
.03%
)8
Cookie
sd
ata
1,0
38(1
.70%
)8
Ver
sion
contr
ol
1,6
98(1
.67%
)9
Con
curr
ency
101(0
.85%
)9
Bro
wse
r985(1
.62%
)9
Jar
dep
end
enci
es1,6
36(1
.61%
)10
Em
ail
96(0
.81%
)10
Bookm
ark
/H
isto
ryfo
lder
922(1
.51%
)10
Dev
elop
men
ten
vir
on
men
t1,5
85(1
.56%
)11
Su
gges
tion
96(0
.81%
)11
Page
load
ing
871(1
.43%
)11
Log
info
rmati
on
1,5
82(1
.56%
)12
Cach
e89(0
.75%
)12
Use
rin
terf
ace
869(1
.43%
)12
En
cod
ing
1,5
08(1
.49%
)13
Clo
sin
gre
port
72(0
.60%
)13
Plu
gin
861(1
.41%
)13
Req
uir
emen
t1,3
64(1
.35%
)14
Ver
sion
Contr
ol
70(0
.59%
)14
Tab
gro
up
s792(1
.30%
)14
EM
F1,2
46(1
.23%
)15
Mem
ory
69(0
.58%
)15
Op
erati
ng
syst
em
781(1
.28%
)15
Zip
file
s1,1
94(1
.18%
)16
Fre
qu
ency
65(0
.55%
)16
Ad
dit
ion
al
info
rmati
on
677(1
.11%
)16
Su
gges
tion
1,1
73(1
.16%
)17
Lev
el65(0
.55%
)17
Con
figu
rati
on
667(1
.10%
)17
Work
space
1,1
58(1
.14%
)18
Log
info
rmati
on
62(0
.52%
)18
Hu
man
ori
ente
d630(1
.03%
)18
Con
curr
ency
1,1
28(1
.11%
)19
Rep
rod
uce
step
s61(0
.51%
)19
Issu
ere
lati
on
610(1
.00%
)19
JD
T1,0
94(1
.08%
)20
Patc
h59(0
.50%
)20
Blo
ckin
gis
sues
595(0
.98%
)20
Solu
tion
1,0
36(1
.02%
)
Top
ic1
9,1
71(7
6.9
9%
)30,5
76(5
0.2
1%
)37,4
17(3
6.9
0%
)
1T
he
tota
lnu
mb
erof
the
issu
ere
port
sth
at
conta
inth
equ
esti
on
sass
oci
ate
dw
ith
the
20
most
freq
uen
tto
pic
s.

3.3. EXPERIMENTAL RESULTS 27
Approach. To answer this question, we first present our approach to extract
topics from questions and then discuss the extracted topics. Details are described in
the subsections.
Topic Extraction
To summarize the topics in raised questions, we apply the Latent Dirichlet Alloca-
tion (LDA) [17] that is widely used for topic extraction in the literature of software
engineering. LDA is a statistical model. The input for LDA is a list of documents,
and the output of LDA is the distribution probability of each extracted topic in each
document.
In our experiment, we treat the raised questions from the same issue report as
one document, so that we can know the distribution of topics in the raised questions
for each issue report. We follow the standard natural language processing steps (see
Section 3.2.3) to preprocess each document. Specifically, we remove stop words from
each document and do the stemming to normalize the document.
LDA Parameter Setting We run with 1,000 Gibbs sampling iterations by follow-
ing the guideline from previous work [33], and set the number of keywords for each
topic to be 20. The number of topics (we denote it by K) impacts the quality of the
topics extracted by LDA [33, 10, 21, 27, 68]. To find the optimal number of topics
(we denote by K), we compute the following three metrics:
• Arun2010 [10] that is computed based on two matrices (i.e., Topic-Word and
Document-Topics), which are generated from LDA. The lower value, the better.
• CaoJuan2009 [21] that calculates the cosine distance of topics. The minimum

3.3. EXPERIMENTAL RESULTS 28
value of CaoJuan2009 indicates that the corresponding K is the optimal number
of topics.
• Griffiths2004 [33, 68] that is computed based on an estimate multinomial dis-
tribution of K topics to words in the corpus. The maximum value ofGriffiths2004
indicates that the corresponding K is the optimal number of topics.
We apply the FindTopicsNumber function from R package ldatuning by varying
K from 2 to 500. As the FindTopicsNumber function takes a very long time to finish
for a large dataset, we apply it on a statistically representative sample of 2,368 issue
reports. The sample issue reports are randomly selected from 174,233 issue reports
with the confidence level at 95% and the confidence interval at 2%. The sample is
statistically representative. In the other words, the distribution of topics in the 2,368
issue reports can represent the distribution of topics in the 174,233 issue reports.
Therefore, the number of topics obtained from a statistically representative sample
can represent the number of topics obtained from the 174,233 issue reports. The
optimal number of topics suggested by the three metrics Arun2010, CaoJuan2009,
andGriffths2004 are 107, 162, and 182, respectively. Accordingly, we set the number
of topics as 150 in our experiment that is close to the three suggested Ks.
LDA Topic Labelling Each LDA topic is represented by a vector of 20 words.
To better understand the meaning of each topic, we asked four graduate students to
manually label each topic based on its keywords [11]. The four graduate students
all study in computer science one of them is the 3rd year Ph.D student, the rest of
them are master students. The four students independently assign labels. The four
graduate students all study in computer science. One of them is a 3rd year Ph.D.

3.3. EXPERIMENTAL RESULTS 29
student, and the rest of them are master students. When different labels are assigned
to the same topic, a discussion is conducted until a consensus is reached.
We present the 20 most frequent topics for each system in Table 3.3, as over
76%, 50% and 36% of issue reports are related to the top 20 most freqently asked
questions in Linux, Firefox and Eclipse respectively. For each topic, the frequency is
computed as the number of issue reports that contain questions associated with the
topic. We consider that an issue report (i.e., a document) is associated with topics,
if the corresponding topics are assigned the highest score by LDA in the document.
Results. In Linux, three topics, i.e., Configuration, Driver and Com-
mits, appear in more than a half (i.e., 56.76%) of all issue reports. The
topic, Configuration, refers to questions raised by developers to clarify the hardware
and/or software configuration of the machine of issue reporters. For instance, ques-
tions related to Driver are raised to clarify the detailed information of drivers for
the reported issue. Questions associated with Commits are asked to find out which
commit introduces the issue. We think that at least two types of questions (i.e.,
Configuration and Driver) can be reduced or even avoided by developing a tool to
automatically collect the configuration and driver information for issue reporters.
In Firefox, the most frequently occurring topic is the Safe mode, which
appears in 14.41% of all issue reports. Firefox has a large number of add-ons.
In the safe mode of Firefox, all add-ons are disabled. When an issue is reported to
Firefox, developers need to ensure that the issue is caused by bugs of Firefox not by
bugs of add-ons. Therefore, developers usually ask issue reporters if Firefox is in the
safe mode. To avoid such types of questions, we suggest issue reporters to reproduce
the issue in the safe mode and explicitly mentions the usage of the safe mode in the

3.3. EXPERIMENTAL RESULTS 30
description.
In Eclipse, there is no topic clearly occurring more frequently than
others. As shown in Table 3.3, the 20 most frequent topics only cover 36.90% of the
population. One reason may be that Eclipse project is embedded with multiple plug-
in components. The reported issues can be caused by various reasons from different
plug-in components and developers of different plug-in components have different
focuses of the needed information in the issue resolving process. It may be difficult
to provide a universal solution to reduce or avoid questions raised in the Eclipse issue
reports.
As a summary, the majority of the 20 most popular topics vary across
systems. The list of the 20 most frequent topics in each system is shown in Table 3.3.
The coverage of the 20 most frequent topics also varies across systems. For instance,
the 20 topics appear in 76.99%, 50.21%, and 36.90% of issue reports in Linux, Firefox,
and Eclipse, respectively. The difference may be due to the characteristics of the
three systems. In Linux, developers deal with the kernel of an operating system to
support different hardware/drivers) and various configurations. In Firefox, developers
maintain a widely used browser that is enhanced by many add-ons, and issue reports
can be created against bugs of Firefox or its add-ons. In Eclipse, there are many
subprojects that do not overlap too much with each other.
Among the 20 topics, there are only four common topics across systems.
The four common topics are Current status, Final resolution, Operating system, and
Reproduce steps. The topic Current status refers to questions that are raised by
developers to check the current status of an issue report. The resolution of an issue
report may be delayed for a long period [96], then developers lose track of the issue

3.3. EXPERIMENTAL RESULTS 31
report. The topic Final resolution refers to questions that clarify the final decision
made on issue reports, and it happens when developers cannot reach a consensus.
This type of question is likely to be reduced or avoided if all involved developers
decide to solve the issue only after the issue is fully discussed. Questions related
to topics Reproduce steps and Operating system are generally essential to clarify the
detailed steps and the environment to reproduce an issue. Issue reporters should
try their best to provide as many details as possible on the reproduce steps and the
environment.�
�
�
�
From LDA model, the common topics of the questions raised from the
issue reports are Current status, Final resolution, Operating system,
and Reproduce steps among the three subject systems. However, the
majority of raised questions are specific to each system.
3.3.2 RQ3.2: What is the impact of raising questions?
Motivation. There are a considerable amount of issue reports having questions
raised during the issue resolving process. As shown in Table 3.2, questions are raised
in 47.04%, 39.38%, and 24.87% of issue reports in Linux, Firefox, and Eclipse, re-
spectively. But it is unclear how having questions impacts the issue resolving process.
Hence, in this research question, we study how raising questions to hanlde an issue
affect the efficiency of the issue resolving process.
Approach. To answer this question, we first describe our measurements of the
impact and the null hypothesis. Then we discuss our findings on the impact of raising
questions. Details are described in the following subsections.

3.3. EXPERIMENTAL RESULTS 32
Measurement of the Impact
In our experiment, we measure the impact of raising questions on the issue resolving
process from four perspectives. Specifically, we use the following four metrics.
• Time elapsed measures the duration between the time when an issue report is
responded by the developers (e.g., posting comments or modifying some fields
of an issue report) and the time when the issue is resolved.
• The number of developers is the count of developers that are involved in the
issue resolving process.
• The number of comments is the count of comments that are posted by the issue
reporter or developers during the issue resolving process.
• The number of assignments counts the times that an issue report is assigned/reassigned
to developers.
The smaller value of the aforementioned four metrics, the more efficient the issue
resolving process is. The smaller values indicate that an issue is resolved quicker,
involves fewer developers, derives fewer comments, and is assigned to the appropriate
developer with fewer iterations.
Null Hypothesis
To study the impact of raising questions, we divide the issue reports into two groups
for each system. The first group (as a control group) contains all issue reports that
do not have questions raised during the issue resolving process. The second group (as

3.3. EXPERIMENTAL RESULTS 33
an experimental group) contains all remaining issue reports that have questions. For
each of the four aforementioned metrics, we test the following null hypothesis:
H01 : There is no difference in the distribution of the values of the metric between
the issue reports without and with raised questions.
To test the null hypothesis, we apply the Mann-Whitney U test [77] with the
95% confidence level(i.e., p-value < 0.05). The Mann-Whitney U test is also known
as the Wilcoxon rank sum test, which is a statistical method having no assumption
on the distribution of two assessed variables, i.e., the values of the assessed metric.
If there is a statistically significant difference, i.e., p-value <0.05, we reject the null
hypothesis and conclude that the distribution of the values of the corresponding
metric is significantly different between the issue reports with and without questions.
Moreover, the control group and the experimental group are drawn from the same
population. Our hypothesis is that the distribution of the values of metrics should
be identical between the two groups. If we control one variable (i.e., one metric),
the distribution of the corresponding metric will become statistically significantly
different between the control and experimental group. Therefore, we could establish
the causation between the controlled variable(i.e., issue reports with questions or not)
and the assessed metrics5.
Results. Raising questions could be one of the risks of delaying the
issue resolving process in terms of the elapsed time. Figure 3.9 shows the
distribution of each metric in two groups, i.e., issue reports with questions (WQ)
and issue reports without questions (NQ). The result of Mann-Whitney U test shows
that there exists a statistically significant difference between the issue reports with
5http://www.abs.gov.au/websitedbs/a3121120.nsf/home/statistical+language+-+correlation+and+causation (accessed in Jul. 2016)
3.3. EXPERIMENTAL RESULTS 34
Linux-Bug 915:Greg Kroah-Hartman [2003-07-1220:32:55 UTC]:Can you attach your .config?Roger Luethi [2003-07-14 11:50:20UTC]:Created attachment-527Greg Kroah-Hartman [2003-07-1512:42:23 UTC]:Ok, I’ve duplicated this now, I’ll work on it...
Linux-Bug 9147:Erik Boritsch [2007-12-01 16:44:03UTC]:The bug is still there with CON-FIG ACPI EC is not set. Any otherideas?Sebastien Caille [2007-12-05 15:16:34UTC]:I tried to dump /proc/interrupts every 5 sec-onds. ... Something is definitely triggeringthe irq1 when acpi=on...Daniele C. [2007-12-05 15:44:15 UTC]:... maybe i8042 multiplexer is triggering awrong IRQ.
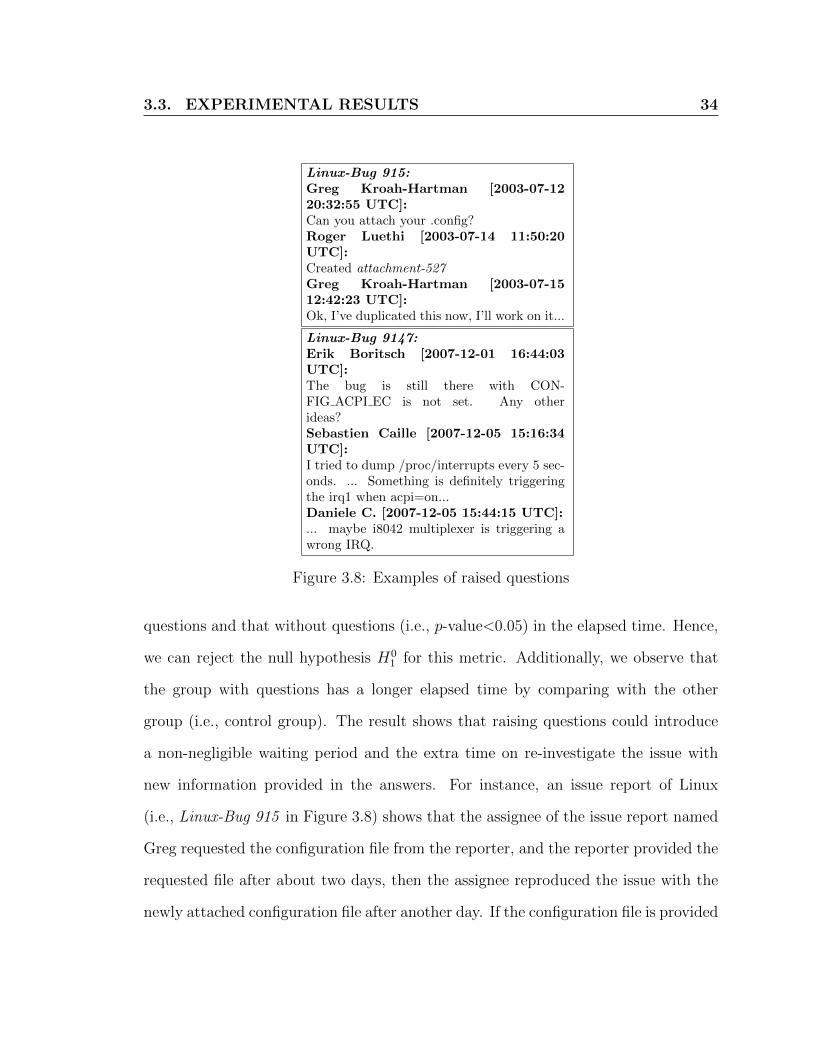
Figure 3.8: Examples of raised questions
questions and that without questions (i.e., p-value<0.05) in the elapsed time. Hence,
we can reject the null hypothesis H01 for this metric. Additionally, we observe that
the group with questions has a longer elapsed time by comparing with the other
group (i.e., control group). The result shows that raising questions could introduce
a non-negligible waiting period and the extra time on re-investigate the issue with
new information provided in the answers. For instance, an issue report of Linux
(i.e., Linux-Bug 915 in Figure 3.8) shows that the assignee of the issue report named
Greg requested the configuration file from the reporter, and the reporter provided the
requested file after about two days, then the assignee reproduced the issue with the
newly attached configuration file after another day. If the configuration file is provided

3.3. EXPERIMENTAL RESULTS 35
12 Yonghui Huang et al.
NQ WQ
02
46
810
12
Elpa
sed
Tim
e lo
g(da
ys+1
)
●●●
●●●●●
●
●
●
●
●●
●
●
●
●●●●●●●●●
●
●●●●●●●
●●●●●●●●●
●
●
●
●●●●
●●●●
●●
●
●
●●●●●●●●●●
●
●●
●●●●●
●●●●●
●●●●
●●●●●●
●
●●●●●●●
●
●●●
●
●
●●
●
●●
●
●
●
●
●●●●
●
●
●●
●
●
●
●
●●●
●
●
●
●
●●●●●●●
●
●
●●●
●
●
●●●●●●
●●●●●●●
●
●●
●●
●
●●
●
●●●●●●●●
●
●●●●
●
●
●●
●
●●●●●●●●
●
●
●
●●●●
●●●●●●●●
●
●●●●
●●
●●
●
●●●●●
●●●●●●●●●●●●●●●●●●●●●
●●
●●●●●●
●
●●●●●
●
●●●●●●●●
●●●●●●●●●●●●
●●●●
●
●●●●●●
●
●●●●
●
●●
●●●●●●●
●
●●●●●●●
●●●●
●
●
●●
●●●●●
●
●●●●
●●●
●
●●
●●●●
NQ WQ
02
46
8
# C
omm
ents
log(
coun
ts+1
)
●
●●
●
●●
●
●
●
●●
●●●●
●
●●
●
●●●●●
●
●
●
●●●●●●●●
●
●●
●●●●
●●●●●●●●●●●●●●●
●
●●
●
●●●●●●●
●
●●●
●●
●●●●●●●
●●
●●
●
●●●●●●●●●●●●●●●
●●
●●●
●
●●●●
●
●●●
●
●●●●●
●
●●
●
●●
●●
●●●
●
●●
●●
●●
●●
●
●●●●●●
●
●
●
●
●●●
●
●●●●●●●
●●●
●
●
●
●
●
●
●●●
●●●●●
●●
●●●●
●●
●●●
●
●●●●●●●●
●
●●●
●●
●●●●●●●●
●
●●●●
●
●●
●●●●●●●
●●
●●
●●
●●
●
●●
●
●●●●
●
●
●
●
●●●●
●●
●
●●●●
●●
●
●●
●
●
●
●●●●●
●●
●●●●●
●
●
●●
●
●
●●
●●
●
●●●
●●
●
●
●●●●
●
●●
●
●●●
●
●
●●
●●●
●
●
●
●
●●●
●
●
●
●●
●
●
●
●
●
●●●●
●
●
●●
●
●●●
●
●
●
●●●
●●
●●●●●
●
●●●
●
●
●
●●●●●
●
●●●●
●
●
●
●●●
●
●●●●●
●
●●●●●
●
●
●
●●●
●
●●
●
●●●●●
●
●●●●●●●●●●●
●●
●●●●●
●●
●●●●●●●●
●
●
●
●●
●
●
●
●●●●●●●
●
●●●
●
●●●●●●●●●●●●●
●
●
●
●●●●●●●
●
●
●
●●●●●●●●●●●●●
●●
●●●●●●●●●
●
●
●●●
●
●●
●
●●●●●●●●●●●●●●●●●
●
●●●●
●
●●●●●●●●●●●●●●●●●●●●●●
●
●●●●●●●●●●●●●●●●●●●
●●
●●●●●●●●●●●●
●
●●●●●●●●●●●●●●●●●
●
●●●
●
●●●●●●●●●●●●●●●●●●●●●●●●
●
●●●●●●●●●●
●
●●
●●
●
●
●●●●●●●
●●
●●●
●
●
●
●●●●●●●●
●
●●●●●●●●●●●●
●
●●●●●●●●●●
●
●●●●●●●●●●●●●●●●●
●
●●●●●
●
●●●●
●
●●●
●
●●●●●
●●
●●●
●
●●●●●●●●●●●
●
●●
●
●●●●●●●
●●
●●●●●●●●●●●●
●
●●●●●●
●
●●●
●
●●●
●
●●
●
●●●
●
●●●●●●●●●
●
●●●●●●●●●●
●
●●
●
●●●●●●●
●
●
●
●●●●●●●
●
●●●●●●●●●●
●
●●●●●
●
●●●●●●●●●●●●●●●
●
●●●●●●●●●●●●●●●●●●●●●●●●●●●●●●
●
●●●●●●●●●
●●
●●●●●●
●
●●●●●●●●●●●●●●●●●●●●●●●●●●●●●●●●●●●●●●●●●
●
●●●●●●●●●●●●●●●
●
●●●●●●●●●●
●
●●
●
●●●●●●●●●●●●●●●●●●●●●●●●●●●●●●●●●●●●●●●●●●●●●
●●
●
●●●●●●●●
●●
●
●
●●
●●●●●●●●
●
●●
●
●
●
●●●
●
●
●
●●
●
●
●
●●
●
●
●
●●●●●●
●
●
●●●●
●
●●
●
●
●
●●●
●
●
●
●●●●●
●
●
●
●●
●
●●●●●●●●●
●●●●●●●●
●●
●
●
●●●●●●
●●●●●
●●●
●●
●
●
●
●
●
●
●
●
●
●●
●●●●●●●●●●
●
●●●●●●●●
●
●
●●
●
●●●
●
●●●●●●●
●
●
●●
●
●●
●
●●●
●
●
●●●●●
●
●●●
●●●●●●●●
●●●●●●
●
●
●●
●●●
●
●
●
●
●●●●●●●●●
●●
●
●
●
●
●●●●
●
●
●
●●
●●●
●
●
●●●
●
●
●
●
●
●●
●●●
●●●●
●
●
●
●
●
●
●●
●●●●
●
●●●
●
●
●●
●●●●
●
●
●
●●
●
●
●●●
●●●●●●●
NQ WQ
01
23
45
6
# D
evel
oper
s lo
g(co
unts
+1)
●●
●
●
●●●●
●
●
●
●
●
●●●●
●
●
●
●
●●●●●●●
●
●
●●
●
●
●●
●
●
●
●●
●
●
●●●
●
NQ WQ
0.0
1.0
2.0
3.0
# As
sign
men
t log
(cou
nts+
1)
(a) Linux
NQ WQ
02
46
810
12
Elpa
sed
Tim
e lo
g(da
ys+1
)
●●●●●●●●●●●
●●●
●●●●●●●●●●●●
●●●●●●●●
●
●●●
●●
●
●●●●●●●●●●●
●●
●●●●
●●
●●●●●●●●
●
●
●
●
●
●●●●●●
●●●
●●●●●
●
●●●
●
●●●●●●●●●●●●
●●●●●●●●
●
●
●●
●
●●●●●●●●
●●●●
●
●●●●●●●●●●●●
●
●●●●●●●●●●●●●
●
●●●●●●●●●●
●
●
●
●●●●●●●
●●●●●●●●●●●●●
●
●●●●●●●●●
●
●●●●●●●●●●●●
●
●●
●
●●
●●●●
●
●●●●●●●●
●
●●●●
●●●●●●●●●●
●
●●●●●●●●●●●●●●●●●●●
●●●
●●●●●●●●●
●
●
●●●●●●●●●●●●
●
●●●
●
●
●●●●●●●
●
●●●
●●●●●
●●
●
●●●●●●●●
●●
●●●●●●●●●●
●●
●●●●●●●
●
●
●●●●●
●●
●●
●
●●●●●●
●
●
●●●●●●●
●
●●●●●●●●●●●●●
●●●
●●●●●●●●●●●
●●
●●●●●
●
●●●●
●●●●●
●
●
●●
●●●●●
●
●●
●
●●●●
●
●
●●●●
●
●●●●
●
●●●●
●
●●●●●●●●●●●●●●●●●●●
●
●
●●●●●●
●
●●
●
●●
●●●
●
●●
●●●●●●
●
●●●●
●●●●●●●●●●
●●
●●
●●●
●
●●●●●●●●●●●●●●●●●●
●●●●●●●●●
●●●●●●
●
●
●
●
●●
●
●
●
●
●●●●●
●
●●
●●
●●
●●●●●
●●
●●
●●
●
●
●●●●●●●●
●●
●●
●
●
●
●
●
●●●
●
●
●
●●●
●
●●●
●
●●●
●
●●
●
●●
●●●●●●●●●●●●
●
●●●●●●●
●
●●●
●
●●●●●●●●●●●●●●●
●
●●
●
●●●
●
●
●●●
●
●●
●
●
●
●●●
●●●●●
●
●●●●
●
●●●●●●
●
●
●
●●●
●
●●●●●●
●●
●
●
●●
●●●●
●
●●
●
●●●●●●●
●●
●●
●
●●
●
●
●●●●●●●●●●●●●●●●●●●●
●
●●●●●●●●
●
●●●●●●●●●
●●
●●●●●●●
●●●●
●
●●●
●●
●●●
●
●●●
●
●
●
●
●●
●
●●
●
●●●
●●
●
●●
●
●●●●●●
●
●
●●
●
●
●
●●●●●●●●●●
●
●●●●
●
●
●
●●●●
●
●
●●●
●
●
●●●
●
●
●●●●●●●
●●
●
●●●●●●●●
●●
●●
●
●
●●●
●●
●
●
●
●●
●●●
●●●
●
●
●
●
●
●
●
●
●
●
●
●
●
●
●●
●●●●●
●
●●
●
●●
●
●
●●
●●●●●●
●●
●
●
●●●●●●
●
●●
●
●●●●
●●
●●●
●
●●
●
●●
●
●●●
●●●
●
●
●
●●●●●●●
●
●●
●
●
●
●●
●
●●●●
●
●●●
●
●
●●●●●●●
●
●
●
●●●
●
●
●
●
●
●
●
●
●
●
●●
●
●●
●
●●●
●
●●
●●●●●
●
●●●●
●
●●●●
●
●●●●
●
●
●●●●●
●
●
●●●●●●●
●
●●●●●●●●●
●
●●●●
●
●●
●●●●●●●
●●●
●
●●
●
●
●
●
●
●
●●●
●
●
●
●
●
●
●
●
●
●
●
●●●●●●
●
●
●
●●●
●●●●●●●
●●●
●
●
●
●
●●●●
●●●
●
●●
●●
●●●
●
●
●●●
●
●●●●
●
●●●
●
●
●●
●
●
●●●●
●
●
●●●●
●
●
●
●
●
●
●●
●●
●
●●●●
●
●●
●
●
●
●
●
●
●
●
●
●
●
●
●●
●●
●
●
●●●
●
●
●●●●●
●
●
●
●
●
●
●●●
●●●
●
●●●
●
●
●
●
●
●
●
●
●●
●
●
●
●
●
●
●
●●●
●●●
●
●
●
●●●
●
●●
●●●●●●●●●
●
●●●●
●
●
●
●
●
●
●●●
●
●●
●
●●●
●●
●
●●
●
●
●●●●
●
●
●
●●
●
●
●
●
●
●●
●●
●
●●●
●
●●
●●
●
●
●
●●●
●
●
●
●
●
●
●
●●
●
●
●
●●
●●
●
●●
●
●
●
●●
●
●
●
●
●
●
●
●
●
●
●●
●
●●●
●
●
●
●●●
●
●●
●
●
●
●
●
●●
●
●
●
●
●
●●
●
●●●●●
●
●
●
●
●
●
●
●
●
●●●
●
●●●
●
●●●●
●
●
●●
●
●
●●●●
●●
●
●
●
●
●
●●
●●●
●●●
●
●
●
●
●
●
●
●
●
●●●
●
●
●
●
●●●●
●
●●
●●
●●●
●
●
●
●
●
●
●
●
●
●
●●
●
●●
●●●
●
●●
●
●
●●●
●
●
●●●
●
●
●●
●
●
●
●●
●
●
●●
●
●
●●
●
●●●●
●●
●●
●●
●
●●
●●
●
●
●
●●
●
●●
●●●●●●
●
●
●
●●●●●●●
●
●
●●●
●●●●●
●
●●
●
●
●
●
●●
●
●●
●
●
●
●●●
●
●
●
●
●
●
●
●
●
●
●●
●
●●
●
●●●●●●
●
●
●●
●
●
●●
●●●●
●
●●
●
●●
●
●
●
●
●
●
●●
●
●
●●
●
●
●
●
●●
●
●
●●●●●●
●
●
●●●●
●●
●●●●●●
●●
●
●●
●●
●
●●
●
●
●
●
●●●
●
●●●●●
●●●
●●
●
●
●●
●
●●
●
●
●●
●
●●
●
●●●●
●●●
●
●
●
●●●●●●●●
●
●
●
●●
●
●
●●●
●
●●
●●●
●
●●
●
●
●
●●●
●●●●
●
●●
●●●
●
●
●
●
●
●●
●●
●
●
●
●
●
●
●
●●
●
●●
●
●
●
●
●
●●●●●●
●●
●
●
●
●
●
●●●●
●
●●
●●●
●●
●
●
●
●
●
●
●
●
●
●
●
●
●●
●●
●
●●
●
●
●
●
●●●●
●
●●●
●
●●
●●
●
●●●
●
●●●
●
●●
●●●●●
●●
●
●
●●●
●
●●●●
●●●●●●●●●
●
●●
●●●
●
●
●●
●
●●●
●●●●●
●
●●●
●●
●●●
●
●
●
●●
●
●
●●
●
●
●●
●●
●
●
●●●●●●
●
●
●●●●●●
●
●
●
●
●●●
●●●●●
●●●●●
●●
●
●
●
●
●
●
●●●
●●
●
●●
●
●
●
●
●
●●●
●
●
●
●
●
●
●
●
●
●
●
●
●●●●●
●
●
●
●●●
●
●
●●
●
●●●
●
●●●●●●●●●●
●
●●●
●
●●
●
●●
●●●
●
●●
●
●●●●●●●●●●●●●
●
●●●
●
●
●●
●●
●
●
●●
●●
●
●●
●
●
●
●●
●
●●
●
●●●●●●
●
●
●●●●●
●●
●
●●
●
●●
●
●
●
●●
●
●●●
●
●
●
●
●●●
●
●●
●●●●●
●●
●●
●
●●
●
●●●●●●●●
●
●
●
●●●●●●●●
●●
●
●
●
●●
●
●
●
●
●
●
●●●
●
●●●
●
●
●
●●●
●
●
●●
●
●●
●
●
●●●●●●●
●●●
●
●●●●●●
●
●●●●●●●●●●●●●●
●
●●●●●●●
●●●●●●●●●
●●●●●●●
●●●●●●●
●
●●●●
●
●●●●●
●●
●●
●
●●●●●
●●●
●●●●●●●●●
●
●
●
●●●●●●
●
●
●●●
●
●
●●●
●
●
●●
●●●
●
●●●
●
●●●●●●●●
●
●●●
●
●●
●●●●●●
●●●●●●●
●
●●●
●●
●
●
●●
●
●●
●●
●
●●●●●
●
●
●●
●
●
●●
●●●●●●●
●●
●
●●
●
●
●●●●
●●●
●
●
●
●●●
●●
●
●●●●●●●●●
●
●●
●
●●●
●
●●●●●
●●●
●
●
●●●
●
●●●●
●
●
●
●●
●●
●
●
●
●●●
●●●
●●●
●
●●●●
●
●●
●
●●●
●●●●●●●
●
●●
●●●
●●●
●●●●●●
●●
●●●●●●●
●●●
●
●
●
●●
●
●
●
●
●●●
●
●
●
●●●
●●●
●
●●●
●●
●
●
●●
●
●●●●●
●
●●
●
●
●
●
●
●●●●●
●
●●
●
●●●●●
●
●●●●●●
●
●●●●●
●
●
●●
●
●●
●●●
●●
●
●
●●●●
●
●
●
●●●●
●
●●●●●●●●●●●●●●●
●●●●●●●●●●●
●
●
●●●
●●
●
●●●
●
●
●
●
●●
●
●●●●●●
●●●●●●●
●
●
●●●
●
●●
●
●
●
●●●●●
●●●●●
●●●●
●
●
●
●●
●
●
●●●
●
●●
●●
●●●
●
●●●
●
●●
●
●
●●●●●
●●
●
●
●
●
●
●
●
●
●●●●●●
●
●
●●
●
●●
●
●●
●●
●
●
●
●
●
●●●●●
●
●
●
●
●
●●
●●●
●●
●●●●●●
●●
●
●
●
●
●
●●●●●
●
●●●
●
●●
●
●
●●●●●●
●
●
●●●●
●
●●●●●●
●
●
●
●
●●
●
●●
●
●
●
●●●●
●●
●
●
●●
●●
●●●●●●●
●●
●
●
●●
●
●
●
●
●
●
●
●●●●●●●
●●
●●●●
●
●●●●●●
●
●●●●
●
●
●
●
●
●
●●
●
●
●●●●●●●●
●●
●
●●
●
●
●
●
●●●●●●●
●
●
●●
●●●
●
●●
●
●●●●●●
●
●●●●●
●
●●●●
●●●●
●●●
●
●●
●
●
●
●
●●
●●
●
●●●●
●
●●
●
●
●●
●
●●
●●●●
●●
●
●●
●
●●●●
●
●
●
●
●
●●
●●●●●●●
●
●
●●●●
●
●●●
●
●
●
●
●
●
●●●●
●
●
●
●
●
●●●●●
●
●
●●
●
●●
●
●●●
●●●
●
●
●●
●
●
●●
●
●●●●●
●
●
●
●●●
●
●●
●
●●
●
●●
●●
●●●
●
●●
●
●●
●
●●
●
●
●●●
●
●●●●
●
●
●
●
●●
●●●●
●
●●
●●●●●●●●
●●
●
●●●
●
●
●●
●●●
●
●
●
●●●●
●●●
●
●●●●●●
●
●●●●●
●
●●●●●
●●
●
●
●●
●●
●
●
●
●
●●
●
●●
●●●●●●
●
●●●●●
●●
●
●●●
●
●●●
●●
●●●
●●
●●
●
●
●●
●
●
●●
●
●●
●
●
●●
●
●●
●
●
●●
●●●●●●●●
●
●●●●
●
●●
●
●
●
●
●●●
●
●
●
●
●
●
●
●
●
●
●
●
●●
●●●●●
●
●
●●●●
●●
●
●
●
●
●
●
●●
●
●
●●●●●●
●
●●
●●●
●
●
●●
●
●●●●
●
●●
●●
●
●
●
●●●
●●
●
●
●
●
●
●
●
●
●
●●
●●●
●
●
●
●
●●●●●
●
●
●
●
●●●
●●
●
●
●
●
●
●●●●
●
●
●
●
●●
●●
●●●●
●
●
●●●
●
●
●
●
●
●
●●●●
●
●
●
●
●
●●
●
●
●
●●
●●
●●●
●●
●
●
●●
●●●●
●●
●
●●
●●
●
●
●
●
●
●●●●
●
●●
●
●
●
●
●●
●●●
●
●
●
●
●
●
●
●●●●●●
●
●
●
●
●●●
●
●
●
●●●
●
●●
●
●●
●●●
●
NQ WQ
02
46
810
# C
omm
ents
log(
coun
ts+1
)
●●
●●●●●
●●●
●●●●●●●●
●
●●●●
●
●
●
●●●●
●●●●●
●
●
●
●
●●
●●
●
●
●●●
●
●●●●
●
●
●●
●
●●●
●●●●●
●●
●
●
●●●●●
●
●
●●
●
●●●●
●
●
●
●●●
●
●
●
●●
●
●●●●●●●●●●●
●●●●●●●●●●
●●
●●
●
●●●●
●●
●●
●
●●●●
●
●●
●
●●●
●
●●
●
●
●
●
●●
●
●●●●●●●●●●
●●
●
●●●
●●●
●
●●●●●
●
●
●●●
●
●
●
●
●
●●
●
●●
●
●
●
●
●
●●●●●●
●
●●●●●●●●●●●●
●
●●
●●
●
●●●●
●
●●●●●●●●●●
●
●
●
●●●●
●
●●
●
●
●●
●
●
●
●
●
●●
●
●
●●●
●
●●
●
●
●●
●
●
●●
●●●●●●
●
●
●
●
●
●
●
●●
●
●●●●●●●●●●●
●
●●●●●●
●
●●
●●●●●●●
●●
●●●●●●
●
●●●●
●
●●●●●
●
●●
●●●●
●●
●
●
●●●
●
●●
●●●●●
●
●●
●
●●●●●
●
●
●
●●●●●●
●●
●●
●
●
●●
●
●●●●●●●●●●●
●●
●●●●●●●●●●●●
●
●●●●
●●●●●●●
●●●
●
●
●
●
●●
●
●●●●
●
●●●
●
●●●
●
●●●●●
●●●●●
●
●●●
●●
●
●
●
●●
●
●
●●
●
●●●
●
●●●●
●
●
●
●●●●●●●●●
●
●
●
●
●●
●
●●●●●
●
●
●
●●●●●
●
●
●●
●
●
●
●●●●●●
●
●●●
●●●●●●
●●
●●●
●
●
●
●●
●●●
●
●●
●
●
●
●
●
●●●
●
●●●
●
●
●
●●●
●●
●●
●●●●●
●●●●●
●
●
●
●
●
●●●●●●
●●●
●●●●●●●●●●
●●●
●●●●
●●
●
●●●
●
●
●
●●●
●
●●●●●●
●●●
●
●●
●●●●
●
●
●
●●●
●
●●●●●●
●
●●●●●●
●●●●
●
●●
●
●●
●
●●●●●
●●
●●●●
●
●●●●
●
●
●
●●
●
●
●
●●
●
●
●●●●●
●●●
●
●●
●
●●●●●
●
●
●
●
●
●
●
●●●
●
●
●
●●
●
●●
●
●
●●●●●●
●
●
●●
●●●
●
●●
●
●
●●●●●
●●
●
●
●
●
●
●●●●
●
●
●
●●
●
●
●
●●
●●●●●
●
●
●
●●●●
●
●●
●
●
●●●●
●
●
●
●●
●
●
●
●●●●
●
●●●
●
●
●●●
●
●
●
●
●
●
●●●
●
●●
●
●●●●●●●●●●
●
●
●●
●●●
●
●●●●●●
●
●●●●●●●●●●●
●●
●
●●●
●
●
●
●●
●
●●●
●●●
●
●●
●●●●●●●●
●
●●
●
●●●●
●
●
●
●●●●
●
●●●●●
●
●●●●●●
●
●
●●●
●
●
●●
●
●
●
●●
●
●●●
●
●●
●
●
●●●
●●●●●●●●●●●
●●●●
●●
●●●●●●●●●●●●●●●●●
●
●
●
●●
●
●●●●●
●●●●
●●●
●●●
●
●
●
●
●
●●●●●●●●
●●●●●●●●●●●
●
●
●●●●●●
●
●
●
●
●●
●
●●●
●●●
●●●
●
●●
●
●●
●●
●
●
●●●●●
●
●
●●
●
●
●
●
●
●
●●●●●●●●●●●
●
●
●●
●
●
●●
●
●
●●
●●●●
●●
●●
●●●
●
●●
●
●●
●
●●
●●●●●●
●●
●●●
●
●●
●
●●●●
●●●
●
●
●●●
●
●●
●
●●●●●
●
●
●
●●●●
●
●
●●●●●●●
●●
●●
●●●●●
●
●●●
●
●●●●
●●
●
●
●●●
●
●
●
●●●
●●
●
●
●
●
●●●●
●
●●●●●●●●●●●●●●
●
●
●
●●
●●●●●●●●
●
●●●●●
●
●
●
●●●●●●
●●●●●●●●
●
●
●
●●●
●
●●●●●●●
●
●●●●
●●●●
●
●●
●
●
●●●
●
●
●
●●
●●●●●●●
●●
●
●
●●
●
●●●●
●●
●●●●●
●
●●●●●●●
●
●●●
●
●
●●●
●●●
●●
●●●●●
●
●
●
●
●
●●●●●●●
●●●●●
●●
●
●●●
●
●●
●●
●
●
●●
●
●
●●●●
●
●●
●
●
●●
●
●●●
●●
●
●
●●●
●
●
●
●●
●●●●●●
●●
●
●●●●●
●
●
●
●
●
●
●
●●
●●
●●●●●
●
●
●●●
●●●●
●●
●
●
●●●●
●●●●●●●●●
●●
●
●
●
●
●
●
●
●
●
●
●●●●●●
●
●●●
●
●
●
●●●
●
●
●●●
●●
●
●
●
●
●●
●
●
●●
●
●●
●
●●
●
●
●
●
●
●
●●●
●
●
●
●●●●
●
●●●
●●
●●
●
●●
●●
●●●●●●●
●●
●●
●●
●
●●
●●●
●
●
●
●●
●
●
●
●●
●●●●
●●●
●
●
●
●
●
●●●
●●●●●●●●●●●●●●●●●●●●●●●●
●
●●●●●
●●●●●
●
●
●●
●
●
●
●●
●
●●●●●
●
●
●
●●
●
●
●
●●
●●
●●
●●
●
●●●●
●●●●●●●
●
●●
●●
●
●
●
●
●
●
●●●●●
●
●
●●
●●●●●●●●●
●
●
●
●
●
●
●
●●
●
●
●
●
●
●
●
●
●●
●●●
●
●●●●●●●●●●
●
●●●●●
●
●●●●
●
●
●●●●●●
●
●●
●
●●●●●●●●
●
●
●
●●●●
●
●●
●
●
●
●●
●
●●
●
●●
●●
●●●
●
●
●
●●●●●●●
●●●●
●
●
●●
●
●
●●
●●●
●
●
●
●
●
●●●
●●
●
●●●●
●
●●●
●●●
●
●●●
●●●●●●
●
●
●●
●
●●
●
●
●
●
●
●●
●
●
●
●●
●●
●
●
●
●
●
●●●
●
●●●●
●
●●●
●
●●
●
●●●●●●●●
●●●
●●
●●
●
●
●●●
●
●●●●●
●
●●●
●
●
●●●●●
●●
●●
●●●
●
●
●●●
●
●
●●
●
●●●
●
●●
●
●●●●
●
●●
●
●●
●●
●●●●●●●●
●
●●●●●
●
●
●
●●
●●
●●●●●
●
●
●
●●●●●●●●●
●
●
●●●●●●●●
●
●●
●
●
●
●
●
●●
●●
●
●
●●●
●
●●●●●
●
●
●
●●●●●●
●
●
●●
●●●
●●
●
●
●●
●
●●●
●
●
●
●
●
●
●
●●
●
●●
●
●
●●
●
●
●
●
●
●
●
●
●●
●
●●
●●
●
●●●●●●●
●
●●●
●
●
●●●
●
●●
●●
●●●
●
●●
●●●
●●●
●
●
●●●●●●●●●●
●
●●●
●●
●
●
●
●
●
●●
●
●
●●●●
●
●●●
●
●●
●
●
●●
●
●
●●
●●
●
●
●●●
●●
●
●
●
●
●
●●●●
●
●
●●●
●●
●●
●●
●
●
●●
●
●
●●
●
●●●
●
●
●
●
●●●●●●●●●
●
●
●●
●
●●●●●●
●
●
●
●
●
●●●●
●●
●●
●
●
●
●
●●●●
●●
●
●
●
●
●●●
●
●
●
●●
●●
●●●●●
●●
●
●
●●
●●
●
●●
●
●
●●
●
●
●●●
●
●
●●●●●
●
●●●
●
●
●●●●
●
●
●●●●
●●
●●
●●●
●●
●
●
●
●
●●
●
●●
●●●
●●●●
●●●
●●●
●
●●
●
●
●
●
●●
●●●
●●
●●
●
●
●
●
●●
●
●●
●
●
●
●
●
●●●●●
●
●
●●
●●●●
●
●●●●
●●
●●
●
●
●
●●
●●●●●●●●●●●●
●
●●
●
●
●●
●
●
●
●●
●
●●●●●
●
●●●●●
●●●●●●●●
●
●●●●●●●
●
●●●
●
●●●●
●
●●
●
●
●
●●
●●
●
●
●
●
●●
●
●●●
●
●●●●●●
●
●
●●●
●
●●●
●
●
●●
●
●
●●●
●
●
●●●●
●
●●●●
●●
●
●●●●
●●●●
●
●
●●●●●●
●●●●●●●●
●
●●●●●
●●
●●●●●●
●
●●
●●●
●●●●
●●
●
●
●●
●
●●●●
●●
●●●●●●
●
●●●
●●●●●●●●
●
●
●
●●●
●
●
●●●
●●●
●●●
●●●●
●
●
●
●
●●●
●
●●●
●
●
●●●●●
●
●
●
●
●
●
●●●
●
●●●●●●
●
●●
●
●
●
●●●
●
●
●
●●
●●●
●
●●●●●●●●●●●
●
●
●
●
●●●
●
●●●●●●
●●
●
●
●●●
●●
●
●
●
●
●●●●
●
●●●
●
●●
●●
●●
●
●●
●
●●●●●●
●●●
●●●
●●●
●
●
●●●
●
●
●●●●
●
●●
●
●
●
●●●●●●●●
●●
●
●●
●●●●●
●●●●
●
●
●●
●
●
●●●
●●●
●
●
●
●●
●
●
●●
●
●
●●
●
●●●
●
●●
●
●
●●●
●
●●●●
●●
●
●●●●
●●
●●●
●
●
●
●
●
●
●
●
●
●●●
●●
●
●
●
●
●●●
●
●●●●
●
●●
●
●
●
●
●●●●
●
●●
●
●●
●
●
●●
●
●
●
●●
●●
●
●
●
●
●
●●
●●●
●●●●●●●●●●●
●●●●
●●●●●●
●
●●
●
●
●●
●
●
●●●●
●●
●
●●
●
●●
●●
●●●●
●●
●
●●
●●●
●●
●
●
●●
●
●●●
●
●
●
●
●
●
●●
●
●
●
●
●●
●
●
●
●
●●●
●
●
●●
●●
●●●●
●●●●●●
●●
●
●
●●●●
●
●●●●●
●
●●●
●
●
●
●
●●●●●
●
●●
●●
●●●
●●●
●●●●
●
●
●
●●●
●
●
●●
●
●
●●●●●●
●●
●
●
●
●
●●
●●
●
●●
●
●●
●●●●●
●
●
●
●●●
●
●●●●●●●●●
●●●●●
●
●●●
●●
●
●
●●●●●
●●●●●●●
●
●●●●
●●●●
●
●●●
●●●●
●●
●●
●●●
●
●●●
●
●
●●●
●
●●
●
●
●
●
●●●
●
●●●●●
●
●
●
●●●●●
●
●
●
●
●●●
●
●●
●●●
●
●
●
●
●●●●●●
●●
●
●●
●●
●
●
●
●
●
●
●●●●
●
●●
●
●
●●●
●
●●●●●
●
●
●
●●●
●●●●●
●●
●
●
●
●
●
●
●
●●
●●
●
●
●●●
●
●
●
●
●●
●●●●
●
●
●
●●
●
●●
●●●
●
●
●
●
●●●
●
●●
●●
●
●●
●
●
●
●●
●●●●
●
●
●
●●●
●●
●●
●
●
●
●●
●
●●●●
●
●●●●
●
●●●
●●●
●
●
●
●
●●
●
●●
●
●
●
●
●
●●
●●●●●
●●
●●●●
●●●●●●
●●
●
●●
●●●
●
●●
●●
●
●
●●●
●●
●
●●
●●●
●
●
●
●
●
●
●●
●●●●●●
●●
●●●
●●
●●
●●
●●●
●●
●●
●●
●●●
●●●●●
●
●
●
●●
●●
●●●●●●
●
●
●
●
●
●●●●●●●●●●●
●●
●●
●
●
●●●●●●
●
●
●
●
●●●
●
●●
●
●
●
●
●
●●●
●●
●●
●
●●●●●
●
●
●
●●●
●
●
●●●
●●
●
●●●●●●●●
●●
●●●●
●
●
●
●●
●
●●●●●
●
●●
●
●
●●
●
●
●
●
●●●
●
●
●●●●●●
●
●●●
●●
●●●
●
●
●
●●
●●
●
●●
●●●●●●●●
●
●
●●
●
●●
●●
●
●●
●
●
●●
●●●
●●●
●
●●●●
●
●●●●
●
●●●●
●
●
●
●
●●
●●●●●
●
●●●●●
●●
●●●●●●
●●
●●●●●
●
●
●
●●●●
●
●●●●●●
●
●
●●
●
●●●
●
●●●●●●
●●
●●●●
●
●●
●●●●
●●●●
●●
●●●●
●●●
●●●●
●●●●●●●●●●●●●●●●
●●
●
●
●
●●●●●
●
●●
●
●
●●●
●●
●
●
●●●
●●
●
●●
●
●
●
●
●
●●●●●●●
●
●●
●
●●●
●●●
●●●
●●●
●
●
●
●
●●
●
●
●●●●●
●●●
●
●●●
●●●●●●●
●●●●●●
●
●●
●
●
●
●
●
●●●
●●●
●●
●●●
●
●●
●●●●●●●●●●●●●●●●●●●●●●●●
●
●●
●
●●●●●
●
●
●
●
●●
●●●
●●
●
●●
●●●●●
●
●●●●●●
●
●●●●
●
●●
●
●
●
●
●
●●
●
●●●●●●●
●●●
●
●●●●●●
●
●●●
●
●●
●
●●
●●●●
●●
●●●●
●
●
●
●●●●
●●
●●●●●
●●
●●●
●
●●●●
●●●●●
●●●●
●
●
●
●●●
●
●
●
●●●
●●●●●●
●●
●●●
●
●●●●●●
●
●●
●●●●●●
●
●
●●
●●
●
●●●
●
●●●
●●
●●●
●
●●●●●●●●●●
●●
●
●●●
●
●
●
●
●
●
●●
●●●
●
●●
●●
●
●
●
●●●●
●●
●
●
●●
●●
●●
●
●●●
●
●
●●
●●●●
●
●
●
●●●●●
●
●●●●
●
●
●
●
●
●
●
●●●
●
●●●
●
●●●●●
●
●
●
●●
●
●●●●
●
●
●●
●●
●
●
●
●●
●
●●●●
●
●
●
●●
●
●●●
●●
●●●●●●
●
●●●●●●●●●●
●
●●●●●●●●●
●
●
●●●●●●
●●●●●
●●●
●
●●●●●●
●
●●
●
●●●
●
●●●●●●●
●
●
●●●
●
●●●
●
●
●●
●●●
●●●
●●●●●●●
●
●
●
●●●●●
●
●●●●●●●●●●●●
●
●●●●●●
●
●
●●●●
●
●●●●●●●
●
●
●●
●
●
●
●●
●●
●●●●●
●
●●●●●●●●
●
●●●●●●●●
●
●
●
●●●●
●
●●●●●●●
●●
●●●
●
●●●●●●
●
●●●
●
●●
●
●●●●●●●
●●
●
●
●●
●
●
●●●●●●●●●
●
●
●
●
●
●●●●●●●●●●●●●
●●
●
●
●
●●
●●●●●●●●
●
●
●
●
●
●●
●●●●
●●●
●
●
●
●
●●●●●●
●
●●●
●
●●●
●
●
●
●●●●●●●●●
●●
●
●
●
●
●
●●●
●●
●●●●●●●●●●
●
●●●●
●
●●●●●
●
●●
●
●●●●
●
●
●●●●●
●●
●
●
●●●●●●●
●
●
●
●●
●●
●
●
●
●
●
●●
●●
●
●
●
●●●●
●
●
●
●●●
●●●●●●
●●●
●
●●
●●
●
●●●●
●●
●●●●●●
●
●●
●
●●●●
●●●●
●●
●●●●
●●●●●
●●
●
●●●
●
●
●
●
●
●
●
●●●●●●
●
●●●●
●
●●●
●
●
●●●
●
●
●
●
●
●●●●●
●
●●●
●
●●
●
●
●●
●
●●
●
●●●●●●
●
●●●
●
●
●●
●●
●
●
●
●●●●
●
●●
●●
●●●
●
●●
●
●
●
●
●
●●●
●
●●●●
●
●
●●
●
●
●
●
●●
●
●●
●
●
●●
●●●
●
●●●
●●●●●●
●
●
●●
●
●
●
●●●
●●
●●●●●●●
●
●
●●
●●
●●
●●●
●
●
●●●
●
●●●●●
●●
●●●●
●
●●
●
●
●
●
●
●●
●●
●
●●
●
●●●
●
●●
●
●
●
●●
●●●
●
●
●●●
●●
●
●
●
●●●●●●
●
●●●
●
●●
●
●
●●
●●
●
●●
●
●
●●●●●●●●
●●
●●
●●●
●●
●
●●
●
●●●●●
●
●
●●●
●●
●
●
●
●
●
●●
●
●
●
●●●●●●●
●
●
●●
●
●
●
●●●
●
●●
●
●
●
●●●
●
●
●
●
●
●
●
●
●●●
●
●●●●●●●●
●
●●
●
●
●●
●●●●
●
●●
●●●●
●
●
●●●●
●
●
●
●●●●●
●
●●●
●●
●
●
●
●
●
●
●●
●
●
●
●
●
●
●
●
●
●●
●
●●
●●●●●
●
●●
●●
●
●●●●
●
●●
●
●●●●
●●
●●
●
●
●
●
●●
●
●●●●
●
●●●●●
●●●●
●
●
●
●
●
●
●●
●●
●●●●●●●
●
●
●●●●
●
●
●●●●●
●●●
●●
●●●●
●●●●●
●●
●
●
●●
●●
●
●●●●●
●
●●
●●●●
●●●
●●●●●●●●●●●●●
●
●
●●
●●●●
●●●
●●●
●
●●●●●●
●●
●●●●●
●
●
●
●
●
●●●●●●●●
●
●
●
●
●
●●
●
●
●
●●●
●
●
●
●●
●
●●●
●
●●●●●
●
●●●
●
●●
●
●●
●
●●●●●●●●
●●●●●●●
●
●●●
●
●●
●
●
●●
NQ WQ
02
46
8
# D
evel
oper
s lo
g(co
unts
+1)
●●
●
●●●
●
●
●
●●●
●
●
●
●●●
●●
●
●
●●
●
●●●●
●
●●●●●
●
●●
●●
●●
●
●●●●●●●●
●
●●●●●●
●●
●
●●●●●●●●●●●●●●●
●
●
●
●●●●●●●●●●●●●●●●●●●
●
●●●●●●●
●
●●
●●
●●●
●
●●●●●●●●●●●●
●
●
●
●
●
●●●●●●●●●●●●●
●
●●●●●●●●●●
●
●●●
●
●●
●
●●●
●
●●●●●●●●
●●
●●●●●
●
●●●●●●●●●
●
●●
●
●●●●●●
●
●
●
●●●
●●
●●●
●
●●●●●●
●
●●●●●
●
●●●●●●●●●
●●
●
●
●●●●●●●●●●●●●●●●●●●●●●
●
●●●●
●
●●●●●●●●●●●●●●●●●●●●●●●●●●●●●●●●●●●●●
●
●●●●●●●
●
●
●
●●●●●●●●●●●●
●
●●
●
●●●●
●●
●
●
●
●
●●●●●●●●●●●●
●
●●●
●
●●
●
●●●●●●●
●
●●
●
●●●●●●●●●●●●●●●●●
●
●●●●
●
●●●●●●●●●●●●●●●
●
●●●●●●●●●●●●●●●●●●●●●●●
●
●●●●●
●
●●●●●●
●
●
●
●●●●●●●●●●●●●●●●●
●
●●●●●●●●
●
●●●●●●●●●
●
●●●●
●
●●●●●●●●●●●
●●
●●●●●●●●●●●
●
●●●●●●●●●●●●●●●●●●●
●
●
●
●
●
●●●●●●●●●●●●●●●●●●●●
●
●●●●●●●
●●
●●●
●
●
●●●●●●●●●
●
●●●●●●●●●●●●
●
●●●●●
●
●●●●●●●●●●●●
●
●●●
●
●●
●
●●●●●●●●●●●
●
●●
●●
●●●●●●●●
●
●●●●
●
●●●●●●●●
●
●●●●●●●●●●
●
●●●●●●●●
●
●
●
●●●●●●●●
●
●●●●●●●●●
●
●●
●
●
●
●●
●
●
●
●●●●●●●●●●
●
●●
●●
●●●●●
●
●●●●●●●●●●●●●●●●●●●●●●●●
●
●●●●●●●●●●
●
●
●
●●●●●●●
●●
●●●●●
●
●●
●●
●●●●●●●●●
●
●●●●
●
●●●●●●
●
●●●●●●●●●●●●●●●●●
●
●●●●
●
●●●●●●●●●●●●●●●●●●●●●●
●●
●●●●●
●
●●
●
●●
●●●
●●●●
●
●●●
●●
●●●●●
●
●●
●
●●●●●●
●
●●●●
●
●●●●●●
●
●●
●
●●
●
●●
●
●
●
●●●●●
●
●●●●●●
●
●●●●
●
●
●
●
●
●●●●●
●
●
●
●●●●●●●●●●●●
●
●
●
●●●●●
●
●●
●
●●
●
●●●●
●
●●●●●
●
●●●●●●●●●●●
●
●●●●
●
●●●●
●●●
●●●●●●●●●●●●●●●●●●●●●●●●●
●●
●●●●
●●
●
●
●●●●●●●●●●
●
●●●●
●
●●●●●●
●
●●
●
●●●
●
●●●●●
●
●●●●●●●●●●●
●●
●●●●●●●●●●●●●●
●
●●●●
●
●●●●●●●●●
●
●●●●
●
●●●●●●
●
●●●
●
●●●●●●
●
●●●●●●●●●●●●●●●●●●
●
●●●●
●
●●●●
●
●●●●●
●
●
●
●
●
●●
●●
●
●
●
●
●●●●
●
●●●●
●
●
●
●●●●●●●●
●
●●●●●
●
●●●●●
●
●●●●●●●
●
●●●●●●
●
●●●
●
●●●●●●●●●●●●
●
●●
●
●●
●
●●●●●●●●●●
●●
●●●●●●●●●●●●●
●
●
●●●
●●
●●
●
●
●●●●●●●●
●●
●●●●●●●●●●
●
●●●●●●
●
●●
●
●●
●
●●
●
●●●●●●●●●●●●●●●●●●●●●●●●●
●
●●●●●●●●●●●●●●●●●●●●●●●●●●●●●●●●●●●●●●●●●●●●●●●●●●●●●●●●●●●●●●●●●●●●●●●●●●●●●●
●
●●●●●●●●●●●●●●●●●●●●●●●●●●●●●●●●●●●●●●●●●●●●
●
●●●●●●●●●●●●●
●
●●●●●●●●●●●●●●●●●●●●●●●●●●●●●●●●●●●●●●●●●●●●●●●●●●●●●●●●●●●●●●●●●●
●
●●●
●
●●●●●●●●●●●●●●●●●●●●●
●
●●●●●●●●●●●●●●●●●●●●●●
●
●
●●●●●●●
●
●●●●●●●●●●●●●●●●●●●●●●●●
●
●
●
●
●
●●●
●
●●●●●
●
●●●●●●●●●●●●●●●●●●●
●
●
●
●●●●●●●●●●●●●●●
●
●●●●●●●●●●●●●●●●●●●●●●●●●●●●●●●●●●●●●●●●●●●
●
●●●●●●●
●●
●●●●●●
●
●●●
●
●●●●●●●●●●
●
●●●●
●
●●●●●●
●
●●●●●●●●●●●●●●
●
●●●●●●●●●●●●●●●●●●●●●●●
●
●●
●
●●●●●●●●●●●●●●●●
●
●●●●●●●●●●●
●
●●●●
●
●●●●●●●●●●●●●●
●
●
●
●●●●●●●●●●●●●●●●●●●●●●●●●●●●●●●●●●●●
●●
●●●
●
●●
●
●●
●
●●●●
●
●●●●●●●
●
●●
●
●●●●●●●●●●●
●
●●●●●●●
●
●●●●●●●●●●
●
●●●●●●●●●●●●●●●●●●●
●●
●●●●●●●●●●●
●
●●●●●●●●
●
●●●●●
●
●●●●●●●●●●●●●●●●●●●●●●●●●●●●●●●●●●
●●
●●
●
●●●
●
●
●
●●●
●
●●●
●●
●
●
●●●●●●●●●●
●
●
●●●
●
●●●●●●●●
●
●●●
●
●●
●
●●●
●
●●
●
●●●●●●●●●●●●●
●●
●●●●●●●●●●●
●
●●●●
●
●
●●●●●●
●
●●●
●
●●●●●●
●
●●●●●●●●●●
●
●●●●●●
●
●●●●●●●●●●●●
●
●●●●●●●●●●●●●●●
●
●●●
●
●●●●●●
●
●●●●●●
●
●
●●
●●●●●●●●●
●
●
●●●
●●●●●●
●
●●●●●●●●●
●
●●●●●●
●●●
●●
●
●●●●●●●●●●●●
●
●
●●
●●
●
●
●●●●●●
●
●●
●
●●
●
●
●
●●
●
●
●●●●●
●●
●●●
●
●
●
●●●●●●●
●●
●
●●●
●●●
●
●
●●●●
●
●●●
●
●●●●●●
●
●
●
●●
●
●●
●
●●●●●●●●●●●●●●
●
●●
●
●●●
●
●●
●●
●
●
●●●●●●●●●●
●
●●
●
●●●●●●●●●●●●●
●
●●●●●●●●●●●
●
●●●●●●●●●●●●●●●●●●●●●●●●●●●●
●
●●●●
●
●
●
●●●
●
●●●●●●●●●●●●●●●●●●●●●●●●●
●●
●
●
●●●●●●●●●●●●●●●●
●
●
●
●●
●
●●●●●●●●●●●●●●●●●
●
●
●●●●●●●●
●
●●●●●●●●●●●●●
●●
●●●●
●
●●●●●●
●
●●●●●●●●●●●●●●●●●●●●●●
●
●●●●●
●
●●●●
●
●
●
●
●
●●●●●●
●
●●●●●●●●
●●
●●●
●
●●●●●●●●●●●●●●●
●
●●●●
●
●●●
●
●●●●●●●●●●●●●●●
●
●
●
●●●●●
●
●●●
●
●●●●●●●●●●●●●●●●●
●
●●●●●●●●●●●●●●●●●●●●●●●●●●
●
●●●●●●●●●●●●●●●●●●●●●●●●●●●●●●●●●●●●●●●●●●●●●●●●●●●●●●●●●●●●●
●
●●●●●
●
●●●●●●●●●●●●●
●
●●
●
●●●●●●●●●
●
●●●●●●●●●●●●●●
●
●
●
●●●●●●●●●●●●●●●●●●●●●●●●●●●●
●
●
●
●●●●
●
●●●●●●●●●●●●●●●●
●
●●●●●●●●●●
●
●●●●●●●●●●●●●
●
●●
●
●
●●●●●●●●●●
●
●●●●●●●●●●●●●●
●
●●●●●●●
●
●●●●
●●
●●
●
●●●●●●●●●●●●●●●
●
●●●●●
●
●●●
●
●●●●●●●●●●●●●●●●●●●●●●●●●●●●●
●
●●●●●●●●●●
●
●●
●
●●●●●
●
●●●●●●
●
●
●
●●●
●
●●●
●
●●●●●●●●●●●
●
●●
●
●●●
●
●●
●
●●
●
●●
●
●●●
●
●●●●●●●
●
●●●●●●●●●●●●●●●●●●●●●●●●●●●●●●●●●●●●●●●●●●
●
●●●●●●●●●●●●●●●●●●●●●●●●●
●
●●●●
●
●●●●●●●●●●●●●●●●●●●●●●●●●●●●
●
●●●●●●●●●●●●●●●●●●
●
●●●●●●●●●
●
●●●●●●●●●●●●
●
●
●
●●●●●●●●●●●●●●●●●●●●●●●●●●●●●●●●●●●●●●●●●●●●●●●●●●●●●
●
●●●●●●
●
●●●●
●
●●●●●●
●
●
●
●●●●●●
●
●●●●●●●●●●●●●●●●●●●●
●
●●●●●●●●●●●●●●●●●●●
●
●
●
●●●●●●●●●●●●●●●●●●●●●●●●●●●●●●●●●●●●
●
●●●●●●●●●●●●●●●●●●●●●●●●●●●●●●●●●●●●●●●●●●●●●●●●●●●●●●●●●●●●●●●●●●●●●●●●●●●●●●●
●
●●●●●●●●●●●●●●●●●●●●●●●●●●●●●●●●●●●●●●●
●
●●●●●
●
●●●●●●●●●●●●●●●●●●●●●●●●●●●●●
●
●●
●
●
●
●●●●
●
●●●●●●●●●●●●●●●●●●●●●●●●●
●
●●●●●
●
●●●●●●●●
●
●●●●●●●●●●●●●●●●●●●●
●
●●●
●
●
●
●●●●●●●●●●●●●●●●●●
●
●●●●●●●●●●●●
●
●●●●●●
●
●●●●●●●●●●●●●●●●●●●●●●●●●●●
●
●●●●●●●●●●●●●●●●●●●●●●●●●●●●●●●●●●
●
●●●●
●
●●●●●●●●●●●●●●●●●●●●●●●●●●●●●●●●●●●●●●●●●●●●●●●●●●●●●●●●●●●●●●●●●
●
●
●●●●●●●●●●
●
●●●●●●
●
●●●●
●
●●●●●●●●●●●●●
●
●●●●●●●●●●●●●●●●
●●●
●●●
●
●
●
●
●●●●●●●●●
●
●●●●●●●●
●
●●●
●
●●●
●●
●●●
●
●●●●●●●●●●●●●●●
●
●●●●●●●●●●●●●●●●●●●●●●●●●●●●●●
●
●●
●
●●
●
●
●
●
●
●●●●●
●
●●
●
●●●●●●●●●●
●
●
●
●●●●●●●●
●
●●●●●●●●●●●●
●
●●●●●
●
●●●●●●●●●●●●●●
●
●
●
●●●●●●●●●●●●●●●●●●●●●●●●●●●●●●●●●●●●●●●●●●●●●●●●●●●●●●●●●●●●●●●●●●●●●●●●●
●
●●●●●●●●●●●●
●
●●
●
●●●●●
●
●●●●●●●●●●●●●●●●●●●●●●●●●●●●●
●
●●●
●
●●●●●●●●●●●●●●●●
●
●
●●●●●
●
●●
●
●●●●●●●●●●●●●●
●
●●●●●●●●●●●●●●●●●●●●●●
●
●
●●●●●●●
●
●
●
●●●●●●●●●●●●●●
●
●●●●●●●●●●●●●●●●●●●●●●●●
●
●●
●
●●●●●●
●
●●●
●
●●●●●●●●
●
●
●
●●●●
●
●●●●●●●●●●●●●
●
●
●
●
●●●
●
●●●●●●●●●●
●
●●●
●
●
●
●●
●
●●●
●●●
●
●
●●●
●
●●●
●
●●●●●●
●
●
●
●●
●
●●●●●
●●
●
●
●●●●
●
●
●
●●●●●●●●●●
●
●●●●
●
●●●●●
●
●●
●
●
●
●●
●●
●●●●●●●●●●●●●
●
●●●●●
●●●
●
●
●●
●
●●●●
●●
●●●●●●●●●●●●●●●●●●●●●
●
●
●
●
●
●
●
●●
●
●●●●●●
●
●●
●
●
●●●●
●
●
●
●
●
●●●●●●●●●●●●●●
●
●
●
●
●●
●
●●
●●
●
●
●●
●
●●●●
●●●●
●
●●
●●
●
●●●●●●●●●●●●●●●●●●●●●●●●●●●●●
●
●●●●●●●●●●●●●●●●●●●●●●●●●●●
●
●●●●●●●●
●
●●●●●●●●●●●●●
●
●●●●●●●●●●●●●●●●●●●●●●●●●●●●●●●●●●●●●●●●●●●●●●●●●●●●●●●●●●●●●
●
●●●●●●●
●
●●●●
●
●●●●●
●
●●●●●●●●●●●
●
●
●
●●●●
●
●
●
●
●
●●●●●●●●●●
●
●●●●●●●●●●●●●●●●●●●●●●●●●●●●●●●●●●●●●
●
●●●●●●●●●
●●●
●●●●
●
●●●●●●●●●●●●●●●●●●●●●●●●●●●●●●●●●●●●●●●●●
●
●●●●●●●●●●●●●●●●●●●●
●
●●●
●
●●●●●●●●●●●●
●
●●●
●
●●●●●●●●●●●●●●
●●●
●●●●
●
●
●
●●
●
●●●●●●●●●
●
●●●
●
●●
●
●●●●●●●●●●
●
●●●●●●●●●●●●
●
●
●
●●●●●●●
●
●
●●●
●●●●●●●●●●●●
●
●●●●●
●
●●
●●
●●
●
●●●●●●●●●●●●●●●●
●
●●●●
●
●●●●●●●●●●●●●●●●●●●●●●
●
●●●●●●●●●
●
●
●
●
●●●●●●●●●●●●●●●●●●●●●●●●
●
●●●●●
●
●●●●●●●●●●●●●●●●●●●●●●●●●●●●
●
●●●●●●●●●●●●●●●●●●●●●●●●●●●
●
●●●●●●●●●●●●●●●●
●
●●●●●●●●●●●●●●●●●●●●●●●●●●
●
●●●●●●●●●●●●●●●●●●●●●●●●●●●●●●●●●●●●●●
●
●●
●
●●●●●●●●●●●●●●●
●
●●●●●●●●●●●
●
●
●
●●●●●●●●●●●●
●
●●●●●●●●●●●●●●●
●
●●●●●●●●●●●●●●●●●●●●●●●●●●●●●●●●●●●●●●●●●●
●
●●●●●●●●●●●●
●
●
●
●●●●●●●●●●●●●●●●●●
●
●●●●●●
●
●●●●
●
●
●
●●●●●●●●●●●●●●●●●●●
●●●
●●●●●●●●●
●
●
●
●●●●●●●●●●●●●●●●●
●
●●
●
●●●●●●●●●●●●●●●●●●●●●●
●
●
●●
●●●●●
●
●●●●●●●●●●●
●
●●●●
●
●●●●●●●●●
●
●●●
●●
●●●●●●●●●●●●
●
●●●●
●
●●●●●●●●●●●●●●●●●●●●●●●●
●
●●●●●
●
●●●●
●
●●●●●●●●●
●
●●
●
●●●●●●●●
●
●●●●●●●●●●●●●
●
●●●●●●●●●●●●●●●●●●●●
●
●●
●
●●●
●
●●●●●●●●●●●●●●●●
●
●●●●●●●●●●●●●●●●●●●●●●●●●●●●●●
●
●●●●●●●●●●
●●
●●●●●●●●●●●●●●●●●●
●
●●●●●●●●●●●●
●
●●●●
●
●●●●●●●●●●●●●
●
●●●●●●●
●
●●●
●
●●●●●●●●●●●
●
●●●●●
●
●●●●
●●
●●●●●
●
●●●●●●●●●●●●●●●●●●●●●●
●
●●●●●●●●●●●●●●●●●●●●●●●●●●●●
●
●●●●●●●●●●●●●●●●●●●●
●
●
●
●
●●
●
●●●●●●●●●●●●●●●●●●●
●
●●●●●●●●●●●●●●●●●●●●●●●
●
●●●●●●●●●●●●●●●●
●
●●●●●●●●●●●●●●●●●●●●●●●●●●●●●●●●●●●●●●●●
●
●●●●●●●●●●●●●●
●
●●●●●●●●●●●●●●●●●●●●●●●●●●●●●●●●●●●●●●●●●●
●
●●●●●●●●●●●●●●●●●●●●●●●
●
●●●●●●●●●●●●●●●●●●●●●●●●●●●●●
●
●●
●
●●
●
●●●
●
●
●●●●●
●
●●●●●●●●
●
●●●●●
●
●●●●●●●
●
●●●●●●●●
●
●
●●
●●●●●●●●●●●●●●●●●●●●●●●●●●
●
●●●●●●●●●●●●●●●●
●
●●●
●
●
●
●●●●●
●
●●●●
●●●●
●●
●
●
●
●
●●●●●●●●●●●●
●
●●●●●●●●●●●●
●
●●●●●●●●●●●●●●●●●●●●●●●●●●●●●●
●
●●●●●●●●●●●●●●●●●●●●●●●●●●●●●●●●●
●
●●●●●●●●●●●●●●
●●
●●●●●●●●●●●●●●●●●●●●●●●●●●●●●●●●●●●●●●●●●●●
●
●●●●●●●●●●●●●●●●●●●●●●●
●●
●●●●●●●●●●●●●●●●●●●●●●●●●●●●●●●●●●●●●●●●●●●
●
●●●●●●●●●●●●●●●●●●●●●●●●●●●●●●●●●●●●●●●●
●
●●●●●●●●●●●●
●
●●●●●●●●●●●●●●●●●●●●●●●●●●●
●
●●●
●
●●●●●●●●●●●●●●●
●
●●●●●●●●●●●
●
●●
●
●●●●●●●●●●●●●●●●●●●●●●
●●
●●●●●●●●●●●●●●●●
●
●●●●
●
●●●●●●●
●
●●●●●●●●●●●●●●●●●●●●●●●●
●
●●●●●
●
●●●
●
●●
●
●●●●●●●●●●●●●●●●●●●●●●●●
●
●
●●●●●●●●●●●●●●●●●●●●●●●●●●●
●
●●●●●●●●●●●●●●●●●●●●●
●
●●●●●●●●
●
●●●●●●●
●
●●●●
●
●●●●●
●
●●●●●
●
●●●●●●●●●●●●●●●●●●●●●●●●●●●●●●●●●●●
●
●●●●●●●●●●
●
●●●●●●●●●●●●
●
●●●●●●●●●●●●●●●●●●●●●●●●●●●●●●●●●●●●●●●●●●●●●●●●●●●●●●●●●●●
●
●●●●●●●●●●●
●
●
●●●●●●●●●●●●●●●●●
●
●●●●●●●●●●●●●●●●●●●●●●●●●●●●●●●●●●●●●
●
●●●●●●●●●●●●●●●●
●
●●●●
●
●●●●●●●●●●●●●●●●●
●
●●●●●●●●●●●●●●●
●
●●●●●●●●●●●●●●●●●●●●●●●●●●●●●●●●●●●●●●●●●●●●●●●●●
●
●●●●●●●●●●●●●●
●
●●●●●●●●●●●●●●●●●●●●●●●●●●●●●●●●
●
●
●
●●●●●●●●●●●●●●●●●●●●
●
●●●●●●●●●●
●●
●●●●
●
●●●
●
●●●●●●●●●●●●●●●●●●●●
●
●●●●●●●●●●●●●●●●●●●●
●
●●●●●●●●●●●●●●●
●●●
●●
●
●
●
●●●●●●●●●●●●●●●●●●●●●●●●●●●●●●●●●●●●●●●●●●●●●●●●●●●●●●●●
●
●
●
●●●●●●●●●●●●●●●●●●●●●●●●●●●●●●●●●●●●●
●
●●●●●●●●●●●●●●●●●●
●
●●●●●
●
●●●●●●●●●●●●●●●●●●●●
●
●●
●
●●●●●●
●●
●●●●●●●●●●●●●●●●●
●
●
●●●●●●
●
●●●●●●●●●●
●
●●●●●●●●●●●●●●●●●●●●
●
●
●●●●●●●●●●●●
●
●●●●●●●●●●●●●●●●●●●●●●●●●●●●●●●●●●●●●●●●●●
●
●●●●●●●●●●●●●●●●●●●●●●●●●●●●●●●●●●●●●●●●●●●●●●●
●
●
●●●●●●●●●●●●●●●●●●●●●●
●
●●●●●●●●●●●●●●
●
●●●●●●●●●●●
●
●●●●●●●●●●●●●●●●●●●●●●
●
●●●●●●●●●●●●●●●●●●●●●●●●●●●●●●●●●●●●●●●●●●●●●●●●●●●●●●●●●●●●●●
●
●●●●●
●
●●●●
●
●●●●●●●●●●●●
●
●●●●●●●●●
●
●●●●
●
●●●●●●●●●●●●●●●●●●●●●●●●●●
●
●●●●●●●●●●●●●●●●●●●●●●●●●●●●●●●●●●●●●●●●●●●●●●●●●●●●●●●●●●●●●●●●
●
●●●●●●●●●
●
●●●●●●●●●●●●●●●●●●●●●●●●●●●●●●●●●●●●●●●●●●●●●●
●
●●●●●●●●
●
●●●●●●●●
●
●●
●
●
●●●●●●●●●●●●●●●●●●●●●●●●●●●●●
●
●●●●●●●●●●●●●
●
●
●
●●●
●
●●●●●●●
●
●●●●●●●●●●●●●●●●●●●●●●●●
●
●●
●
●●●●●●●●●●●●●●●●●●●●●●●●●●●●●
●
●●●●
●
●●●●●●●●●●●●●●●●●●●●●
●
●●●●●●●●●●●●●●●●●●●●●●●●●●●●●●●●●●●●●●●●●
●
●●●●●●●●●●●●●●●●●●●●●
●
●●●●
●
●●●●●●●●●●●●●●●●●●●
●
●●●●●●●●●
●
●●●●●
●
●●●●●●●●●●●●●●●●
●
●●●●●●●●●
●
●●●●●●●●●●●●●●●●●●●●●●●●●●●●●●●●●●●●●●●●●●●●●●●●●●●●●●●
●
●●●●●●●●●●●●●●●●●●●●●●●●●●●●●●●●●●●●
●
●●●●●●●●●●●●●●●●●●●●●●●●●●●●
●
●●●●●●●●●●●●●●●●●●●●●
●
●●●●●●●●●●●●●●●●●●●●●●●●●●●●●
●
●●●●●●●●●●●●●●●●●●●●●●●●●●●●●●●
●
●●●●●●●
●
●
●
●
●●●●●●●●●●●●●●●●●●●●●●●●●●●●●
●
●●●
●
●●●●●●●●●●●●●●●●●●●●
●
●●●●●●●●●●●●●●●●●●●●●●●●●●●●●●●●
●
●●●●●●●●●●
●
●●●●●●●●●●●
●
●●●●●●●●●●●●●●●●●●●●●●●
●
●●●●●●●●●●
●
●●●●
●●●●
●●●●●●●●●●●●●●●●●●●●●●●●●●●●
●
●●●●●
●
●●●●●●●●●●●
●
●●●●●●●●●●●●●●●●
●
●
●
●●●●●●●●●●●●●
●
●●●●●●●●●
●
●
●
●●●●●●●●●
●
●●●●●●●●●●●●●●●●●●●●●●●●●●●●●●●●●●●●●●●●●●●●●●●●●●●●●●●●●●
●
●●●●●●●●●
●
●●●●●●●●●●●●●●●●●●●●
●
●●●●●●●●●●●●●●●●●●
●
●●●●●●●●●●
●
●●●●●●●●●●●●●●●●●●●●●●
●
●●●●●
●
●●●●●●●●●●●●●●
●
●●●●●●●●●●●●●●●●●●●●●●●●●●●●●●●
●
●
●
●●●●●●●●
●
●●●●●●●●●●●●●●●●●●●●●●●
●
●●●●●●●●●●●●●●●●●●●●●●●●●●●●
●
●●●●●●●●●●●●●●●●●
●
●●●●●●●●●●●●●●●●●●●●●●●●●●
●
●●●●●●●●●●●
●
●●●●●●●●●●●●●●●●●●●●●●●●●●●●●●●●
●
●●●●
●
●●●●●●●●●●●●●●●●
●
●●●●●●●●●●●●●●●●●●●●●●●●●●●●●●●●●●●●●●●●●●●●●●●●●●●●●●●●●●●●●●●●●●●●●●●●●●●●●●●●●●●●●●●●●●●●●●●●●
●
●●●●●●●●●●●●●●●●●●
●
●●●●●●●●●●●●●●●●●●●●●●●●●●●●●●●●●●●●●●●●
●
●●●●●●●●●●●●●●●●●●●
●
●●●●●●●●●●●●●●●●●●●●●●●●●●●●●
●
●●●●●●●●●●●●●●●●●
●
●●●●●●●●●●●●●●●●●●●●●
●
●
●●●●●●●●●●●
●
●●●●●●●●●●●●●●●●●●●●●●●●●●●●●
●
●●●●●●●●●●●●●●●●●●●●●●●●●●●●●●●●●●●●●●●●●●●●●●●●●●●●●●●●●●●●●●●●●●●●●●●●●●●●●●●●●●●●●●●●●●●●●●●●●●●●●●
●
●●●●●●●
●
●●●●●●●
●
●●●●●●●●●●●●●●
●
●●●●●●●●●●●●●●●●●●●●●●●●●●●●●●●●●●●●●●●●●●●●●●●●●●●●●●●●●●●●●●●●●●●●●●●●●●●●●
●
●●●●●●●●●●●●●●●●●●
●
●●●●●●●●●●●●●●●●●●●●●●●●●●●●●●●●●●●●●●●●●●●●●●●●●●●●●●●●●●●●●●●●●●●●●●●●●●●●●●●●●●●●●●●●●●●●●●●●●●●●●●●●●●●●●●●●●●●●●●●●●
●
●●●●●●●
●
●●●●●●●●●●●●●●●●●●●●●●●●●●●●●●●●●●●●●●●●●●
●
●●●●●●●●●
●
●●●●●●●●●●●●●●●●●●●●●●●●●●●●●●●●●●●●●●●●●●●●●●●●●
●
●
●●●●●●●●●●●●
●
●●●●●●●●●●●●●●●●●●●●●●●
●
●●●●●●●●●●●●
●
●●●●●●●●●●●●●●●●●●
●
●
●●●●●●●●●●●●●
●
●●●●●●●●●●●●●●●●●●●●●●●●●●●●●●●●●●●●●●
●
●●●●●●●●●●●●●●●●●●●●●
●
●●●●●●●●●●●●●●●●●●●●●●●●●●●●●●●●●●●●●●●
●
●●●●●●●
●
●●●●●●●●●●●●●●●●●●●●●●●●●●●●●●●●●●●●●●
●
●●●●●●●●●●●●●●●●●●●●●●●●●●●●●●●●●●●●●●●●●●●
●
●●●●●●●●●●●●●●●●●●
●
●●●●●●●●●●●●●●●●●●●●●●●●●●
●
●●●●●●●●●●●●●●●●●●●●●●●●●●●●●●●●●●●●●●●●●●●●●●●●●●●●●●●●●●●●●●●●●●●●●●●●●●●
●
●●●●
●
●●●●●●●●●●●●●●●●●●●●●●●●●●●●●●●●●●●●●●●●●●●●●●●●●●●●●●●●●●●●●●●●●●●●●
●
●●●●
●
●●●●
●
●●●●●●●●●●●
●
●●●●●●●●●
●
●●
●
●●●●●●●●●●●●●●●●●●●●●●●●●●●●●●●●●●●●●●●●●●●●●●●●●●●●●●●●●●●●●●●●●●●●●●●●●●●●●●●●●●●●●●●●●●●●●●●●●●●●●●●●●●●●●●●●●●●
●
●
●●
●
●
●
●●
●●
●●
●●●
●
●●●
●
●●
●
●
●
●
●●●●●
●●●●
●●
●●
●
●
●
●●
●●●●●●
●
●●
●●
●
●
●
●●●●
●
●
●
●
●●●
●●●●
●
●
●
●
●
●
●●
●
●
●
●●
●
●
●●●
●●
●●
●●
●
●●●●
●
●●●●●●●●
●
●
●
●
●●●●●●
●
●●●
●●
●
●
●
●●●
●
●●●
●
●
●
●
NQ WQ
0.0
1.0
2.0
3.0
# As
sign
men
t log
(cou
nts+
1)(b) Firefox
NQ WQ
02
46
810
12
Elpa
sed
Tim
e lo
g(da
ys+1
)
●●●●●
●●●●●●●●●●●●
●
●
●
●●
●
●●●●●●●●
●●●●●●●●●●●●●●●●●●●●
●●
●●●●●●●●
●●
●●●
●
●●
●
●
●
●
●●●●●●●
●
●●●
●
●●●●●●●●●●●●●●●●●
●●
●
●
●●●●●●●●●●●
●●●
●●
●●
●●●●●●●●●●●●●●●●●●
●●●●●
●●●●●●●●●●●●●●●●●●●●●●
●●●●●●●●●●●●●●
●●●
●●●●●
●●●●●●●●●●●●
●
●●
●
●●●
●
●●●●●●●●●●●●
●●●●●●●●●●●
●
●
●●●
●●●●●●
●
●●●●
●
●
●
●
●
●●●●
●
●●●●●●●
●●●●●●●●●●●●●●●●●●●
●
●●●●●●●●
●●
●●●●
●●●●●●●
●
●●●●●●●●●●●●
●
●●●
●●●
●●●
●●
●
●●
●
●
●●●
●●●●●●●●●●●
●
●●●●●●●
●
●●
●●●●●●●●●●●●
●●●●●●●
●●●●●
●
●●
●●
●
●
●●●●
●●●●
●●●●●●●●●●
●
●
●
●●●●
●
●●
●
●●●●●
●
●●●●●●●●●●
●
●
●●●●●●●
●●●
●●
●●
●●●
●
●●
●
●●
●●●●●
●●●●
●●●●●●●●
●●●●●●●●●●●●●●●●
●●●●●●
●●●●●●●●
●●●
●
●●●●
●
●●
●
●
●
●
●●
●
●●●●●●●●●●●●●
●
●●●●●●●●●●
●
●●●
●
●
●
●●●●●●●●●●
●
●●●●●●●●
●●●●●●●●
●
●
●
●●●
●●●●●●●
●●●●
●●●●
●●●●●
●
●
●
●●●●●●●●●
●
●●●●●●●●
●
●●●●●●●●
●
●●●●●
●●●●●●●
●●●
●
●●●●●●●
●●
●●
●
●●
●
●
●●●●
●
●●●●●
●●●●●●●
●
●
●●●●
●●●●●
●
●●●
●
●
●●●●●●
●
●
●●
●●●●●
●●
●●●●●●●●●
●
●●●●●●
●●
●●
●
●
●
●
●
●
●●●
●
●●
●
●●●●●●●●●●●●●●●●
●●●
●
●
●●●
●
●●●●●●●●
●
●
●●
●●●●●●
●
●●●●●●●●●●
●
●
●
●●
●●●●●●●●
●
●●●●
●●●●●●●●●●
●●●●●●●●●●●●●●
●●●●
●
●●●●
●●●●
●
●
●
●●
●
●●●●●●●
●
●●●●●●●●●●●
●
●●●●●●●●●●●
●
●
●●●●●●●●●●●●
●●●
●
●●
●
●
●●●●●●●●●●●●
●
●
●●
●
●●●
●●●
●
●●●●
●
●●
●●
●●
●
●●●●●●●●●●●●●●●●●●●●
●●●●●●●●
●●
●●●
●●●
●●●●●●
●
●●●
●
●●●●●●●●●●●●●●●●●●●●●●●●●●●
●
●●
●
●
●
●●●●●
●●●●●●●●●●●●●
●
●●●●●●●
●●●●●●●
●
●●
●●●●
●●●●
●●●●●●●●●
●
●●
●●●●●●●●●●●
●
●●
●●●●
●
●
●
●
●●●●
●●
●
●
●
●●●●●●●●●●●●●●
●
●
●●●●●●●●●
●●●
●
●●
●●
●●●
●●
●
●
●
●●
●●●
●
●●
●●●●●
●
●●●
●
●●
●●●
●
●●
●
●●●
●●
●
●●●●●
●●●●
●●●
●
●
●
●●●●
●
●●●
●●●●●●
●
●●
●●
●●●●●
●●
●●●●
●●●●
●●●●●●●●●●●
●
●●●●●●
●
●
●
●●●●●●●●●●●●●●●●●
●
●●
●
●●●
●
●
●●●●●
●●●●
●●●
●
●
●
●
●●
●●●
●
●
●
●●●●●●●●●
●
●
●●
●
●●
●
●●●●●●●
●
●●●●●●●●●●●
●
●●●●
●●
●
●
●●
●●●
●●●●●●
●
●●●●●●
●●●●●●●●
●
●●●●●●●●●
●●●●
●●●
●
●●●
●
●●●●●●●
●
●●●●●●●●
●
●●●
●
●
●
●●●●●●
●●●
●●●●●●●
●●
●●●●●●●
●●●●●●●●●●
●●●
●
●
●
●
●
●
●●●
●●
●
●●●
●●●●●●●●
●
●●
●
●●●
●
●●●
●●
●●●●
●
●●●
●●
●
●
●
●
●●●
●●
●
●
●
●
●●●
●
●●●●
●
●●
●
●●
●
●●●●●●●●
●
●●●
●●●●●●●●
●
●●●
●
●●
●●●●●●●●●●
●
●●●●
●
●
●
●
●
●
●●
●●●●●●
●
●●●●●●●
●●
●●●
●
●●●●●
●
●●●
●
●●●●●●●●●●●●●
●
●●●
●
●●●●●●●●●●
●
●
●
●●●●
●
●●
●
●●●●●●●
●
●●●●●●●●
●
●●●
●●●●●●
●●●●●●●●●●●●●●●●●●●●●●●●●●●●●●●●●●●●
●
●
●●●
●●
●
●●●●●●●●●
●
●●●●●●
●●●●●●●●●●●●●
●
●
●●●●
●●●●●●
●●●
●●●●
●●●●●
●●●●●●●●●●●
●
●●●●●●
●●●●●
●●●
●
●●●
●
●●
●
●
●●●●●●
●
●
●●●●
●
●●●
●●●●●●●●●●●●
●
●●●●●●●●●
●
●●
●●
●
●●
●●●●●●●●●●●●
●
●●●●●
●
●
●
●●
●●
●
●●●●●●
●●
●●●●●●●
●●●●●
●●
●●●●●●●●●●●●●●
●
●●●●●
●
●
●●
●●
●●●●●●●●●●
●
●
●●●●●●●●●●●●●●●●
●
●●●●●●●●
●●
●●●
●●●
●
●●
●
●
●●●●
●
●
●
●●●
●●
●
●●●●●●●●
●●●●●
●
●●
●
●●●●●●
●●●●
●
●●
●
●
●
●●●●●●●
●
●●
●●
●
●●●●
●
●●
●
●
●●
●
●
●
●●
●
●●
●
●●●●
●
●
●●●●●●
●●●●●
●
●
●
●
●●
●
●●
●●
●●●●
●●●●●
●
●●●●
●
●
●
●●
●●●●●●●●●●●●
●●●●●●
●●●●
●
●●
●
●●●●
●●●●●●●●●●●●
●●
●●●●●●●●●●●●●●●●●
●
●
●●●●●
●
●●●●●●●●●
●●●●
●●
●●●●●
●
●●●●●●●
●
●
●
●
●
●●●●●●●
●
●
●●●●●●●●●●●●●●
●●●
●●
●●
●●●●●●●●●●
●
●●●●
●●
●
●●●
●
●●●
●●
●
●
●●●
●
●●●●●●●●●●●●●
●●●●●●●●●●
●●●●●●
●
●●●●●●
●●●●●●
●●●
●
●●
●
●●
●
●
●
●
●●●●●●●●●●
●●●●●●
●
●●
●
●
●●
●●●●●●●●●●●●●
●●●●●●
●●●
●●●●●●●●
●
●
●●
●
●●
●●
●●●
●
●
●●
●●●
●●●●●●●●
●
●●●●●
●●
●●●●●●●
●●●●●●●
●●●●●●●●
●
●●●
●
●●
●
●●●●
●●●●●●●●●●
●
●●●●
●●
●
●
●
●●●
●
●●●
●
●●●●●●●●
●
●●●●●●●
●
●●●
●●●●●●
●●●●●●●
●
●●●●●●●●
●
●●●●●●●
●●
●●●
●
●●●●●●●
●
●●
●
●●●
●
●●●●●●●●●●●●●●
●●
●
●
●●
●●
●
●
●●●●●●●●●●●
●
●●
●
●
●●
●●
●
●
●●●●●●●●
●
●●
●●●
●
●
●
●●
●
●
●
●●●●●●●●●●●●●●●●●
●
●●
●
●●
●
●●
●●●●●●●●●●●
●
●●●●●●
●
●●●●
●●●●●●
●
●
●●●●
●●●●
●
●●●●●
●●●●●
●
●●●●
●
●●●●●
●
●●●●●●●●●●●●●●●●
●●●●●●●●●●●●●●
●
●●●●●●●●
●●
●
●●
●●
●
●●●●
●
●
●●●●●●●●
●
●●
●●●
●●●●
●●●●●●●●●●●●●●●●●●●●●●
●
●●
●●
●●●
●
●
●●●●●●
●●
●
●
●●●●●●●●●●●
●●●
●●●●●●
●●●
●●●●●●●●●●●●●●●●
●
●●
●●
●
●●●●
●
●●●●●●
●●●●●●●●
●
●●
●●●●●●
●●●●●●●●
●●●
●●●●●●●●●●●●●●
●
●●
●
●
●●
●●●●
●
●
●
●●●●●●●●●
●
●●●●●●●●●●●●●●
●●●●
●
●●●●●●●●
●
●
●
●
●●●
●●●
●●●●●●
●
●
●
●●●●●●●●●●●●●●●●●●●●●●●●●●●
●
●●●
●●●●
●●
●●●●
●●●
●●●●●●●●●●●●
●●●
●
●●●
●●●●
●●●
●
●●
●
●
●
●
●
●●
●●●●●●●●●
●
●●●●●
●
●
●
●●
●●●●●●
●●●●
●●●
●●
●
●●
●
●
●●●
●●●●
●●
●
●●●●●●●●●●●●
●
●●
●●
●
●●●
●
●
●●●
●
●
●
●
●
●●●●
●
●
●
●●●●●●
●
●
●●
●
●●●●●●
●
●●●●●●●
●●●
●
●●●
●●
●●●●●●●●
●
●●●●
●
●
●●
●●●●
●●
●●●●●●●●●●
●
●●
●
●●●●●●●●●●
●●●
●
●●
●
●●
●●●●
●
●●
●●●
●●●
●
●●●●●●●●●●●●●
●●●
●●●●
●●●
●
●●●
●●●●●
●●
●
●●
●●●●●●●●●●
●
●●●
●
●●●●●●
●
●●●●●
●
●
●
●●●●
●●●
●●
●
●●●●
●
●●
●
●
●
●●●
●
●
●●●●●●●●
●
●●●
●
●
●●
●●●●●
●
●●●
●
●
●●●
●●
●
●
●●●●
●●
●
●●●
●
●
●
●
●●
●●●●●●●●●●●●●
●
●
●
●
●●
●
●●
●●
●●
●
●●
●
●
●
●
●
●
●●
●
●●
●●●●
●
●
●
●
●
●
●
●
●
●●●
●
●
●
●
●●●
●●●
●
●●●●●●●●●
●●
●
●
●
●●
●●
●
●
●●●
●
●
●
●●
●
●
●●
●●●
●
●●
●
●●●●●●●●●●
●
●●●
●
●
●
●●●●●●●●●●
●●●
●
●●
●
●●
●
●●●
●
●
●●●●
●
●
●●
●●●●●
●
●●
●
●●●●
●
●●●●
●
●●●
●●●●
●
●●
●
●
●
●
●●●●●●
●
●●●●●●●
●
●●●●●
●●
●
●
●
●●●●●
●●
●●
●●●
●
●
●●
●●
●
●●
●
●●●
●
●
●●●●●●
●
●
●●●●
●
●●●●●
●●●
●●●●
●●
●
●●●
●●
●●
●●●●●●●●●●●●
●●●●●●●●●●●●●●
●
●
●●
●
●
●
●●
●
●
●
●●
●
●●
●
●●●
●
●
●
●●●●●●
●●
●●●●●●●●
●
●
●
●
●
●●●●
●
●●
●
●
●
●
●●
●
●
●
●
●●●●
●
●
●●●●
●
●
●●●●
●
●●●●●●●
●
●●●●●●
●
●●
●●●●●
●●
●
●
●
●
●
●●
●●●●●
●
●●●
●●
●●●
●●●●
●
●
●
●
●●●●●
●
●
●●
●
●●●●
●
●
●●
●
●●
●
●●●●●●●●●●
●
●●
●
●●
●●
●●
●●
●●●●●●
●
●
●
●
●
●
●
●●●●
●
●●●
●●●
●
●●●●●
●
●
●●●
●●●
●
●
●
●
●
●
●
●
●●●
●
●●
●
●
●●●●●
●●●●●●●●
●
●●
●
●●●●●●
●●
●
●●●
●
●●
●
●●
●
●●●
●
●●●
●●
●
●
●
●
●
●●
●●
●
●
●●●
●
●
●●●●
●
●
●
●●●
●●
●●
●●
●
●●●
●●●
●
●●●
●
●
●●●
●●●●
●
●
●
●
●
●●●
●●●●
●●●
●
●
●
●
●
●●●
●
●
●
●●
●
●●●●
●
●●
●
●●●●●●●
●●●●
●
●
●
●●
●●●
●
●
●●●●
●
●
●
●●
●
●●●●●●●●●
●●
●●
●
●●●●●●
●●
●●●●●
●
●●●
●●
●
●
●●●●●●●●●●
●●
●●●●●●●●
●●●●●●●●●
●
●
●●●
●●
●●
●
●
●●
●
●
●
●
●
●●●●
●●
●●
●
●
●●
●
●●●●●●
●
●●●●●
●●
●
●
●
●●
●
●
●
●●
●
●
●
●●
●●●●
●
●
●
●
●●●●●
●●
●
●●●●●●●●
●
●●
●●
●●●●●●
●
●●●●
●
●●●●●●●
●
●
●●●●●●
●
●
●
●●●
●●
●
●
●●●●●●●
●●
●
●●●●●●●
●●
●
●●●
●
●
●●●
●
●
●
●
●
●●●●●●
●
●●
●
●●
●●●●●
●●
●
●
●●●
●●
●●
●●
●
●●●●
●●●●●●
●
●●●
●
●●●
●
●●
●
●●●●●●●●●●●●●●●●●
●
●
●
●
●
●●
●●●●●●●●●●●●●●●●
●
●
●
●
●●●●●
●
●
●●
●
●●
●
●
●
●
●
●
●●
●
●●
●
●●
●
●●●
●●●●●
●●●●
●
●
●●●●
●●
●
●●●●●●
●
●●●
●
●
●●●
●●
●
●
●
●
●
●
●
●
●
●
●●●●●
●
●●●
●
●●
●●●
●●●●●
●
●
●●
●
●●●●●
●
●●●●●
●
●
●
●●
●
●●●
●●●●
●
●●●●●●
●
●●
●
●●●●●●●●●
●
●
●●●
●
●
●
●●●
●●
●
●●
●●
●
●
●
●●●
●
●●●●●●●●
●
●●●
●
●●
●●●●●
●●
●
●
●
●●●●●
●
●●
●●●●
●●●●
●
●●●
●●●●●
●●●●●
●●●
●
●●●
●
●●●●●
●
●●●●●●●●●
●
●
●●
●●
●
●
●
●●●●●
●●●●●
●
●●
●
●●
●●●
●●●
●
●●
●
●●●●●●●●●
●●
●●
●●●●●●●●●
●
●
●
●●●●●
●
●●
●
●●●●●●●●●
●●
●
●●●●
●●●
●●
●
●
●●●●●●●●●
●
●●
●●●●●●●
●
●●●●●●
●●
●
●●
●
●
●●
●●
●
●●
●●●●
●
●
●●
●●●●●
●●
●●●
●
●
●●●●●
●
●●●●
●
●●
●●
●
●
●
●●●
●
●
●
●●●
●
●●●
●
●●
●
●
●
●●●●
●
●●●
●
●●●●
●●●●
●
●●
●●●●
●
●
●
●●●●●●
●●●
●●
●
●●
●●
●
●
●●●●●●
●
●
●●●●●
●
●●●●●
●
●
●●●●
●●●
●●
●●●
●●
●
●●
●●●
●
●●●●●
●
●●●
●●
●●
●
●●
●●●
●
●●●●●●
●
●●
●
●●
●
●
●●
●
●
●
●●
●
●
●●●
●
●●
●
●
●●●
●
●●●
●
●
●
●●●●
●
●
●●●
●
●
●●●
●
●
●●●●
●
●
●
●
●
●
●
●●
●
●●
●●●●●
●
●
●●
●●
●
●
●
●●
●
●●●●●●
●
●●●●
●
●●
●
●
●
●●●
●
●●
●●
●
●
●
●
●
●●●●●●●●
●
●
●●●●●●
●●
●
●
●●
●●●●●●●●●●
●
●
●●●
●
●
●
●
●
●
●●
●
●●●
●
●●●●●●●●●
●●●●●●
●
●●
●
●
●
●●●●●●●
●●
●●
●
●●
●
●●●●●●●
●
●●
●
●
●
●●
●●●
●●
●
●●
●●
●●●●●●
●●
●●
●
●●●
●●●●
●
●●
●
●
●●●●●●
●
●●
●
●
●
●
●
●
●
●●●
●●
●
●●●
●
●
●
●
●●●●●
●●
●●●●●
●
●●●
●
●
●●●
●
●●
●●●●
●
●
●●
●
●●
●
●
●●
●
●●●
●
●
●
●
●●
●●
●●●
●
●●
●
●
●
●●●●●●●●●
●
●●
●●
●●●●
●
●●●●●
●●●
●●●
●●
●
●
●
●●●●●●●●●●●
●
●
●●
●●●
●
●●
NQ WQ
02
46
8
# C
omm
ents
log(
coun
ts+1
)
●●●●●●●●●●
●
●●●●●●●●
●
●●●●
●
●●
●●●●●●●●●
●
●●●●●●●●●●●●●●
●●●●●●
●
●●
●●
●
●●●●●●●●
●
●●●●●●●●●●●●●●●●●●●●●●●●●●●
●●●●●
●
●●●●
●
●●●●●●●●●●
●
●
●
●
●●●
●
●●●
●
●●●●●●●●
●
●
●
●
●
●
●
●
●
●
●
●
●●●
●●
●●●●●●●●
●
●●●●●●●●●●●●●●●●●●
●
●●●●
●
●●
●
●●
●
●
●●●●●
●●
●
●●●
●
●●●
●●
●
●
●●●●●
●●
●
●
●
●●●●●●
●
●●●●●●●●●●
●
●
●●●●●●●●
●
●●
●
●●
●●●●●●●●●●●●●●●●●●●●●●●●●●●●●●●●
●
●●●●●●●
●
●●●●●●●●●●●●●●●●●●●
●
●●●●●●●●●
●●●
●
●●●
●
●●●●●●
●●●
●●●
●
●●●●●●●●
●
●●●
●●
●●
●
●●●●●●●●●●●
●
●●●
●
●●●●●●●●●
●
●●●●●●
●
●●●●
●●●
●
●●●●●
●
●
●●●●●●
●
●
●●●●●●●
●
●
●●●●●●●
●●●●●●●●●●●●●●●●●●
●
●●●●
●
●
●
●●●●
●
●
●
●●●●
●●
●●●●●●●●●●●●●●
●
●●●●●●●●●●●●●●●●●●●●
●●●●●●●●●●●
●
●●●●●●●●●
●
●●●●
●
●●●
●●●●●●●●●●●●●●●
●●●
●
●●●●●●●●●
●
●●●●
●
●●●●●●●●●
●
●●●●●
●
●●●●●●●●●●●●
●
●
●●
●
●
●●●●●●●●●
●
●●●●●●●●●●●
●
●●●●
●
●●●●●●●●●●●●●●
●
●
●
●
●●●●●●●●●●●●●●●●●●●●●●●●●●●●●●●●●●●●●●●●
●
●●●●●●
●
●●
●
●●●
●●●●●●●●●●●●●●●●●●●●●●●●●●
●
●●●●●●●●●●●●●●
●●●
●●●●●●
●
●●
●
●
●
●●●
●
●
●
●●●●●●●●●●●●●●●●●●●
●
●
●●
●●
●●
●●●●●●●
●
●●●●●●
●
●●●
●●
●●●●
●●●●●●
●
●●●●●●
●
●●●●●●●●●●●●●●●●●●
●
●●●●●●●●●
●
●●●●●●●●●●
●
●●●●●●
●
●●●●●●●●●●●●●●●●●●●●●●●●●●●●●●●●●●●●●●●●●●
●
●●●●●●
●
●●
●●
●
●
●●●●●●●●●●●●●●
●
●●●●●●●●●●●●●●●●●●●
●
●●
●
●●●●●●●●●●●●●●●●●●●●●
●●
●●●●●●●●
●
●●●●●●
●
●●●
●
●●●
●
●
●
●●●●●●●●
●
●●●●●●
●●●●●●●●●
●●●●●●●●●●●●●●●●●●●●●
●●
●●●●●●●●●●●●●●●
●
●●●●
●
●●●●●●●●●●
●●●●
●●●●●●
●
●●●●●●●●●●●●●●●
●●
●●●●
●
●●●●●●●●●●●●●●●
●
●●●●●●●●●
●●
●●●●
●
●●●
●
●
●
●
●●●●●●
●
●●●
●
●●●●●●●●●●●●
●
●
●●●●●●●●
●
●●●●●
●
●
●
●●●
●
●●●●●●●●●●●●●●●●●●●●●
●●●●●
●●●
●●●●●●
●●●●●●●●●●●●●●●●●●●●●●●●●●●●●●●●●●●●●●
●
●●●●●●●●●●●●
●
●●●●
●
●●●●●●
●●●●●●●●●●●●●●●●
●
●●●●●●●●●●●●●●●●●●●●●●●●●●●●●●●●
●
●●●●●●●●
●●
●
●●●●●●●●
●
●●●●●●●●●●●●●
●
●●●●●●●
●
●
●
●●●●
●●
●●
●●
●●
●●●●●●●●●●●●●●●●●●●●
●●●●●●●●●●●
●
●●●●●●
●●●●●●●
●
●●●●
●●
●●●●●●●●●●●●
●
●●●●●●●
●
●●●●●●●●●
●
●
●●●●
●
●●
●
●●●●●●●●●●
●
●●
●
●
●
●●●●●●●●●
●
●●●●●●●●●●●●
●
●●●
●
●●●●●●●
●
●
●●●
●
●●●
●
●●
●
●●●●●●●●●●
●
●●●●●●
●
●●
●
●●●●●●●●●●●●
●
●●●●●●●
●
●●●
●
●
●●●
●
●●
●
●
●
●●●●●●●
●
●
●
●●
●
●●●
●
●●
●●●
●●●●●●
●●
●
●●
●
●
●●
●
●●●
●
●
●
●●●●●●●●
●
●
●●●
●●
●●
●●●●
●
●●●●●●●●●
●
●●●
●
●●●
●
●●
●
●
●●●●●
●
●
●
●●●●●
●
●●●
●
●●●
●
●●●
●
●
●
●
●
●●
●
●●●●
●
●●●●●●●●●
●
●●●●
●
●●
●
●●
●
●●●●●●●●●●●●●●●●●
●
●●●●●●●●●●
●
●●●●
●
●●●●●●
●
●
●
●●●●
●
●●
●
●●●●●●●●●●●●●●●
●
●●●●●●●
●
●
●●●
●
●●●●●●●●
●
●●
●●
●
●
●●●●
●
●
●
●
●●
●
●●●●●
●●
●
●
●
●●●●●●●
●
●
●●●●●●●
●
●●●●●●●
●
●●
●●●
●
●●●●●
●
●●
●●
●●●●●
●
●●●
●
●●●
●
●
●
●
●
●●●●●●●●●
●
●
●●●●●●●●●
●
●●●●
●●
●
●●
●
●●●●
●
●
●
●●
●
●
●●●●
●●●
●
●●
●
●
●
●●●●●●●
●
●
●
●
●●●●
●●●●●●●
●
●
●●●●●
●
●●●
●
●
●
●●
●
●●●●●●
●
●
●
●●
●●●●●●
●
●●●●●●●●●●●●●●●●●●●●●●●●●●
●
●●●●●●●●●●●●●●●●●●
●
●●●
●●
●
●
●●●●
●
●●●●●
●●
●●●●●●●●●●●●
●●●●●●●
●
●●●
●
●
●●
●●●●●●●●●●●●
●
●●●●●●●●
●
●
●
●●●●●●●●●●●
●
●●●●●●●●●●●●●●●●●
●
●●
●
●
●●
●
●●
●
●●●●
●●●●●●●●●●
●
●
●
●
●
●●●
●
●●●●●
●
●●●●●●●●●●●●●●●●●●●●●●●●●●●●●●●●●●●●●●●●
●
●●
●
●●
●●●
●
●
●
●●
●
●●
●●●●●●
●
●●●
●
●●●●
●●●
●
●
●●
●
●●●●●
●
●
●●
●
●
●●●●●●●●
●
●
●●●
●
●
●
●●●●●
●
●●
●
●●●●
●●
●●●●
●
●●●●●
●
●●●
●
●
●
●●
●
●●●
●
●
●●●
●
●●●●●●●●●●
●●
●●●●●
●
●●
●
●
●●
●●●●●●●●●●●●
●
●●
●●
●
●●●
●
●●
●
●●●
●●●●
●
●
●●
●
●●●●
●
●●
●
●
●
●●
●
●
●●●
●
●
●
●●
●●
●
●●●●
●●
●
●
●●●
●
●
●
●●
●
●●
●●●●●●●
●●●●●●●
●
●●●
●●●
●
●●●
●●
●
●●●●
●
●
●
●
●
●●
●●●●
●●●●●
●
●●●
●
●
●
●●
●●●
●
●●●
●
●
●
●
●
●
●●
●●●
●
●
●●●
●
●●
●
●
●●●
●
●●●
●
●●●
●●●●●
●●
●
●
●
●
●
●
●
●●
●
●●
●
●
●●
●●
●
●
●
●●●●●●●●●●●●●●●●●●●●
●
●●●●●
●
●
●●●●●
●●
●
●
●
●
●●●
●●
●
●
●●
●
●●●
●
●●●●
●●●●●●●●●●●●●●●●●●●
●
●●
●●●
●●
●
●
●
●
●●
●
●●
●
●●●
●●●●
●
●
●●●
●
●●●
●
●
●●●
●
●
●
●
●
●
●●
●
●
●
●
●
●●●
●●
●●
●
●
●
●
●●
●●
●
●●●
●
●
●
●
●
●
●●●●
●
●
●●●
●
●
●
●●
●●
●●
●●●
●
●●●
●●●
●●●
●
●
●
●
●●
●●●●●●●●●
●
●●●
●
●
●
●●
●
●
●
●●●●●●●
●
●
●
●●
●●●
●
●
●●●
●
●●●●●●●●
●●
●●●●●●
●
●
●
●●●●
●
●●
●
●●
●
●
●
●
●●
●●●
●
●●●●●
●
●●●●
●
●●●●●
●
●
●
●
●
●●●
●
●
●
●●●
●
●
●●
●
●
●●
●
●
●●●●
●
●●
●
●
●
●●●
●
●●
●●
●●
●
●●●
●
●
●
●
●
●●
●
●●●●●●●●●●●●●●●●
●
●●●
●
●●
●●
●●
●
●●●●
●
●●●
●
●
●
●●●●
●
●
●●●
●
●●●●●●●
●
●
●
●
●●●●●
●●●
●●
●
●
●
●
●
●
●●
●●
●●
●●●
●
●●
●●
●
●●●●
●
●●
●●●●
●
●
●●●
●
●
●●
●
●●
●
●●●●●●●●●●●●●●●●●●
●
●●
●
●
●
●●●
●●●
●●
●
●●●●
●
●●●●●●
●
●●
●
●●●
●
●
●
●
●
●●
●
●●
●●●
●●●●
●
●●
●
●
●
●●
●
●●
●
●●●●●●
●●●
●
●●●
●●●●●
●
●●
●
●●●●●●
●
●●
●
●●
●
●
●
●●●●●●●
●
●●●●●●
●●
●
●
●
●
●
●
●
●●●●
●
●●
●●
●
●
●●●●●
●
●
●●●●
●●●●●
●
●
●
●
●
●
●
●
●
●
●
●●●●
●●●
●●●
●
●●●
●
●●●
●
●●●●●●●●
●
●●●●
●
●●●●●●
●●
●●●●●●●
●
●
●●
●
●
●
●
●
●
●
●
●
●●●
●
●●
●
●●●
●●
●
●
●
●●
●
●
●●●●
●
●●●●●
●●
●●
●
●
●
●●
●●
●
●
●
●●●
●●●●
●●
●●
●●●●●●
●
●
●●
●●●●●●●
●●●
●
●●
●
●●
●
●
●●
●●
●●●●●
●
●
●
●●●
●
●
●●
●●
●
●
●●●●
●
●●
●●
●●●
●
●●●
●●●●
●
●
●
●
●●
●●
●●
●●
●●●●
●
●
●●●●
●
●●●
●
●
●●
●●●●●
●
●
●
●
●
●●●
●
●
●
●
●
●●●
●
●●●
●●●
●
●
●
●●
●●
●
●●●
●
●
●●●●●●
●
●
●
●●●●
●
●
●●
●●●●
●
●
●●●
●●●●●
●
●
●
●
●
●
●●
●●●
●
●
●●
●●●●●●
●
●●
●
●●●
●
●
●
●
●●
●●
●
●●
●
●
●
●●
●
●
●
●●●●●
●
●●
●
●●●●
●
●●●●
●
●
●
●●●●●●●●●●●●●●●●●●●●●●●●
●
●●
●
●●●●●●●●●●●●●●●●●●●●●●●●
●
●●
●●●
●●●●
●
●
●
●
●
●
●●●●●●
●
●●●
●
●●●●●●●●●●●●●
●
●●●
●
●
●
●●●
●
●
●
●●
●
●
●●
●●
●
●●
●
●●●●
●●
●
●●●
●
●●
●
●
●●
●
●●●●●
●
●
●
●●●
●●●●
●
●●●
●●
●●●
●
●●●
●
●●
●
●
●●●●
●
●●●●
●
●
●
●
●
●
●
●
●
●●
●
●
●
●●●●●
●
●●●
●
●●
●●
●●●
●
●●●●
●●
●●
●
●
●
●●
●
●●
●
●●●●
●●
●
●
●
●●
●
●
●
●
●●●
●
●●
●
●
●
●●
●●
●
●
●
●●
●●
●
●
●
●
●●●●●●●
●
●
●
●●●●
●●
●
●●
●
●
●
●●●●●●●●
●●
●
●
●●●
●●●
●
●
●●
●●
●●●
●
●
●
●●●
●
●●●
●
●●●
●
●●●
●
●
●
●
●●●●●●
●
●●●●●●●
●
●●
●
●●●
●
●
●
●
●
●●●
●●●
●
●
●●
●
●●●
●●
●●●
●
●
●
●●
●●●
●
●
●
●
●●●●●●
●
●●
●
●
●
●
●●●●●
●
●●●
●
●●●●●●●●
●●
●
●●
●
●
●●
●●●●●●●●●
●
●●●●●●
●
●
●
●●●
●
●●●
●
●●
●
●●●
●
●
●
●
●
●●
●
●
●
●
●●
●
●●●●
●●
●●●●
●
●●●●
●
●●
●
●●●●●
●
●
●
●
●●●
●
●●●●●●
●●
●
●
●●●
●
●
●
●
●
●
●●
●
●
●●
●●●●●
●
●
●
●
●
●
●
●●●
●
●
●
●
●●●●
●●●
●●●
●●●
●
●●●●●
●
●
●●●●●●●
●
●●
●
●●
●
●●●●
●●●
●●
●●
●
●
●
●●
●
●●●●
●
●●
●
●
●
●
●
●
●●
●
●●●
●
●●●●●●●
●
●●
●
●●●
●
●●●
●
●
●
●●●●●
●
●●
●
●
●
●
●●●●
●●●
●
●
●●
●
●●
●
●●●●●●●●●
●●
●
●●
●
●●●
●●●●●●●●●
●
●
●
●●●●●●●●
●
●●●
●
●
●
●●●●●●
●
●
●
●●●●
●
●●●
●
●●●●
●
●●●●●
●●
●●
●
●
●●●●●●●●
●
●●
●
●●●●●
●●
●●●●
●
●
●●
●
●●●●
●
●
●
●●●
●●
●●
●
●●
●●●
●
●●●●
●
●●
●
●●●
●
●
●
●●
●
●●
●
●●●●
●
●●●
●●●●
●●
●●●●●●●●
●
●●
●
●
●●
●●
●
●●●●
●●●●
●
●●●●
●●
●●●●
●
●
●
●●●●●
●●
●
●
●●
●
●●●●●●●●●●●●●
●●
●
●
●●●
●●●●●●
●●●●
●
●●●
●
●●●●●●●●
●
●●●●●●●●
●●
●●●●
●●
●
●
●
●●●●●
●
●
●●●
●
●●●●
●●●●●●
●
●●
●●
●●
●●●
●●
●●●●
●
●●●●●●
●●
●●●●
●
●
●●
●●●●●●●●●●●●
●
●
●●
●
●●●●
●●●●●●
●
●●
●
●
●●●●●
●●●●●
●●●
●●●●●●
●
●
●●●●
●
●
●
●
●
●●
●●●●●●
●
●●●●
●
●
●
●
●●
●
●
●●
●
●●
●
●
●●
●●
●●
●
●
●
●
●
●
●
●●●
●●●●●●●●
●
●●●
●
●
●●
●
●●●●●
●
●●●
●●●
●
●
●●●●
●
●
●●●
●
●
●●●●●●●●●●
●
●
●
●
●●
●●
●
●
●
●
●●
●
●●●●
●
●●●
●
●●●
●
●
●
●
●●
●
●●
●●
●●●●●
●
●
●
●●
●●
●●
●
●●
●●●
●●
●
●
●●
●●●●●●●●●●●●●●●
●
●●
●●●
●
●
●
●●●
●
●●●●
●
●●
●
●
●●
●
●
●
●
●●●●●
●
●
●
●
●●●
●
●
●●
●
●
●
●●●●
●●●
●●●
●
●●●●●
●●●●●
●
●●●
●
●●●
●
●●
●
●●●
●
●
●●
●
●●●●●
●●●●
●●
●●
●
●
●●●●
●
●
●●●
●
●
●
●
●
●●
●●●
●●●
●
●●
●
●●
●
●
●●●●
●●●●
●
●●●●●
●
●●
●
●●
●
●●●
●
●
●●●●●●●●
●
●●
●
●
●●●●●●●
●●●
●●
●
●
●
●●●
●
●●
●
●
●
●
●●●●
●
●
●
●●●
●
●●●●●●●
●
●
●
●●
●
●●●
●
●
●●
●●
●●
●
●●●
●●
●●●
●
●
●
●
●
●●●●●●●●●●●●●●●●
●
●
●
●●●
●
●
●●●●●
●
●●●
●
●
●●●●●●●●●●
●●
●
●
●
●●●●
●●●
●
●●●●●
●
●●●●●
●
●●
●
●●
●
●
NQ WQ
01
23
45
6
# D
evel
oper
s lo
g(co
unts
+1)
●
●●
●●
●●●●●
●
●●●
●
●
●
●●●●●●●●●
●●●
●
●
●●
●
●●●●
●
●
●●
●
●
●●
●
●
●
●
●●
●
●
●●
●
●●
●
●●●●●
●
●●
●●●●
●
●
●
●
●●●●●●●●●●●
●●
●●
●
●●●●●●
●
●
●●
●●●
●
●●
●
●●
●
●●●
●
●●
●
●
●
●●
●
●●
●
●●●
●●
●●●
●
●●
●
●●
●
●●●●●●
●
●
●
●●
●●
●●●●●●●●●
●
●●●
●●●●●●●●●●●
●●●
●●●●
●●●
●
●
●●●
●●
●●●●
●
●●
●●
●●
●
●●●●
●
●
●
●●●●
●
●●
●
●●●
●
●●●
●
●
●
●●●
●
●●●
●
●●●●●
●
●●
●
●●
●●●●●●●
●
●
●
●●
●
●
●
●●●
●●
●
●
●●●
●●●
●
●
●●●
●
●
●●●●●●●
●
●
●
●
●●
●
●●●●●●●●●●●●●
●
●●●
●
●
●
●
●
●
●●●
●
●●●
●●●●●
●
●●●
●
●●
●
●●
●●●
●●●●●●●●
●
●●
●
●●●●●●●●●
●
●●●
●
●
●
●
●●●●●
●●
●●●
●
●
●●●
●●●
●●
●
●●●
●●●
●
●
●
●
●●●●●
●
●●●●●●
●
●●●
●
●●
●
●●●
●
●
●
●
●●
●
●●
●●●●●●●●●●●
●
●
●
●●
●
●●●
●●●
●●●
●
●●●●●●●●●●
●●●
●●
●
●
●
●
●
●●●
●
●●
●
●●●●
●●●●●●●●
●
●●●●
●●
●●●
●
●●●●
●
●●
●
●●
●●
●●
●
●●
●
●
●●
●●
●
●●
●
●
●●●
●
●
●●
●●●●●●
●
●
●
●
●
●●
●
●
●
●●
●
●●
●
●
●●●
●
●●●●●●
●●
●●●
●
●●
●
●●●
●●
●●●
●
●
●
●●●●
●
●
●●●●
●●
●
●●●
●
●
●
●●●
●●
●●
●
●
●
●
●●
●
●●●●
●●●
●●●●●●
●
●
●
●
●●●●●
●
●●●●●●●●●
●
●●●●●●
●
●
●
●
●
●
●
●
●
●
●●
●
●
●
●●●●●
●
●●●●●●●
●
●
●
●●
●
●
●●●●
●
●
●
●
●
●●
●
●●●
●
●●●●●
●
●●
●●
●
●
●
●
●
●●
●
●
●
●
●●
●●●●●
●
●
●●●●●●
●
●
●●
●●
●
●
●
●
●●
●
●●●●
●
●
●●
●
●
●●
●
●
●
●●
●
●
●●●●
●
●●
●●
●●●●
●
●
●
●●●
●
●
●
●●
●●●●
●●
●●
●
●
●
●
●
●
●
●
●●●●●●●
●●●●●
●●●●●●●
●●
●●●
●
●
●
●
●
●●●●●●
●
●●●●
●
●
●
●
●
●
●
●
●
●
●
●●
●
●
●
●●
●
●
●
●
●●●●●
●●
●●●
●
●●
●
●
●
●●●●●
●
●●
●
●
●●●●
●
●●●●
●
●
●
●
●●
●●●●
●●
●
●●●
●
●
●
●●●
●
●
●
●●●●●●
●
●
●●●
●
●●●●●●
●●●
●
●
●●●●●●●●●●●●
●●●
●
●
●
●●●
NQ WQ
01
23
4
# As
sign
men
t log
(cou
nts+
1)
(c) Eclipse
Fig. 7: The distribution of the impact metrics for issue reports without and with ques-tions(NQ: Issues reports that have no questions; WQ: Issue reports With Questions).We show the value of metrics by log scale based on 2.
To answer this question, we first describe our measurements of the impact andthe null hypothesis. Then we discuss our findings on the impact of raising questions.Details are described in the following subsections.
4.1 Measurement of the Impact
In our experiment, we measure the impact of raising questions on the issue resolvingprocess from four perspectives. Specifically, we use the following four metrics.
– Time elapsed measures the duration between the time when an issue report isresponded by the developers (e.g., posting comments or modifying some fields ofan issue report) and the time when the issue is resolved.
– The number of developers is the count of developers that are involved in the issueresolving process.
– The number of comments is the count of comments that are posted by the issuereporter or developers during the issue resolving process.
– The number of assignments counts the times that an issue report is assigned/reassignedto developers.
The smaller value of the aforementioned four metrics, the more e�cient the issueresolving process is. The smaller values indicate that an issue is resolved quicker,involves fewer developers, derives fewer comments, and is assigned to the appropriatedeveloper with fewer iterations.
Figure 3.9: The distribution of the impact metrics for issue reports without and withquestions
(NQ: Issues reports that have no questions; WQ: Issue reports With Questions). We showthe value of metrics by log scale based on 2.
at the creation time, three days could be saved in resolving this issue report.
Raising questions involves more developers and incurs more comments
to address the reported issues. The results of the Mann-Whitney U test show that
the issue reports with questions involve significantly more developers and comments
(i.e., p-value < 0.05) during the issue resolving process in the three subject projects.
If a developer can not address the issue report by herself or himself, she or he may ask
questions that involve other developers to answer. For instance, in Linux-bug 9147
(Figure 3.8), a developer encountered an unexpected issue that the bug still exists
with a specific configuration, therefore he or she asked help from other developers who
may be in charge of the particular module. The answer from the second developer
further triggers the discussion with the third developer.

3.3. EXPERIMENTAL RESULTS 36
Issue reports with raised questions have a higher rate of reassignment.
The results of the Mann-Whitney U test show that the issue reports with raised
questions have significantly more reassignments by comparing with the control group
without raised questions (i.e., p-value < 0.05). The previous study [35] shows that
an issue report that experiences multiple reassignments takes a longer time to be
resolved. However, our results show that the raising of questions could be one of the
reasons of reassignment. An assignee may raise questions if she or he does not have
time to fix the issue or can not fix the issue (an example happened in Eclipse-bug
10025: would you be able to fix this up? ), or another developer could be involved to
make a decision on the issue report (an example happened in Eclipse-bug 123976:
Shouldn’t this be resolved as invalid instead of fixed? ). In such cases, issue reports
could be reassigned.�
�
�
�
In terms of the elapsed time, the number of developers and comments
and the number of the assignments, the raised questions by develop-
ers could be one of the reasons that reduce the efficiency of the issue
resolving process.
3.3.3 RQ3.3: Is the occurrence of questions predictable?
Motivation. The results of RQ3.2 shows that raising questions can reduce the
efficiency of the issue resolving process. To give developers an early warning if a
newly report issue will trigger questions, we investigate the feasibility of predicting
the occurrence of questions using only the information that is available at the creation
time of the issue reports. The early warning can notice developers to take proper

3.3. EXPERIMENTAL RESULTS 37
actions at the creation time of issue reports to avoid raising questions during the
issue resolving process.
Approach. To answer this question, we first describe our metrics used to build the
prediction model. Then we present our modeling techniques, performance measures
and comparison. Finally, we discuss the predictive power and influential metrics.
Metrics Extracted from Issue Reports
In this subsection, we describe the definition, the collection, and the selection of met-
rics. Details are described as follows.
1) Metric definitions. To better describe the features and the attributes of an
issue report, we extract metrics from issue reports by four perspectives: the textual
factors, the characteristic factors, the supportive factors and the historical factors. In
total, we extract 13 metrics from issue reports.
a. Textual factors that are extracted directly from the textual data (e.g., the
description and title of an issue report). We collect the following three metrics.
• Length of the Title is defined as the number of words contained in the title of
an issue report. A longer title is more likely to provide sufficient information
about the issue, and thus developers may raise fewer questions.
• Length of the Description is the number of words in the description field of the
issue report. Similar to the title, a longer description is likely to provide more
elaborate information about the issue.
• Readability is the Coleman-Liau index(CLI) [57] of the issue description, which
has been applied in the evaluation of issue reports [40]. The CLI reveals how

3.3. EXPERIMENTAL RESULTS 38
difficult to understand the text, and it is calculated as CLI = 0.0588 ∗ L −
0.296∗S−15.8, where L is the average number of the characters per 100 words,
and S is the average number of sentences per 100 words. A lower readability is
more likely to make developers confused and ask questions.
b. Characteristic factors that are extracted from the meta-data of an issue
report (e.g., the importance and the complexity of a reported issue). We compute
the following five metrics.
• Is Regressive is a boolean variable that indicates whether the issue report was
reported and fixed before and reoccurs. Developers are more likely to raise more
questions on the issues that have the regressive property.
• Severity describes the severity of an issue report, and ranges from 1 to 5 (i.e.,
“enhancement” to “blocking”) in Linux, and from 1 to 7 (i.e., “enhancement”
to “blocker”) in both Firefox and Eclipse.
• Priority captures the priority of an issue report, and ranges from 1 (low priority)
to 5 (high priority).
• Is Blocking is a boolean variable that indicates whether the issue must be ad-
dressed before addressing the issues that are listed in the “Blocks” field.
• Is Dependent is a boolean variable that indicates whether another issue must
be addressed before addressing the reported issue.
c. Supportive factors that are extracted from the information used to assist
developers to reproduce and resolve the reported issue. We calculate the following
three metrics.

3.3. EXPERIMENTAL RESULTS 39
• Has steps to reproduce is a boolean variable that indicates whether an issue
report describes the steps to reproduce the reported issue. Developers are more
likely to ask questions about how to reproduce the issue, if details of the repro-
duce steps are missing in the issue report.
• The number of attachments counts the attachments that include the patches
and the testing case for the issue report.
• The number of CCs is the number of unique developers contained in the carbon-
copy(CC) list of the issue report. A developer listed in the CC field will get
informed if there is a change in the issue report. More developers included in
the CC list indicates a higher chance of interactions among developers.
d. Historical factors that are computed based on the history of the reporter
that happened before the creation time. We compute the following two metrics.
• Reputation of the reporter is a float value to describe the reputation of the issue
reporter. We compute the reputation of a reporter as the proportion of issue
reports that are previously filed by the reporter and get fixed in the end [34, 40]:
reputation = |opened∩fixed||opened|+1
. Note that 1 is added to the denominator in case a
reporter did not report any issues in the past.
• The rate of rejected issues previously reported. Issue reports can be rejected
as different resolutions, e.g., Worksforme, Duplicate, Invalid and so on. There
are nine, seven and six types of resolutions for rejecting issue reports in Linux6,
6https://bugzilla.kernel.org/query.cgi?format=advanced (accessed in Jul. 2016)

3.3. EXPERIMENTAL RESULTS 40
Rat
e of
Mov
ed
Rat
e of
Obs
olet
e
Rea
dabi
lity
Is R
egre
ssiv
e
Is B
lock
ing
Rat
e of
Will
_Not
_Fix
Rat
e of
Insu
ffici
ent_
Dat
a
Rat
e of
Unr
epro
duci
ble
Rat
e of
Doc
umen
ted
Rat
e of
Inva
lid
Rat
e of
Dup
licat
e
Rep
utat
ion
of th
e re
port
er
Rat
e of
Pat
ch_A
lread
y_A
vaila
ble
Is D
epen
dent
Leng
th o
f Des
crip
tion
Sev
erity
Ste
ps to
rep
rodu
ce
Leng
th o
f Titl
e
The
num
ber
of a
ttach
men
ts
The
num
ber
of C
Cs
Prio
rity
0.6
0.5
0.4
0.3
0.2
0.1
0.0
Spe
arm
an ρ
Figure 3.10: The Spearman correlation analysis for Linux.The dotted red line indicates the threshold value of 0.7.
Firefox7 and Eclipse8 respectively. To better describe the experience of develop-
ers, we use a list of float values to indicate the rate of different types of rejected
issue reports previous reported by the reporter. We use Ti to denote the ith
type of rejected resolution (i.e., i = 1 to 9 in Linux, 1 to 7 in Firefox and 1 to
6 in Eclipse), and calculate rateTireporter as rateTireporter = |opened∩Ti||opened|+1
.
2) Metric computation. The values of all aforementioned metrics are collected
using only the information that is available at the creation time of issue reports.
Therefore, we can apply these metrics to predict the chance of having questions raised
at the creation time of an issue report. For the fields (e.g., severity, the number of
CC) whose values may be changed during the issue resolving process, we trace back
to the initial value that is filled in the creation time of an issue report.
7https://bugzilla.mozilla.org/query.cgi?query format=advanced (accessed in Jul. 2016)8https://bugs.eclipse.org/bugs/query.cgi?format=advanced (accessed in Jul. 2016)

3.3. EXPERIMENTAL RESULTS 41
3) Metric selection. The existing highly correlated factors can lead to overfitting
of a model [91]. To analyze correlation, we calculate the Spearman rank correlation
for our metrics to test whether there is any highly correlated pair of metrics. We
apply the variable clustering technique (i.e., R function varclus) to see the correlation
coefficient ρ. If the correlation coefficient of a pair of metrics is higher or equal to 0.7,
we consider the pair of metrics is highly correlated and pick only one of them. The
value of 0.7 has been applied in previous studies [72, 58, 79]. Figure 3.10 depicts the
Spearman rank correlation of the metrics in Linux. As there is no any pair of metrics
that has the correlation coefficient value greater or equal than 0.7, we do not exclude
any metrics in Linux, Firefox, and Eclipse.
Prediction Models
To build a better prediction model, we experiment with three different prediction
models [71], i.e., random forest, logistic regression and naive Bayes. Logistic regression
is a generalized linear model which is a pretty well-behaved classification algorithm
that can be trained as long as the features are expected to be roughly linear [38, 26].
Unlike logistic regression, the random forest is an ensemble learning model and do
not expect linear features or even features that interact linearly [55, 46]. NaiveBayes
is a simple probabilistic classifier, which applies Bayes’ theorem with the assumption
of independence between every pair of features [60, 73].
Model Performance
To evaluate the performance of the prediction model, we use precision, recall, accu-
racy, F-measure, which are explained below.

3.3. EXPERIMENTAL RESULTS 42
• Precision (precision) is defined as the proportion of the issue reports that are
predicted as having questions and truly have questions [25, 69]: precision =
TPTP+FP
.
• Recall (recall) measure the completeness of a prediction model. A model is
considered as more complete if more issue reports with questions could be cap-
tured [25, 69]: recall = TPTP+FN
.
• F-Measure (F -measure) is used to balance the precision and recall. It is a
combining way to describe a model [71]: F -measure = 2× precision×recallprecision+recall
.
• Accuracy (accuracy) calculates the percentages of the correct prediction [71]:
accuracy = TP+TNTP+FP+TN+FN
.
• Area Under Curve (AUC) gives us an overview of the ability of the prediction
model. AUC is the area under the curve plotting the true positive rate against
the false positive rate. The AUC value could be ranged from 0.5 (worst, i.e.,
random guessing) to 1 (best, i.e., all targets could be captured by the prediction
model).
Model Comparison
To obtain a reliable performance measure, we apply ten times of 10-fold cross-
validation. In the 10-fold cross-validation, the data is equally divided into 10 parts.
In each fold, the 9 parts are used to train the model and the remaining part is used
to test the model. To compare the performance of our selected prediction models, we
apply the Scott-Knott effect size clustering (SK-ESD) [84] on the results of the ten
times cross-validation. The Scott-Knott effect size clustering ranks the performance

3.3. EXPERIMENTAL RESULTS 43
based on the effect size of their differences. We use the R package ScottKnottESD for
the comparison.
Results. It is feasible to predict the occurrence of questions solely
based on the information that is available at the creation time of the issue
reports. Table 3.5 shows the precision, recall, F-Measure, accuracy, and AUC of our
prediction models. For instance, the random forest model achieves the AUC values
at 0.78 in Linux, 0.65 in Firefox, and 0.70 in Eclipse, significantly outperforming the
random guessing with a large margin (i.e., from 0.15 to 0.28). The random forest
model generally performs the best in our selected models in terms of F-measure and
the AUC value. The result of the SK-ESD shows that the AUC value achieved by the
random forest model is statistically significantly higher than the logistic regression
model and naive bayes model, except in Firefox where the logistic regression model
achieves the similar performance as the random forest model (i.e., both with a median
AUC of 0.65).
During the issue resolving process, additional information (e.g., discussions among
developers) can be collected as developers progress. The additional information that
can be collected at a later stage of the issue resolving process is likely to improve the
performance of the model in predicting the raising questions. However, since our goal
is to give developers an early warning when a new issue report is created, it is worth
mentioning that our model is purposely built under a difficult setting (i.e., all metrics
are collected using only the information available at the creation time, and any other
information that can be collected at a later stage of the issue resolving process is not
used). As a summary, we conclude that it is feasible to predict the occurrence of
questions for newly created issue reports, especially in Linux and Eclipse.

3.3. EXPERIMENTAL RESULTS 44
Table 3.4: The five important metrics in the random forest models.
The metrics are clustered and ranked using Scott-Knott effect size clustering.
ITS Rank Metric Importance
Linux 1 Number of CCs 0.10482 Priority 0.01513 Readability 0.01144 Number of attachments 0.01085 Description length 0.0076
Firefox 1 Number of CCs 0.04192 Severity 0.00763 Reputation 0.00694 Rate of DUPLICATE 0.00595 Description length 0.0058
Eclipse 1 Number of CCs 0.02551 Reputation 0.02552 Description length 0.01733 Rate of DUPLICATE 0.01514 Rate of WORKSFORME 0.0114
Table 3.5: The median value of performance measures of our models in three studiedsystems
(bold font highlights the performance of the best model in each system)Model System Precision Recall F-Measure Accuracy AUC
Random Linux 0.70 0.70 0.70 0.72 0.78forest Firefox 0.52 0.57 0.54 0.62 0.65
Eclipse 0.37 0.66 0.47 0.63 0.70
Logistic Linux 0.71 0.62 0.66 0.70 0.76regression Firefox 0.53 0.52 0.53 0.63 0.65
Eclipse 0.37 0.55 0.44 0.65 0.66
Naive Linux 0.68 0.49 0.57 0.65 0.70Bayes Firefox 0.50 0.38 0.42 0.60 0.60
Eclipse 0.36 0.39 0.38 0.68 0.63
Random Linux 0.47 0.50 0.48 0.50 0.50guessing Firefox 0.39 0.50 0.44 0.50 0.50
Eclipse 0.25 0.50 0.33 0.50 0.50
Influential Factors
To figure out the influential factors, we apply the permutation test technique [79].
Specifically, there is one metric randomly permuted for each time and the model is
built with the permuted set of metrics. We use R function importance in the package
RandomForest to conduct the permutation test. Moreover, we apply the Scott-Knott

3.3. EXPERIMENTAL RESULTS 45
effect size clustering (SK-ESD) [84] to group the importance of the metrics. If there
is no significant difference in the importance scores between metrics, those metrics
are considered as having the same rank.
The number of carbon-copy(CC) is the most influential factor in all
three subject systems. A long CC list indicates that the issue reporter intentionally
involves more developers into the issue report. The involvement of more developers i
more likely to trigger questions. When filling a long CC list, the issue reporter should
try her or his best to provide every detail of the issue in the description. This may
not prevent all questions raised during the discussion, but at least can avoid questions
raised against the issue description.
Table 3.4 shows the average importance value of all the top five influential metrics
based on the results of Scott-Knott effect size clustering. Another common influential
metric is the description length. The remaining influential metrics vary across sys-
tems. For instance, the priority, readability, and the number of attachments are the
three influential metrics in Linux. When reporting an issue in Linux, we suggest the
issue reporter improve the readability of the description and attach necessary files,
such as configurations. In the other two systems Firefox and Eclipse, the experience of
the reporter (such as the reputation of reporters, and the rate of duplicate/worksforme
issues reported by reporters) play more important roles in predicting the occurrences
of questions. We conjecture that, in the two systems, the issue reporters with less
experience may not have a clear checklist on the description and attribute fields when
creating issue reports. It is beneficial to design a tool to automatically check if the
appropriate information is provided by the issue reporter at the creation time.

3.4. THREATS TO VALIDITY 46
�
�
�
It is feasible to predict if future questions will be raised by the developers
from the issue report at the creation time of an issue report. The number
of CCs is the most influential metric to all three subject systems.
3.4 Threats to validity
In this section, we discuss the threats to the validity to our study, by following Yin’s
guidelines [93] of case study research.
External Validity concerns the threats to generalize our findings. Our three
subject systems are representative open source systems that have a long history. As
a result, our findings can reflect the current practice in open source community. Al-
though our findings may not directly applicable to proprietary systems, our approach
can be applied to any system with an issue tracking system to find the common
types of questions, the impact of raising questions and the feasibility of predicting
the occurrence of questions.
Internal Validity concerns the threats coming from the analysis methods and
the selection of subject systems. The threat to our internal validity comes from the
extraction of questions. Issue reports are free-form text, thus there exist different
kinds of noise (i.e., link information, log information that contain question mark).
To mitigate the noise, we manually examine the patterns from a sample set of issue
reports. Another internal threat is that the extracted questions can be raised against
a previously posted comment other than the description. We excluded the comments
that are posted to explicitly reply a previous comment. However, it is worth adding
more criteria to improve the accuracy of extracting questions.

3.5. SUMMARY 47
Conclusion validity concerns the relationship between the treatment and the
outcome. In our study, the elapsed time may be over-estimated, as the assignee
might be working on other issues at the same time or is taking vacations for many
days. Therefore, we also report three other metrics (i.e., the involved developers, the
number of comments and the number of assignment) to measure the impact of raising
questions on the issue resolving process. Our findings remain consistent across the four
metrics. Nonetheless, it is helpful to obtain the ground truth by directly interviewing
developers.
The raised questions may have positive effects. For example, the raised questions
can make the issues resolved in a correct way, and cause fewer regressions or reopens.
However, from a statistical comparison of our effort metrics between the control group
(i.e., the issue reports do not have questions) and the experimental group (i.e., the
issue reports contain questions), the raised questions from issue reports generally have
a negative impact on the resolving process.
3.5 Summary
In this chapter, we conduct an empirical study to understand the impact that raising
questions has on the efficiency of the issue resolving process. First, we apply the
LDA to extract the concerned topics in the raised questions. We find that there are
four common topics of questions, including Current Status, Final resolution, Operating
system and Reproduce steps in the three subject systems. In the three subject systems,
the majority questions vary across systems. Second, we examine how the raising
questions impact on the issue resolving process. We measure the impact in terms of
four measures that are the time elapsed in resolving an issue, the number of involved

3.5. SUMMARY 48
developers, the number of comments, and the number of assignments. We observe
that raising questions statistically significantly results in greater values in all the four
metrics. Therefore, raising questions negatively impacts the efficiency of the issue
resolving process. Finally, we investigate the feasibility of predicting the occurrence
of questions at the creation time of an issue report. We collect 13 metrics that
are available at the creation time and experiment with three prediction modeling
techniques (i.e., logistic regression, naive bayes and random forest). We find that
the random forest model achieves the best performance in terms of F-measure and
the AUC values. In particular, our model achieves the AUC value of 0.78, 0.65, and
0.70 in Linux, Firefox, and Eclipse, respectively. Therefore, we conclude that it is
feasible to give developers an early warning of the issue reports that are likely to raise
questions.

49
Chapter 4
Towards Reducing the Effort Spent on Rejected
Issue Reports
In this chapter, we empirically study the issue reports rejected by developers during
the issue resolving process. In our work, we strive for helping developers to auto-
matically assign a lower priority to the reports that should be rejected at the time of
triaging. We first examine how the issue reports that should be rejected threat the
efficiency of handling issue reports. Then, we build a random forest model to predict
if a newly created issue report will be rejected in the future. To avoid rejecting a
valid issue report, we further propose a ranking model. Specifically, we apply the
Learning-to-rank technique to prioritize the predicted valid issue reports at higher
positions and the predicted rejected issue reports at lower positions.
4.1 Introduction
Once an issue report is filed into the ITS, the report is assigned by a so-called triager to
a specific developer who will address the report further. Triaging is a time-consuming
step in the process of handling issue reports [43, 92, 6, 7].

4.2. EXPERIMENTAL SETUP 50
Studied ITSs
Linux
Firefox
Extracting metrics
Eclipse
Extract Issue reports
Issue Reports
Extract metrics
Effort metrics
RQ1: How much effort is spent?
RQ2: Prediction model
RQ2: Ranking model
Report metrics
Figure 4.1: Overview of our approach
The ITS of a popular project often receives a large number of issue reports. For
example, there were more than 157,000 issue reports in the Firefox ITS by the end of
2015. However, not all of the assigned issue reports will be addressed in the end [94].
A triager or developer may choose to reject an issue report. In particular, prior
work [42, 52, 81, 70] reveals several common reasons to reject issue reports, such as
that the reporter filed an invalid issue, the reporter misunderstood a feature of the
software, or the reporter failed to provide the reproduce steps or test cases.
As long as an invalid or useless issue report is not rejected, developers could be
wasting valuable resources (e.g., time) on the report. In this chapter, we show that
rejected issue reports are numerous (49%-80%) in the issue tracking data of Linux,
Firefox and the Eclipse IDE. Hence, issue reports that should be rejected seriously
threat the efficiency of the process of handling issue reports. It is of significant interest
to find how we can help developers by automatically assigning a lower priority to the
reports that should be rejected at the time of triaging.
4.2 Experimental Setup
In this section, we present the ITSs that we studied and our process for collecting
data for our experiments. Figure 4.1 gives an overview of our approach.

4.2. EXPERIMENTAL SETUP 51
Table 4.1: The number of issue reports in each studied ITS.
ITS # of Collected Reports # of Resolved Reports1 # of Rejected Reports (%)2 Collection Period
Linux 27,100 23,134 14,725 (63.65%) 2002-2016Firefox 157,340 138,767 111,682 (80.48%) 1999-2016Eclipse 94,397 81,647 40,198 (49.23%) 2001-2016
Total 278,837 243,548 166,605 (68.41%)
1The resolved reports only refer to the verified and closed reports in the entire set of collected issue reports.2The percentage is computed as the proportion of the rejected reports relative to all the resolved issue reports.
4.2.1 Studied ITSs
We choose to study the dataset of ITS of three popular ultra-large-scale and open-
source projects, i.e., Linux1, Firefox2 and the Eclipse3 that are introduced and studied
in Chapter 3. Table 4.1 shows the descriptive statistics of the issue reports that we
collected from the three studied ITSs.
4.2.2 Extracting Effort Risk Metrics
To describe the risk of wasting the effort spent on rejecting an issue report, we extract
the following three metrics as a proxy of the effort:
• Time elapsed. When a developer posts a comment or alters any field on an issue
report for the first time, we consider that the developer starts to work on the
report. We compute the time elapsed until the report is finally rejected. The
time elapsed does not necessarily mean the actual working time by developers.
Therefore, we do not interpret the time elapsed as the wasted time on the
rejected issue report. Instead, we use this metric as a relative measure to assess
the risk of wasting developers’ effort.
1https://bugzilla.kernel.org (accessed in Feb. 2016)2https://bugzilla.mozilla.org (accessed in Feb. 2016)3https://bugs.eclipse.org/bugs (accessed in Feb. 2016)

4.2. EXPERIMENTAL SETUP 52
• The number of developers. This metric is the number of developers that are
involved in the process of rejecting an issue report. A large number of developers
involved indicates that more human resources are spent on rejecting the report.
• The number of comments. This metric is counted as the number of comments
in the discussion regarding an issue report. The larger value of this metric, the
more discussion performed.
We extract these metrics from the issue reports and their change history.
4.2.3 Extracting Issue Report Metrics
We collect only the metrics that are available at the time of reporting, since the goal
of our study is to predict whether a newly filed issue report will be rejected. We use
the change history of an issue report to recover its initial field values that are filled
at the time of reporting.
We characterize issue reports from three perspectives: issue property, issue im-
portance and developer’s experience. The details of these metrics are described as
follows.
Issue property metrics
Issue property metric describe general properties of an issue report, and they can be
extracted directly from an issue report. In total, we collect ten issue property metrics.
• Title length. The number of words in the title of an issue report. A longer title
can provide more useful information about the issue, helping the developer to
address the issue faster.

4.2. EXPERIMENTAL SETUP 53
• Description length. The number of words in the description of an issue report.
A longer description can provide more useful information about the issue, which
might make addressing the report easier.
• The number of CCs. The number of unique developers that are in the carbon-
copy (CC) list of the issue report. A higher number of developers in the CC
list might indicate a higher awareness of an issue report across the development
team.
• Is blocking. A boolean variable that indicates whether the report describes a
blocking issue, i.e., it must be addressed before the issues listed in the Blocks
field. A blocking issue might be more important to address because it is stopping
other issue reports from being addressed.
• Is regressive. A boolean variable that indicates whether the report describes a
regressive issue, i.e., the reported issue was fixed before but reoccurs in a newer
version. A regressive issue might be more important to address because it is
stopping other issue reports from being addressed.
• Is dependent. A boolean variable that indicates whether the report describes a
dependent issue, i.e., another issue report must be addressed before the reported
issue. A dependent issue report might be more difficult to address due to its
dependencies on other issue reports.
• Steps to reproduce. A boolean variable that indicates whether the issue report
contains steps to reproduce the issue. An issue report that contains steps to
reproduce the issue might be more likely to be addressed quickly. We decide
on the steps to reproduce metric by checking whether the description contains

4.2. EXPERIMENTAL SETUP 54
one of the following keywords: steps to reproduce, steps, reproducible and re-
produce [14, 72].
• The number of attachments. The number of attachments in the issue report.
Previous work [40, 72] shows that issue reports with attachments are addressed
faster.
• Readability. The Coleman-Liau index [57] (CLI ) of the description field. The
CLI approximates the grade level required to comprehend a text, ranging from
1 (easy) to 12 (hard). The CLI is calculated as follows:
CLI = 0.0588 ∗ L− 0.296 ∗ S − 15.8 (4.1)
where L is the average number of characters per 100 words and S is the average
number of sentences per 100 words.
• Is weekend. A boolean variable that indicates whether an issue report is opened
in the weekend. An issue report that is opened in the weekend might take a
longer time to be addressed since developers may wait until Monday to address
it.
Importance metrics
Importance metrics can be extracted directly from an issue report and describe how
important an issue report is. We select two importance metrics.
• Severity. A number describing the severity of an issue report, ranging from 1 to
5 (i.e., ‘enhancement’ to ‘blocking’) in Linux and from 1 to 7 (i.e., ‘enhancement’

4.2. EXPERIMENTAL SETUP 55
to ‘blocker’) in Firefox and Eclipse. An issue report that has a high severity
should be addressed faster.
• Priority. A number describing the priority of an issue report, ranging from
1 (low priority) to 5 (high priority). An issue report that has a high priority
should be addressed faster.
Developer’s experience metrics
Developer’s experience metrics describe the experience of the developer who opened
the issue report. We choose to use the following two metrics.
• Reputation of the reporter. A float number describing the issue reporter’s rep-
utation. Previous work [34, 40] shows that an issue report that is opened by
someone who has successfully had his reported issues addressed in the past (i.e.,
has a better reputation) is more likely to be addressed. We define the reputation
of a reporter as the proportion of issues previously reported by that reporter
that are fixed eventually [34, 40]:
reputation =|opened ∩ fixed||opened|+ 1
(4.2)
Note that 1 is added to the denominator in case a reporter did not previously
report any issues.
• The rate of Ti issues previously reported. A list of float numbers that indicate
the rate of each type Ti (see Table 3.1, i = {1, .., 10}) of rejected issue reports
which were previously reported by the reporter. If a reporter has a history of

4.3. EXPERIMENTAL RESULTS 56
having his reported issue rejected because of reason Ti, new issue reports may
be more likely to be rejected for the same reason. We calculate rateTireporter as
follows:
rateTireporter =|opened ∩ Ti||opened|+ 1
(4.3)
4.3 Experimental Results
In this section, we present the results of our experiments. For every research question,
we discuss the motivation, approach and results.
4.3.1 RQ4.1: How much effort is spent on rejecting issue reports?
Motivation. Table 4.1 shows that a large part of the resolved issue reports in the
studied ITSs are rejected (i.e., 63.65% in Linux, 80.48% in Firefox and 49.23% in
Eclipse). Typically, any effort that is spent on rejecting an issue report is a waste of
valuable resources of a developer. In this question, we aim to understand the impact
of rejected issue reports from the resource perspective.
Approach. It is difficult to accurately measure effort. Therefore, we use three
metrics (see Section 4.2.2) to approximate the risk of wasting effort on rejecting an
issue report.
To better understand the impact of the type of rejected issue report on the effort,
we extract the effort metrics for each individual resolution type of bug report. For each
effort metric, we conduct a Kruskal-Wallis [51] test to decide whether the distributions
are significantly different across the resolution types. The Kruskal-Wallis test is a
statistical test that can determine whether two or more distributions are significantly
different. When the p-value of the Kruskal-Wallis test is smaller than 0.05, at least

4.3. EXPERIMENTAL RESULTS 57
one of the distributions is significantly different from the other distributions. In that
case, we use the post-hoc Nemenyi test [61], which conducts a pairwise statistical
test on the distributions, to find which of the distributions are different. We use the
results of the Nemenyi test to create groups of distributions that are not significantly
different and we rank these groups using the highest mean of the distributions in that
group. We use the PMCMR package [67] in R to conduct the Kruskal-Wallis and
Nemenyi tests.
Results. Rejected issue reports remain unresolved in the ITS for a con-
siderable amount of days. The longer that the rejected issue reports stay on the
backlog of issue reports, the higher risk of wasting effort on them. Table 4.2 shows
the five number summary of the distribution of the three effort metrics of the rejected
issue reports in each studied ITS. We observe that the median number of days elapsed
between the first touch of an issue report and the rejection of the report range from
6.73 (Firefox) to 72.66 (Linux) in the three studied ITSs. There exists a large differ-
ence in the number of days before an issue report gets rejected between Linux and
the other two ITSs. One possible reason is that the issues reported in the Linux ITS
are related to kernel and driver problems, which require longer time to debug (e.g.,
a very specific hardware setup is needed to reproduce the issue) and make a decision
than the issues that are reported against Firefox and Eclipse.
WORKSFORME, WONTFIX, INCOMPLETE and EXPIRED issue reports take
the largest number of days to get rejected. Figure 4.2 shows the distribution of the
elapsed time metric for each type of rejected issue report. Figure 4.2 also shows the
ranks of the types, i.e., types of which the distribution is not significantly different
share the same rank. The display order of the types is based on the mean metric value.

4.3. EXPERIMENTAL RESULTS 58
Towards Reducing the E�ort Spent on Rejected Issue Reports 9
FIXED (T0) PATCH_ALREADY_AVAILABLE (T1) INVALID (T2) WONTFIX (T3)DUPLICATE (T4) WORKSFORME (T5) DOCUMENTED (T6) INCOMPLETE (T7)MOVED (T8) EXPIRED (T9) NOT_ECLIPSE (T10)
●●●●●●●●●●●●●●●●●●●●●●●●●●●●●●●●●●●●●●●●●●●●●●●●●●●●●●●●●●●●●●●●●●●●●●●●●●●●●●●●●●●●●●●●●●●●●●●●●●●●●●●●●●●●●●●●●●●●●●●●●●●●●●●●●●●●●●●●●●●●●●●●●●●●●●●●●●●●●
●
●●●●●●●●●
●
●
●●●●●●
●
●●
●
●●●●●●●●●●●●●●●●●●
●
●●●
●
●●●●●●●●●●●●●●●●●●●●●●●●●●●●●●●●●●●●●●●●
●
●
●●●●●●●●●●●●●●●●●●●●●●
●
●
●●●
●
●
●
●
●●●●●
●
●●●●●
●
●
●
●●
●
●
●●●●●●●●
●
●
●
●●●
●
●●
●
●
●
●
●●
●
●
●
●●●●
●●
●
●
●
●
●●●
●
●
●
●
●
●
●●●●●●●
●
●●
●
●
●
●
●
●
●●
●
●
●
●
●
●
●
●
●
●
●
●
●
●●
●
●
●
●
●●
●
●●●
●
●
●
●
●
●●
●
●
●
●●●
●
●
●
●●●
●
●
●
●
●
●
●
●
●
●
●●
●
●●●
●
●●●
●
●
●
●
●●
●
●●●●●●●
●
●
●
●
●
●●●●●●
●
●●
●●
●
●
●
●
●
●
●●●●●●●●
●
●●
●
●●●●
●
●
●
●
●●●
●
●●●●●●●
●
●
●
●●●●●
●
●●●●●●●●●●●●●●●●●●●●●●●●●●●●●
●
●●●●
●
●●●●●●●●●●●●●●
●
●●●●●●●
●
●●●●
1 2 3 4 4 5 6 6 6
Ela
psed
tim
e (d
ays)
T9 T7 T5 T3 T6 T1 T2 T8 T4 T0
1
10
100
1000
(a) Linux
●●●●●●●●●●●●●●●●●●●●●●●●●●●●●●●●●●●●●●●●●●●●●●●●●●●●●●●●●●●●●●●●●●●●●●●●●●●●●●●●●●●●●●●●●●●●●●●●●●●●●●●●●●●●●●●●●●●●●●●●●●●●●●●●●●●●●●●●●●●●●●●●●●●●●●●●●●●●●●●●●●●●●●●●●●●●●●●●●●●●●●●●●●●●●●●●●●●●●●●●●●●●●●●●●●●●●●●●●●●●●●●●●●●●●●●●●●●●●●●●●●●●●●●●●●●●●●●●●●●●●●●●●●●●●●●●●●●●●●●●●●●●●●●●●●●●●●●●●●●●●●●●●●●●●●●●●●●●●●●●●●●●●●●●●●●●●●●●●●●●●●●●●●●●●●●●●●●●●●●●●●●●●●●●●●●●●●●●●●●●●●●●●●●●●●●●●●●●●●●●●●●●●●●●●●●●●●●●●●●●●●●●●●●●●●●●●●●●●●●●●●●●●●●●●●●●●●●●●●●●●●●●●●●●●●●●●●●●●●●●●●●●●●●●●●●●●●●●●●●●●●●●●●●●●●●●●●●●●●●●●●●●●●●●●●●●●●●●●●●●●●●●●●●●●●●●●●●●●●●●●●●●●●●●●●●●●●●●●●●●●●●●●●●●●●●●●●●●●●●●●●●●●●●●●●●●●●●●●●●●●●●●●●●●●●●●●●●●●●●●●●●●●●●●●●●●●●●●●●●●●●●●●●●●●●●●●●●●●●●●●●●●●●●●●●●●●●●●●●●●●●●●●●●●●●●●●●●●●●●●
●
●
●
●
●
●
●
●
●
●●
●
●
●
●
●
●
●
●
●●●●●●
●
●
●
●
●
●
●
●
●
●
●
●
●
●●
●
●
●●
●
●
●
●
●
●
●●
●●
●
●
●
●
●
●
●
●
●
●
●
●
●
●
●
●
●
●
●
●
●
●
●
●
●
●
●
●
●
●
●
●
●
●
●
●
●
●●
●
●
●
●
●
●
●
●
●
●
●
●●
●
●
●
●
●
●
●
●
●●
●
●
●
●
●
●
●
●
●
●
●●●
●
●●
●
●
●
●
●
●
●
●
●
●
●●●
●
●
●
●
●
●
●
●
●
●
●
●
●●
●
●
●
●
●
●
●
●
●
●
●
●
●
●
●
●●
●
●
●
●
●
●
●
●
●
●●●
●
●
●
●
●
●
●
●
●
●
●
●
●
●
●
●
●
●
●
●
●
●
●
●
●
●
●
●
●
●
●
●●
●
●●
●
●
●
●
●
●
●
●
●
●●
●
●
●
●
●
●
●
●
●
●
●
●
●●
●●
●
●
●●
●
●
●
●
●
●
●
●●
●
●
●
●
●
●●
●
●
●●
●
●
●
●
●
●
●●
●
●
●
●
●●
●
●
●●
●
●●
●
●●
●
●
●
●
●
●
●
●
●
●
●
●
●●
●
●
●
●
●
●
●
●
●
●
●
●
●
●
●
●●
●
●
●
●
●
●
●
●
●●
●
●
●
●
●
●
●
●
●
●
●
●●
●
●
●
●●
●
●
●
●
●
●
●
●●
●
●
●
●
●
●●●●●
●●
●
●
●
●
●●
●
●
●
●
●
●
●
●●
●
●
●
●
●
●●
●
●
●●●●●
●
●
●
●
●
●
●
●
●
●
●
●●●●
●
●
●
●
●
●
●
●
●●
●
●
●
●
●
●
●
●
●
●
●●
●
●
●
●
●●●
●
●
●
●
●
●●
●
●
●●●
●
●
●
●●
●
●
●
●
●
●
●
●●
●
●
●
●
●●
●
●
●
●
●
●
●
●
●
●
●●
●
●
●
●●
●●
●
●
●
●
●
●
●
●
●●
●●●
●
●●
●
●
●
●
●
●
●
●●
●
●
●
●
●
●
●
●
●
●
●
●
●
●
●
●
●
●
●
●
●
●
●●
●
●
●
●
●
●
●
●
●
●
●
●
●
●
●
●
●
●
●
●●
●
●●
●
●
●
●
●
●
●
●
●
●
●
●●
●
●
●
●
●
●
●
●
●
●●
●●
●●●
●
●●
●
●
●
●
●
●
●
●
●
●●
●
●
●
●
●
●
●
●
●●
●
●●
●●
●
●●
●
●
●
●
●
●
●
●
●
●
●●
●
●
●●
●
●●
●
●
●
●
●
●
●
●
●●●●●●●●●●●
●
●
●●
●
●
●
●
●
●
●
●
●
●
●
●
●
●
●
●
●
●●
●
●
●
●
●
●●●
●
●
●
●
●
●●●●
●
●
●
●
●
●
●
●
●
●
●
●
●●
●
●
●
●
●
●
●
●
●
●
●●
●
●
●●
●
●
●
●●●
●
●
●
●
●●●●
●
●
●
●
●
●
●●
●
●
●●
●
●●
●
●●
●●
●
●
●
●
●
●
●●●●
●
●
●
●●●
●
●
●
●●●
●
●
●
●
●
●
●●●●●
●
●
●
●
●
●
●
●
●●
●
●
●●
●
●●
●●
●
●●
●●
●●●●
●
●
●
●
●
●
●
●
●
●●●●●●
●
●
●
●●●●
●●●●●
●
●●
●
●●●●
●●●
●
●●
●
●
●
●●●●●●
●
●●●●●●●●
●
●●
●
●●
●●●
●
●
●●●●●
●●●●●
●
●
●●
●
●
●
●
●●●
●
●
●
●
●
●
●
●
●
●
●
●
●
●
●
●
●
●
●
●
●
●
●
●
●
●
●
●
●
●
●
●
●
●
●
●
●
●
●
●
●
●
●
●
●
●
●
●
●
●
●
●
●
●
●
●
●
●
●
●●
●
●
●
●
●
●
●
●
●
●
●
●●●
●
●
●
●●
●●
●
●
●
●
●
●
●
●
●
●
●
●
●
●
●
●
●
●
●
●
●
●
●
●
●
●
●
●
●
●
●
●
●
●
●●
●
●
●
●
●
●
●
●
●
●
●
●
●
●
●
●
●
●
●
●
●●
●
●
●
●
●
●
●
●
●
●
●
●
●
●
●
●
●
●
●
●
●
●
●
●
●
●
●
●
●
●
●
●
●
●
●
●
●
●
●
●
●
●
●
●
●●
●
●
●
●
●
●
●
●
●
●
●
●
●
●
●
●
●
●
●
●
●
●
●
●
●
●
●
●
●
●
●
●
●
●
●
●
●
●
●
●
●
●
●
●
●
●
●
●
●
●
●
●
●
●
●
●
●
●
●
●
●
●
●
●
●
●
●
●
●
●
●
●
●
●
●
●
●
●
●
●
●
●●
●
●
●
●
●
●
●
●
●
●
●
●
●
●
●
●
●
●
●
●
●
●
●
●
●
●
●
●
●
●
●●
●
●
●
●
●
●
●
●
●
●
●
●
●
●
●
●
●
●
●
●
●
●
●
●●
●
●
●
●
●
●
●
●
●
●
●
●
●
●
●
●
●
●
●
●
●
●
●
●
●
●
●
●
●●
●
●
●
●
●
●
●
●
●
●
●
●
●
●
●
●
●
●
●
●
●
●
●
●
●●
●
●
●
●
●
●
●
●
●
●
●
●
●
●
●
●
●
●
●
●
●
●
●●
●
●
●
●
●
●
●
●
●
●
●
●
●
●
●
●
●
●
●
●
●
●
●
●
●
●
●
●
●
●
●
●
●
●●
●
●
●
●●
●
●
●
●
●
●
●
●
●
●
●
●
●
●●
●
●
●●
●
●
●
●
●
●
●
●
●
●
●
●
●
●
●
●
●
●
●
●
●
●
●
●
●
●
●
●
●
●
●
●
●
●
●
●
●
●
●
●
●
●
●
●
●
●
●
●
●
●
●
●
●
●
●
●
●
●
●
●
●
●
●
●
●
●
●
●
●
●
●
●
●
●●
●
●
●
●
●
●
●
●
●
●
●
●
●
●
●
●
●
●
●
●
●
●
●
●
●
●
●
●
●
●
●
●
●
●
●
●
●
●
●
●
●
●
●
●
●
●
●
●
●
●
●
●
●●
●
●
●
●
●
●
●
●
●
●
●
●
●●
●
●
●
●
●
●
●
●
●
●
●
●
●
●
●
●
●
●
●
●
●
●
●
●
●
●
●
●
●
●
●
●
●
●
●
●
●
●
●
●
●
●
●
●
●
●
●
●
●
●
●
●
●●
●
●
●
●
●
●
●
●
●
●
●
●●
●
●
●
●
●
●
●
●
●
●
●
●
●
●
●
●
●
●
●
●
●
●
●
●
●
●
●
●
●
●
●
●
●
●
●
●
●
●
●
●
●
●
●
●
●
●
●
●
●
●
●
●
●●
●
●
●
●
●
●
●
●
●
●
●
●
●
●
●
●
●
●
●
●
●
●
●
●
●
●
●
●
●
●
●
●
●
●
●
●
●
●
●
●
●
●
●
●
●
●
●
●
●
●
●●
●
●
●
●
●
●
●
●
●
●
●
●
●
●
●
●
●
●
●
●
●
●
●
●
●
●
●
●
●
●
●
●
●
●
●
●
●
●
●
●
●
●
●
●
●
●
●
●
●
●
●
●
●
●
●
●
●
●
●
●
●
●
●
●
●
●
●
●
●
●
●
●
●
●
●
●
●
●
●
●
●
●
●
●
●
●
●
●
●
●
●
●
●
●
●
●
●
●
●
●
●
●
●
●
●
●
●
●
●
●
●
●
●
●
●
●
●
●
●●
●
●
●
●
●
●
●●●
●
●
●
●
●
●
●
●
●
●
●
●
●
●
●
●
●
●
●
●
●
●
●
●
●
●
●
●
●
●
●
●
●●
●
●
●
●
●
●
●
●
●
●
●
●
●
●
●
●
●
●
●
●
●
●●●
●
●
●
●
●
●
●
●
●
●
●
●
●
●
●●
●
●
●
●
●
●
●
●●
●
●
●●
●
●
●
●
●
●
●
●
●
●
●
●
●
●
●
●
●
●●
●
●
●
●
●
●●●●●
●
●
●
●
●
●
●
●
●
●
●
●
●
●
●
●
●
●
●
●
●
●
●
●
●●
●
●
●
●
●
●
●
●
●●
●
●
●
●
●
●
●
●
●
●
●
●
●
●
●
●
●
●
●
●
●
●
●
●
●
●
●
●
●
●
●
●
●
●
●
●
●●
●
●
●
●
●
●
●
●
●
●
●
●●
●
●
●
●
●
●
●
●
●
●
●
●
●●
●
●
●
●
●
●
●
●
●
●
●
●
●
●
●
●
●
●
●
●
●
●
●
●
●
●●
●
●
●
●
●
●
●
●
●
●
●
●
●
●
●
●
●
●
●
●
●
●
●
●●
●
●
●
●
●
●
●
●
●
●
●
●
●
●
●
●
●
●
●
●
●
●
●
●
●
●
●
●
●
●
●
●
●
●
●
●
●
●
●
●
●
●
●
●
●
●
●
●
●
●
●
●
●
●
●
●
●
●
●
●
●
●
●
●
●
●
●
●
●
●
●
●
●
●
●
●
●
●●
●
●
●
●
●●
●
●
●
●
●
●
●●
●
●
●
●
●●
●
●
●
●
●
●
●
●
●
●
●
●
●
●
●
●
●
●
●
●
●
●
●
●
●
●
●
●
●
●
●
●
●
●
●
●
●
●
●
●
●
●
●
●●●
●
●
●
●
●
●
●●
●
●●
●
●
●
●
●
●
●
●
●
●●
●
●
●
●
●
●
●
●
●
●
●
●
●
●
●
●
●
●
●
●
●
●
●
●
●
●
●
●
●
●
●
●
●
●
●
●
●
●●
●
●
●
●
●
●
●
●
●
●
●
●
●
●
●
●
●
●
●
●
●
●
●
●
●
●
●
●
●
●
●●
●
●
●●
●
●
●
●
●
●
●
●
●
●
●
●
●
●
●
●
●
●
●
●
●
●
●
●
●
●
●
●
●
●
●
●
●
●
●
●
●
●
●
●
●
●
●
●
●
●
●
●
●
●●
●●●
●
●
●
●
●
●
●
●
●
●
●
●
●
●
●
●●
●
●
●
●
●
●
●
●
●
●
●
●
●
●
●
●
●
●
●
●
●
●
●
●
●
●
●
●●
●
●
●
●
●
●●
●
●
●
●
●
●
●
●
●
●
●
●
●
●
●
●
●
●
●●
●
●
●
●
●
●
●
●
●
●●
●
●
●
●
●
●
●
●
●
●●
●
●
●
●
●
●
●
●
●
●
●
●
●●
●
●
●
●
●
●
●
●
●
●
●
●
●
●
●
●
●
●
●
●●
●
●●
●
●
●
●
●
●
●
●
●
●
●
●
●●
●
●
●
●
●
●
●
●
●
●
●
●
●
●
●
●
●
●
●
●
●
●●
●
●
●
●
●
●
●
●
●
●
●
●
●
●
●
●
●
●
●
●
●
●
●
●
●
●
●
●
●
●
●
●
●
●
●●
●
●
●
●
●
●
●
●
●
●
●
●
●
●
●
●
●
●
●
●
●
●
●
●
●
●
●
●
●
●
●
●
●
●
●
●
●●
●
●
●
●
●
●
●
●
●
●
●
●
●
●
●
●
●
●●●
●
●
●
●
●
●
●
●
●
●
●
●
●
●
●
●
●
●
●
●
●
●
●
●
●
●
●
●
●
●
●
●
●
●
●
●
●
●
●
●
●
●
●
●
●
●
●
●
●
●
●
●
●
●
●
●
●
●
●
●●
●
●
●
●
●
●
●
●
●
●
●
●
●
●
●
●
●
●
●
●
●
●●
●
●
●
●
●
●
●
●●
●
●
●
●
●
●
●
●
●
●
●
●
●
●
●
●
●
●
●
●
●
●
●
●
●
●●
●
●
●
●
●
●
●
●
●
●
●
●
●
●
●
●
●
●
●
●
●
●
●
●
●
●
●
●
●
●●
●
●
●
●
●
●
●
●
●
●
●
●
●
●
●
●
●
●
●
●
●
●
●
●
●
●
●
●
●
●
●
●
●
●
●
●
●
●
●
●
●
●
●
●
●
●
●
●
●
●
●
●
●
●
●
●
●
●
●
●
●
●
●
●
●
●
●
●
●
●
●
●
●
●●
●
●
●
●
●
●
●
●
●
●●
●
●
●
●
●
●
●
●
●
●
●
●
●
●
●
●
●
●
●
●
●
●
●
●
●
●
●
●
●
●
●
●
●
●
●
●
●
●
●
●
●
●
●
●●
●
●
●
●
●
●
●
●
●
●
●
●
●
●
●
●
●
●
●
●
●
●
●
●
●
●
●
●
●
●
●
●
●
●
●
●
●
●
●
●
●
●
●
●
●
●
●
●
●
●
●
●
●
●
●
●
●
●
●
●
●
●
●
●
●
●
●
●
●
●
●
●
●
●
●
●
●
●
●
●
●
●
●
●
●
●
●
●
●
●
●
●
●
●
●
●
●
●
●
●
●
●
●
●
●
●
●
●
●
●
●
●
●
●
●
●
●
●
●
●
●
●
●
●
●
●
●
●
●
●
●●
●
●
●
●
●
●
●
●●
●●
●
●
●
●
●
●
●
●
●
●
●
●
●
●●
●
●
●
●
●
●
●
●
●
●
●
●
●
●
●
●
●
●
●
●
●
●
●
●
●
●
●
●
●
●
●
●
●●
●
●
●
●
●
●
●
●
●
●
●
●
●
●
●
●●
●
●
●
●
●
●
●
●●
●
●
●
●
●
●
●
●
●
●
●
●
●
●
●
●
●
●
●
●●
●
●
●
●
●
●
●
●
●
●
●
●
●
●●
●
●
●
●
●
●
●
●
●
●
●
●
●
●
●
●
●
●
●
●
●
●
●
●
●
●
●
●
●
●
●
●
●
●
●
●
●
●
●
●
●
●
●
●
●
●
●
●
●
●
●
●
●
●
●
●●
●
●
●
●●
●
●
●
●
●
●
●
●
●
●
●
●
●
●
●
●
●
●
●
●
●
●
●
●
●●
●
●
●
●
●
●
●
●
●
●
●
●
●●
●
●
●
●
●
●
●
●
●
●
●
●
●
●
●
●
●●
●
●
●
●
●
●
●
●
●
●
●
●
●
●
●
●●
●
●
●
●
●
●
●
●
●
●
●
●
●
●
●
●
●
●
●
●
●
●
●
●
●
●
●
●
●
●
●
●
●
●
●
●
●
●
●
●
●●
●
●
●
●
●
●
●●
●
●●
●
●
●
●
●
●
●
●
●
●
●
●
●
●
●
●
●
●
●
●●
●
●
●
●
●
●
●●
●
●
●
●
●
●
●
●
●●
●
●
●
●
●
●
●
●
●
●
●
●
●
●
●
●
●
●
●
●●
●
●
●
●
●
●
●
●
●
●
●
●
●
●
●
●
●
●
●
●
●
●
●
●
●●
●
●
●
●
●
●
●
●
●
●
●
●
●
●●
●
●
●
●
●
●
●
●
●
●
●
●
●
●
●
●
●
●
●●
●
●
●●
●
●
●
●
●
●
●
●
●
●
●
●
●
●
●
●
●
●
●
●
●
●
●●
●
●
●
●
●
●
●
●●
●
●
●
●
●
●
●
●
●
●
●
●
●
●
●
●
●
●
●
●
●
●
●●
●
●
●
●
●
●
●
●
●
●●
●
●
●
●
●
●
●●
●
●
●
●
●
●
●
●
●
●
●
●
●
●
●
●
●
●
●
●
●
●
●
●
●
●
●
●
●
●
●
●●
●●
●
●●
●
●
●
●
●
●
●
●
●
●
●
●
●
●
●
●
●
●
●
●
●
●
●
●
●
●
●
●
●
●
●
●
●
●
●
●
●
●
●
●
●
●
●
●
●
●
●
●●●
●
●
●
●
●
●
●
●
●
●
●
●
●
●
●
●
●
●
●
●
●
●
●
●
●
●
●
●
●
●
●
●
●
●
●
●
●
●
●
●
●
●
●
●●
●
●
●
●
●
●
●
●
●
●
●
●
●
●
●
●
●
●
●
●
●
●
●
●
●
●
●
●●
●
●
●
●
●
●
●
●
●
●
●
●
●
●
●
●
●
●
●
●●
●
●
●
●
●
●
●
●
●
●
●
●●
●
●
●
●
●
●
●
●
●
●
●
●
●●
●
●
●
●
●
●
●
●
●
●
●●
●
●
●
●
●
●
●
●
●
●
●
●
●
●
●
●
●
●
●
●
●
●●
●
●
●
●
●
●
●
●
●
●
●
●
●
●
●
●
●●
●
●
●
●
●
●
●
●
●
●
●
●
●
●
●
●●
●
●
●
●
●
●
●
●
●
●
●
●
●
●
●
●
●
●
●
●
●
●
●
●
●
●
●
●
●
●
●
●
●
●
●
●
●
●
●
●●
●●
●
●
●
●
●
●
●
●
●
●●
●
●
●
●
●
●
●
●
●
●
●
●
●
●
●
●
●
●
●
●
●
●
●
●
●
●
●
●
●
●
●
●
●
●
●
●
●
●
●
●
●
●
●
●
●
●
●
●
●
●
●
●
●
●
●
●
●
●
●
●
●
●
●
●
●
●
●
●
●
●
●
●
●●
●
●
●
●
●●
●
●
●
●●
●
●
●
●
●
●
●
●
●
●
●
●
●
●
●
●
●
●
●
●
●
●
●
●
●
●
●
●
●
●
●
●
●
●
●
●
●
●
●
●
●
●
●
●
●
●
●
●
●
●
●
●
●
●
●
●
●
●
●
●
●
●
●
●
●
●
●
●
●
●
●
●
●
●
●
●
●
●
●
●
●
●
●
●
●
●
●
●
●
●
●
●
●
●
●
●
●
●
●
●
●
●
●
●
●
●
●
●
●
●
●
●
●
●
●
●
●
●
●
●
●
●
●
●
●
●
●
●
●
●
●
●
●●
●
●
●
●
●
●
●
●
●
●
●
●
●●
●
●
●
●
●
●
●
●
●
●●
●
●
●
●
●
●
●
●
●
●
●
●
●
●
●
●
●
●
●
●
●
●
●
●
●
●
●
●
●
●
●
●
●
●●
●
●
●
●
●
●
●
●
●
●
●
●
●
●
●
●●
●
●
●
●
●
●
●
●
●
●
●
●
●●
●
●
●
●
●
●
●
●
●
●
●
●
●
●
●
●
●
●
●
●●
●
●
●
●
●
●
●
●
●
●
●
●●
●
●
●
●
●
●
●
●
●
●
●
●
●
●
●
●
●
●
●
●
●
●●
●
●
●
●
●
●
●
●
●
●
●
●
●
●
●
●
●
●
●
●
●
●
●
●
●
●
●
●
●
●
●
●
●
●
●
●
●
●
●
●
●
●
●
●
●
●
●
●
●
●
●
●
●
●●
●
●
●
●
●
●
●
●
●
●
●
●
●
●
●
●
●
●
●
●
●
●
●
●
●
●
●
●
●
●
●
●
●
●
●
●
●
●
●
●
●
●
●
●
●
●
●
●●
●
●
●
●
●
●
●
●
●
●
●
●
●
●
●
●
●
●
●
●●●
●
●
●
●
●
●
●
●
●
●●
●
●
●
●
●
●
●
●●
●
●
●
●
●
●
●
●
●
●
●
●
●
●
●
●
●
●
●●
●
●
●
●
●
●
●
●●
●
●
●
●
●
●
●
●
●
●
●
●
●
●●
●
●
●
●
●
●
●●
●
●
●
●
●●
●
●
●
●
●
●
●
●
●
●
●
●
●
●
●
●
●
●
●
●
●
●
●
●
●
●
●
●●
●
●
●
●●
●
●
●
●
●
●
●
●
●
●
●
●
●
●
●
●
●
●
●
●
●
●
●
●
●
●
●
●
●
●
●
●
●
●
●
●
●
●
●
●
●
●
●
●
●●
●
●
●
●
●
●
●
●
●
●●
●
●
●
●
●
●
●
●
●
●
●
●
●●
●
●
●
●
●
●
●
●
●
●●
●
●
●
●
●
●
●
●
●
●
●
●
●
●
●
●
●
●
●
●
●
●
●
●
●
●
●
●
●
●
●
●
●
●
●
●
●
●
●
●
●
●
●
●
●
●
●
●
●
●
●
●
●●
●
●
●
●
●
●
●
●
●
●
●
●●
●
●
●
●
●
●
●
●
●
●●
●
●
●●
●
●
●
●
●
●
●
●
●
●
●
●
●
●
●
●
●
●
●
●
●●
●
●
●
●
●
●
●
●
●
●
●
●
●
●
●
●
●
●
●
●
●
●
●
●
●
●
●
●
●
●
●
●
●
●
●
●
●
●
●
●
●
●
●
●
●
●
●
●
●
●●
●
●
●
●●
●
●
●
●
●
●
●
●
●
●
●
●
●
●
●
●
●
●
●
●
●
●
●
●
●
●●●
●
●
●
●
●
●
●
●●
●●
●
●
●
●
●
●
●
●
●
●
●
●
●
●
●
●
●
●
●
●
●
●
●
●
●
●
●
●
●
●
●
●
●
●
●
●
●
●
●
●
●
●
●
●
●
●
●
●
●
●
●
●
●
●
●
●●
●
●
●
●
●
●
●
●
●
●
●
●
●
●
●
●
●
●●
●
●
●
●
●
●
●
●
●
●
●
●
●
●
●
●
●
●
●
●
●
●
●
●
●
●
●
●
●
●
●●
●
●●
●
●
●
●
●
●●
●
●
●
●
●
●
●●
●
●
●
●
●
●
●
●
●
●
●
●
●
●
●
●
●
●●
●
●
●
●
●
●
●●
●
●
●
●
●
●
●
●
●
●
●
●
●
●
●
●
●
●
●
●
●
●
●●
●
●
●
●●
●
●
●
●
●
●
●
●
●
●
●
●
●
●
●
●●
●
●
●
●
●
●
●
●
●
●
●
●
●
●
●
●
●
●
●
●
●
●
●
●
●
●●
●
●
●●
●
●
●
●
●
●
●●
●
●
●
●
●
●
●
●
●
●
●
●
●
●
●
●
●
●
●
●
●
●●
●
●
●
●
●
●
●
●
●
●
●
●
●
●
●
●
●
●
●
●
●
●
●
●
●
●
●
●
●
●
●
●
●
●
●
●
●
●
●
●
●
●●
●
●
●
●
●
●
●
●
●
●
●
●
●
●
●
●
●
●
●●
●
●
●
●
●
●
●
●
●
●
●
●
●
●
●
●
●
●
●
●
●
●
●
●
●●
●
●●
●
●
●
●
●
●
●
●
●
●
●
●
●
●
●
●
●
●
●
●
●
●●
●
●
●
●
●
●
●
●
●
●●
●●
●
●
●
●
●
●
●
●
●
●
●●
●
●
●
●
●
●
●
●
●
●
●
●
●
●
●
●●
●
●
●
●
●
●
●
●
●
●
●
●
●
●
●●
●
●
●
●
●
●
●
●●
●
●
●
●
●
●
●
●
●
●
●
●
●
●
●
●
●
●
●
●
●
●●
●
●
●
●
●
●
●
●
●
●
●
●
●
●
●
●
●
●
●
●
●
●
●
●
●
●
●
●
●
●
●
●
●
●
●
●
●
●●
●
●
●
●
●
●
●
●
●
●
●
●
●
●
●
●
●
●
●
●
●
●
●●
●
●
●
●
●
●
●
●
●
●
●
●
●
●
●
●
●
●
●
●
●
●
●
●
●
●
●
●
●
●
●
●
●
●
●
●
●
●
●
●
●
●●
●
●
●
●
●
●
●
●
●
●
●
●
●
●
●
●
●
●
●
●●
●
●
●
●
●
●
●
●
●
●
●
●
●
●
●
●
●
●
●
●
●
●
●
●
●
●
●
●
●
●
●
●
●
●
●
●
●
●
●
●
●
●
●
●
●●
●
●
●
●
●
●
●
●
●
●
●
●
●
●
●●
●
●
●
●
●
●
●
●
●●
●
●
●
●
●
●
●
●
●
●
●
●
●
●
●
●
●
●
●
●
●
●
●
●
●
●
●
●
●
●
●
●
●
●
●
●
●
●
●
●
●
●
●
●
●
●
●
●
●
●
●
●
●
●
●
●
●
●
●
●
●
●●
●
●
●
●
●
●
●
●
●
●
●
●
●
●
●
●●
●●
●
●●
●
●
●
●
●
●●
●
●
●
●
●
●
●
●
●
●
●
●
●
●
●
●
●
●
●
●
●
●
●
●
●
●
●
●●
●
●●
●
●
●
●
●
●
●
●
●
●
●
●
●●
●
●
●
●
●
●
●
●●
●
●
●
●
●
●
●
●
●
●
●●
●
●
●
●
●
●
●
●
●
●
●
●
●
●
●
●
●
●
●
●
●
●
●●
●
●
●
●
●
●
●
●
●
●
●
●
●
●
●
●
●
●●
●
●
●
●
●
●
●
●
●
●
●
●
●
●
●
●
●
●
●
●
●
●
●
●
●
●
●
●
●
●
●
●
●
●
●
●
●
●
●
●●
●
●
●
●
●
●
●
●
●
●
●●
●
●
●
●
●
●
●
●
●
●
●
●
●
●
●
●
●
●●
●
●
●
●
●
●
●
●
●
●
●●
●
●
●
●
●
●
●●
●
●
●
●
●
●
●
●
●
●
●
●
●
●
●
●
●
●
●
●
●
●
●
●
●
●
●
●
●
●
●
●
●
●
●
●
●
●
●
●
●
●
●
●
●
●
●
●
●
●
●
●
●
●
●
●
●
●
●
●
●
●
●
●
●
●
●●
●
●
●
●
●
●
●
●
●
●
●
●
●
●
●
●
●
●
●
●●
●
●
●●
●
●
●
●
●
●
●
●
●
●
●
●
●
●
●
●
●
●
●
●
●
●
●
●
●
●
●
●
●
●
●
●
●
●
●
●
●
●
●
●
●
●●
●
●
●
●
●
●
●
●
●
●●
●●
●
●
●
●
●●
●●
●
●
●
●
●
●
●●
●
●●
●
●
●
●●●
●
●
●
●
●
●
●
●
●
●
●
●
●
●
●●
●
●
●
●
●
●
●
●
●
●
●
●
●
●
●●
●
●●●
●
●●●●
●●
●
●
●
●
●
●
●
●
●
●
●
●
●
●
●
●●
●
●
●
●
●●
●
●
●
●
●
●
●
●
●
●
●
●
●
●
●
●
●
●
●
●
●
●
●
●●
●
●
●●
●
●●
●
●●
●●●
●●
1 1 2 3 4 5
T3 T5 T7 T9 T2 T4 T0
Ela
psed
tim
e (d
ays)
1
10
100
1000
(b) Firefox
1 2 3 4 5
T3 T5 T2 T10 T4 T8 T0
Ela
psed
tim
e (d
ays)
1
10
100
1000
(c) Eclipse
Fig. 3: The distribution of the elapsed time metric for all types of resolved issuereports in the studied ITSs. The x-axis shows the ranks that are the result of theKruskal-Wallis and post-hoc Nemenyi test. The ranks are ordered by the highest meanof the distributions in the rank. The y-axis shows the e�ort metric values (note that they-axis is in logarithmic scale). The MOVED reports are not included in the rankingfor Eclipse because there were only 5 reports with that status.
exists a clear di�erence between the elapsed time metric for the di�erent types, withWORKSFORME, WONTFIX, INCOMPLETE and EXPIRED taking the longest toreject in Linux and Firefox.
DUPLICATE issue reports are the fastest to reject in the three studied ITSs. Theshort rejection time for DUPLICATE issue reports might be a direct consequence ofthe advanced methods for detecting duplicate issue reports (Aggarwal et al., 2015;Alipour et al., 2013; Jalbert and Weimer, 2008; Kaushik and Tahvildari, 2012; Lazaret al., 2014; Nguyen et al., 2012; Runeson et al., 2007; Sun et al., 2011; Sureka andJalote, 2010; Wang et al., 2008) that exist. These methods allow fast detection ofduplicate issue reports, often at the triaging time.
The median number of developers that is needed to determine whether anissue should be rejected is 2. Table 3 shows that in all ITSs, more than half of therejected issue reports involve two or more developers. In extreme cases, the number ofdevelopers goes up to 41 (Linux), 58 (Eclipse) or even 217 (Firefox). The Firefox issuereport in which 217 developers are involved describes a bug in the pop-up blockerof the Firefox browser. The majority of developers involved in resolving this issuereport post examples of websites that “exploit” the bug, as requested by the reporter.At the end of the discussion, the issue report is considered as INVALID without aclear reason: “This bug is no longer useful to me or to anyone working on our pop-upblocker (that I know of).”. This issue report is a clear example showing how the e�ortof developers is wasted: the reported issue was rejected after having 217 developersinvolved.
The median number of comments needed to reject an issue report is 2 or 3.Table 3 shows that in Firefox and Eclipse, the median number of comments made in the
Figure 4.2: The distribution of the elapsed time metric for all types of resolved issuereports in the studied ITSs.
The x-axis shows the ranks that are the result of the Kruskal-Wallis and post-hoc Nemenyitest. The ranks are ordered by the highest mean of the distributions in the rank. The y-axisshows the effort metric values (note that the y-axis is in logarithmic scale). The MOVEDreports are not included in the ranking for Eclipse because there were only 5 reports withthat status.
The elapsed time for FIXED issue reports is showed on the right for reference. There
exists a clear difference between the elapsed time metric for the different types, with
WORKSFORME, WONTFIX, INCOMPLETE and EXPIRED taking the longest to
reject in Linux and Firefox.
DUPLICATE issue reports are the fastest to reject in the three studied ITSs. The
short rejection time for DUPLICATE issue reports might be a direct consequence of
the advanced methods for detecting duplicate issue reports [75, 89, 82, 42, 47, 80, 3,
1, 53, 63] that exist. These methods allow fast detection of duplicate issue reports,
often at the triaging time.
The median number of developers that is needed to determine whether
an issue should be rejected is 2. Table 4.2 shows that in all ITSs, more than half

4.3. EXPERIMENTAL RESULTS 59
Table 4.2: Summary of the effort metrics of the rejected issue reports in the studiedITSs.
ITS Effort metric Minmum 1st Quantile Median 3rd Quantile Maximum
LinuxTime (days) 0.00 1.17 72.66 473.90 4059.00# of developers 0.00 1.00 2.00 3.00 41.00# of comments 0.00 1.00 3.00 8.00 203.00
FirefoxTime (days) 0.00 0.01 6.73 249.60 5315.00# of developers 0.00 1.00 2.00 3.00 217.00# of comments 0.00 1.00 2.00 4.00 595.00
EclipseTime (days) 0.00 0.04 7.18 232.00 4649.00# of developers 0.00 1.00 2.00 3.00 58.00# of comments 0.00 1.00 2.00 4.00 213.00
of the rejected issue reports involve two or more developers. In extreme cases, the
number of developers goes up to 41 (Linux), 58 (Eclipse) or even 217 (Firefox). The
Firefox issue report in which 217 developers are involved describes a bug in the pop-
up blocker of the Firefox browser. The majority of developers involved in resolving
this issue report post examples of websites that “exploit” the bug, as requested by
the reporter. At the end of the discussion, the issue report is considered as INVALID
without a clear reason: “This bug is no longer useful to me or to anyone working on
our pop-up blocker (that I know of).” This issue report is a clear example showing
how the effort of developers is wasted: the reported issue was rejected after having
217 developers involved.
The median number of comments needed to reject an issue report is 2
or 3. Table 4.2 shows that in Firefox and Eclipse, the median number of comments
made in the discussion regarding a rejected issue report is 2, while in Linux it is 3.
In exceptional cases, the number of comments made goes into the hundreds (203 in
Linux, 595 in Firefox and 213 in Eclipse).
The number of developers and comments needed to reject issue reports does not
differ considerably per type. While there are some variations, there are no large
4.3. EXPERIMENTAL RESULTS 60
differences between different types of issue reports for the number of developers and
the number of comments metrics. Hence, we do not display the distributions per type
of these metrics.�
�
�
Rejected issue reports threat the efficiency of a development team. Valu-
able resources are at a risk of being wasted to investigate the issue re-
ports that are eventually rejected.
4.3.2 RQ4.2: Is it feasible to predict whether an issue report will be
rejected?
Motivation. In the previous section, we confirmed that rejected issue reports have
a considerable impact on the development team in terms of effort. An accurate
prediction model can help developers to focus their effort on the issue reports that
are likely to describe a valid problem. Therefore, we investigate how accurately we
can predict whether a new issue report will be finally rejected, by solely using the
information that is available at the creation time.
Approach. We build a prediction model for each ITS using the issue report metrics
that are described in Section 4.2.3. We choose to use a random forest model be-
cause it is robust to data noise and generally achieves good performance in software
engineering studies [72, 46, 74, 44, 54, 31].
1) Correlation and redundancy analysis : To remove highly correlated and redun-
dant variables, we conduct correlation and redundancy analysis on the metrics for each
ITS. We calculate the Spearman rank correlation [95] for our metrics to test whether
there exist highly correlated pairs of metrics as the Spearman rank correlation is re-
silient to non-normally distributed data. We use a variable clustering technique (i.e.,

4.3. EXPERIMENTAL RESULTS 61
Is R
egre
ssive
Is W
eeke
ndRa
te o
f INC
OM
PLET
ERa
te o
f EXP
IRED
Step
s to
repr
oduc
eTi
tle le
ngth
Desc
riptio
n le
ngth
Read
abilit
ySe
verit
yth
e nu
mbe
r of a
ttach
men
tsTh
e nu
mbe
r of C
CsIs
Blo
ckin
gIs
Dep
ende
ntPr
iorit
yRe
puta
tion
of th
e op
ener
Rate
of W
ONT
FIX
Rate
of D
UPLI
CATE
Rate
of I
NVAL
IDRa
te o
f WO
RKSF
ORM
E
0.7
0.6
0.5
0.4
0.3
0.2
0.1
0.0
Spea
rman
ρ
Figure 4.3: The Spearman correlation analysis for Firefox.The dotted red line indicates the threshold value of 0.7.
varclus()4 in R) to construct a hierarchical overview of the correlation coefficient ρ.
If the correlation coefficient of two metrics is equal to or larger than 0.7, we
consider this pair of metrics to be highly correlated and select one of them. The
value of 0.7 has been applied as the threshold of the Spearman correlation analysis
by previous studies [72, 58, 79]. Figure 4.3 shows the Spearman rank correlation of the
metrics in Firefox. The horizontal lines in the forks of each pair of metrics correspond
to the absolute correlation coefficient value. All metrics have a correlation coefficient
value that is smaller than 0.7, which means that none of the metrics are strongly
correlated. We observe that there are no correlated metrics for Linux and Eclipse
neither.
In addition, we conduct redundancy analysis on the metrics using the redun()
4http://svitsrv25.epfl.ch/R-doc/library/Hmisc/html/varclus.html
4.3. EXPERIMENTAL RESULTS 62
function in R. Redundant metrics are metrics that can be explained by other metrics
in the data, therefore they are not necessary to be included in the model. We observe
that there are no redundant metrics in our data.
2) Performance evaluation: To validate the performance of our prediction models,
we use four measures (i.e., precision, recall, F-measure, and accuracy) that rely on the
cut-off value and an additional measure (i.e., AUC) that is free of the cut-off value.
The first four measures are computed based on the confusion matrix that consists of
TP (true positives), TN (true negatives), FP (false positives) and FN (false negatives).
The terms positive and negative represent the prediction, and the terms true and false
refer to whether the prediction matches the observation value. The values of TP, FP,
TN and FN are obtained by using a cut-off value for the predicted value (from 0 to 1),
which is usually 0.5. Changing the cut-off value can alter the values of the measure
of precision, recall, F-measure, and accuracy.
• Precision (P) measures the correctness of our model in predicting whether an
issue report will be rejected in the future. Precision is defined as the proportion
of the issue reports that are predicted to be rejected that are truly rejected:
P = TP/(TP + FP ) [25, 69].
• Recall (R) measures the completeness of our model. A model is said to be com-
plete if it can predict all issue reports that will be rejected: R = TP/(TP + FN) [25,
69].
• F-Measure (F) is the harmonic mean of the precision and recall, combining the
single descriptive metrics into one metric: F = 2× P ×R/(P +R) [69].
• Accuracy (A) calculates the percentages of the correct prediction:

4.3. EXPERIMENTAL RESULTS 63
A = (TP + TN)/(TP + FP + TN + FN) [69].
In addition to the four measures, Area Under Curve (AUC) is used to measure the
overall ability of the classifier to predict whether an issue report will be rejected. AUC
is the area below the curve plotting the true positive rate against the false positive
rate. The AUC value ranges from 0.5 (worst, i.e., random guessing) to 1 (best, i.e.,
all predictions for all issue reports are correct).
3) Model validation: We apply 10-fold cross-validation for ten times during the
construction of our prediction model to prevent overfitting. During n-fold cross-
validation, the data is divided into n equal-sized parts. During each fold, n− 1 parts
are used to train the model and the remaining part is used to test the model. After n
folds, the standard deviation of the performance of the model is calculated to estimate
the effect of overfitting. We repeat the cross-validation ten times to get an even better
estimation.
4) Baseline model comparison: We use a baseline model to evaluate our random
forest model. In this baseline model, we consider all issue reports that are straight-
forward to reject (as our random forest will allow straightforward rejection of issue
reports as well). We conservatively assume that the rejected issue reports with zero
or one comments were straightforwardly rejected by developers (straightforward re-
jection). Without a model to automatically predict whether an issue report will be
rejected, developers usually investigate an issue report and conduct discussions with
others then determine to reject it or not. However, developers might post one com-
ment to explain the final resolution when an issue report was rejected or fixed (e.g.,

4.3. EXPERIMENTAL RESULTS 64
Linux-915, Fireox-12533226, Eclipse-157).
The precision of the baseline model is considered 1, because all the straightfor-
ward rejected issue reports are truly rejected. The recall is the proportion of issue
reports which are rejected by no more than one comment, compared to number of all
rejected issue reports are precisely and straightforwardly rejected. The threat of our
assumption is discussed in the Section 4.4
5) Important metrics : To identify the most important metrics in our random
forest model, we use a permutation test [79]. In a permutation test, the values of
the metric of which we want to find importance are randomly permuted in the test
dataset during the cross-validation. The precision of the model on the permuted
dataset and the original dataset is compared and is used as a measure to describe the
importance of that metric in the model. We use the importance() function in the
RandomForest8 package in R during the cross-validation to obtain 100 importance
scores for each metric in our dataset.
We use Scott-Knott effect size clustering (SK-ESD) [83] to group the metrics based
on the effect size of their differences in importance scores. SK-ESD groups together
metrics that have no significant or a negligible difference. We use the ScottKnottESD
package in R with a confidence level of 95% (which is applied in previous research [72,
98] in software engineering) to cluster the metrics into groups.
Results. Our prediction model outperforms the baseline model. Table 4.3
shows the performance of our random forest and baseline model. We observe that
our random forest models outperform the baseline model according to the F-Measure
5https://bugzilla.kernel.org/show bug.cgi?id=91 (accessed in Jul. 2016)6https://bugzilla.mozilla.org/show bug.cgi?id=1253322 (accessed in Jul. 2016)7https://bugs.eclipse.org/bugs/show bug.cgi?id=15 (accessed in Jul. 2016)8https://cran.r-project.org/web/packages/randomForest/randomForest.pdf (accessed in Jul.
2016)

4.3. EXPERIMENTAL RESULTS 65
Table 4.3: The average performance measures and the standard deviation of ourmodel and the baseline model in the three studied ITSs.
Precision Recall F-Measure Accuracy AUC
Linux 0.69±0.016 0.90±0.013 0.78±0.012 0.68±0.011 0.66±0.014Firefox 0.96±0.002 0.84±0.003 0.90±0.002 0.85±0.002 0.91±0.003Eclipse 0.68±0.004 0.68±0.008 0.68±0.005 0.68±0.004 0.74±0.004
Baseline Model:Linux 1.00±0.000 0.25±0.000 0.40±0.000 0.52±0.000 0.62±0.000Firefox 1.00±0.000 0.30±0.000 0.46±0.000 0.44±0.000 0.65±0.000Eclipse 1.00±0.000 0.32±0.000 0.48±0.000 0.66±0.000 0.65±0.000
Table 4.4: The five important metrics in the random forest models.
The metrics are clustered and ranked using Scott-Knott effect size clustering.
ITS Rank Metric Importance
Linux 1 Reputation 0.01722 Is blocking 0.01113 Is regressive 0.01074 Readability 0.00945 Number of CCs 0.0089
Firefox 1 Reputation 0.06762 Rate of WONTFIX 0.01793 Priority 0.01764 Rate of DUPLICATE 0.01665 Number of CCs 0.0143
Eclipse 1 Reputation 0.05142 Rate of WONTFIX 0.02893 Rate of INVALID 0.02484 Rate of DUPLICATE 0.02335 Rate of WORKSFORME 0.0275
and AUC. The recall of our models is high, especially for Linux and Firefox. High
recall is important in our models because it allows us to prevent developers from
wasting effort on issue reports that will be rejected. We observe that the proportion
of rejected issue reports in the ITS might affect the performance of the prediction
model. For example, there are 49.23% rejected issue reports in Eclipse, which is the
smallest number of the three studied systems, which could be the reason for the low
recall of the Eclipse model.
Reputation is the most important metric for deciding whether a report
will be rejected in all three studied ITSs. Table 4.4 shows the top 5 most

4.3. EXPERIMENTAL RESULTS 66
important metrics after clustering and ranking them with Scott-Knott effect size
clustering. The importance of the reputation of the developer confirms that issue
reports that are opened by a developer who has successfully had his reports addressed
in the past, are more likely to be addressed [40, 34]. A possible explanation is that
a large number of the rejected issue reports are reported by one-time reporters, who
do not enclose sufficient information in a report to address an issue.
An observation that is related to the importance of reputation of the reporter,
is that the rate of certain types of rejected issue reports ranks high in the list of
important metrics. A similar reasoning for a possible explanation could be given as
for the reputation metric.
Another interesting observation is that importance metrics that reporters assign
to their report (e.g., severity, priority) are no guarantee for getting an issue report
addressed. Only priority is an important metric in the Firefox ITS.�
�
�
Our random forest model outperforms the baseline model. The repu-
tation of a reporter is the most important metric in the model for all
three ITSs.
4.3.3 RQ4.3: How accurately can we rank issue reports based on their
validity likelihood?
Motivation. When there are more new issue reports filed into an ITS than the
triagers can handle, a backlog of issue reports that need to be assigned emerges.
Having a large backlog of unassigned issue reports can be a threat to the quality of
a software project, as severe issues may be left unaddressed. In addition, the larger
the size of the backlog, the more difficult it becomes for a triager to identify the valid

4.3. EXPERIMENTAL RESULTS 67
Table 4.5: The average number of issue reports that are opened, fixed and assignedeach day in the studied ITSs.
ITS# of Daily # of Daily # of Daily Total
Opened Reports Fixed Reports Assigned Reports # of Backlog
Linux 5.8 2.8 4.9 3,966Firefox 31.7 6.5 23.0 18,573Eclipse 76.9 45.5 16.0 12,750
1The number of backlog refers to the total number of unassigned issue reports on February 2, 2016.
issue reports.
Table 4.5 shows that there are 5.8 (Linux), 31.7 (Firefox) and 76.9 (Eclipse) new
issue reports filed each day in the studied ITSs. However, the triagers are able to
assign only respectively 4.88, 23.04, and 16.02 of the new issue reports to a developer
every day. Hence, the backlog of unassigned issue reports grows steadily in all three
studied ITSs.
Ideally, a model can be used to assist the triager in handling the backlog of
unassigned issue reports. However, as shown in the previous section, our model
is unable to achieve a 100% precision and recall. Therefore, our model may either
mistake issue reports that should be rejected for valid reports, or the model may
disregard valid issue reports.
In this question, we investigate whether we can provide the triager with a ranking
of issue reports that are likely to be valid. Such a ranking allows the triager to focus
the limited available time on assigning issue reports that are most likely to be valid
and disregard the issue reports that are likely to be rejected.
Approach. To rank the backlog of issue reports that need to be assigned, we use
a learning-to-rank (L2R) model to rank the remaining issue reports based on their
validity likelihood. L2R has been widely adopted in the area of information retrieval
over the past years [37, 64], e.g., in search engines. A L2R model ranks a set of

4.3. EXPERIMENTAL RESULTS 68
Validation phase
Report metrics
(Vs)Label with
relevance (r)
Documents (d)
Train set Train model Ranking
modelRank queried
issue reports (q)
Test set
Training phase
Ranking of its reports based on validity likelihood
Figure 4.4: An overview of our ranking approach.
documents (e.g., web pages) based on their relevance to a query. For example, the
query ‘Bugzilla’ will return a set of web pages that talk about Bugzilla, with the most
relevant page on the highest rank. Figure 4.4 shows our approach for ranking issue
reports.
1) Training phase: A L2R model must be trained using a set of queries and
documents that are labeled with their relevance to that query. The model generates
a ranking schema, which uses the feature vector Vs of an unlabeled document d to
compute its relevance r to a query q. In our study, we define d, r, q and Vs as follows:
d: An issue report.
r: The likelihood of d being a valid issue report.
q: The query to retrieve the documents with the highest likelihood of being
valid issue reports.
Vs: The set of features (i.e., the metrics that are described in Section 4.2.3) of
d.
To train the ranking model, we label all documents in the training data as valid or
rejected (according to the resolution of the issue reports). We use the the RankLib9
9https://sourceforge.net/p/lemur/wiki/RankLib/

4.3. EXPERIMENTAL RESULTS 69
software to train a random forest ranking model. We choose the random forest ranking
model as it is reported to achieve high accuracy and perform faster than other ranking
algorithms [18].
2) Validation phase: To validate our ranking model, we conduct ten times 10-fold
cross-validation. During 10-fold cross-validation, the data is divided into ten equally-
sized chunks. During each fold, nine chunks are used to train the model and one
chunk is used to test the model.
We use the precision at position k (P@k) and the normalized discounted cumu-
lative gain (NDCG@k) to evaluate the performance of the ranking model. P@k
corresponds to the number of relevant documents in the first k positions of the rank-
ings. Note that generally, recall is not used to evaluate ranking models, as there are
potentially thousands of documents that are relevant to a query. Because it is not
possible to read all those documents for a human, we focus on precision at a position
k instead. P@k is defined as follows [18]:
P@k(π, l) =
∑t≤kt=1 I(lπ−1(j)=1)
k(4.4)
where π is the ranked list of issue reports with their relevance labels l, I{·} is the
indicator function, and π−1(j) the issue report that is ranked at position j of π.
The indicator function returns 1 for documents that are relevant and 0 for doc-
uments that are not relevant. Table 4.6 shows an example ranking of three issue
reports. In this table, P@1 = 1, P@2 = 0.5 and P@3 = 0.67.
Precision at position k does not take the actual position in the ranking into ac-
count. Hence, in the example in Table 4.6, P@2 would still be 0.5 if the first and
second ranks were switched, even though the actual ranking would be worse because

4.3. EXPERIMENTAL RESULTS 70
Table 4.6: Example ranking result of three Firefox issue reports for q = valid issuereports.
Rank Report Relevance
1 #383380: Spell Check Not giving correct spelling ... . . Valid2 #335348: “Save Image As ...” should include path ... . . Rejected3 #763312: Menus often get lost on Linux Valid
. . . . . . . . .
a rejected issue reported was ranked the highest.
The discounted cumulative gain at position k (DCG@k) [18] metric takes the
position of an issue report into account, as it has an explicit position discount factor
in its definition. Therefore, issue reports with a high validity likelihood but a low
ranking negatively affect the DCG. DCG@k is defined as follows:
DCG@k =k∑
j=1
2rj − 1
log2(1 + j)(4.5)
where rj is the relevance label (1 for valid reports, 0 for rejected reports) of the issue
report in the jth position in the ranking list.
In the example in Table 4.6, DCG@1 = 1, DCG@2 = 1 and DCG@3 = 1.5. The
DCG@k is normalized to get the NDCG@k which ranges from 0 to 1:
NDCG@k =DCG@k
IDCG@k(4.6)
where IDCG@k is the ideal DCG@K value, which can be obtained by reordering the
list with all valid issues in the highest ranks and computing the DCG@k for the list.
Hence, for our example in Table 4.6, IDCG@k = 1.63 and NDCG@k = 0.92.
We compute the P@k and NDCG@k metrics for k = 1, .., 20 for all three studied
ITSs. In addition, we compute k = 30 and k = 40 for Firefox as the average number

4.3. EXPERIMENTAL RESULTS 71
0.4
0.5
0.6
0.7
0.8
0.9
1.0
k
P@k
1 2 3 4 5 6 7 8 9 10 11 12 13 14 15 16 17 18 19 20
● ● ● ● ● ● ● ● ● ● ● ● ● ● ● ● ● ● ● ●
●
●
●●
●●
●●
● ●●
● ●●
●
●●
● ● ●
0.0
0.2
0.4
0.6
0.8
1.0
k
NDCG@k
1 2 3 4 5 6 7 8 9 10 11 12 13 14 15 16 17 18 19 20
●● ● ● ● ● ● ● ● ● ● ● ● ● ● ● ● ● ● ●
●
●
●
●
●
●
●● ● ● ● ● ● ● ● ● ● ● ● ●
Linux (Our approach) ● Firefox (Our approach) Eclipse (Our approach)
Linux (Baseline ranking model) ● Firefox (Baseline ranking model) Eclipse (Baseline ranking model)
Figure 4.5: The mean values of P@k and NDCG@k that are achieved by our ap-proach and the baseline ranking model.
of assigned reports per day is higher for Firefox. Hence, there is a need for high
performance in a larger ranking than in Linux and Eclipse.
3) Baseline ranking model: In the current practice, the developers are likely to first
handle older issue reports with a higher severity value. To measure the contribution
of our ranking model, we setup the baseline ranking model based on the age and
severity of issue reports. In the baseline ranking model, we first rank our testing issue
reports by the reporting time (i.e., an issue report would be ranked higher if it were
opened earlier) and then by severity, if issue reports are opened at the same day (i.e.,
an issue report would be ranked higher if it has a higher severity than other issue
reports which are opened at the same day).
Results. Our ranking model achieves a high precision (i.e., 0.85 to 1.00) in
the top k returned reports. The performance is better than the baseline ranking
model that achieves an average P@k (i.e., k from 1 to 20) around 0.69 in Linux,
0.73 in Firefox and 0.50 in Eclipse. Figure 4.5 shows the mean values of P@k and
NDCG@k at various positions (i.e., k from 1 to 20). In the three studied ITSs, both

4.3. EXPERIMENTAL RESULTS 72
P@k and NDCG@k range from 0.85 to 1.00 for the studied values of k.
The number of daily triaged issue reports further demonstrates the practical use-
fulness of our approach. For instance, the average number of daily triaged issue
reports in Firefox is 23, and our approach achieves a P@23 of 0.98 on the top 23
returned reports. By inspecting the top 23 reports, triagers who use our approach
can identify about 22.5 (≈ 23 × 98%) valid reports; while triagers who pick up 23
reports by the baseline ranking model can identify only 15.64 (≈ 23 × 68%) valid
reports. Although the size of the backlog of all reports may be the same as before (if
the amount of daily triaged reports remain unchanged), there will be much less valid
reports waiting in the backlog. As such, the issue reports that describe valid problems
can be inspected and resolved at an earlier stage than before. Similar improvements
of the triaging efficiency are also observed in the other two ITSs.
Our ranking model still outperforms the baseline ranking model when k increases.
For instance, our model achieves an average precision (previous 20 positions) of 0.85 in
Linux; while the baseline ranking model yields an average precision of 0.69. Therefore,
our approach provides a good set of candidate reports that are likely to report valid
issues. Enlarging the set of candidate reports is necessary, if triagers need to inspect
a particular type of issues (e.g., issues with high reported priority or issues concerning
security).�
�
�
Our ranking model achieves high precision for the top ranked reports.
Therefore, the triaging process can benefit from using a ranking model
to prioritize issue reports that are likely to be valid.

4.4. THREATS TO VALIDITY 73
4.4 Threats to validity
In this section, we discuss the threats to the validity of our study.
External Validity. One of the external threats to our results is generalization.
In this chapter, we study the ITSs of three popular open source software projects.
Even though these projects are well-developed, the process of rejecting issue reports
may be different in industrial or other open source projects. In addition, all three
studied projects make use of the Bugzilla ITS. Our findings might not hold true for
projects that use other types of ITSs (e.g., JIRA). For example, we can not determine
whether an issue is blocking in projects that use the JIRA ITS because JIRA does
not support a field to indicate whether an issue is blocking. In order to address this
threat, additional research is necessary to better understand the generalization of our
results.
Internal Validity. One of the internal threats to our results is that we assume
that the behaviour of development teams regarding rejected issue reports does not
change over time. It is possible that at different stages in the studied period, projects
enforced different policies or developers changed their habits regarding rejected issue
reports. For example, as the number of new issue reports per day increases, projects
may become more strict in selecting the issues that will be addressed.
Another internal threat is that our baseline model in the RQ4.2 might contain
noise, as there may exist non-straightforwardly rejected issue reports among the is-
sue reports which are rejected with one comment (e.g., in Linux-7810, the only-one
comment further analyzes the issues and discuss with the reporter how to resolve the
issue). However, inclusion of such non-straightforwardly rejected issue reports only
10https://bugzilla.kernel.org/show bug.cgi?id=78

4.5. SUMMARY 74
improves the performance of the baseline model. Hence, our results and conclusion
are not affected by this threat.
Construct Validity. In our study on the effort spent on rejecting issue reports
we use metrics that can be extracted from the issue report or ITS. However, these
metrics are a rough estimation of the actual effort spent by developers on rejecting
the report. The usage of these metrics does not affect the evaluation of our approach
in RQ4.2 and RQ4.3. In future work, this threat needs to be addressed by, e.g.,
interviewing developers about the effort required to reject an issue report.
4.5 Summary
In this chapter, we study the risk of wasting effort on rejected issue reports from three
perspectives, i.e., the time elapsed for handling a rejected issue report, the number of
developers involved and the number of comments in a rejected report. We find that
rejected issue reports are indeed a threat to the efficiency of a development team. For
instance, the time elapsed in dealing with rejected issue reports are 6.73 (Firefox),
7.18 (Eclipse) and 72.66 (Linux) days respectively and the median number of involved
developers in rejected issue reports is two. Hence, we build a random forest model
to predict whether an issue report will be rejected in the end. The results show
that our prediction model outperforms the baseline model. In particular, the average
precision of our model ranges from 0.68 to 0.90 in the three studied projects. However,
our model cannot achieve a 100% precision. Therefore, we further propose a ranking
model that prioritizes untriaged issue reports by their validity likelihood. Our ranking
model achieves a higher mean precision than the baseline ranking model (i.e., 0.85
vs. 0.69 in Linux, 0.98 vs. 0.73 in Firefox, and 0.96 vs. 0.51 in Eclipse at the top 20

4.5. SUMMARY 75
positions).

76
Chapter 5
Conclusions
In this chapter, we describe the contribution and findings of the thesis. Then, we
explore the directions of the future work.
5.1 Contributions and Findings
The overall goal of this thesis is to improve the effectiveness of the issue resolving
process. As raising questions by developers from issue reports is one of the threats
towards the efficiency of the issue resolving process, we first examine if it is feasible to
predict an issue report will be raised questions when it is created. Then, we focus the
negative impact of the rejected issue reports on the efficiency of the issue resolving
process and apply machine learning techniques to predict the rejected issue reports.
We summarize the major contributions and findings of the thesis as follows.
• We perform an in-depth analysis on the raised questions by developers from issue
reports during the issue resolving process. We observe that raising questions
negatively impacts the efficiency of the issue resolving process. For example,
issue reports with raised questions require more effort to fix the issues (e.g., in

5.1. CONTRIBUTIONS AND FINDINGS 77
terms of the elapsed time, the number of involved developers and comments
and the number of assignments). Therefore, we propose an approach to predict
if questions are likely to be raised by developers from an issue report when
the issue report is created. The values of AUC of the prediction model in our
subject systems are ranged from 0.65 to 0.78. The results of the prediction
model show that it is feasible to give developers an early warning of the issue
reports that are likely to raise questions by developers. The issue reporters and
developers should pay more attention to the issue reports with a high chance
of having questions raised.
• We conduct an empirical investigation of all types of rejected issue reports in
three large projects. We find that rejected issue reports could have wasted the
effort of a development team. We also propose the identification of a set of
important metrics for predicting if an issue report will be rejected. Then, we
propose a ranking approach that can accurately highlight valid issue reports
for the issue resolving task. The results show that our approach achieves an
average precision of 0.88, 0.98 and 0.96 for the top-20 ranked list of issue reports
in Linux, Firefox and Eclipse, respectively. The evaluation results show that
the proposed approach can reduce the effort spent on the rejected issue reports
during issue resolving process. With our approach, developers can focus more
resources on the issue reports that are more likely to describe real problems and
need to be fixed.

5.2. FUTURE WORK 78
5.2 Future Work
5.2.1 Combining with Texual Metrics
In this thesis, we propose metrics to characterize issue reports. All these metrics are
identified from the issue reports. For instance, The size of the title calculates the
number of words of the title from an issue report. Adding the textual metrics as
independent variables to prediction models can be beneficial to the effectiveness of
our models. We plan to investigate the textual metrics from the description of issue
reports, and add the textual metrics to build prediction models.
5.2.2 Generalization of Our Approaches in Othe Projects
The applied issue tracking systems may be various in different projects. Our subject
systems use Bugzilla to track the reported issues. However, some projects (e.g., CXF,
Derby, Hadoop) utilize JIRA to track and fix the reported issues. Such differences
might affect the performance of our approaches. We will pay more attention to the
evaluation of the generalization of our approaches in more projects in the future.
5.2.3 Exploring the Generalization of Other Techniques
There are different kinds of machine learning models. For instance, supervised classi-
fication models (e.g., random forest, logistic regression which are applied in Chapter 3
and Chapter 4) and unsupervised classification models (e.g., k-means clustering, par-
tition around medoids and so forth), linear models (e.g., linear regression model) and
non-linear models (e.g., naive bayes). In the future work, we can apply other machine
learning techniques to build prediction models.

5.2. FUTURE WORK 79
5.2.4 Integrating Our Approaches in the Practices
In the future, we plan to apply our approaches to develop a tool to reduce the devel-
opers’ effort spent on the issue resolving process.
BIBLIOGRAPHY 80
Bibliography
[1] Karan Aggarwal, Tanner Rutgers, Finbarr Timbers, Abram Hindle, Russ
Greiner, and Eleni Stroulia. Detecting duplicate bug reports with software
engineering domain knowledge. In International Conference on Software Anal-
ysis, Evolution and Reengineering (SANER), pages 211–220. IEEE, 2015.
[2] Syed Nadeem Ahsan, Javed Ferzund, and Franz Wotawa. Automatic software
bug triage system (bts) based on latent semantic indexing and support vector
machine. In Software Engineering Advances, 2009. ICSEA’09. Fourth Interna-
tional Conference on, pages 216–221. IEEE, 2009.
[3] Anahita Alipour, Abram Hindle, and Eleni Stroulia. A contextual approach
towards more accurate duplicate bug report detection. In Proceedings of the
10th Working Conference on Mining Software Repositories (MSR), pages 183–
192. ACM, 2013.
[4] Giuliano Antoniol, Kamel Ayari, Massimiliano Di Penta, Foutse Khomh, and
Yann-Gael Gueheneuc. Is it a bug or an enhancement?: a text-based approach
to classify change requests. In Proceedings of the 2008 conference of the center
for advanced studies on collaborative research: meeting of minds, page 23. ACM,
2008.

BIBLIOGRAPHY 81
[5] John Anvik, Lyndon Hiew, and Gail C Murphy. Coping with an open bug
repository. In Proceedings of the OOPSLA workshop on Eclipse technology
eXchange, pages 35–39. ACM, 2005.
[6] John Anvik, Lyndon Hiew, and Gail C Murphy. Who should fix this bug? In
Proceedings of the 28th international conference on Software engineering, pages
361–370. ACM, 2006.
[7] John Anvik and Gail C Murphy. Reducing the effort of bug report triage:
Recommenders for development-oriented decisions. volume 20, page 10. ACM,
2011.
[8] Andrea Arcuri and Xin Yao. Coevolving programs and unit tests from their
specification. In Proceedings of the twenty-second IEEE/ACM international
conference on Automated software engineering, pages 397–400. ACM, 2007.
[9] Andrea Arcuri and Xin Yao. A novel co-evolutionary approach to automatic
software bug fixing. In Evolutionary Computation, 2008. CEC 2008.(IEEE
World Congress on Computational Intelligence). IEEE Congress on, pages 162–
168. IEEE, 2008.
[10] R Arun, Venkatasubramaniyan Suresh, CE Veni Madhavan, and MN Narasimha
Murthy. On finding the natural number of topics with latent dirichlet allocation:
Some observations. In Pacific-Asia Conference on Knowledge Discovery and
Data Mining, pages 391–402. Springer, 2010.
[11] Anton Barua, Stephen W Thomas, and Ahmed E Hassan. What are developers

BIBLIOGRAPHY 82
talking about? an analysis of topics and trends in stack overflow. Empirical
Software Engineering, 19(3):619–654, 2014.
[12] Olga Baysal, Michael W Godfrey, and Robin Cohen. A bug you like: A frame-
work for automated assignment of bugs. In Program Comprehension, 2009.
ICPC’09. IEEE 17th International Conference on, pages 297–298. IEEE, 2009.
[13] Nicolas Bettenburg, Sascha Just, Adrian Schroter, Cathrin Weiß, Rahul Prem-
raj, and Thomas Zimmermann. Quality of bug reports in eclipse. In Proceedings
of the 2007 OOPSLA workshop on eclipse technology eXchange, pages 21–25.
ACM, 2007.
[14] Nicolas Bettenburg, Sascha Just, Adrian Schroter, Cathrin Weiss, Rahul Prem-
raj, and Thomas Zimmermann. What makes a good bug report? In Proceedings
of the 16th ACM SIGSOFT International Symposium on Foundations of soft-
ware engineering, pages 308–318. ACM, 2008.
[15] Nicolas Bettenburg, Rahul Premraj, Thomas Zimmermann, and Sunghun Kim.
Duplicate bug reports considered harmful... really? In International Conference
on Software Maintenance (ICSM), pages 337–345. IEEE, 2008.
[16] Pamela Bhattacharya and Iulian Neamtiu. Fine-grained incremental learning
and multi-feature tossing graphs to improve bug triaging. In Software Main-
tenance (ICSM), 2010 IEEE International Conference on, pages 1–10. IEEE,
2010.
[17] David M Blei, Andrew Y Ng, and Michael I Jordan. Latent dirichlet allocation.
Journal of machine Learning research, 3(Jan):993–1022, 2003.

BIBLIOGRAPHY 83
[18] Leo Breiman. Random forests. Machine learning, 45(1):5–32, 2001.
[19] Silvia Breu, Rahul Premraj, Jonathan Sillito, and Thomas Zimmermann. Fre-
quently asked questions in bug reports. Technical report, University of Calgary,
2009.
[20] Silvia Breu, Rahul Premraj, Jonathan Sillito, and Thomas Zimmermann. In-
formation needs in bug reports: improving cooperation between developers and
users. In Proceedings of the 2010 ACM conference on Computer supported co-
operative work, pages 301–310. ACM, 2010.
[21] Juan Cao, Tian Xia, Jintao Li, Yongdong Zhang, and Sheng Tang. A density-
based method for adaptive lda model selection. Neurocomputing, 72(7):1775–
1781, 2009.
[22] Yguarata Cerqueira Cavalcanti, Paulo Anselmo Da Mota Silveira Neto, Eliana S
de Almeida, Daniel Lucredio, Carlos Eduardo Albuquerque da Cunha, and
Silvio Romero de Lemos Meira. One step more to understand the bug report
duplication problem. In Brazilian Symposium on Software Engineering (SBES),
pages 148–157. IEEE, 2010.
[23] Yguarata Cerqueira Cavalcanti, Paulo Anselmo da Mota Silveira Neto, Daniel
Lucredio, Tassio Vale, Eduardo Santana de Almeida, and Silvio Romero
de Lemos Meira. The bug report duplication problem: an exploratory study.
Software Quality Journal, 21(1):39–66, 2013.
[24] Jennifer L Davidson, Nitin Mohan, and Carlos Jensen. Coping with duplicate

BIBLIOGRAPHY 84
bug reports in free/open source software projects. In VL/HCC, volume 11,
pages 101–108, 2011.
[25] Jesse Davis and Mark Goadrich. The relationship between precision-recall and
roc curves. In Proceedings of the 23rd international conference on Machine
learning, pages 233–240. ACM, 2006.
[26] C Mitchell Dayton. Logistic regression analysis. Stat, pages 474–574, 1992.
[27] Romain Deveaud, Eric SanJuan, and Patrice Bellot. Accurate and effective
latent concept modeling for ad hoc information retrieval. Document numerique,
17(1):61–84, 2014.
[28] Mona Erfani Joorabchi, Mehdi Mirzaaghaei, and Ali Mesbah. Works for me!
characterizing non-reproducible bug reports. In Proceedings of the 11th Working
Conference on Mining Software Repositories, pages 62–71. ACM, 2014.
[29] Chiara Francalanci and Francesco Merlo. Empirical analysis of the bug fixing
process in open source projects. In IFIP International Conference on Open
Source Systems, pages 187–196. Springer, 2008.
[30] Amir Hossein Ghapanchi and Aybuke Aurum. Measuring the effectiveness of
the defect-fixing process in open source software projects. In System Sciences
(HICSS), 2011 44th Hawaii International Conference on, pages 1–11. IEEE,
2011.
[31] Baljinder Ghotra, Shane McIntosh, and Ahmed E Hassan. Revisiting the im-
pact of classification techniques on the performance of defect prediction models.

BIBLIOGRAPHY 85
In Proceedings of the 37th International Conference on Software Engineering
(ICSE), pages 789–800. IEEE, 2015.
[32] Iker Gondra. Applying machine learning to software fault-proneness prediction.
Journal of Systems and Software, 81(2):186–195, 2008.
[33] Thomas L Griffiths and Mark Steyvers. Finding scientific topics. Proceedings
of the National academy of Sciences, 101(suppl 1):5228–5235, 2004.
[34] Philip J Guo, Thomas Zimmermann, Nachiappan Nagappan, and Brendan Mur-
phy. Characterizing and predicting which bugs get fixed: an empirical study
of Microsoft Windows. In Proceedings of the 32nd International Conference on
Software Engineering (ICSE), volume 1, pages 495–504. IEEE, 2010.
[35] Philip J Guo, Thomas Zimmermann, Nachiappan Nagappan, and Brendan Mur-
phy. Not my bug! and other reasons for software bug report reassignments. In
Proceedings of the ACM 2011 conference on Computer supported cooperative
work, pages 395–404. ACM, 2011.
[36] Tracy Hall, Sarah Beecham, David Bowes, David Gray, and Steve Counsell. A
systematic literature review on fault prediction performance in software engi-
neering. IEEE Transactions on Software Engineering, 38(6):1276–1304, 2012.
[37] LI Hang. A short introduction to learning to rank. IEICE TRANSACTIONS
on Information and Systems, 94(10):1854–1862, 2011.
[38] Joseph M Hilbe. Logistic regression models. CRC press, 2009.

BIBLIOGRAPHY 86
[39] Abram Hindle, Christian Bird, Thomas Zimmermann, and Nachiappan Nagap-
pan. Do topics make sense to managers and developers? Empirical Software
Engineering, 20(2):479–515, 2015.
[40] Pieter Hooimeijer and Westley Weimer. Modeling bug report quality. In Pro-
ceedings of the twenty-second IEEE/ACM international conference on Auto-
mated software engineering, pages 34–43. ACM, 2007.
[41] Hadi Hosseini, Raymond Nguyen, and Michael W Godfrey. A market-based bug
allocation mechanism using predictive bug lifetimes. In Software Maintenance
and Reengineering (CSMR), 2012 16th European Conference on, pages 149–158.
IEEE, 2012.
[42] Nicholas Jalbert and Westley Weimer. Automated duplicate detection for bug
tracking systems. In International Conference on Dependable Systems and Net-
works (DSN), pages 52–61. IEEE, 2008.
[43] Gaeul Jeong, Sunghun Kim, and Thomas Zimmermann. Improving bug triage
with bug tossing graphs. In Proceedings of the the 7th joint meeting of the
European software engineering conference and the ACM SIGSOFT symposium
on The foundations of software engineering, pages 111–120. ACM, 2009.
[44] Yue Jiang, Bojan Cukic, and Tim Menzies. Can data transformation help in the
detection of fault-prone modules? In Proceedings of the Workshop on Defects
in Large Software Systems (DEFECTS), pages 16–20. ACM, 2008.
[45] Karen Sparck Jones. Readings in information retrieval. Morgan Kaufmann,
1997.

BIBLIOGRAPHY 87
[46] Yasutaka Kamei, Shinsuke Matsumoto, Akito Monden, Ken-ichi Matsumoto,
Bram Adams, and Ahmed E Hassan. Revisiting common bug prediction find-
ings using effort-aware models. In International Conference on Software Main-
tenance (ICSM), pages 1–10. IEEE, 2010.
[47] Nilam Kaushik and Ladan Tahvildari. A comparative study of the performance
of ir models on duplicate bug detection. In Proceedings of the 16th Conference
on Software Maintenance and Reengineering (CSMR), pages 159–168. IEEE,
2012.
[48] Foutse Khomh, Tejinder Dhaliwal, Ying Zou, and Bram Adams. Do faster
releases improve software quality? an empirical case study of mozilla firefox. In
Mining Software Repositories (MSR), 2012 9th IEEE Working Conference on,
pages 179–188. IEEE, 2012.
[49] Sunghun Kim and E James Whitehead Jr. How long did it take to fix bugs? In
Proceedings of the 2006 international workshop on Mining software repositories,
pages 173–174. ACM, 2006.
[50] Andrew J Ko and Parmit K Chilana. Design, discussion, and dissent in open
bug reports. In Proceedings of the 2011 iConference, pages 106–113. ACM,
2011.
[51] William H Kruskal and W Allen Wallis. Use of ranks in one-criterion vari-
ance analysis. Journal of the American Statistical Association, 47(260):583–621,
1952.
[52] Ravi Sankar Landu. Analysis of rejected defects in first and second half builds

BIBLIOGRAPHY 88
of software testing phase. Journal of Computing Technologies, 2278-3814:45–51,
2012.
[53] Alina Lazar, Sarah Ritchey, and Bonita Sharif. Improving the accuracy of
duplicate bug report detection using textual similarity measures. In Proceedings
of the 11th Working Conference on Mining Software Repositories (MSR), pages
308–311. ACM, 2014.
[54] Stefan Lessmann, Bart Baesens, Christophe Mues, and Swantje Pietsch. Bench-
marking classification models for software defect prediction: A proposed frame-
work and novel findings. IEEE Transactions on Software Engineering (TSE),
34(4):485–496, 2008.
[55] Andy Liaw and Matthew Wiener. Classification and regression by randomforest.
R news, 2(3):18–22, 2002.
[56] Rafael Lotufo, Leonardo Passos, and Krzysztof Czarnecki. Towards improving
bug tracking systems with game mechanisms. In Proceedings of the 9th IEEE
Working Conference on Mining Software Repositories, pages 2–11. IEEE Press,
2012.
[57] Douglas R McCallum and James L Peterson. Computer-based readability in-
dexes. In Proceedings of the ACM’82 Conference, pages 44–48. ACM, 1982.
[58] Shane McIntosh, Yasutaka Kamei, Bram Adams, and Ahmed E Hassan. An
empirical study of the impact of modern code review practices on software
quality. Empirical Software Engineering, pages 1–44, 2015.

BIBLIOGRAPHY 89
[59] G Murphy and D Cubranic. Automatic bug triage using text categorization. In
Proceedings of the Sixteenth International Conference on Software Engineering
& Knowledge Engineering, 2004.
[60] Kevin P Murphy. Naive bayes classifiers. University of British Columbia, 2006.
[61] Peter Nemenyi. Distribution-free multiple comparisons. PhD thesis, Princeton
University, 1963.
[62] Anh Tuan Nguyen, Tung Thanh Nguyen, Tien N Nguyen, David Lo, and Cheng-
nian Sun. Duplicate bug report detection with a combination of information
retrieval and topic modeling. In Proceedings of the 27th IEEE/ACM Inter-
national Conference on Automated Software Engineering, pages 70–79. ACM,
2012.
[63] Anh Tuan Nguyen, Tung Thanh Nguyen, Tien N. Nguyen, David Lo, and
Chengnian Sun. Duplicate bug report detection with a combination of informa-
tion retrieval and topic modeling. In Proceedings of the 27th IEEE/ACM Inter-
national Conference on Automated Software Engineering (ASE), pages 70–79.
ACM, 2012.
[64] Haoran Niu, Iman Keivanloo, and Ying Zou. Learning to rank code examples
for code search engines. Empirical Software Engineering (EMSE), pages 1–33,
2016.
[65] Masao Ohira, Ahmed E Hassan, Naoya Osawa, and Ken-ichi Matsumoto. The
impact of bug management patterns on bug fixing: A case study of eclipse

BIBLIOGRAPHY 90
projects. In Software Maintenance (ICSM), 2012 28th IEEE International Con-
ference on, pages 264–273. IEEE, 2012.
[66] Kai Pan, Sunghun Kim, and E James Whitehead Jr. Toward an understanding
of bug fix patterns. Empirical Software Engineering, 14(3):286–315, 2009.
[67] Thorsten Pohlert. The pairwise multiple comparison of mean ranks package
(PMCMR). R package, 2014.
[68] Martin Ponweiser. Latent dirichlet allocation in r. 2012.
[69] David Martin Powers. Evaluation: from precision, recall and f-measure to roc,
informedness, markedness and correlation. 2011.
[70] Feng Qin, Joseph Tucek, and Yuanyuan Zhou. Treating bugs as allergies: A
safe method for surviving software failures. In HotOS, 2005.
[71] Foyzur Rahman and Premkumar Devanbu. How, and why, process metrics
are better. In Proceedings of the 2013 International Conference on Software
Engineering, pages 432–441. IEEE Press, 2013.
[72] Mohamed Sami Rakha, Weiyi Shang, and Ahmed E Hassan. Studying the
needed effort for identifying duplicate issues. Empirical Software Engineering,
pages 1–30, 2015.
[73] Irina Rish. An empirical study of the naive bayes classifier. In IJCAI 2001
workshop on empirical methods in artificial intelligence, volume 3, pages 41–46.
IBM New York, 2001.

BIBLIOGRAPHY 91
[74] Marko Robnik-Sikonja. Improving random forests. In European Conference on
Machine Learning, pages 359–370. Springer, 2004.
[75] Per Runeson, Magnus Alexandersson, and Oskar Nyholm. Detection of du-
plicate defect reports using natural language processing. In ICSE 2007: Pro-
ceedings of the 29th International Conference on Software Engineering, pages
499–510. IEEE Computer Society, 2007.
[76] Philipp Schugerl, Juergen Rilling, and Philippe Charland. Mining bug
repositories–a quality assessment. In Computational Intelligence for Modelling
Control & Automation, 2008 International Conference on, pages 1105–1110.
IEEE, 2008.
[77] David J Sheskin. Handbook of parametric and nonparametric statistical proce-
dures. crc Press, 2003.
[78] Jonathan Sillito, Gail C Murphy, and Kris De Volder. Questions programmers
ask during software evolution tasks. In Proceedings of the 14th ACM SIGSOFT
international symposium on Foundations of software engineering, pages 23–34.
ACM, 2006.
[79] Carolin Strobl, Anne-Laure Boulesteix, Thomas Kneib, Thomas Augustin, and
Achim Zeileis. Conditional variable importance for random forests. BMC bioin-
formatics, 9(1):1, 2008.
[80] Chengnian Sun, David Lo, Siau-Cheng Khoo, and Jing Jiang. Towards more ac-
curate retrieval of duplicate bug reports. In Proceedings of the 26th IEEE/ACM

BIBLIOGRAPHY 92
International Conference on Automated Software Engineering (ASE), pages
253–262. IEEE, 2011.
[81] Jian Sun. Why are bug reports invalid? In Proceedings of the 4th International
Conference on Software Testing, Verification and Validation (ICST), pages 407–
410. IEEE, 2011.
[82] Ashish Sureka and Pankaj Jalote. Detecting duplicate bug report using char-
acter n-gram-based features. In Proceedings of the 2010 Asia Pacific Software
Engineering Conference (APSEC), pages 366–374. IEEE, 2010.
[83] C. Tantithamthavorn, S. McIntosh, A. Hassan, and K. Matsumoto. An em-
pirical comparison of model validation techniques for defect prediction models.
Transactions on Software Engineering (TSE), PP(99):1–1, 2016.
[84] Chakkrit Tantithamthavorn, Shane McIntosh, Ahmed Hassan, and Kenichi
Matsumoto. An empirical comparison of model validation techniques for defect
prediction models. IEEE Transactions on Software Engineering, 2015.
[85] Gregory Tassey. The economic impacts of inadequate infrastructure for software
testing. National Institute of Standards and Technology, RTI Project, 7007(011),
2002.
[86] The Bugzilla team. The bugzilla guide. http://www.bugzilla.org/docs/,
2015 (accessed in Feb. 2016 and viable in Jul. 2016).
[87] Yuan Tian, Dinusha Wijedasa, David Lo, and Claire Le Gouesy. Learning
to rank for bug report assignee recommendation. In Program Comprehension
(ICPC), 2016 IEEE 24th International Conference on, pages 1–10. IEEE, 2016.

BIBLIOGRAPHY 93
[88] Pradeep K Venkatesh, Shaohua Wang, Feng Zhang, Ying Zou, and Ahmed E
Hassan. What concerns do client developers have when using web apis? an
empirical study of developer forums and stack overflow. 2016.
[89] Xiaoyin Wang, Lu Zhang, Tao Xie, John Anvik, and Jiasu Sun. An approach
to detecting duplicate bug reports using natural language and execution in-
formation. In Proceedings of the 30th International Conference on Software
Engineering (ICSE), pages 461–470. ACM, 2008.
[90] Cathrin Weiss, Rahul Premraj, Thomas Zimmermann, and Andreas Zeller. How
long will it take to fix this bug? In Proceedings of the Fourth International
Workshop on Mining Software Repositories, page 1. IEEE Computer Society,
2007.
[91] Wikipedia. Multicollinearity — wikipedia, the free encyclopedia, 2017. [Online;
accessed 6-February-2017].
[92] Jifeng Xuan, He Jiang, Yan Hu, Zhilei Ren, Weiqin Zou, Zhongxuan Luo, and
Xindong Wu. Towards effective bug triage with software data reduction tech-
niques. volume 27, pages 264–280. IEEE, 2015.
[93] Robert K Yin. Case study research: Design and methods. Sage publications,
2013.
[94] Ghazia Zaineb and Irfan Anjum Manarvi. Identification and analysis of causes
for software bug rejection with their impact over testing efficiency. International
Journal of Software Engineering & Applications, 2(4):71, 2011.
[95] Jerrold H Zar. Spearman rank correlation. Wiley Online Library, 1998.

BIBLIOGRAPHY 94
[96] Feng Zhang, Foutse Khomh, Ying Zou, and Ahmed E. Hassan. An empirical
study of the effect of file editing patterns on software quality. In Proceedings
of the 19th Working Conference on Reverse Engineering, WCRE ’12, pages
456–465, oct. 2012.
[97] Feng Zhang, Foutse Khomh, Ying Zou, and Ahmed E Hassan. An empirical
study on factors impacting bug fixing time. In Reverse Engineering (WCRE),
2012 19th Working Conference on, pages 225–234. IEEE, 2012.
[98] Feng Zhang, Quan Zheng, Ying Zou, and Ahmed E Hassan. Cross-project defect
prediction using a connectivity-based unsupervised classifier. In Proceedings
of the 38th International Conference on Software Engineering, pages 309–320.
ACM, 2016.
[99] Hongyu Zhang, Liang Gong, and Steve Versteeg. Predicting bug-fixing time:
an empirical study of commercial software projects. In Proceedings of the 2013
international conference on software engineering, pages 1042–1051. IEEE Press,
2013.
[100] Yu Zhao, Feng Zhang, Emad Shihab, Ying Zou, and Ahmed E Hassan. How are
discussions associated with bug reworking?: An empirical study on open source
projects. In Proceedings of the 10th ACM/IEEE International Symposium on
Empirical Software Engineering and Measurement, page 21. ACM, 2016.
[101] Jian Zhou and Hongyu Zhang. Learning to rank duplicate bug reports. In Pro-
ceedings of the 21st ACM international conference on Information and knowl-
edge management, pages 852–861. ACM, 2012.

BIBLIOGRAPHY 95
[102] Thomas Zimmermann, Rahul Premraj, Nicolas Bettenburg, Sascha Just,
Adrian Schroter, and Cathrin Weiss. What makes a good bug report? IEEE
Transactions on Software Engineering, 36(5):618–643, 2010.